Six Sigma Analysis of Daily Cycling Commute
77
Six Sigma Analysis of Daily Cycling Commute 2015 ASQ Lean and Six Sigma Conference March 3, 2015 Brandon Theiss, PE [email protected]
-
Upload
brandon-theiss-pe -
Category
Education
-
view
202 -
download
0
Transcript of Six Sigma Analysis of Daily Cycling Commute

Six Sigma Analysis of Daily Cycling Commute 2015 ASQ Lean and Six Sigma Conference
March 3, 2015
Brandon Theiss, [email protected]

Motivation
• Nationally the average one-way commuting distance is 12.6 miles with 0.6% commuting via bicycle
• In the Washington DC metro area, where the case study was performed, the average commuting time is 33.4 minutes with 3.1% of commuters riding a bicycle.

Goals For The Talk
1. Demonstrate that Six Sigma can be applied to non-traditional applications (i.e. physical training or commuting)
2. Show that Control Charts are particularly useful in analyzing commuting times
3. Illustrate a Multifactor regression model that considers departure time, wind speed, weather, day of the week and improvement in physical conditioning.
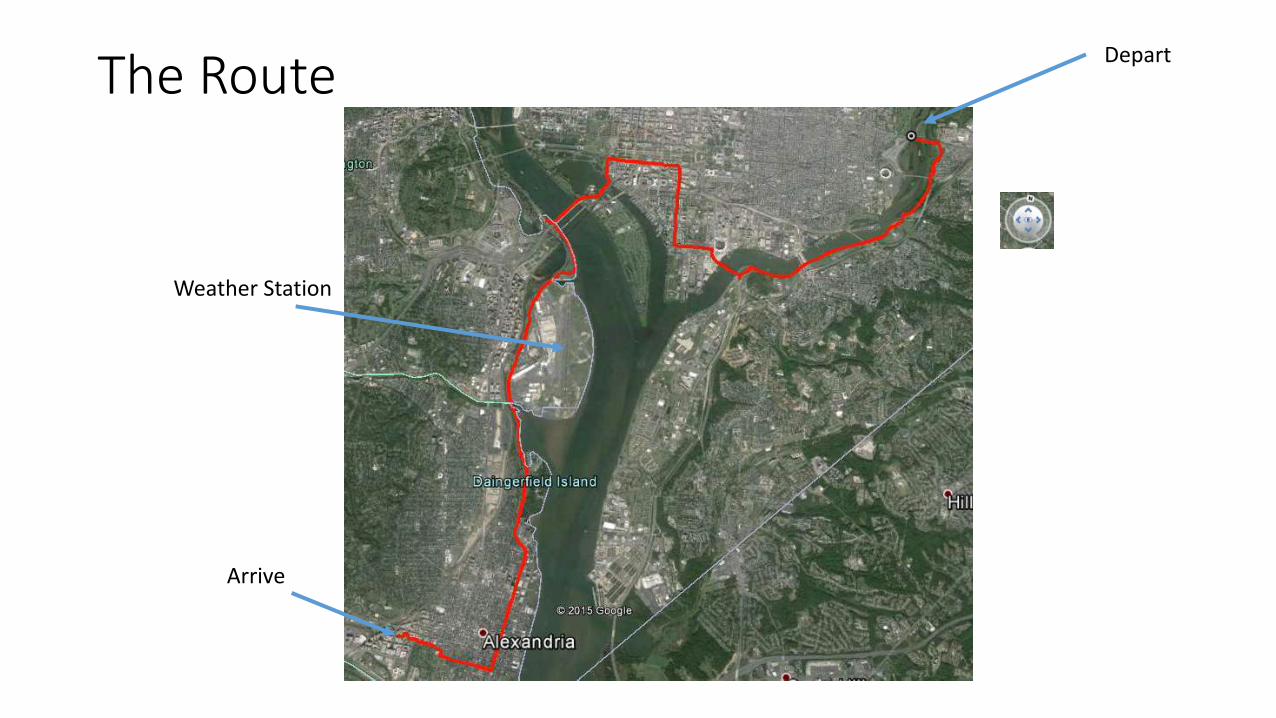
The RouteDepart
Arrive
Weather Station
The Data Collection
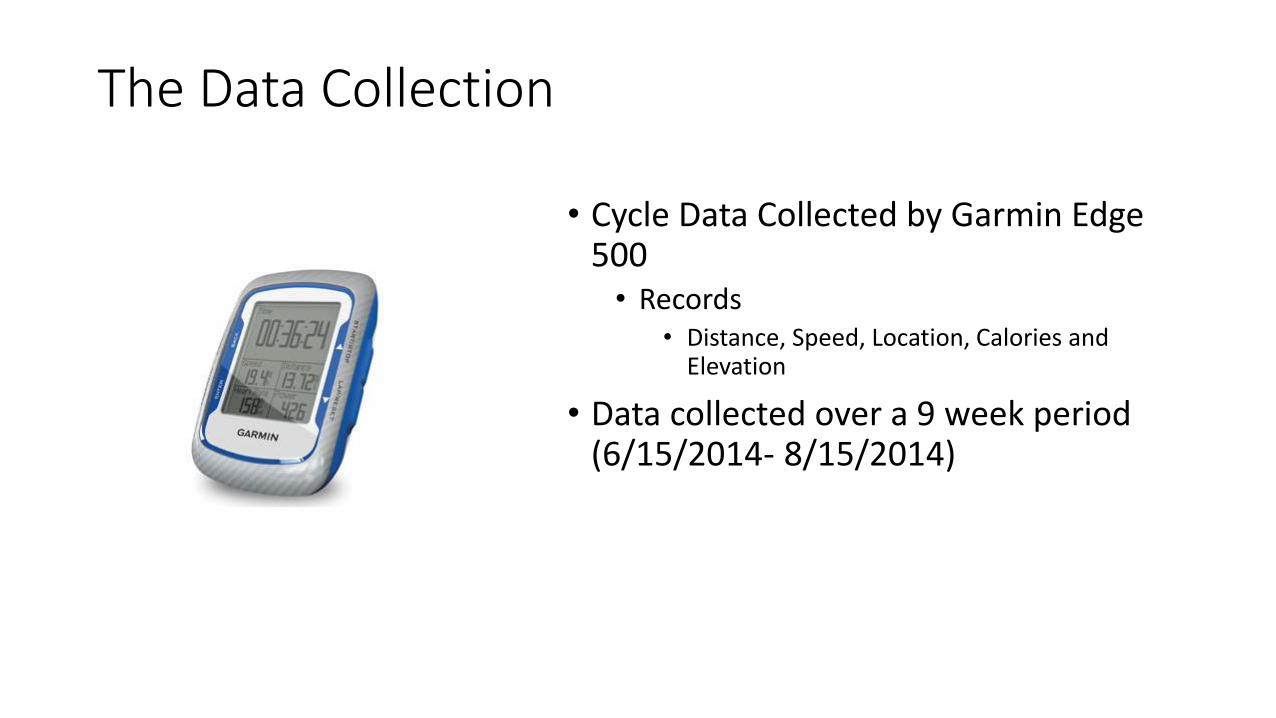
• Cycle Data Collected by Garmin Edge 500• Records
• Distance, Speed, Location, Calories and Elevation
• Data collected over a 9 week period (6/15/2014- 8/15/2014)

Weather StationData• Weather data by the
National Weather Service at the weather station at Reagan National Airport

Weather Data

312825221 91 61 31 0741
84
78
72
66
60
Observation
Ind
ivid
ua
l Va
lue
_X=74.00
UCL=83.61
LCL=64.38
312825221 91 61 31 0741
1 2
9
6
3
0
Observation
Mo
vin
g R
an
ge
__MR=3.62
UCL=11.81
LCL=0
1
I-MR Chart of Temp °F
1 st Quartile 71 .350
Median 75.000
3rd Quartile 76.450
Maximum 82.000
72.51 1 75.483
73.000 75.900
3.370 5.543
A-Squared 0.68
P-Value 0.069
Mean 73.997
StDev 4.191
Variance 17.560
Skewness -1 .04088
Kurtosis 2.75658
N 33
Minimum 60.100
Anderson-Darling Normality Test
95% Confidence Interval for Mean
95% Confidence Interval for Median
95% Confidence Interval for StDev
8075706560
Median
Mean
76757473
95% Confidence Intervals
Summary Report for Temp °F
Temperature (°F)

1 st Quartile 0.69000
Median 0.78000
3rd Quartile 0.80000
Maximum 0.84000
0.71922 0.77593
0.73000 0.79000
0.06430 0.10577
A-Squared 1 .55
P-Value <0.005
Mean 0.74758
StDev 0.07996
Variance 0.00639
Skewness -0.865595
Kurtosis -0.453918
N 33
Minimum 0.58000
Anderson-Darling Normality Test
95% Confidence Interval for Mean
95% Confidence Interval for Median
95% Confidence Interval for StDev
84.00%78.00%72.00%66.00%60.00%
Median
Mean
80.00%78.00%76.00%74.00%72.00%
95% Confidence Intervals
Summary Report for Humidity
312825221 91 61 31 0741
90.00%
80.00%
70.00%
60.00%
Observation
Ind
ivid
ua
l Va
lue
_X=74.76%
UCL=92.21%
LCL=57.30%
312825221 91 61 31 0741
20.00%
1 5.00%
1 0.00%
5.00%
0.00%
Observation
Mo
vin
g R
an
ge
__MR=6.56%
UCL=21.44%
LCL=0.00%
1
I-MR Chart of Humidity
Relative Humidity (%)

1 st Quartile 27.723
Median 30.853
3rd Quartile 32.695
Maximum 35.746
28.459 31 .388
28.514 32.419
3.322 5.464
A-Squared 0.77
P-Value 0.040
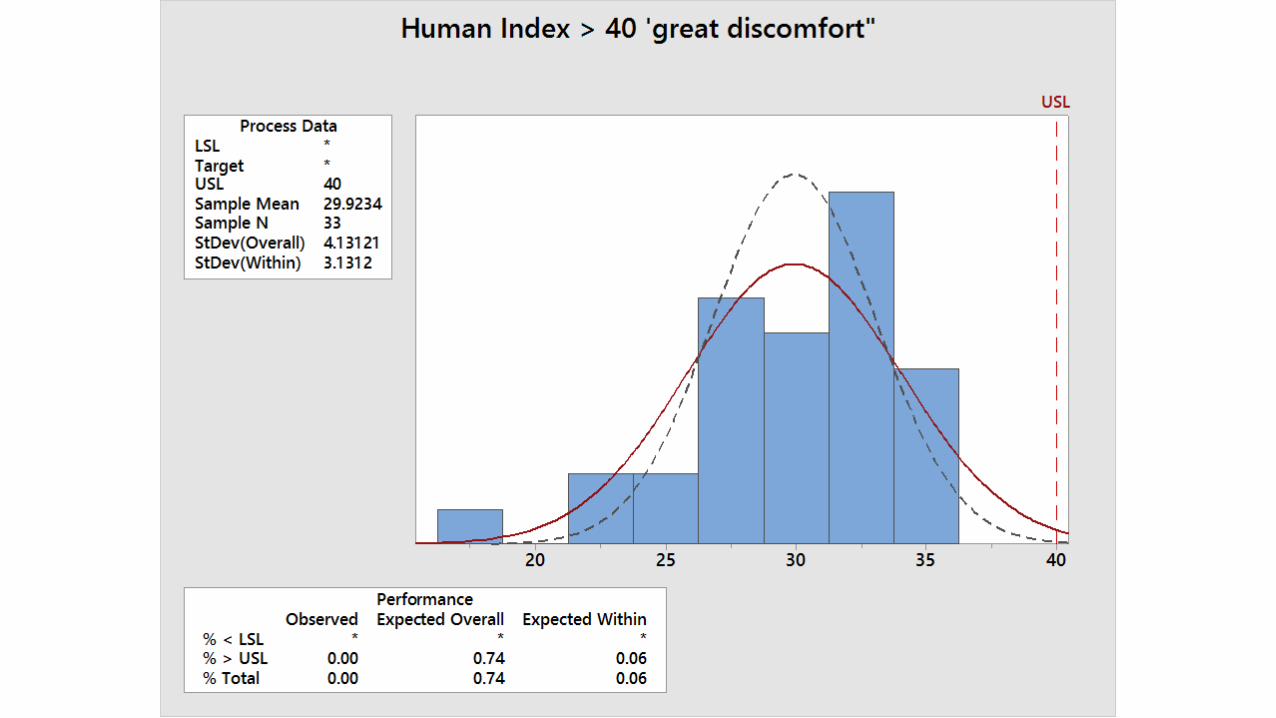
Mean 29.923
StDev 4.131
Variance 17.067
Skewness -1 .18627
Kurtosis 1 .78258
N 33
Minimum 17.181
Anderson-Darling Normality Test
95% Confidence Interval for Mean
95% Confidence Interval for Median
95% Confidence Interval for StDev
35302520
Median
Mean
333231302928
95% Confidence Intervals
Summary Report for Human Index
312825221 91 61 31 0741
40
35
30
25
20
Observation
Ind
ivid
ua
l Va
lue
_X=29.92
UCL=39.32
LCL=20.53
312825221 91 61 31 0741
1 0.0
7.5
5.0
2.5
0.0
Observation
Mo
vin
g R
an
ge
__MR=3.53
UCL=11.54
LCL=0
1
I-MR Chart of Human Index
Humidex

33
32
31
30
29
28
27
26
25
24
23
22
21
20
19
18
17
16
15
14
13
12
11
10987654321
1
0
Day
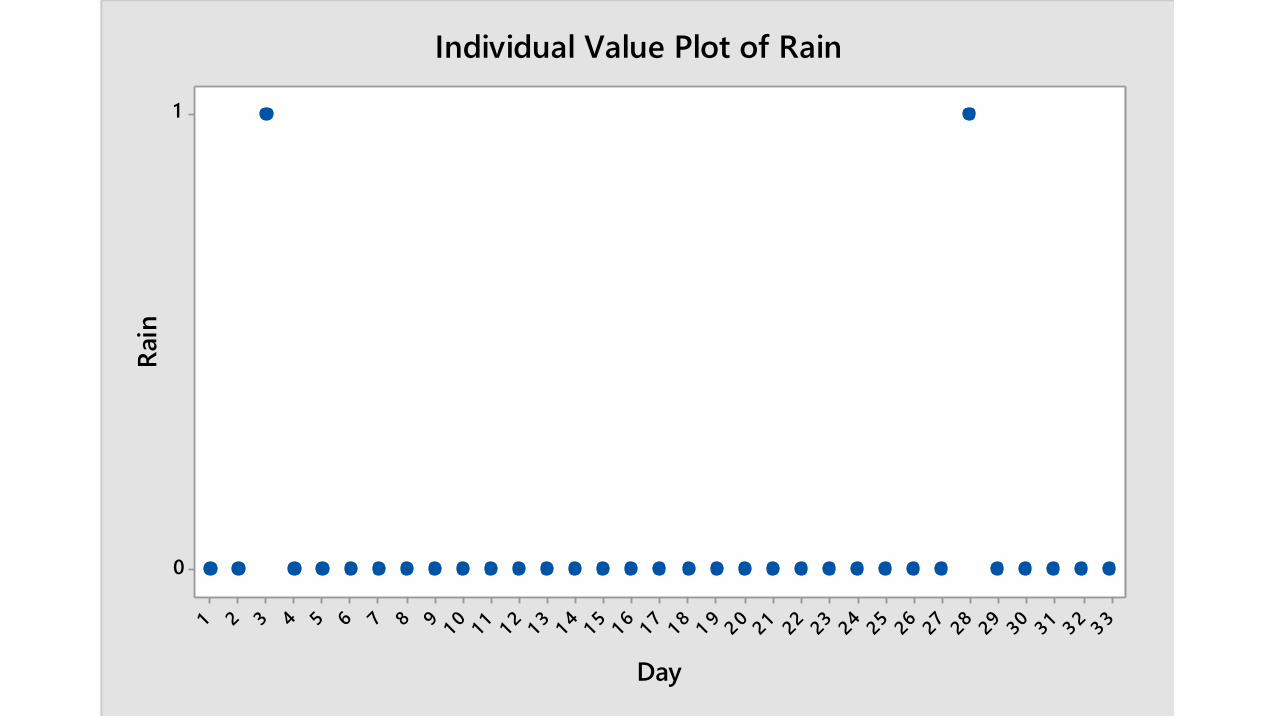
Rain
Individual Value Plot of Rain

33
32
31
30
29
28
27
26
25
24
23
22
21
20
19
18
17
16
15
14
13
12
11
10987654321
1 0
5
0
-5
-1 0
Day
Win
d
Head Wind (Positive) / Tail Wind (Negative)

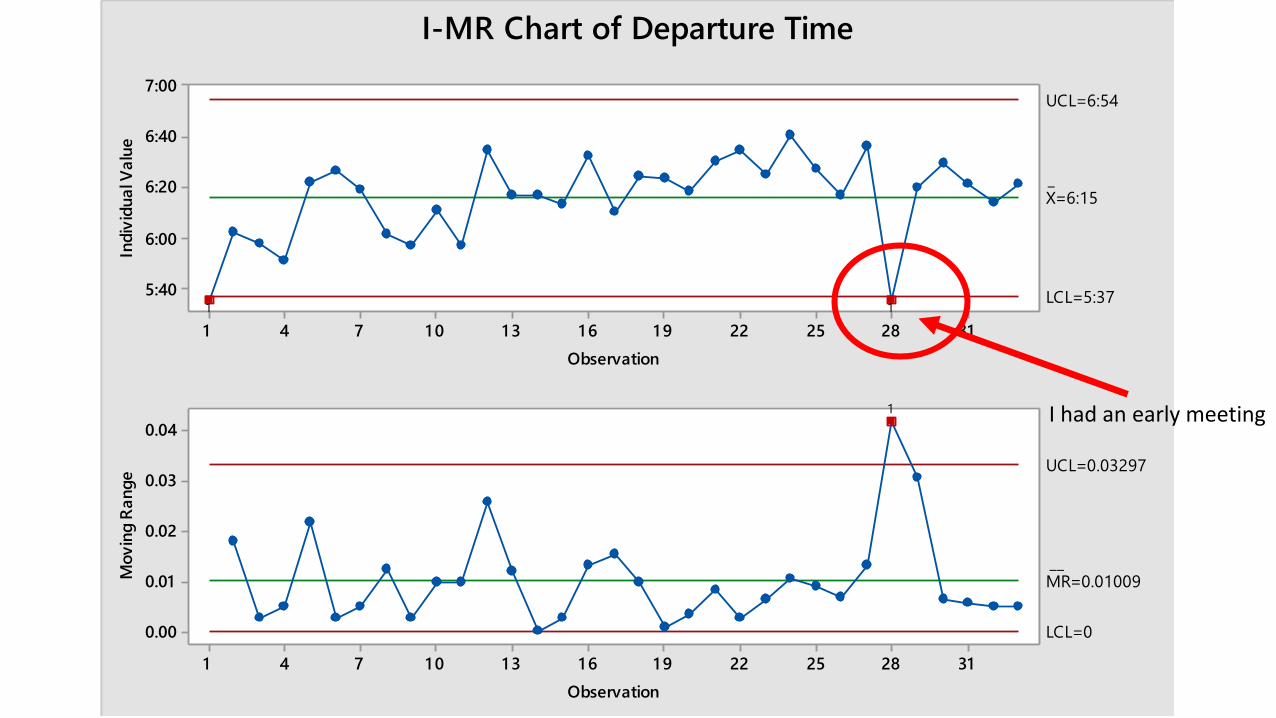
Departure Time
312825221 91 61 31 0741
7:00
6:40
6:20
6:00
5:40
Observation
Ind
ivid
ua
l Va
lue
_X=6:15
UCL=6:54
LCL=5:37
312825221 91 61 31 0741
0.04
0.03
0.02
0.01
0.00
Observation
Mo
vin
g R
an
ge
__MR=0.01009
UCL=0.03297
LCL=0
11
1
I-MR Chart of Departure Time
I had an early meeting

312825221 91 61 31 0741
50
25
0
-25
-50
Observation
Ind
ivid
ua
l Va
lue
_X=-0.7
UCL=37.9
LCL=-39.3
312825221 91 61 31 0741
60
45
30
1 5
0
Observation
Mo
vin
g R
an
ge
__MR=14.53
UCL=47.48
LCL=0
11
1
I-MR Chart of 6:15 Target

ThuWedTueMon
40
30
20
1 0
0
-1 0
-20
-30
DayofWeek
6:1
5 T
arg
et
0.875-1.22222-5
2.625
Boxplot of 6:15 Target

987654321
40
30
20
1 0
0
-1 0
-20
-30
Weeknum
6:1
5 T
arg
et
-2.5
-8.33333
1
-17.25
-3.75-4.75
5.25
-2
23.25
Boxplot of 6:15 Target

Cycling Data

Segment 0
Start
Finish
• Departure from Benning Rd Northeast
• Segment finished under Capital East
• Segment Distance 1.1 miles

1 st Quartile 5.4350
Median 5.9700
3rd Quartile 6.6550
Maximum 7.4800
5.4088 6.31 18
5.5498 6.3255
1 .0241 1 .6844
A-Squared 1 .25
P-Value <0.005
Mean 5.8603
StDev 1 .2735
Variance 1 .6217
Skewness -2.09994
Kurtosis 7.23867
N 33
Minimum 0.7800
Anderson-Darling Normality Test
95% Confidence Interval for Mean
95% Confidence Interval for Median
95% Confidence Interval for StDev
7654321
Median
Mean
6.46.26.05.85.65.4
95% Confidence Intervals
Summary Report for Stage 0 (1 .1 )


312825221 91 61 31 0741
8
6
4
2
0
Observation
Ind
ivid
ua
l Va
lue _
X=5.860
UCL=8.893
LCL=2.828
312825221 91 61 31 0741
4.8
3.6
2.4
1 .2
0.0
Observation
Mo
vin
g R
an
ge
__MR=1.140
UCL=3.726
LCL=0
1
11
I-MR Chart of Stage 0 (1 .1 )

GPS Did Not Always Start Recording Immediately
• Garmin Edge 500 did not get a GPS lock immediately.
• Consequently data collection started at different points

Segment 1 Start
Finish
• Segment Started at East Capital• Segment Finished at Nationals Park• Segment Distance 3.5 miles• Total Distance 4.6 miles
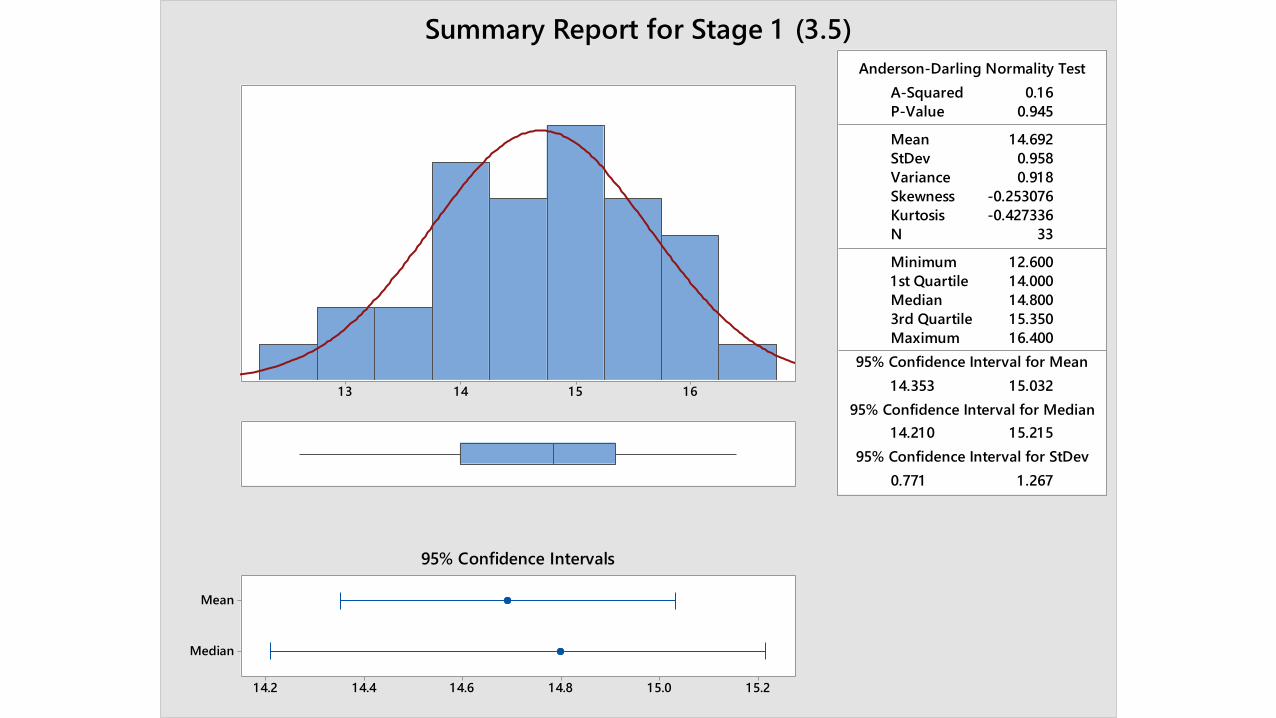
1 st Quartile 14.000
Median 14.800
3rd Quartile 15.350
Maximum 16.400
14.353 15.032
14.210 15.215
0.771 1 .267
A-Squared 0.16
P-Value 0.945
Mean 14.692
StDev 0.958
Variance 0.918
Skewness -0.253076
Kurtosis -0.427336
N 33
Minimum 12.600
Anderson-Darling Normality Test
95% Confidence Interval for Mean
95% Confidence Interval for Median
95% Confidence Interval for StDev
16151413
Median
Mean
15.215.014.814.614.414.2
95% Confidence Intervals
Summary Report for Stage 1 (3.5)


312825221 91 61 31 0741
1 7
1 6
1 5
1 4
1 3
Observation
Ind
ivid
ua
l Va
lue
_X=14.692
UCL=17.030
LCL=12.355
312825221 91 61 31 0741
3
2
1
0
Observation
Mo
vin
g R
an
ge
__MR=0.879
UCL=2.871
LCL=0
1
I-MR Chart of Stage 1 (3.5)

987654321
1 6.5
1 6.0
1 5.5
1 5.0
1 4.5
1 4.0
1 3.5
1 3.0
1 2.5
Weeknum
Sta
ge 1
(3
.5)
13.44
15.84
13.3825
14.3225
15.32
14.37
15.2
14.525
15.4925
Boxplot of Stage 1 (3.5)

One-way ANOVA: Stage 1 (3.5) versus Weeknum
Factor Information
Factor Levels Values
Weeknum 9 1, 2, 3, 4, 5, 6, 7, 8, 9
Analysis of Variance
Source DF Adj SS Adj MS F-Value P-Value
Weeknum 8 20.193 2.5242 6.59 0.000
Error 24 9.187 0.3828
Total 32 29.380
Was There A Significant Difference Between Weeks?


987654321
1 6
1 5
1 4
1 3
Week Number
Sa
mp
le M
ea
n
__X=14.692
UCL=16.051
LCL=13.334
987654321
3
2
1
0
Week Number
Sa
mp
le R
an
ge
_R=0.722
UCL=2.360
LCL=0
1
1
Xbar-R Chart of Stage 1 (3.5)
Tests performed with unequal sample sizes

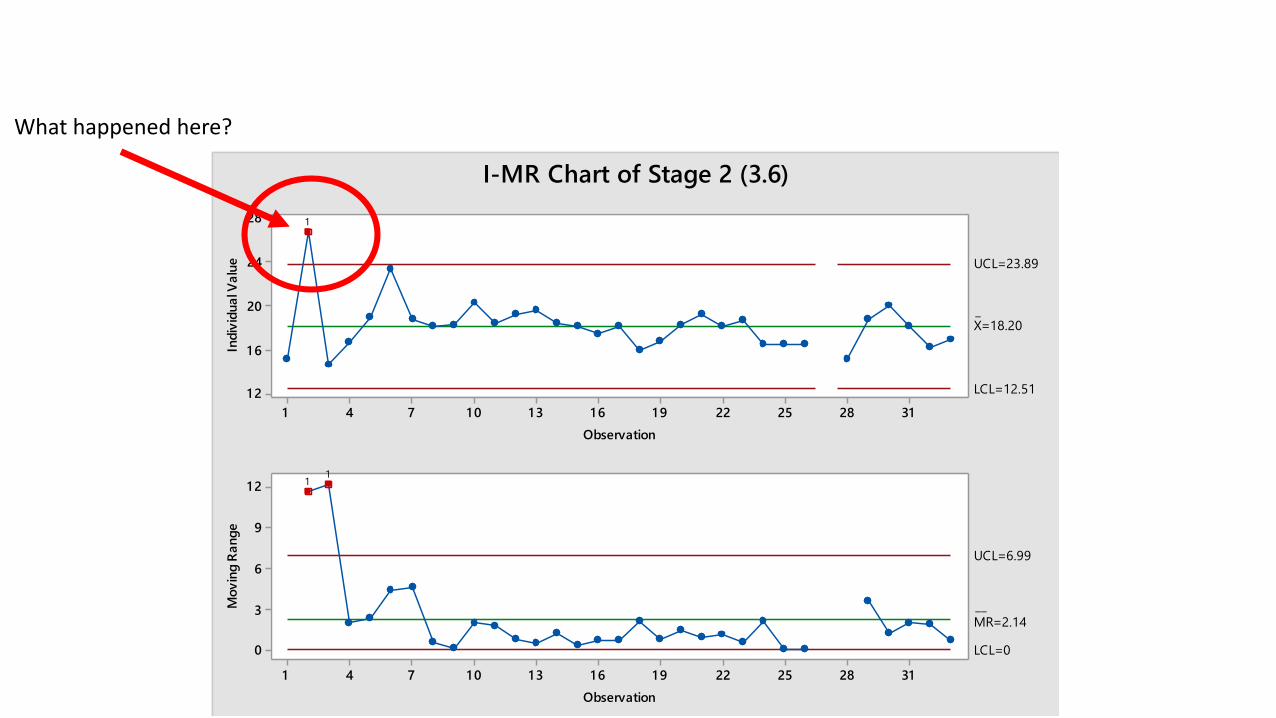
Segment 2
Start
Finish
• Segment Started at Nationals Park
• Segment Finished at entry onto Mount Vernon Trail
• Segment Distance 3.6 miles• Total Distance 8.2 miles

1 st Quartile 16.570
Median 18.155
3rd Quartile 18.927
Maximum 26.820
17.359 19.042
16.950 18.650
1 .871 3.103
A-Squared 1 .25
P-Value <0.005
Mean 18.200
StDev 2.334
Variance 5.448
Skewness 1 .77507
Kurtosis 5.47402
N 32
Minimum 14.650
Anderson-Darling Normality Test
95% Confidence Interval for Mean
95% Confidence Interval for Median
95% Confidence Interval for StDev
2724211815
Median
Mean
19.018.518.017.517.0
95% Confidence Intervals
Summary Report for Stage 2 (3.6)
312825221 91 61 31 0741
28
24
20
1 6
1 2
Observation
Ind
ivid
ua
l Va
lue
_X=18.20
UCL=23.89
LCL=12.51
312825221 91 61 31 0741
1 2
9
6
3
0
Observation
Mo
vin
g R
an
ge
__
MR=2.14
UCL=6.99
LCL=0
1
11
I-MR Chart of Stage 2 (3.6)
What happened here?

I Tried A Different Route!Correct Route
Route Taken

312825221 91 61 31 0741
27
24
21
1 8
1 5
Observation
Ind
ivid
ua
l Va
lue
_X=17.92
UCL=21.76
LCL=14.08
312825221 91 61 31 0741
1 2
9
6
3
0
Observation
Mo
vin
g R
an
ge
__MR=1.44
UCL=4.72
LCL=0
1
1
11
I-MR Chart of Stage 2 (3.6)What happened here?
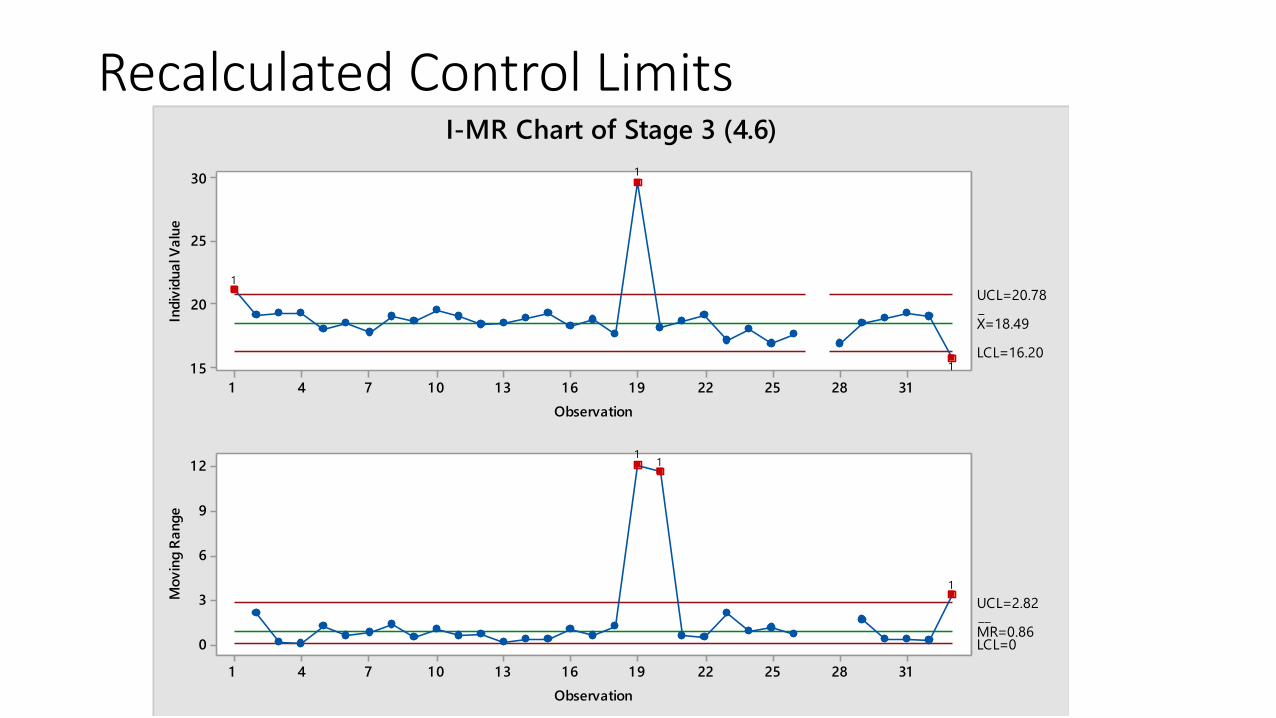
Recalculated Control Limits

I Made a Wrong Turn!
Wrong Turn

312825221 91 61 31 0741
27
24
21
1 8
1 5
Observation
Ind
ivid
ua
l Va
lue
_
X=17.74
UCL=20.96
LCL=14.52
312825221 91 61 31 0741
1 2
9
6
3
0
Observation
Mo
vin
g R
an
ge
__MR=1.21
UCL=3.96
LCL=0
1
1
11
11
I-MR Chart of Stage 2 (3.6)
Got a Flat took Metro
Again Recalculated Control Limits

Segment 3• Segment Started at entry
onto Mount Vernon Trail• Segment Finished at entry
onto streets of Alexandria• Segment Distance 4.6 miles• Total Distance 12.8 miles
Start
Finish

1 st Quartile 17.982
Median 18.650
3rd Quartile 19.172
Maximum 29.700
18.040 19.640
18.270 19.030
1 .780 2.951
A-Squared 3.71
P-Value <0.005
Mean 18.840
StDev 2.220
Variance 4.927
Skewness 3.891 1
Kurtosis 19.4030
N 32
Minimum 15.700
Anderson-Darling Normality Test
95% Confidence Interval for Mean
95% Confidence Interval for Median
95% Confidence Interval for StDev
2824201 6
Median
Mean
1 9.5019.2519.0018.7518.5018.2518.00
95% Confidence Intervals
Summary Report for Stage 3 (4.6)

312825221 91 61 31 0741
30
25
20
1 5
Observation
Ind
ivid
ua
l Va
lue
_
X=18.84
UCL=23.08
LCL=14.60
312825221 91 61 31 0741
1 2
9
6
3
0
Observation
Mo
vin
g R
an
ge
__MR=1.59
UCL=5.20
LCL=0
1
11
I-MR Chart of Stage 3 (4.6)
Changed a flat tire
312825221 91 61 31 0741
30
25
20
1 5
Observation
Ind
ivid
ua
l Va
lue
_X=18.49
UCL=20.78
LCL=16.20
312825221 91 61 31 0741
1 2
9
6
3
0
Observation
Mo
vin
g R
an
ge
__MR=0.86
UCL=2.82
LCL=0
1
1
1
1
11
I-MR Chart of Stage 3 (4.6)
Recalculated Control Limits

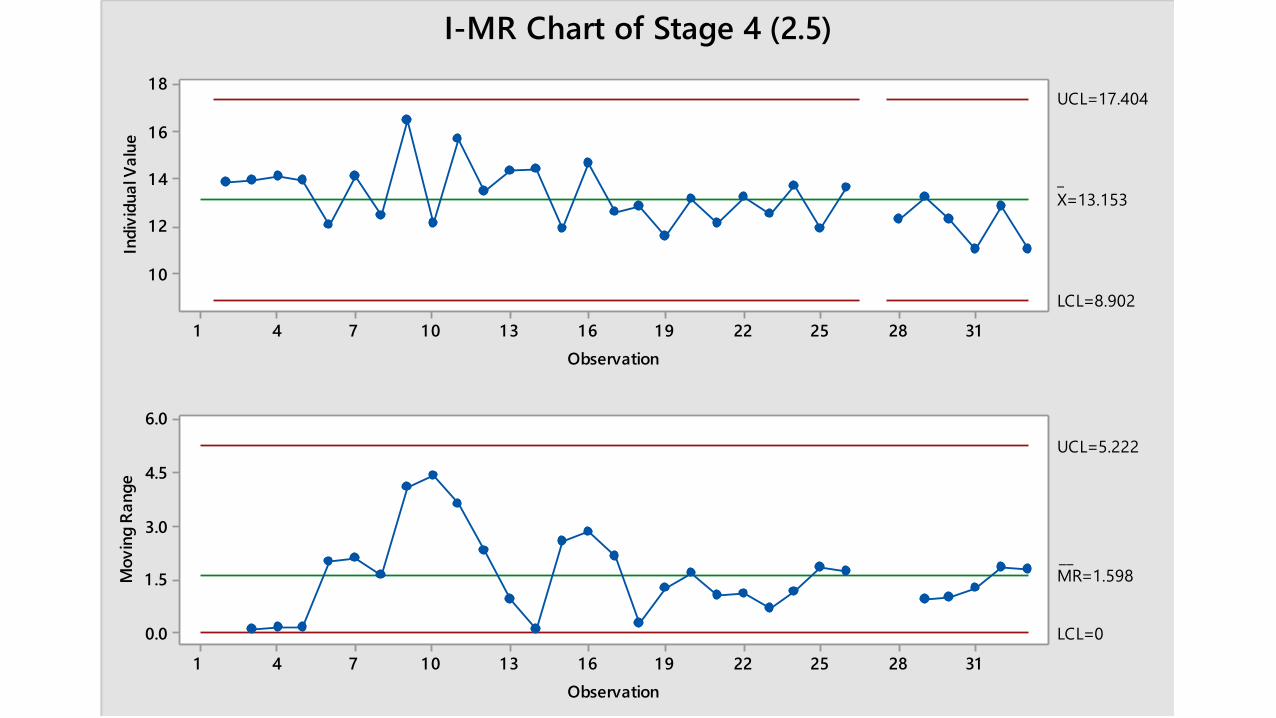
Segment 4• Segment Started at entry
onto streets of Alexandria• Segment finished at US
Patent and Trademark Office
• Segment Distance 2.5 miles• Total Distance 15.3 miles
Start
Finish

1 st Quartile 12.150
Median 13.200
3rd Quartile 13.980
Maximum 16.530
12.684 13.622
12.415 13.772
1 .022 1 .709
A-Squared 0.29
P-Value 0.603
Mean 13.153
StDev 1 .279
Variance 1 .635
Skewness 0.572571
Kurtosis 0.415937
N 31
Minimum 11 .000
Anderson-Darling Normality Test
95% Confidence Interval for Mean
95% Confidence Interval for Median
95% Confidence Interval for StDev
16151413121 1
Median
Mean
13.7513.5013.251 3.0012.751 2.50
95% Confidence Intervals
Summary Report for Stage 4 (2.5)
312825221 91 61 31 0741
1 8
1 6
1 4
1 2
1 0
Observation
Ind
ivid
ua
l Va
lue
_
X=13.153
UCL=17.404
LCL=8.902
312825221 91 61 31 0741
6.0
4.5
3.0
1 .5
0.0
Observation
Mo
vin
g R
an
ge
__MR=1.598
UCL=5.222
LCL=0
I-MR Chart of Stage 4 (2.5)

Segments 1-4• Segment Started at East
Capital • Segment finished at US
Patent and Trademark Office
• Segment Distance 14.2 miles
• Removes GPS Initialization Problem
Finish
Start

1 st Quartile 62.650
Median 64.930
3rd Quartile 66.600
Maximum 75.470
63.445 66.335
63.952 66.240
3.147 5.264
A-Squared 0.65
P-Value 0.084
Mean 64.890
StDev 3.939
Variance 15.512
Skewness 0.30820
Kurtosis 1 .63438
N 31
Minimum 56.580
Anderson-Darling Normality Test
95% Confidence Interval for Mean
95% Confidence Interval for Median
95% Confidence Interval for StDev
75706560
Median
Mean
66.566.065.565.064.564.063.5
95% Confidence Intervals
Summary Report for Stage 1 -4

312825221 91 61 31 0741
75
70
65
60
55
Observation
Ind
ivid
ua
l Va
lue
_
X=64.89
UCL=72.75
LCL=57.03
312825221 91 61 31 0741
1 2
9
6
3
0
Observation
Mo
vin
g R
an
ge
__MR=2.95
UCL=9.65
LCL=0
11
1
1
11
I-MR Chart of Stage 1 -4
Different Route Changed Flat

312825221 91 61 31 0741
75
70
65
60
55
Observation
Ind
ivid
ua
l Va
lue
_
X=64.23
UCL=69.72
LCL=58.74
312825221 91 61 31 0741
1 2
9
6
3
0
Observation
Mo
vin
g R
an
ge
__MR=2.06
UCL=6.74
LCL=0
11
1
1
1
1
1
11
I-MR Chart of Stage 1 -4

One-way ANOVA: Stage 1-4 versus Weeknum
Factor Levels Values
Weeknum 9 1, 2, 3, 4, 5, 6, 7, 8, 9
Analysis of Variance
Source DF Adj SS Adj MS F-Value P-Value
Weeknum 8 243.1 30.39 3.01 0.019
Error 22 222.3 10.10
Total 30 465.4
Was There A Statistically Significant Difference Between Weeks?

987654321
75
70
65
60
55
Weeknum
Sta
ge 1
-4
59.32
65.85
59.0133
63.6
66.2465.3875
67.605
65.8625
67.86
Boxplot of Stage 1 -4

987654321
70.0
67.5
65.0
62.5
60.0
Sample
Sa
mp
le M
ea
n
__X=64.89
UCL=70.92
LCL=58.86
987654321
1 5
1 0
5
0
Sample
Sa
mp
le R
an
ge
_R=3.20
UCL=10.47
LCL=0
1
Xbar-R Chart of Stage 1 -4
Tests performed with unequal sample sizes
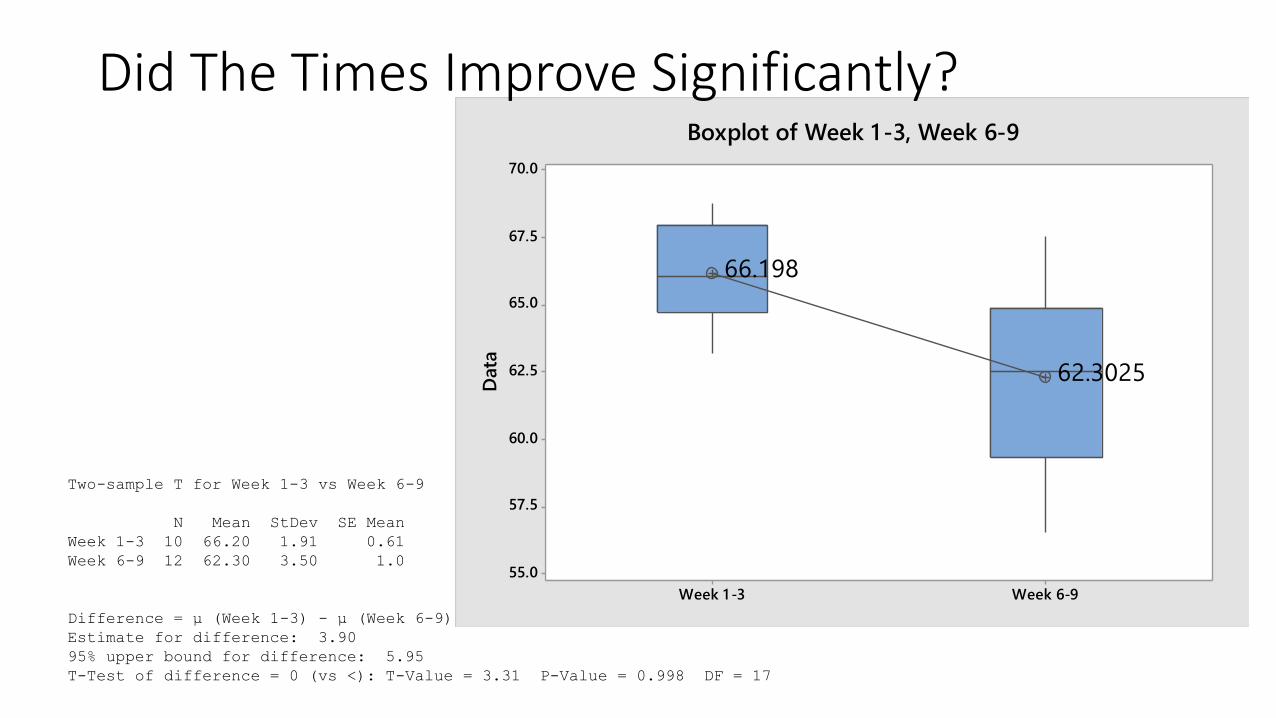
Week 6-9Week 1 -3
70.0
67.5
65.0
62.5
60.0
57.5
55.0
Data
66.198
62.3025
Boxplot of Week 1 -3, Week 6-9
Two-sample T for Week 1-3 vs Week 6-9
N Mean StDev SE Mean
Week 1-3 10 66.20 1.91 0.61
Week 6-9 12 62.30 3.50 1.0
Difference = μ (Week 1-3) - μ (Week 6-9)
Estimate for difference: 3.90
95% upper bound for difference: 5.95
T-Test of difference = 0 (vs <): T-Value = 3.31 P-Value = 0.998 DF = 17
Did The Times Improve Significantly?

RegressionTravel Time as a Function of Weather Conditions
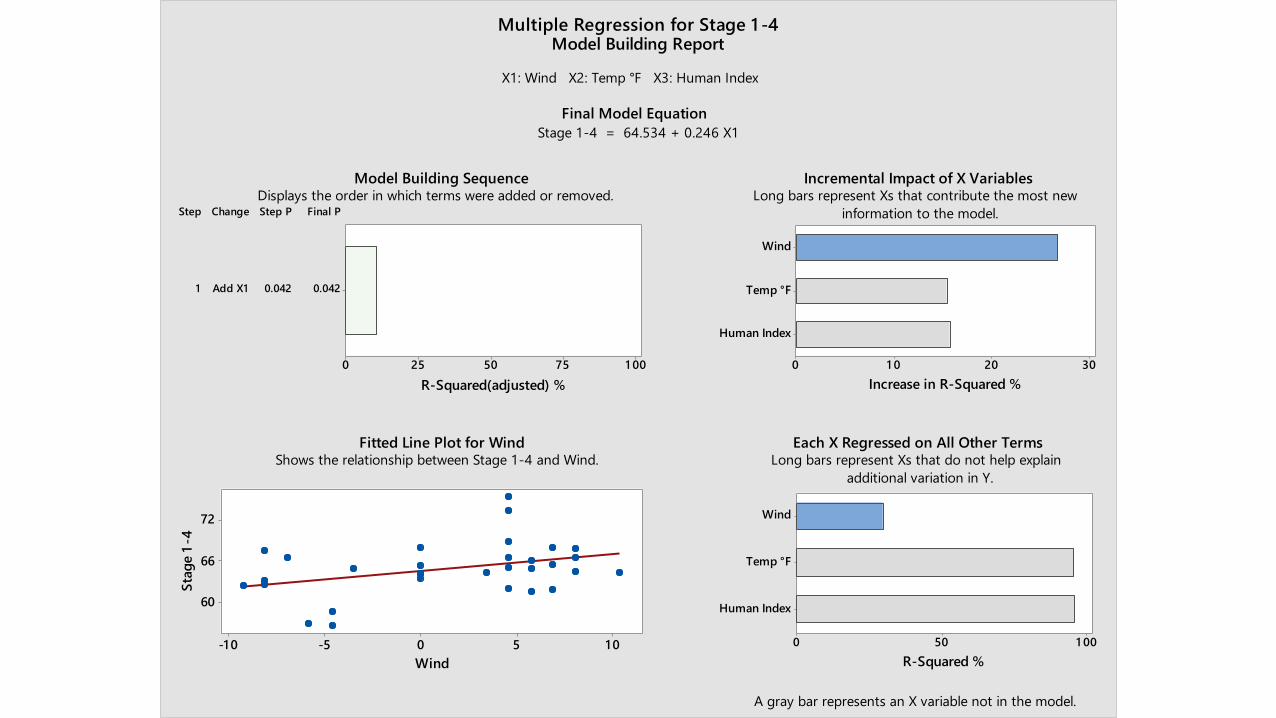
Stage 1-4 = 64.534 + 0.246 X1
Step Change Step P Final P
1 Add X1 0.042 0.042
1 007550250
R-Squared(adjusted) %
Human Index
Temp °F
Wind
30201 00
Increase in R-Squared %
1050-5-10
72
66
60
Wind
Sta
ge 1
-4
Human Index
Temp °F
Wind
1 00500
R-Squared %
X1: Wind X2: Temp °F X3: Human Index
Final Model Equation
Model Building SequenceDisplays the order in which terms were added or removed.
Incremental Impact of X VariablesLong bars represent Xs that contribute the most new
information to the model.
Fitted Line Plot for WindShows the relationship between Stage 1-4 and Wind.
Each X Regressed on All Other TermsLong bars represent Xs that do not help explain
additional variation in Y.
A gray bar represents an X variable not in the model.
Multiple Regression for Stage 1 -4Model Building Report


R-squared (adjusted) 10.49% 7.69%
P-value, model 0.042* 0.124
P-value, linear term 0.042* 0.045*
P-value, quadratic term — 0.729
Residual standard deviation 3.726 3.784
Statistics Linear
Selected Model
Quadratic
Alternative Model
1 050-5-1 0
75
70
65
60
55
Wind
Sta
ge 1
-4
Large residual
Y: Stage 1-4
X: Wind
Fitted Line Plot for Linear ModelY = 64.53 + 0.2455 X
* Statistically significant (p < 0.05)
Regression for Stage 1 -4 vs WindModel Selection Report
Different Route& Fix Flat

R-squared (adjusted) 10.16% 6.85%
P-value, model 0.051 0.152
P-value, linear term 0.051 0.057
P-value, quadratic term — 0.843
Residual standard deviation 2.930 2.983
Statistics Linear
Selected Model
Quadratic
Alternative Model
1 050-5-1 0
67.5
65.0
62.5
60.0
57.5
55.0
Wind
Sta
ge 1
-4_F
Large residual
Y: Stage 1-4_F
X: Wind
Fitted Line Plot for Linear ModelY = 64.00 + 0.1874 X
Regression for Stage 1 -4_F vs WindModel Selection Report

RegressionTravel Time as a Function of Non-Weather Factors


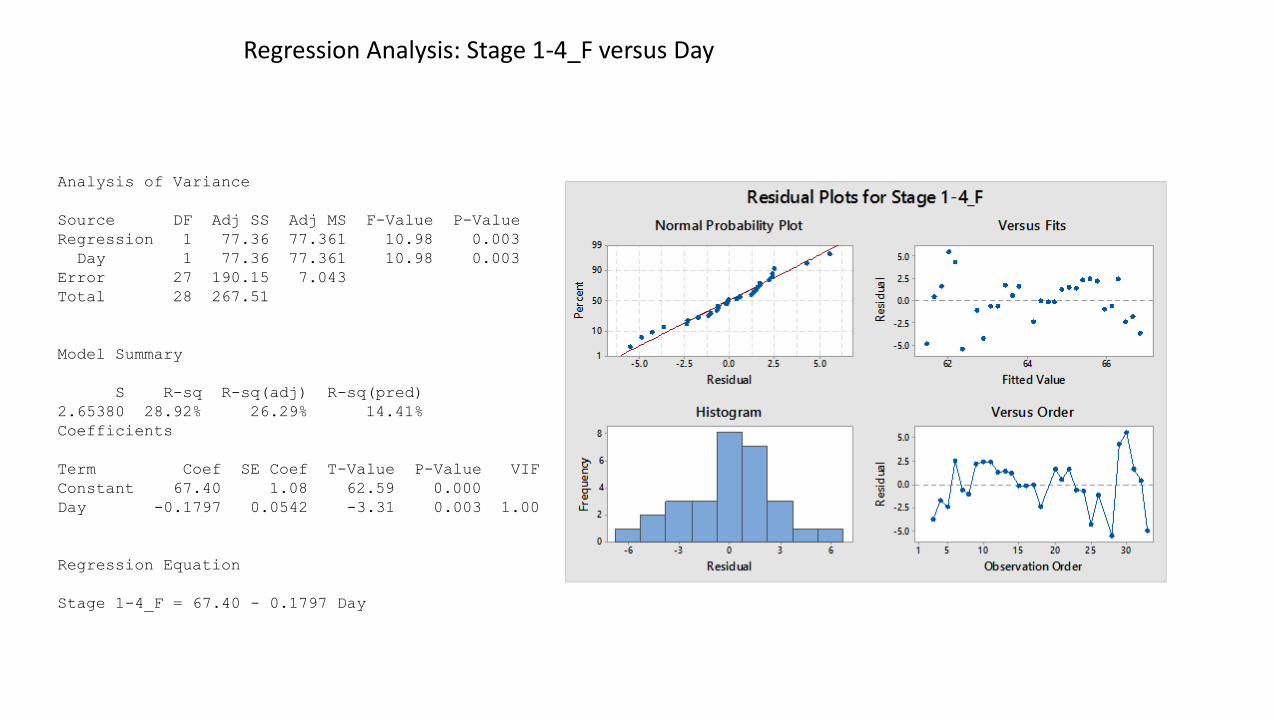
Regression Analysis: Stage 1-4_F versus Day
Analysis of Variance
Source DF Adj SS Adj MS F-Value P-Value
Regression 1 77.36 77.361 10.98 0.003
Day 1 77.36 77.361 10.98 0.003
Error 27 190.15 7.043
Total 28 267.51
Model Summary
S R-sq R-sq(adj) R-sq(pred)
2.65380 28.92% 26.29% 14.41%
Coefficients
Term Coef SE Coef T-Value P-Value VIF
Constant 67.40 1.08 62.59 0.000
Day -0.1797 0.0542 -3.31 0.003 1.00
Regression Equation
Stage 1-4_F = 67.40 - 0.1797 Day

RegressionTravel Time as a Function of Weather and Non Weather Factors


CostsAlternative Travel Methods

Taking the Metro

20 Miles Per Gallon$3.65 / Gallon15.4 miles per trip
=$2.81 per trip
+Parking$10/day
= $12.31
Driving

Caloric Energy Is Not Free!

1 st Quartile 598.00
Median 642.00
3rd Quartile 662.00
Maximum 724.00
614.39 648.64
607.68 656.00
37.31 62.41
A-Squared 0.27
P-Value 0.648
Mean 631 .52
StDev 46.69
Variance 2180.19
Skewness -0.072865
Kurtosis -0.507187
N 31
Minimum 544.00
Anderson-Darling Normality Test
95% Confidence Interval for Mean
95% Confidence Interval for Median
95% Confidence Interval for StDev
700650600550
Median
Mean
660650640630620610
95% Confidence Intervals
Summary Report for Calories

312825221 91 61 31 0741
800
700
600
500
Observation
Ind
ivid
ua
l Va
lue
_X=631.5
UCL=773.1
LCL=489.9
312825221 91 61 31 0741
200
1 50
1 00
50
0
Observation
Mo
vin
g R
an
ge
__
MR=53.2
UCL=174.0
LCL=0
I-MR Chart of Calories

Cost of Energy Needed for Cycling
• 760+710 =1470 kCal (Calories)
• $6.39+$5.99 = $12.38
• $12.38/ 1470 kCal = $ 0.0084218/ kCal
• 95% Confidence Interval of kCal per trip (614.39, 648.64) with mean631.52
• 95% Confidence Interval for the cost per trip ($5.17, $ 5.46) with mean $5.32

Comparison Of The Three Alternatives
• Cycling• One Way
• $5.32
• 1:10
• Round Trip• $10.64
• 2:20
• For 33 Days• $351.02
• 77 hours
• Driving• One Way
• $12.81
• 0:27
• Round trip• $15.62
• 0:54
• For 33 Days• $515.49
• 29.7 hours
• Metro• One Way
• $4.55
• 1:04
• Round Trip• $9.10
• 2:08
• For 33 Days• $300.30
• 70.4 hours

Questions?
Contact Information:
Brandon R. Theiss, PE
Rutgers School of Law- Camden