
Six Impossible Things Before Breakfast - Advisor … · Introduction In GMO’s 3Q Letter, ......
19
Six Impossible Things Before Breakfast March 27, 2017 by James Montier of GMO One of the great joys of working at GMO is the freedom to disagree. Indeed, many moons ago when Ben Inker first approached me about joining GMO, he told me that, having read my work, he believed we were very much philosophically aligned. Ben noted, however, that occasionally I would reach a remarkably different conclusion than he, and that was interesting because we obviously approached problems using a very similar framework. Over the years, Ben’s observation has consistently revealed that at times the most valuable information can be found in our differences, and not in the areas in which we all agree. As the late Richard Russell opined, “If everyone is thinking the same, then no one is thinking.” Or, as Alfred P. Sloan put it, “If we are all in agreement on the decision – then I propose we postpone further discussion of this matter until our next meeting to give ourselves time to develop disagreement and perhaps gain some understanding of what the decision is all about.” Indeed, one of my jobs internally is to ask difficult questions and take the other side of debates when I feel so inclined: a contrarian amongst contrarians. It turns out that I’ve pretty much been in training to be a stubborn, difficult pain in the arse my whole life! Introduction In GMO’s 3Q Letter, Ben wrote the following: But it is difficult to dismiss the possibility that this time actually is different. While all periods in which asset prices move well away from historical norms on valuations have a narrative that explains why the shift is rational and permanent, I would argue that this time is more different than most. Whether we are talking about 1989 in Japan, 2000 in the US, or 2007 globally, what bubbles generally have in common is that the narratives require the suspension of some fundamental rules of capitalism. They require either large permanent gaps between the cost of capital and return on capital, or some group of investors to voluntarily settle for far lower returns than they could get in other assets with similar or less risk. Today’s market has an internal consistency that those markets lacked. If there has been a permanent drop of discount rates of perhaps 1.5 percentage points, then market prices are generally close enough to fair value that you can explain away the discrepancies as business as usual. Introduction In GMO’s 3Q Letter, Ben wrote the following: But it is difficult to dismiss the possibility that this time actually is different. While all periods in which asset prices move well away from historical norms on valuations have a narrative that explains why the shift is rational and permanent, I would argue that this time is more different than Page 1, ©2018 Advisor Perspectives, Inc. All rights reserved.
Transcript of Six Impossible Things Before Breakfast - Advisor … · Introduction In GMO’s 3Q Letter, ......

Six Impossible Things Before BreakfastMarch 27, 2017
by James Montierof GMO
One of the great joys of working at GMO is the freedom to disagree. Indeed, many moons ago whenBen Inker first approached me about joining GMO, he told me that, having read my work, he believedwe were very much philosophically aligned. Ben noted, however, that occasionally I would reach aremarkably different conclusion than he, and that was interesting because we obviously approachedproblems using a very similar framework.
Over the years, Ben’s observation has consistently revealed that at times the most valuable informationcan be found in our differences, and not in the areas in which we all agree. As the late Richard Russellopined, “If everyone is thinking the same, then no one is thinking.” Or, as Alfred P. Sloan put it, “If weare all in agreement on the decision – then I propose we postpone further discussion of this matteruntil our next meeting to give ourselves time to develop disagreement and perhaps gain someunderstanding of what the decision is all about.” Indeed, one of my jobs internally is to ask difficultquestions and take the other side of debates when I feel so inclined: a contrarian amongst contrarians.It turns out that I’ve pretty much been in training to be a stubborn, difficult pain in the arse my wholelife! Introduction In GMO’s 3Q Letter, Ben wrote the following: But it is difficult to dismiss the possibilitythat this time actually is different. While all periods in which asset prices move well away fromhistorical norms on valuations have a narrative that explains why the shift is rational and permanent, Iwould argue that this time is more different than most. Whether we are talking about 1989 in Japan,2000 in the US, or 2007 globally, what bubbles generally have in common is that the narratives requirethe suspension of some fundamental rules of capitalism. They require either large permanent gapsbetween the cost of capital and return on capital, or some group of investors to voluntarily settle for farlower returns than they could get in other assets with similar or less risk. Today’s market has aninternal consistency that those markets lacked. If there has been a permanent drop of discount rates ofperhaps 1.5 percentage points, then market prices are generally close enough to fair value that youcan explain away the discrepancies as business as usual.
Introduction
In GMO’s 3Q Letter, Ben wrote the following:
But it is difficult to dismiss the possibility that this time actually is different. While all periods inwhich asset prices move well away from historical norms on valuations have a narrative thatexplains why the shift is rational and permanent, I would argue that this time is more different than
Page 1, ©2018 Advisor Perspectives, Inc. All rights reserved.
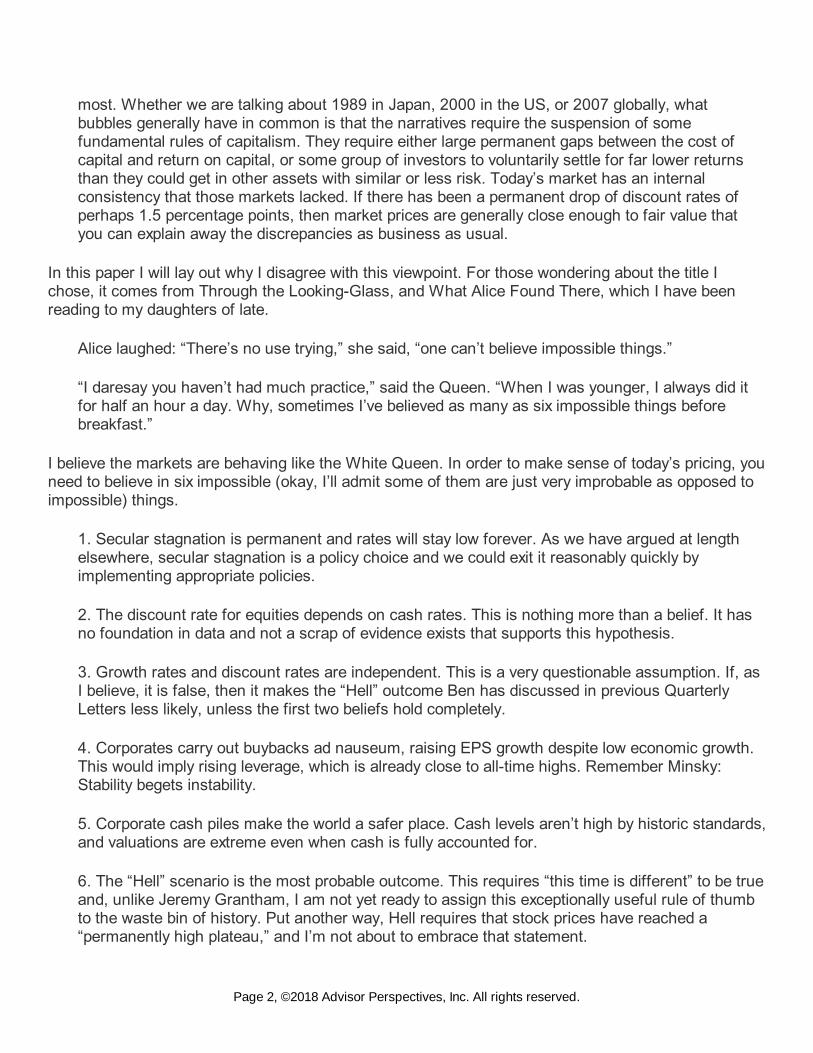
most. Whether we are talking about 1989 in Japan, 2000 in the US, or 2007 globally, whatbubbles generally have in common is that the narratives require the suspension of somefundamental rules of capitalism. They require either large permanent gaps between the cost ofcapital and return on capital, or some group of investors to voluntarily settle for far lower returnsthan they could get in other assets with similar or less risk. Today’s market has an internalconsistency that those markets lacked. If there has been a permanent drop of discount rates ofperhaps 1.5 percentage points, then market prices are generally close enough to fair value thatyou can explain away the discrepancies as business as usual.
In this paper I will lay out why I disagree with this viewpoint. For those wondering about the title Ichose, it comes from Through the Looking-Glass, and What Alice Found There, which I have beenreading to my daughters of late.
Alice laughed: “There’s no use trying,” she said, “one can’t believe impossible things.”
“I daresay you haven’t had much practice,” said the Queen. “When I was younger, I always did itfor half an hour a day. Why, sometimes I’ve believed as many as six impossible things beforebreakfast.”
I believe the markets are behaving like the White Queen. In order to make sense of today’s pricing, youneed to believe in six impossible (okay, I’ll admit some of them are just very improbable as opposed toimpossible) things.
1. Secular stagnation is permanent and rates will stay low forever. As we have argued at lengthelsewhere, secular stagnation is a policy choice and we could exit it reasonably quickly byimplementing appropriate policies.
2. The discount rate for equities depends on cash rates. This is nothing more than a belief. It hasno foundation in data and not a scrap of evidence exists that supports this hypothesis.
3. Growth rates and discount rates are independent. This is a very questionable assumption. If, asI believe, it is false, then it makes the “Hell” outcome Ben has discussed in previous QuarterlyLetters less likely, unless the first two beliefs hold completely.
4. Corporates carry out buybacks ad nauseum, raising EPS growth despite low economic growth.This would imply rising leverage, which is already close to all-time highs. Remember Minsky:Stability begets instability.
5. Corporate cash piles make the world a safer place. Cash levels aren’t high by historic standards,and valuations are extreme even when cash is fully accounted for.
6. The “Hell” scenario is the most probable outcome. This requires “this time is different” to be trueand, unlike Jeremy Grantham, I am not yet ready to assign this exceptionally useful rule of thumbto the waste bin of history. Put another way, Hell requires that stock prices have reached a“permanently high plateau,” and I’m not about to embrace that statement.
Page 2, ©2018 Advisor Perspectives, Inc. All rights reserved.

A world priced for secular stagnation forever
As Ben Graham wrote long ago, “The principles of common-stock investment may be closely likened tothe operations of insurance companies.” I would broaden his statement from “common-stock” to “all”investment. Market prices can be thought of as embodying a set of beliefs about the future. Thus, wecan cast investing as assessing the implied view of Mr. Market, and then work out where we disagreewith it. To this end I often suggest starting with understanding what the market is currently “pricing in.”
When I look around today, I see a world priced for secular stagnation (low growth, low inflation). Let’sstart, for example, with the government bond market. Exhibit 1 shows the average real rate implied byvarious 30-year government bonds depending upon the assumption one chooses to make regardingthe level of the term structure.
If one assumes that 30-year bonds should carry around 100 bps of term premium over cash (which isroughly what Japanese 30-year bonds have displayed since they reached zero cash rates), then bondsimply that the average real cash rate over the next 30 years will be somewhere between -50 bps and -250 bps depending upon the market chosen.
Now, perhaps you think 100 bps of term premium is too steep. I also ran the numbers assuming a zeroterm premium. The range of implied real rates shifts naturally but remains extraordinarily low by anystandards, ranging from a positive 50 bps to around -150 bps. In either case, it is safe to say that themajor government bond markets are priced for secular stagnation.
Exhibit 1: Implied Real Rates Over 30 Years
As of Jan 2017 Source: GMO
We can compare this to the limited data available on periods of financial repression (when interest
Page 3, ©2018 Advisor Perspectives, Inc. All rights reserved.
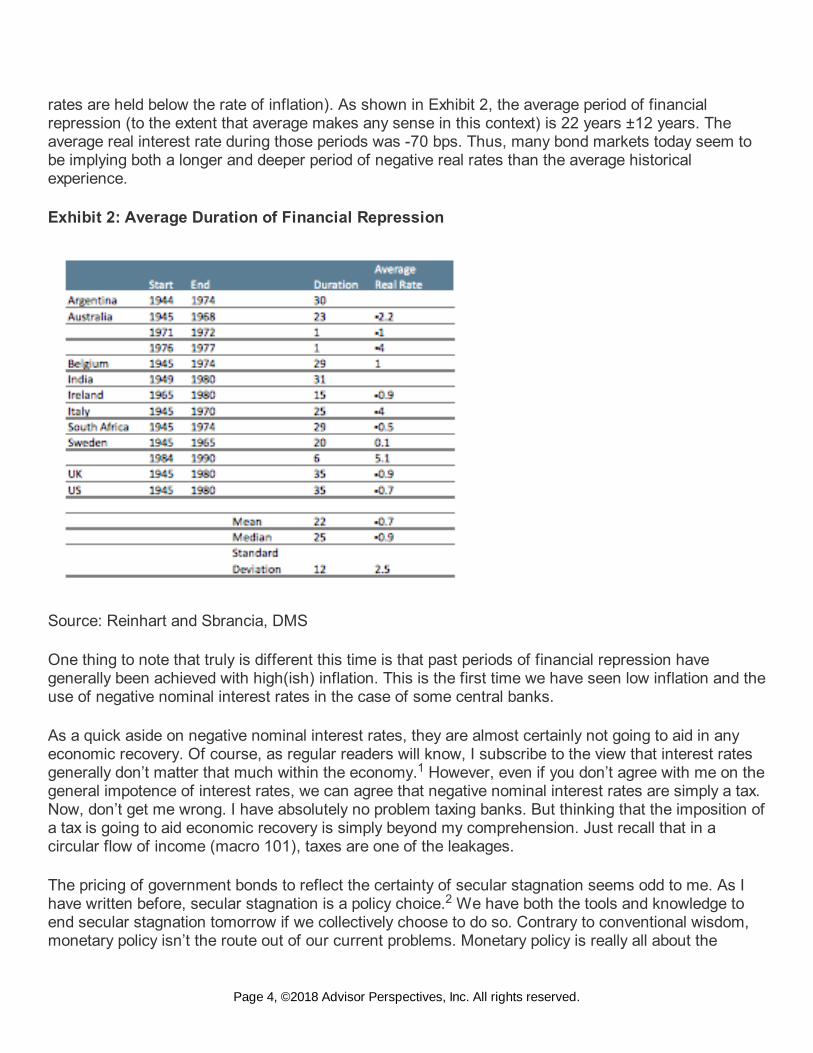
rates are held below the rate of inflation). As shown in Exhibit 2, the average period of financialrepression (to the extent that average makes any sense in this context) is 22 years ±12 years. Theaverage real interest rate during those periods was -70 bps. Thus, many bond markets today seem tobe implying both a longer and deeper period of negative real rates than the average historicalexperience.
Exhibit 2: Average Duration of Financial Repression
Source: Reinhart and Sbrancia, DMS
One thing to note that truly is different this time is that past periods of financial repression havegenerally been achieved with high(ish) inflation. This is the first time we have seen low inflation and theuse of negative nominal interest rates in the case of some central banks.
As a quick aside on negative nominal interest rates, they are almost certainly not going to aid in anyeconomic recovery. Of course, as regular readers will know, I subscribe to the view that interest ratesgenerally don’t matter that much within the economy. However, even if you don’t agree with me on thegeneral impotence of interest rates, we can agree that negative nominal interest rates are simply a tax.Now, don’t get me wrong. I have absolutely no problem taxing banks. But thinking that the imposition ofa tax is going to aid economic recovery is simply beyond my comprehension. Just recall that in acircular flow of income (macro 101), taxes are one of the leakages.
The pricing of government bonds to reflect the certainty of secular stagnation seems odd to me. As Ihave written before, secular stagnation is a policy choice. We have both the tools and knowledge toend secular stagnation tomorrow if we collectively choose to do so. Contrary to conventional wisdom,monetary policy isn’t the route out of our current problems. Monetary policy is really all about the
1
2
Page 4, ©2018 Advisor Perspectives, Inc. All rights reserved.

redistribution of net worth between creditors and debtors. If secular stagnation is really about lowgrowth and insufficient demand, then fiscal policy is the answer. Fiscal policy alters the level of anindividual’s net worth.
Of late, the concept of helicopter money has gained a certain degree of popularity. From myperspective, helicopter money is really just fiscal policy carried out by the central bank. It has the sameeffects as a fiscal expansion in that it raises the level of net worth for the private sector. So, shouldsuch a policy ever be tried, it is likely to be successful – although why one would want fiscal policy runby unelected technocrats is beyond me. However, the basic point here is that markets priced forsecular stagnation are putting a zero probability on fiscal policy being used as a route out of our currentmalaise.
If bond markets are smoking weed, then the stock market appears to be hooked on crack. Exhibit 3 is away of reverse engineering the equity markets’ beliefs about interest rates. It is based on a simpledividend discount model (DDM) that I first used to explore financial repression and its impact. Theidea is to show how long we would need to see -2% real interest rates, assuming a normal equity riskpremium, in order to justify today’s S&P 500 valuation as “fair.” A cursory glance at Exhibit 3 indicatesthat we would need to believe that real rates of -2% real for 90 more years would be necessary in orderto reach the conclusion that today’s market valuation is fair! This would be a 6-standard-deviationevent even in a world rife with financial repressions, and strikes me as another near impossible thingthat investors are embracing as a certainty.
Exhibit 3: Number of Years of -2% Real Rates To Justify S&P Valuation as Fair
As of Jan 2017 Source: GMO
Discount rates driven by cash rates?
The model I used to frame this analysis has two key assumptions, neither of which I find verypalatable. The first assumption is that the discount rate used for equities should be a function of the
3
4
Page 5, ©2018 Advisor Perspectives, Inc. All rights reserved.
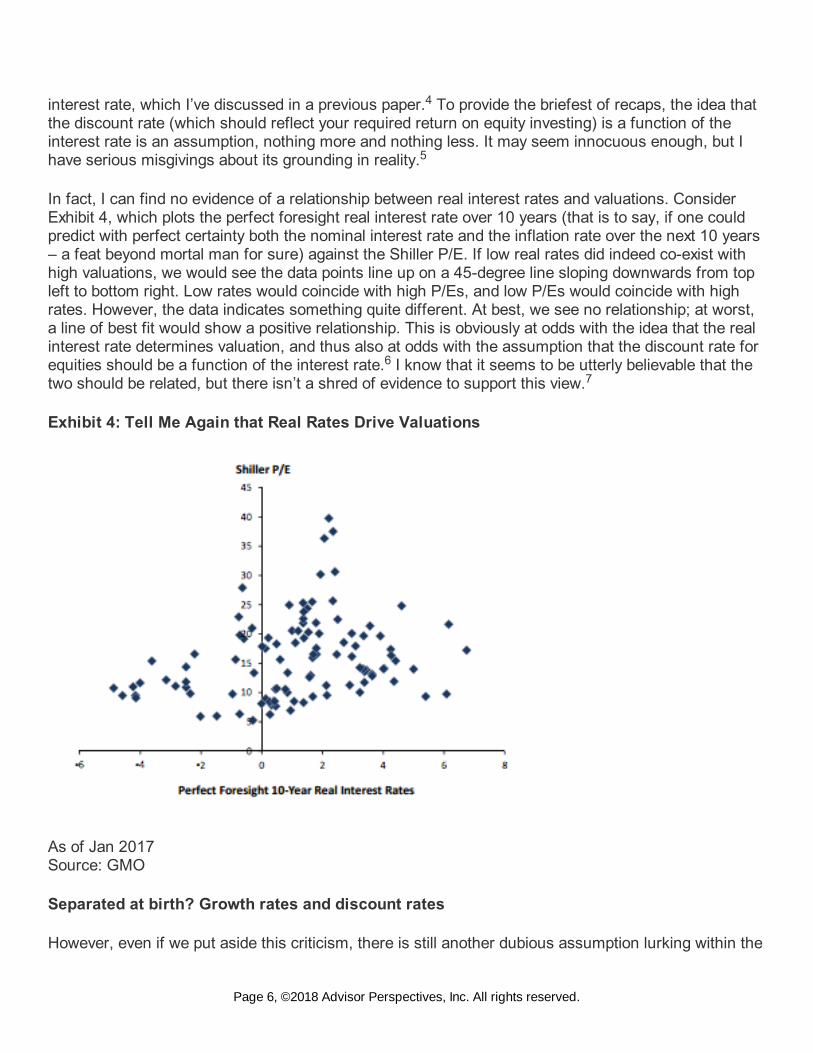
interest rate, which I’ve discussed in a previous paper. To provide the briefest of recaps, the idea thatthe discount rate (which should reflect your required return on equity investing) is a function of theinterest rate is an assumption, nothing more and nothing less. It may seem innocuous enough, but Ihave serious misgivings about its grounding in reality.
In fact, I can find no evidence of a relationship between real interest rates and valuations. ConsiderExhibit 4, which plots the perfect foresight real interest rate over 10 years (that is to say, if one couldpredict with perfect certainty both the nominal interest rate and the inflation rate over the next 10 years– a feat beyond mortal man for sure) against the Shiller P/E. If low real rates did indeed co-exist withhigh valuations, we would see the data points line up on a 45-degree line sloping downwards from topleft to bottom right. Low rates would coincide with high P/Es, and low P/Es would coincide with highrates. However, the data indicates something quite different. At best, we see no relationship; at worst,a line of best fit would show a positive relationship. This is obviously at odds with the idea that the realinterest rate determines valuation, and thus also at odds with the assumption that the discount rate forequities should be a function of the interest rate. I know that it seems to be utterly believable that thetwo should be related, but there isn’t a shred of evidence to support this view.
Exhibit 4: Tell Me Again that Real Rates Drive Valuations
As of Jan 2017Source: GMO
Separated at birth? Growth rates and discount rates
However, even if we put aside this criticism, there is still another dubious assumption lurking within the
4
5
67
Page 6, ©2018 Advisor Perspectives, Inc. All rights reserved.

original model, and one that I highlighted in my original piece. The model assumes that whilst thediscount rate is affected by secular stagnation/financial repression, cash flows are not.
Think about it in the context of the simplest DDM, the Gordon Growth Model, as presented in Exhibit 5.
Exhibit 5: The Gordon Growth Model
Source: GMO
In isolation, as the model assumes, lowering the discount rate raises the price of equities. However, ifone believes the discount rate is being driven by a lower interest rate, then one must ask why theinterest rate is low.
In essence, I can think of two reasons why the interest rate is low. The most compelling explanation tome is very simply that the central bank has chosen to set the base rate of interest low. Presumably thisis done in response to low inflation and/or low growth.
Alternatively, one could believe that the laughably named “natural rate of interest” has declined. I havedescribed the concept of a “natural rate of interest” as a will-’o-the-wisp. There is no evidence thatsuch an interest rate exists – it is purely an unobservable creation of economists, beloved by centralbankers.
One of the most recent, and asinine, contributions to the literature regarding the falling natural rate ofinterest comes from the Bank of England. Back in 2014, the analysts from the wonderfully, almostOrwellian, named Monetary Analysis Directorate wrote an excellent article for their Quarterly Bulletin,explaining how monetary creation worked in the modern economy, and the central bank’s role in theprocess via the setting of interest rates.
8
9
Page 7, ©2018 Advisor Perspectives, Inc. All rights reserved.
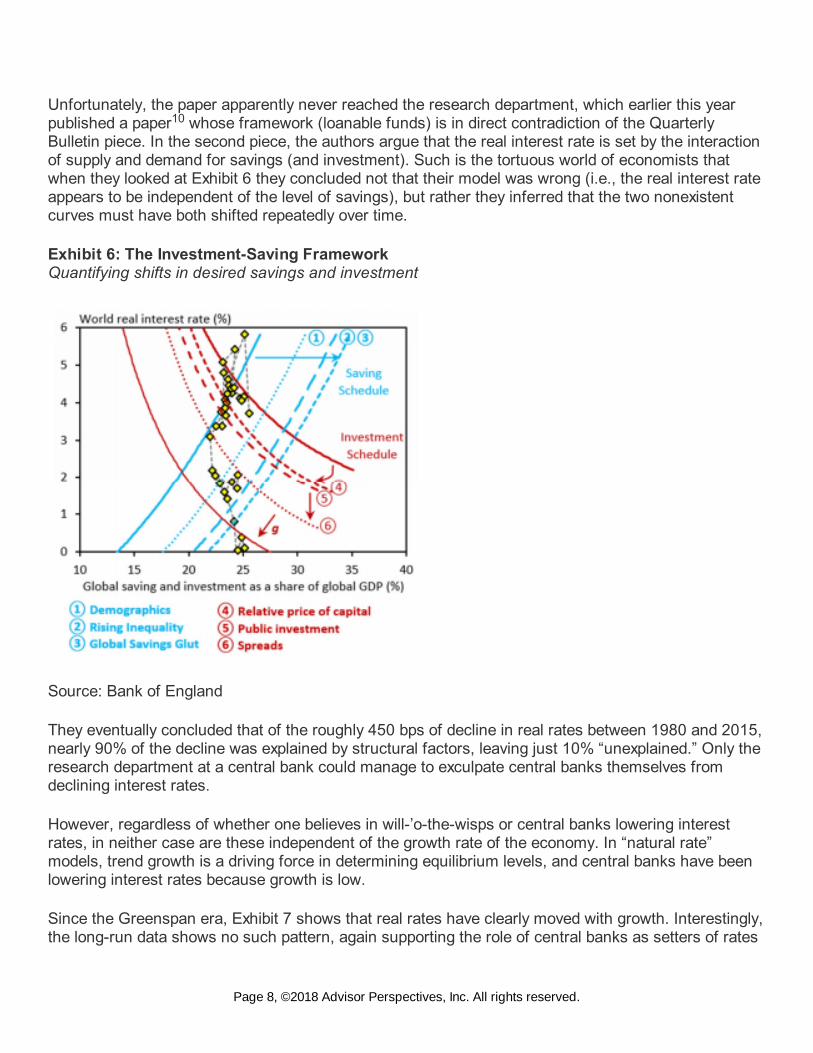
Unfortunately, the paper apparently never reached the research department, which earlier this yearpublished a paper whose framework (loanable funds) is in direct contradiction of the QuarterlyBulletin piece. In the second piece, the authors argue that the real interest rate is set by the interactionof supply and demand for savings (and investment). Such is the tortuous world of economists thatwhen they looked at Exhibit 6 they concluded not that their model was wrong (i.e., the real interest rateappears to be independent of the level of savings), but rather they inferred that the two nonexistentcurves must have both shifted repeatedly over time.
Exhibit 6: The Investment-Saving Framework Quantifying shifts in desired savings and investment
Source: Bank of England
They eventually concluded that of the roughly 450 bps of decline in real rates between 1980 and 2015,nearly 90% of the decline was explained by structural factors, leaving just 10% “unexplained.” Only theresearch department at a central bank could manage to exculpate central banks themselves fromdeclining interest rates.
However, regardless of whether one believes in will-’o-the-wisps or central banks lowering interestrates, in neither case are these independent of the growth rate of the economy. In “natural rate”models, trend growth is a driving force in determining equilibrium levels, and central banks have beenlowering interest rates because growth is low.
Since the Greenspan era, Exhibit 7 shows that real rates have clearly moved with growth. Interestingly,the long-run data shows no such pattern, again supporting the role of central banks as setters of rates
10
Page 8, ©2018 Advisor Perspectives, Inc. All rights reserved.
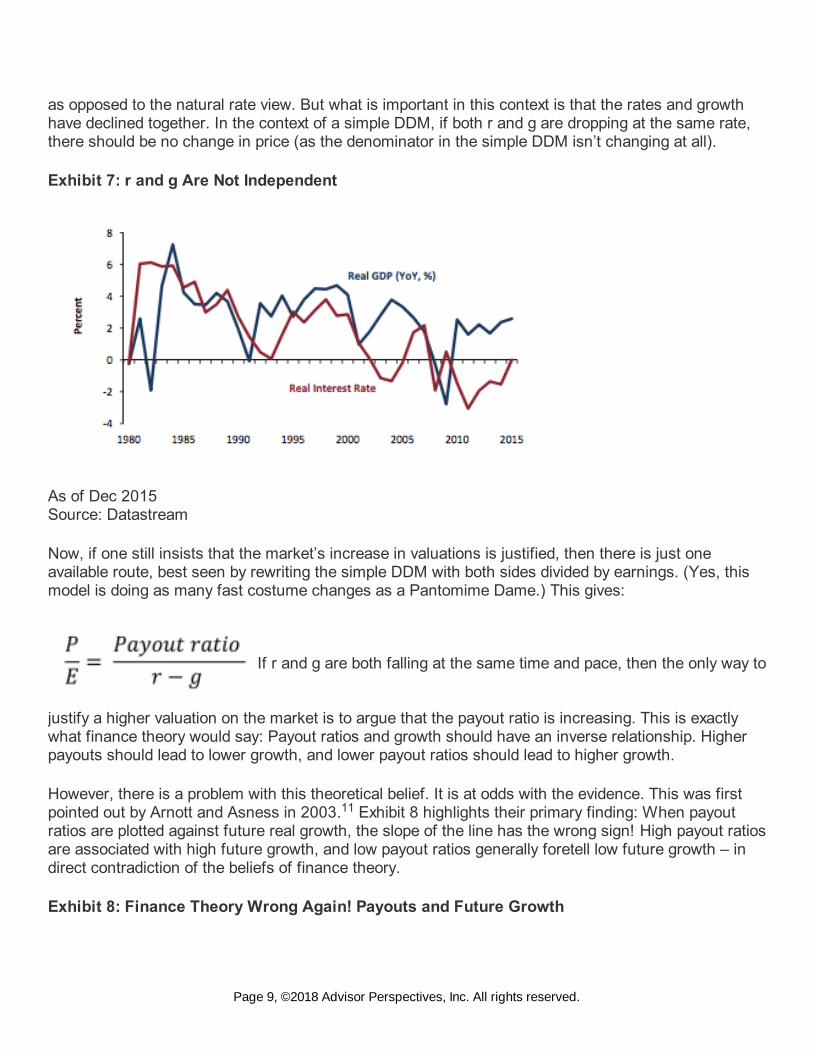
as opposed to the natural rate view. But what is important in this context is that the rates and growthhave declined together. In the context of a simple DDM, if both r and g are dropping at the same rate,there should be no change in price (as the denominator in the simple DDM isn’t changing at all).
Exhibit 7: r and g Are Not Independent
As of Dec 2015 Source: Datastream
Now, if one still insists that the market’s increase in valuations is justified, then there is just oneavailable route, best seen by rewriting the simple DDM with both sides divided by earnings. (Yes, thismodel is doing as many fast costume changes as a Pantomime Dame.) This gives:
If r and g are both falling at the same time and pace, then the only way to
justify a higher valuation on the market is to argue that the payout ratio is increasing. This is exactlywhat finance theory would say: Payout ratios and growth should have an inverse relationship. Higherpayouts should lead to lower growth, and lower payout ratios should lead to higher growth.
However, there is a problem with this theoretical belief. It is at odds with the evidence. This was firstpointed out by Arnott and Asness in 2003. Exhibit 8 highlights their primary finding: When payoutratios are plotted against future real growth, the slope of the line has the wrong sign! High payout ratiosare associated with high future growth, and low payout ratios generally foretell low future growth – indirect contradiction of the beliefs of finance theory.
Exhibit 8: Finance Theory Wrong Again! Payouts and Future Growth
11
Page 9, ©2018 Advisor Perspectives, Inc. All rights reserved.

Source: Shiller
I will happily admit that the relationship isn’t very strong. I don’t need it to be; I’m happy enough toconclude that there is no meaningful relationship between payouts and growth. Thus, I’d argue thatthe final route of defense for those who believe that higher valuations are justified in the context of aDDM has been cut off.
This has obvious implications for equilibrium equity returns. In my original piece from 2012, I presentedan exhibit similar to Exhibit 9. The blue line takes the DDM and shows the impact of lowering thediscount rate to -70 bps on equity fair value for the time given on the horizontal axis, assuming aconstant equity risk premium. It is clear that lowering the discount rate for one year really doesn’tmatter, but the longer the discount rate remains low, the greater the impact on fair value. So 100 yearsof -0.7% cash rates would “justify” a fair value return of around 4% real from equity.
I’ve augmented this exhibit by including the red line. This models the effect of both the interest rate andthe growth rate declining at the same time. It is important to note that if both the discount rate and thegrowth rate are lowered in perpetuity, then the two models effectively converge (not shown in thechart), with the end result a very low return to equities. However, in time periods less than infinity,lowering both the discount rate and the growth rate obviously mutes the effect when compared tosimply reducing the discount rate. Thus, once again we see that to believe in the Hell scenario is tobelieve that the markets have changed forever – that this time is truly different.
Exhibit 9: Implications for Equilibrium Equity Returns
12
13
Page 10, ©2018 Advisor Perspectives, Inc. All rights reserved.

Source: GMO
So far I have been a little vague about the concept of growth, but it is now time to turn there. In a DDM,it is dividend growth that matters, and, once the payout ratio is accounted for, it maps into earningsgrowth.
As Exhibit 10 shows, over the very long term real GDP growth has provided an upper bound to realearnings per share (EPS) growth. This makes intuitive sense as there are significant elements of GDPthat stock market investors simply aren’t exposed to. In addition, as Bernstein and Arnott pointed out,a dilution effect occurs as the stock market composition evolves over time, leading investors to buy andsell shares, thus creating a wedge between GDP and EPS.
Exhibit 10: Real EPS Bounded by Real GDP in the Long Term
14
Page 11, ©2018 Advisor Perspectives, Inc. All rights reserved.
As of Jan 2017 Source: Shiller, Maddison
This relationship is important, because if one believes that GDP growth is going to be low for anextended period (one of the definitions of secular stagnation), then it implies that real EPS will also below.
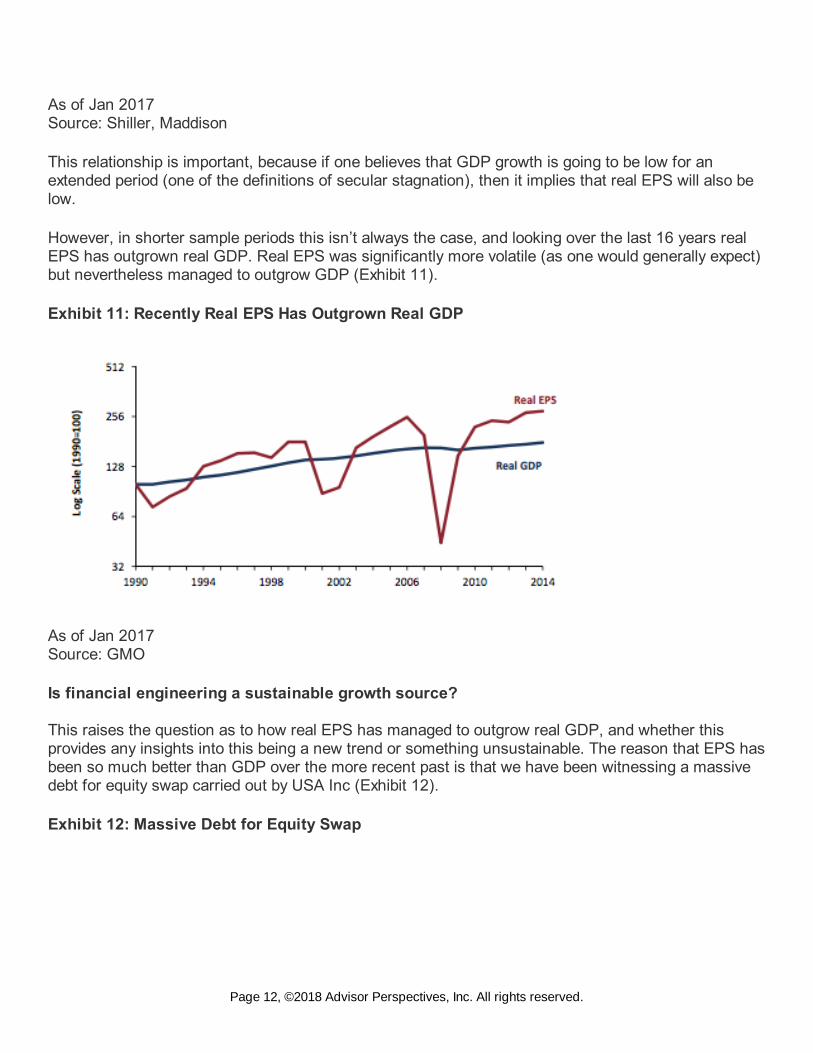
However, in shorter sample periods this isn’t always the case, and looking over the last 16 years realEPS has outgrown real GDP. Real EPS was significantly more volatile (as one would generally expect)but nevertheless managed to outgrow GDP (Exhibit 11).
Exhibit 11: Recently Real EPS Has Outgrown Real GDP
As of Jan 2017 Source: GMO
Is financial engineering a sustainable growth source?
This raises the question as to how real EPS has managed to outgrow real GDP, and whether thisprovides any insights into this being a new trend or something unsustainable. The reason that EPS hasbeen so much better than GDP over the more recent past is that we have been witnessing a massivedebt for equity swap carried out by USA Inc (Exhibit 12).
Exhibit 12: Massive Debt for Equity Swap
Page 12, ©2018 Advisor Perspectives, Inc. All rights reserved.
As of Jan 2017 Source: Federal Reserve
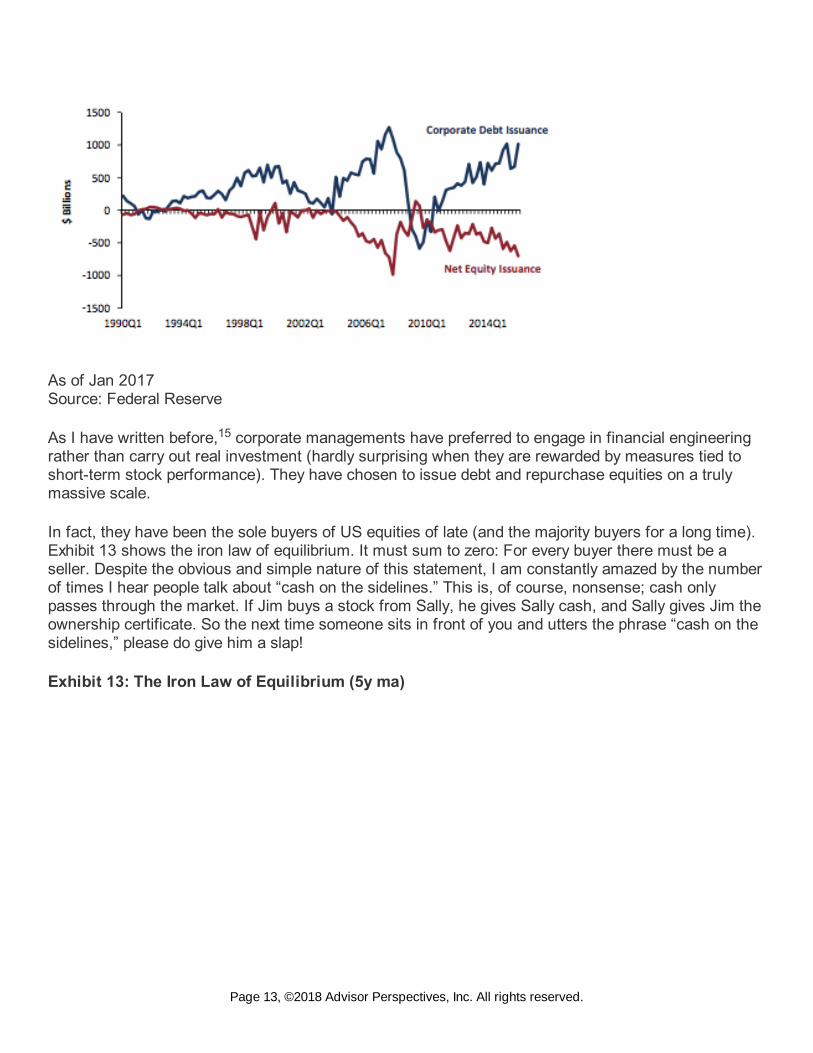
As I have written before, corporate managements have preferred to engage in financial engineeringrather than carry out real investment (hardly surprising when they are rewarded by measures tied toshort-term stock performance). They have chosen to issue debt and repurchase equities on a trulymassive scale.
In fact, they have been the sole buyers of US equities of late (and the majority buyers for a long time).Exhibit 13 shows the iron law of equilibrium. It must sum to zero: For every buyer there must be aseller. Despite the obvious and simple nature of this statement, I am constantly amazed by the numberof times I hear people talk about “cash on the sidelines.” This is, of course, nonsense; cash onlypasses through the market. If Jim buys a stock from Sally, he gives Sally cash, and Sally gives Jim theownership certificate. So the next time someone sits in front of you and utters the phrase “cash on thesidelines,” please do give him a slap!
Exhibit 13: The Iron Law of Equilibrium (5y ma)
15
Page 13, ©2018 Advisor Perspectives, Inc. All rights reserved.
As of Jan 2017 Source: Federal Reserve
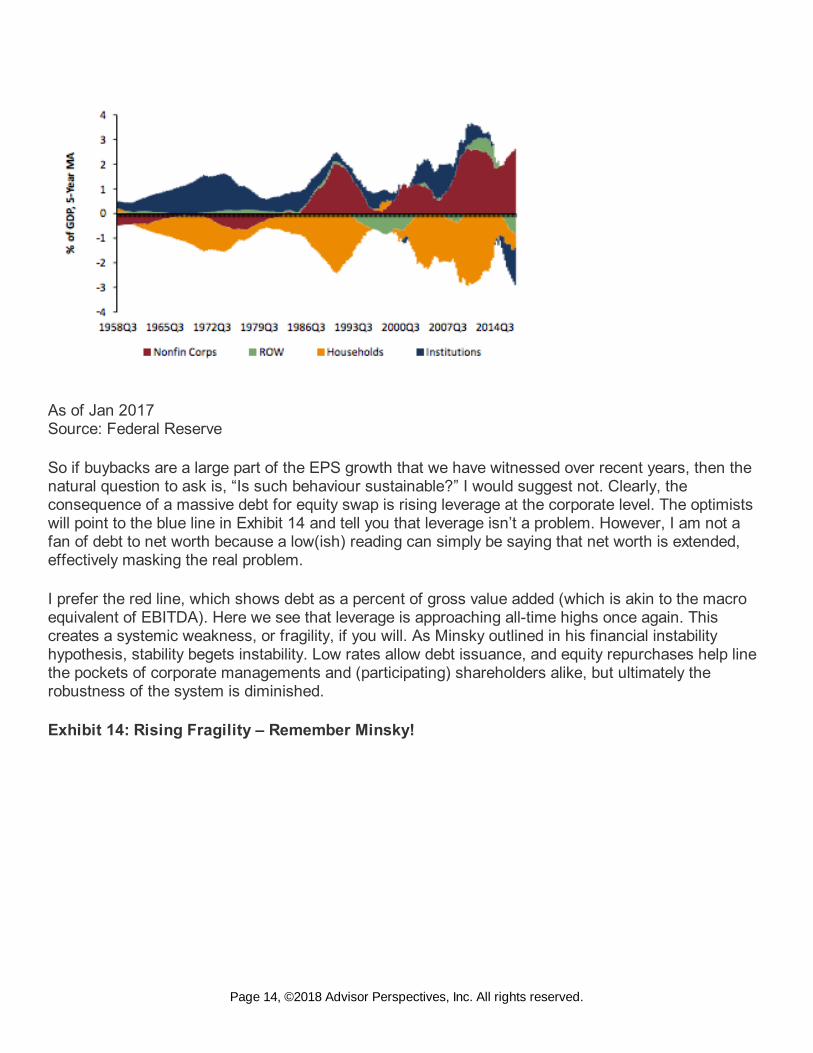
So if buybacks are a large part of the EPS growth that we have witnessed over recent years, then thenatural question to ask is, “Is such behaviour sustainable?” I would suggest not. Clearly, theconsequence of a massive debt for equity swap is rising leverage at the corporate level. The optimistswill point to the blue line in Exhibit 14 and tell you that leverage isn’t a problem. However, I am not afan of debt to net worth because a low(ish) reading can simply be saying that net worth is extended,effectively masking the real problem.
I prefer the red line, which shows debt as a percent of gross value added (which is akin to the macroequivalent of EBITDA). Here we see that leverage is approaching all-time highs once again. Thiscreates a systemic weakness, or fragility, if you will. As Minsky outlined in his financial instabilityhypothesis, stability begets instability. Low rates allow debt issuance, and equity repurchases help linethe pockets of corporate managements and (participating) shareholders alike, but ultimately therobustness of the system is diminished.
Exhibit 14: Rising Fragility – Remember Minsky!
Page 14, ©2018 Advisor Perspectives, Inc. All rights reserved.

As of Jan 2017 Source: Federal Reserve
But what about the corporate cash piles?
A common retort to this kind of concern is that USA Inc is swimming in cash, and hence we havenothing to worry about. However, once again it depends on how one chooses to frame the data (seeExhibit 15). Cash as a percent of GDP is indeed high, but cash as a percent of debt is certainly nothigh by historical standards. In the 1950s, for instance, cash was a much greater percentage of debt.Personally, I think the latter measure is the more important one because it compares the two things weare currently discussing – cash and debt.
Exhibit 15: What about the Much Heralded Cash Piles?
Page 15, ©2018 Advisor Perspectives, Inc. All rights reserved.

As of Jan 2017 Source: Federal Reserve
We can combine equities, debt, and cash into a single valuation metric, a macro equivalent to EV/EBITDA, by using the series mentioned earlier – gross value added. Exhibit 16 shows EV (defined asequity + debt - cash)/gross value added). It is clear that the US security market in aggregate (equityand debt combined) is fast approaching the obscene levels of expense that we witnessed in themadness of the TMT bubble.
Exhibit 16: Enterprise Value to GVA Approaching TMT Peaks
As of Jan 2017 Source: Federal Reserve
Conclusion: Is Hell the most probable outcome?
It appears that asset markets are priced as if secular stagnation were a certainty. Certainty is aparticularly dangerous assumption when it comes to investing. As Voltaire stated, “Doubt is not apleasant condition, but certainty is absurd.”
In order to believe that asset market pricing makes sense, I think you need to hold any number of“impossible” (by which I mean at best improbable, and at worst truly impossible) things to be true. Thisis certainly a different sort of experience from the bubble manias that Ben mentioned in the openingquotation, which are parsimoniously captured by Jeremy’s definition of bubbles – “excellentfundamentals, irrationally extrapolated.” This isn’t a mania in that sense. We aren’t seeing the insanebehaviour that we saw during episodes like the Japanese land and equity bubble of the late 1980s, orthe TMT bubble of the late 90s, at least not at the micro level. However, investors shouldn’t forget thatthe S&P 500 currently stands at a Shiller P/E of just over 28x – the third highest in history (see Exhibit17). The only two times that level was surpassed occurred in 1929 and in the run-up to the TMTbubble. Strangely enough, we aren’t hearing many exhortations to buy equities because it is just like
Page 16, ©2018 Advisor Perspectives, Inc. All rights reserved.
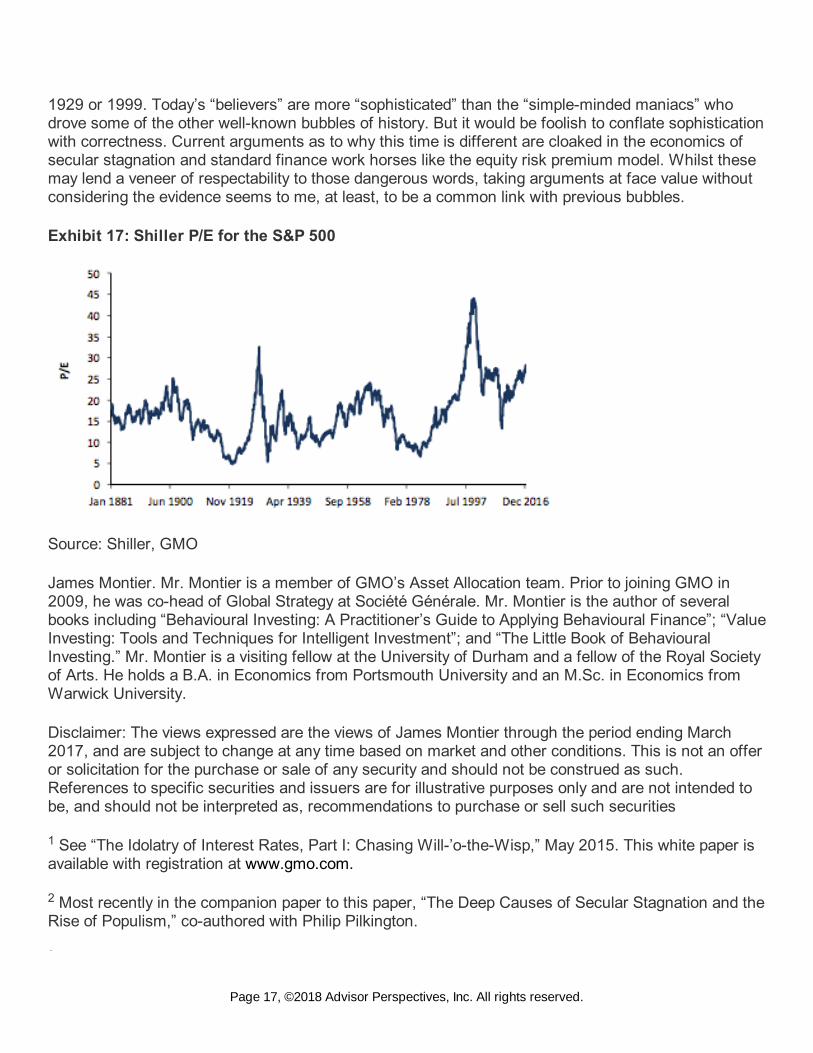
1929 or 1999. Today’s “believers” are more “sophisticated” than the “simple-minded maniacs” whodrove some of the other well-known bubbles of history. But it would be foolish to conflate sophisticationwith correctness. Current arguments as to why this time is different are cloaked in the economics ofsecular stagnation and standard finance work horses like the equity risk premium model. Whilst thesemay lend a veneer of respectability to those dangerous words, taking arguments at face value withoutconsidering the evidence seems to me, at least, to be a common link with previous bubbles.
Exhibit 17: Shiller P/E for the S&P 500
Source: Shiller, GMO
James Montier. Mr. Montier is a member of GMO’s Asset Allocation team. Prior to joining GMO in2009, he was co-head of Global Strategy at Société Générale. Mr. Montier is the author of severalbooks including “Behavioural Investing: A Practitioner’s Guide to Applying Behavioural Finance”; “ValueInvesting: Tools and Techniques for Intelligent Investment”; and “The Little Book of BehaviouralInvesting.” Mr. Montier is a visiting fellow at the University of Durham and a fellow of the Royal Societyof Arts. He holds a B.A. in Economics from Portsmouth University and an M.Sc. in Economics fromWarwick University.
Disclaimer: The views expressed are the views of James Montier through the period ending March2017, and are subject to change at any time based on market and other conditions. This is not an offeror solicitation for the purchase or sale of any security and should not be construed as such.References to specific securities and issuers are for illustrative purposes only and are not intended tobe, and should not be interpreted as, recommendations to purchase or sell such securities
See “The Idolatry of Interest Rates, Part I: Chasing Will-’o-the-Wisp,” May 2015. This white paper isavailable with registration at www.gmo.com.
Most recently in the companion paper to this paper, “The Deep Causes of Secular Stagnation and theRise of Populism,” co-authored with Philip Pilkington.
1
2
3
Page 17, ©2018 Advisor Perspectives, Inc. All rights reserved.

“The 13th Labour of Hercules: Capital Preservation in the Age of Financial Repression,” November2012. This white paper is available with registration at www.gmo.com.
See “The Idolatry of Interest Rates, Part II: Financial Heresy and Potential Utility in an ERPFramework,” August 2015. This white paper is available with registration at www.gmo.com.
Unlike Milton Friedman, I believe that key assumptions should at least be compatible with reality.
If one insists on maintaining the belief that the interest rate matters, then one is forced into theposition that the equity risk premium has magically altered inversely with the real interest rate in orderto be congruent with the data.
Sadly, as I have detailed elsewhere (see Chapter 42 of Behavioural Investing), we tend to judgethings by how believable we find them to be, rather than by employing logic or empirical evidence.
Ibid
Michael McLeay, Amar Radia, and Thomas Ryland, “Monetary creation in the modern economy,”Quarterly Bulletin, Q1 2014.
Lukasz Rachel and Thomas D. Smith, “Secular drivers of the global real interest rate,” Bank ofEngland Staff Working Paper No. 571, December 2015.
Robert D. Arnott and Clifford S. Asness, “Surprise! Higher Dividends = Higher Earnings Growth,”Financial Analysts Journal, 2003.
This inverse relationship isn’t unique to the US data. It has been shown to hold for UK, French,German, and other international markets. See Owain ap Gwilym, James Seaton, Karina Suddason,and Stephen Thomas, “International Evidence on the Payout Ratio, Earnings, Dividends, and Returns,”Financial Analysts Journal, 2006.
The model we use actually covers 500 years, so 100 years of lowered discount rates and growthrates appear to be relatively muted in their impact on true fair value. Of course, holding equities duringthe low-returning 100 years would have been exceedingly painful. Obviously, as the time approachesthe limit (500 years in this case), the effect gets more pronounced, until essentially convergenceoccurs.
William J. Bernstein and Robert D. Arnott, “Earnings Growth: The Two Percent Dilution,” FinancialAnalysts Journal, September/October 2003.
“The World’s Dumbest Idea,” December 2014, and “The Deep Causes of Secular Stagnation andthe Rise of Populism,” March 2017. These white papers are available with registration atwww.gmo.com.
Copyright © 2017 by GMO LLC. All rights reserved.
3
4
5
6
7
8
9
10
11
12
13
14
15
Page 18, ©2018 Advisor Perspectives, Inc. All rights reserved.

Page 19, ©2018 Advisor Perspectives, Inc. All rights reserved.