Situation Awareness at Autonomous Vehicle Handover ...
6
Situation Awareness at Autonomous Vehicle Handover: Preliminary Results of a Quantitative Analysis Tam´ as D. Nagy 1,2 , D´ aniel A. Drexler 1 , Nikita Ukhrenkov 1 , ´ Arp´ ad Tak´ acs 1 and Tam´ as Haidegger 1,3 Abstract— Enforcing system level safety is a key research domain within self-driving technology. Current general develop- ment efforts aim for Level 3+ autonomy, where the vehicle con- trols both lateral and longitudinal motion of the dynamic driv- ing task, while the driver is permitted to divert their attention, as long as she/he is able to react properly to a handover request initiated by the vehicle. Consequently, situation awareness of the human driver has become one of the most important metrics of handover safety. In this paper, the preliminary results of a user study are presented to quantitatively evaluate emergency handover performance, using custom-designed experimental setup, built upon the Master Console of the da Vinci Surgical System and the CARLA driving simulator. The measured control signals and the questionnaire filled out by participants were analyzed to gain further knowledge on the situation awareness of drivers during handover at Level 3 autonomy. The supporting, custom open-source platform developed is available at https://github.com/ABC-iRobotics/dvrk_carla. Index terms—Autonomous Vehicle Safety, Self-driving, Situ- ation Awareness, Driving Simulator, Hand-over. I. I NTRODUCTION Autonomous driving technologies are on the rise world- wide, aiming to increase road safety in general. However, significant system and human failures have happened in the near past, indicating that the underlying technology and reg- ulations are still just evolving [1]. The Society of Automotive Engineers (SAE) provided the most recognized scale for the levels of automation in the case of self-driving [2], a classification that is often used in different research domains as well [3], [4]. These Levels of Autonomy are: • L0: no autonomy • L1: user assistance • L2: partial automation • L3: conditional automation • L4: high automation • L5: full automation. The research presented in this paper was carried out as part of the EFOP-3.6.2-16-2017-00016 project in the framework of the New Sz´ echenyi Plan. This work was partially supported by ACMIT (Austrian Center for Medical Innovation and Technology), which is funded within the scope of the COMET (Competence Centers for Excellent Technologies) program of the Austrian Government. T. D. Nagy and T. Haidegger are supported through the New National Excellence Program of the Ministry of Human Capacities. T. Haidegger is a Bolyai Fellow of the Hungarian Academy of Sciences. 1 Antal Bejczy Center for Intelligent Robotics, ´ Obuda University, Budapest, Hungary, {tamas.daniel.nagy, arpad.takacs, tamas.haidegger}@irob.uni-obuda.hu, [email protected], [email protected] 2 Doctoral School of Applied Informatics and Applied Mathematics, ´ Obuda University, Budapest, Hungary 3 Austrian Center for Medical Innovation and Technology (ACMIT), Wiener Neustadt, Austria At L3 (conditional automation), most of the essential driving functions are automated, however, the driver should be ready to take control whenever it is necessary. Hazardous situations are typical sources of this transfer of control, when the automated system cannot handle the situation, and thus it notifies the user to resolve it. In the case of L3, safety considerations are crucial: due to the fact that most of the functions are automated, the driver can easily be distracted, unfocused and bored, while a smooth transfer of control requires constant attention from the user. Further- more, drivers usually over-trust the system, causing lower level of Situation Awareness (SA) [1], [5]. One solution for this problem chosen by manufacturers is to implement higher level of automation directly (L4+), without these restricting conditions. Another, technically more feasible approach is to maintan high SA; the driver has a constant task to perform, such as handling the pedals solely, while it means retrogression in technology. In driving automation, the term “handover” refers to taking back the control from the vehicle, and “takeover” (time) indicates the necessary timeframe in witch it actually happens [6]. Takeover is typically between 1.9 and 25.7 seconds in non-critical cases, however, it may get prolonged under critical conditions [7]. Takeover can be estimated from a control system model introduced in [8]. Situation Awareness is a key factor of driving safety (especially at L2 and L3). SA is defined on 3 levels based on the cognitive understanding of the (past–present–future) environment [9], [10]: • Level 1 SA: Perception of the environment; • Level 2 SA: Comprehension of the current situation; • Level 3 SA: Projection of future status. SA can be categorized into the following classes: spatial (locations), identity (salient objects), temporal, goal and system awareness (Fig. 1). In this paper, we introduce an SA experiment, which examines the handover in emergency situations. In order to simulate these emergencies, we used a widely available driving simulator, CARLA 1 and the Master Console of the da Vinci Surgical System (Intuitive Surgical Inc., Sunnyvale, CA). We studied seven subjects’ handover performance un- der critical conditions. II. EXPERIMENTAL SETUP The da Vinci Surgical System was originally devel- oped for the purpose of robot-assisted minimally inva- 1 http://carla.org/
Transcript of Situation Awareness at Autonomous Vehicle Handover ...

Situation Awareness at Autonomous Vehicle Handover: PreliminaryResults of a Quantitative Analysis
Tamas D. Nagy1,2, Daniel A. Drexler1, Nikita Ukhrenkov1, Arpad Takacs1 and Tamas Haidegger1,3
Abstract— Enforcing system level safety is a key researchdomain within self-driving technology. Current general develop-ment efforts aim for Level 3+ autonomy, where the vehicle con-trols both lateral and longitudinal motion of the dynamic driv-ing task, while the driver is permitted to divert their attention,as long as she/he is able to react properly to a handover requestinitiated by the vehicle. Consequently, situation awareness ofthe human driver has become one of the most important metricsof handover safety. In this paper, the preliminary results of auser study are presented to quantitatively evaluate emergencyhandover performance, using custom-designed experimentalsetup, built upon the Master Console of the da Vinci SurgicalSystem and the CARLA driving simulator. The measuredcontrol signals and the questionnaire filled out by participantswere analyzed to gain further knowledge on the situationawareness of drivers during handover at Level 3 autonomy. Thesupporting, custom open-source platform developed is availableat https://github.com/ABC-iRobotics/dvrk_carla.
Index terms—Autonomous Vehicle Safety, Self-driving, Situ-ation Awareness, Driving Simulator, Hand-over.
I. INTRODUCTION
Autonomous driving technologies are on the rise world-wide, aiming to increase road safety in general. However,significant system and human failures have happened in thenear past, indicating that the underlying technology and reg-ulations are still just evolving [1]. The Society of AutomotiveEngineers (SAE) provided the most recognized scale forthe levels of automation in the case of self-driving [2], aclassification that is often used in different research domainsas well [3], [4]. These Levels of Autonomy are:
• L0: no autonomy• L1: user assistance• L2: partial automation• L3: conditional automation• L4: high automation• L5: full automation.
The research presented in this paper was carried out as part of theEFOP-3.6.2-16-2017-00016 project in the framework of the New SzechenyiPlan. This work was partially supported by ACMIT (Austrian Center forMedical Innovation and Technology), which is funded within the scopeof the COMET (Competence Centers for Excellent Technologies) programof the Austrian Government. T. D. Nagy and T. Haidegger are supportedthrough the New National Excellence Program of the Ministry of HumanCapacities. T. Haidegger is a Bolyai Fellow of the Hungarian Academy ofSciences.
1Antal Bejczy Center for Intelligent Robotics, Obuda University,Budapest, Hungary, {tamas.daniel.nagy, arpad.takacs,tamas.haidegger}@irob.uni-obuda.hu,[email protected],[email protected]
2Doctoral School of Applied Informatics and Applied Mathematics,Obuda University, Budapest, Hungary
3Austrian Center for Medical Innovation and Technology (ACMIT),Wiener Neustadt, Austria
At L3 (conditional automation), most of the essentialdriving functions are automated, however, the driver shouldbe ready to take control whenever it is necessary. Hazardoussituations are typical sources of this transfer of control,when the automated system cannot handle the situation,and thus it notifies the user to resolve it. In the case ofL3, safety considerations are crucial: due to the fact thatmost of the functions are automated, the driver can easilybe distracted, unfocused and bored, while a smooth transferof control requires constant attention from the user. Further-more, drivers usually over-trust the system, causing lowerlevel of Situation Awareness (SA) [1], [5]. One solution forthis problem chosen by manufacturers is to implement higherlevel of automation directly (L4+), without these restrictingconditions. Another, technically more feasible approach isto maintan high SA; the driver has a constant task toperform, such as handling the pedals solely, while it meansretrogression in technology.
In driving automation, the term “handover” refers totaking back the control from the vehicle, and “takeover”(time) indicates the necessary timeframe in witch it actuallyhappens [6]. Takeover is typically between 1.9 and 25.7seconds in non-critical cases, however, it may get prolongedunder critical conditions [7]. Takeover can be estimated froma control system model introduced in [8].
Situation Awareness is a key factor of driving safety(especially at L2 and L3). SA is defined on 3 levels basedon the cognitive understanding of the (past–present–future)environment [9], [10]:
• Level 1 SA: Perception of the environment;• Level 2 SA: Comprehension of the current situation;• Level 3 SA: Projection of future status.SA can be categorized into the following classes: spatial
(locations), identity (salient objects), temporal, goal andsystem awareness (Fig. 1).
In this paper, we introduce an SA experiment, whichexamines the handover in emergency situations. In orderto simulate these emergencies, we used a widely availabledriving simulator, CARLA1 and the Master Console of theda Vinci Surgical System (Intuitive Surgical Inc., Sunnyvale,CA). We studied seven subjects’ handover performance un-der critical conditions.
II. EXPERIMENTAL SETUP
The da Vinci Surgical System was originally devel-oped for the purpose of robot-assisted minimally inva-
1http://carla.org/

sive surgery [11]. Its human–machine interface is versatileenough to be used for the purpose of self-driving handoverexperiments. The head-in type stereo display is an excellenttool to control and monitor the driver’s attention—just likethe surgeon’s attention in the conventional, clinical use.When the driver’s head is not inserted, they are not able to seethe simulation, and likewise, when their head is inserted, noexternal visual disturbances may pass into their field of view.Furthermore, thanks to the built-in photogates, the insertionof the head into the display area can be easily detected. TheMaster Tool Manipulators (MTMs) of the da Vinci MasterConsole, as well as the foot pedals were tailored to offersimilar functionality to the steering wheel and foot pedals ofa car [12].
The implemented system (Fig. 2) was built upon twomayor open-source software components: the Da Vinci Re-search Kit (DVRK) [13] and the CARLA Simulator [14].The MTMs of the Master Console mimic the behavior of asteering wheel, relying on the impedance control built intothe DVRK; the built-in head sensor is also interfaced tothe control PC through the DVRK platform; the foot pedalsextended with Hall effect sensors are connected using anArduino board (Arduino Co., Somerville, MA) [15], sendingthe measured values to a Robot Operating System2 (ROS)environment; the stereo display is connected to the PC usingDVI interface. The control PC runs the cisst-component [16]to interface DVRK—and so do the MTMs and the headsensor—to ROS and the CARLA server, responsible forthe simulation. Moreover, a ROS node sets the gains ofthe impedance control dynamically, and a CARLA clientforwards the control values to the CARLA server and sendsthe stereo video stream to the displays.
The MTMs of the da Vinci are programmable using theopen-source DVRK platform [16], which is based on thehighly modular ROS, used widely in robotics research [17].At the tips of the MTMs, 3D printed wheel segments werefixed (Fig. 3). The motion of this DVRK steering wheel isrestricted to a circular trajectory around a virtual center pointusing the built-in impedance control of the DVRK [12], and
2https://www.ros.org/
Fig. 1. Hierarchical representation of Situation Awareness (SA) inself-driving vehicles. For every level of autonomy(L2 Advanced Driver-Assistance System (ADAS), L3 Partial Automation and L4 High Automa-tion), the quantitative metrics must fulfill the requirements for each category.
the steering angle value is interfaced to the CARLA clientover ROS (Fig. 2).
The usage of the foot pedals of the da Vinci MasterConsole for the driving experiments was an obvious choice.However, those pedals offer simple binary output by de-fault. To get continuous reading, the pedals were completedwith Hall effect sensors and small-sized magnets, connectedto the PC using an Arduino board, serving as accelera-tor and break pedals. The sensor values were read usingthe rosserial_arduino package, and were forwardedthrough ROS topics towards the CARLA client (Fig. 2).
The two displays of the da Vinci—serving as stereo dis-play pair—have been replaced with LCD screens to enhanceimage quality—, which is a commonly used enhancement ofthe DVRK platform. These screens were connected to the PCover DVI to provide the stereo video stream to the driver. Thehead-in type display allowed attention control for the drivers,as they were not aware of the environment and the simulatorat the same time. Moreover, using the built-in photogatesof the console, the insertion of the driver’s head was alsomonitored. The signal of the photogates was forwarded to aROS topic through one of the DVRK controllers (Fig. 2).
The CARLA Simulator was chosen to be used in theexperiment; this open-source driving simulator is used widelyin the research of autonomous driving, furthermore, it offersbuilt-in scenarios, autopilot and ROS communication [14].The CARLA Server offers the core of the simulation, while aCARLA client forwards the steering angle and pedals valuesform ROS using Remote Procedure Calls (RPC). Moreover,it defines the two cameras to ensure stereo vision (Fig. 2.),forwarding the video stream to the display of the da VinciMaster Console.
III. EXPERIMENTAL PROTOCOL
In the experiments, it was our aim to model hand-over pro-cesses at L3 autonomy during emergencies. Each individualexperiment was divided into 8 successive scenarios, none ofthe subjects participated in more than one experiment. Beforeeach experiment, the subjects had one minute to practicedriving in the simulator.
Every scenario started by the car driving autonomously,while the subject was instructed to type a text messageon a smartphone, and not to insert her/his head into thesimulator display nor pay attention to it. After 40–60 secondsof autonomous driving the system raised an emergency audioalarm and yielded the control to the human subject. Thistime delay was randomly chosen for the 8 scenarios atthe beginning of the experiment, and was the same foreach subject. This way, despite subjects would not expectthe alarm at the same time instant, the results remainedcomparable between subjects. Then, the subjects had to takecontrol of the vehicle and tried to solve the traffic situation.The subjects were also instructed that unnecessary braking(e.g., in the case of false alarm, see below) was unwantedand inflicted penalty. Each of the the 8 emergency scenarioshappened at the same location on the simulation’s map, with

Fig. 2. Block diagram of the experimental setup. The display, the head sensor, the input manipulators and the pedals of the da Vinci Master Console areused to create a handover simulation user interface. The Da Vinci Research Kit is used for control, while the setup is interfaced to the CARLA Simulatorvia ROS components.
Fig. 3. The da Vinci MTMs with the 3D printed steering wheel seg-ments, push-fitted and fixed by the built-in hook-and-loop fasteners. Usingimpedance control, the arms are mimicking the behavior of steering wheels,and rotate around a virtual axis.
the combination of the two states of the following threeconditions:
1) True/False alarm: A pedestrian was involved in theemergency in all of the designed scenarios. In the caseof the true alarm, the pedestrian stepped in front of thevehicle from behind a vending machine (Fig. 4), andthe car was about to hit him. In the case of the falsealarm, the pedestrian was moving on the sidewalk,parallel to the road. This case could have also been
done without a pedestrian, however, we decided toleave the pedestrian in the scenario because his motioncould also trigger braking at some of the subjects. Theaudio alarm was always raised three seconds beforereaching the pedestrian’s location;
2) Car coming from front/No car coming from front:To make the scenarios more challenging, opposingtraffic was added to the scenario at the location of theemergency at some of the scenarios. In the case of nocar coming from the opposite lane, there were no othervehicles on the road;
3) Clear weather/Heavy rain: To change visual condi-tions, the weather was also changed between scenarios.
Using the three varying conditions above, the followingorder of scenarios was compiled (the same for each subject):
1) True alarm, No car, Clear weather;2) False alarm, Car coming from opposite lane, Clear
weather;3) True alarm, Car coming from opposite lane, Heavy
rain;4) True alarm, Car coming from opposite lane, Clear
weather;5) False alarm, Car coming from opposite lane, Heavy
rain;6) False alarm, No car, Heavy rain;7) True alarm, No car, Heavy rain;8) False alarm, No car, Clear weather.In parallel to the scenarios on the simulator, the subjects
were also asked to fill in a questionnaire. Before the intro-ductory driving practice and the scenarios, they were asked toread and agree to a consent form; the data gathered was com-pletely anonymous. Afterwards, some general questions wereasked regarding their age and driving experience. Following

Fig. 4. Screenshot of the simulation in one of the emergency scenarios.The pedestrian is stepping down to the road ahead the vehicle from behinda vending machine; the weather is clear with good visual conditions andthere is no traffic on the road.
each scenario, questions regarding the simulated event andthe details of the environment were asked to gain furtherinformation on their SA. Furthermore, after each scenario,they were asked to evaluate their own reaction on a scale1–5. See the details of the questionnaire in Section IV.
IV. RESULTS
We measured the SA of the participants by asking ques-tions about their surroundings. They got 1 point for the goodanswer, 0 point for neutral answer (I do not know) and−1 point for a wrong answer. There was a specific casewhen they were asked about the direction of travel afterthe accident scene, where straight and left was also a goodanswer, although the road turned to left in a short distance;in this case straight was also accepted as a good answer with0.5 point. The evolution of the SA along the scenarios areshown in Fig. 5 for all the participants.
We measured the takeover time as the difference betweenthe time of the handover request (alarm sound) and thetime of the first physical reaction (large change in steeringwheel angle or break pedal operation) after the handoverrequest. The car switched to manual drive as the handoverwas initiated, thus by the time the participants looked into thedisplay, the car already started drift off the lane. As a result,an immediate intervention was always necessary in all thescenarios. The values of takeover times for each participantand each scenario are shown in Fig. 6.
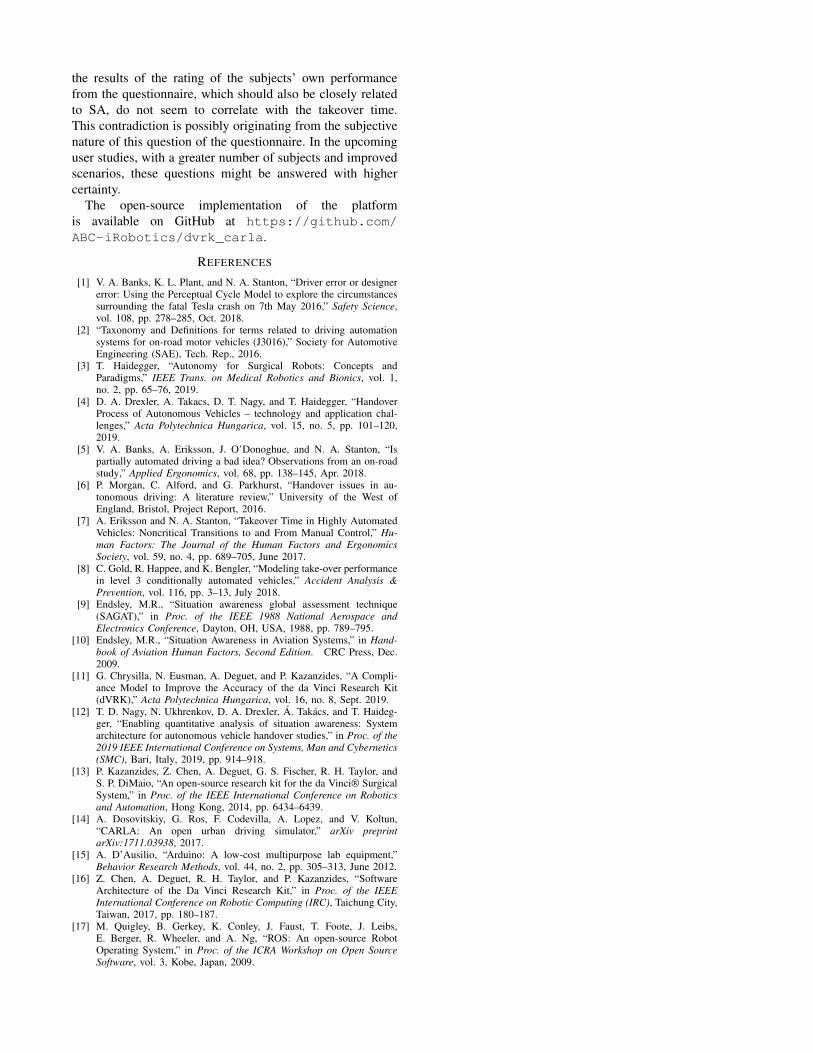
The takeover time for each scenario is shown in Fig. 7,using a compact box plot. The circles are outlier data, dottedcircles indicate the median. The thick lines show the range,where the second and third quadrant of the data are, andthe thin lines show the range of other non-outlier data. Onecan observe a slight decrease in the takeover time mediansas the scenario index increases, which may imply that asthe subjects gained SA, thus their handover performanceincreased.
The increase of SA can be observed in the slight increaseof general satisfaction in Fig. 8. The figure shows how themean satisfaction increased (based on the survey) duringdifferent scenarios. The satisfaction for each scenario was
sc #1 sc #2 sc #3 sc #4 sc #5 sc #6 sc #7 sc #80
5
SA
subject 1
sc #1 sc #2 sc #3 sc #4 sc #5 sc #6 sc #7 sc #80
1
2
SA
subject 2
sc #1 sc #2 sc #3 sc #4 sc #5 sc #6 sc #7 sc #80
5
SA
subject 3
sc #1 sc #2 sc #3 sc #4 sc #5 sc #6 sc #7 sc #8
0
2
4
SA
subject 4
sc #1 sc #2 sc #3 sc #4 sc #5 sc #6 sc #7 sc #80
1
2
3
SA
subject 5
sc #1 sc #2 sc #3 sc #4 sc #5 sc #6 sc #7 sc #80
2
4
SA
subject 6
sc #1 sc #2 sc #3 sc #4 sc #5 sc #6 sc #7 sc #80
5
SA
subject 7
Fig. 5. The evolution of Situation Awareness (SA) of the participants alongthe scenarios.
acquired from the questionnaire, where the participants wereasked to rate their own reaction on a scale from 1–5 (1–bad,5–excellent). The SA was also checked by asking questionsabout the surroundings, which become more accurate as theparticipants moved forward in the experiments. Fig. 8 showsthat polling the self-satisfaction might be indicative of theSA of the subject.
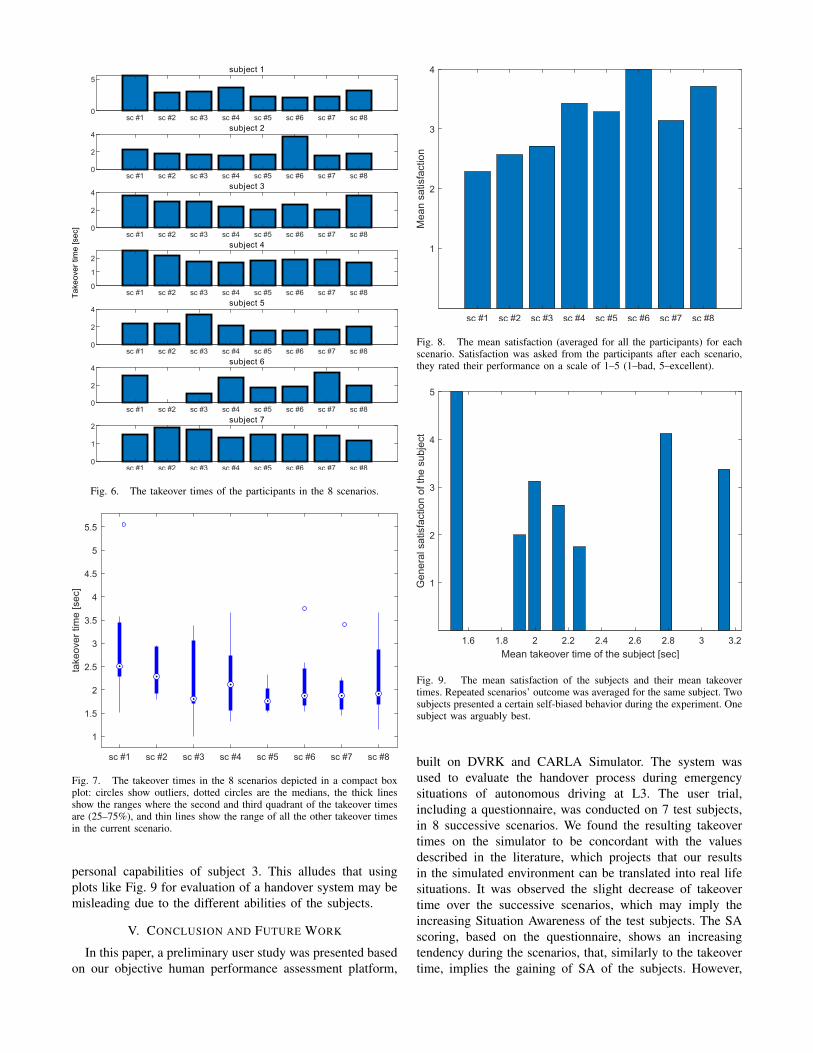
The mean satisfaction of the subjects is shown versus theirmean takeover time in Fig. 9. The subjects could be dividedinto three groups intuitively. The first group consisted ofsubject 7, who had the smallest mean takeover time, andthe largest satisfaction. The second group was composed ofsubjects 1 and 3, who had the larges takeover time, but stillhigh satisfaction. The third group was composed of subjects2,4,5,6, who had relatively small takeover time, but alsosmall satisfaction. This shows that general satisfaction doesnot correlate with the mean takeover time.
Although Fig. 9 shows that the mean satisfaction does notcorrelate with mean takeover time, Fig. 8 and the answersfrom the questionnaire show that mean satisfaction correlateswith SA. This may imply that SA has does not correlate withmean takeover time, but this implication is wrong. Subject 1had large mean takeover time, however, this is because ofthe large takeover time in scenario #1, and as the SA ofsubject 1 increases, the takeover times decreases (Fig. 6). Forsubject 3, the takeover time was large for the first and thelast scenarios, but there is a weak decreasing tendency in thetakeover times, which may be connected to increasing SA.The large takeover times can be associated with the unique
subject 1
sc #1 sc #2 sc #3 sc #4 sc #5 sc #6 sc #7 sc #80
5
subject 2
sc #1 sc #2 sc #3 sc #4 sc #5 sc #6 sc #7 sc #80
2
4
subject 3
sc #1 sc #2 sc #3 sc #4 sc #5 sc #6 sc #7 sc #80
2
4
subject 4
sc #1 sc #2 sc #3 sc #4 sc #5 sc #6 sc #7 sc #80
1
2
subject 5
sc #1 sc #2 sc #3 sc #4 sc #5 sc #6 sc #7 sc #80
2
4
subject 6
sc #1 sc #2 sc #3 sc #4 sc #5 sc #6 sc #7 sc #80
2
4
subject 7
sc #1 sc #2 sc #3 sc #4 sc #5 sc #6 sc #7 sc #80
1
2
Tak
eove
r tim
e [s
ec]
Fig. 6. The takeover times of the participants in the 8 scenarios.
sc #1 sc #2 sc #3 sc #4 sc #5 sc #6 sc #7 sc #8
1
1.5
2
2.5
3
3.5
4
4.5
5
5.5
take
over
tim
e [s
ec]
Fig. 7. The takeover times in the 8 scenarios depicted in a compact boxplot: circles show outliers, dotted circles are the medians, the thick linesshow the ranges where the second and third quadrant of the takeover timesare (25–75%), and thin lines show the range of all the other takeover timesin the current scenario.
personal capabilities of subject 3. This alludes that usingplots like Fig. 9 for evaluation of a handover system may bemisleading due to the different abilities of the subjects.
V. CONCLUSION AND FUTURE WORK
In this paper, a preliminary user study was presented basedon our objective human performance assessment platform,
sc #1 sc #2 sc #3 sc #4 sc #5 sc #6 sc #7 sc #8
1
2
3
4
Mea
n sa
tisfa
ctio
n
Fig. 8. The mean satisfaction (averaged for all the participants) for eachscenario. Satisfaction was asked from the participants after each scenario,they rated their performance on a scale of 1–5 (1–bad, 5–excellent).
1.6 1.8 2 2.2 2.4 2.6 2.8 3 3.2
Mean takeover time of the subject [sec]
1
2
3
4
5
Gen
eral
sat
isfa
ctio
n of
the
sub
ject
Fig. 9. The mean satisfaction of the subjects and their mean takeovertimes. Repeated scenarios’ outcome was averaged for the same subject. Twosubjects presented a certain self-biased behavior during the experiment. Onesubject was arguably best.
built on DVRK and CARLA Simulator. The system wasused to evaluate the handover process during emergencysituations of autonomous driving at L3. The user trial,including a questionnaire, was conducted on 7 test subjects,in 8 successive scenarios. We found the resulting takeovertimes on the simulator to be concordant with the valuesdescribed in the literature, which projects that our resultsin the simulated environment can be translated into real lifesituations. It was observed the slight decrease of takeovertime over the successive scenarios, which may imply theincreasing Situation Awareness of the test subjects. The SAscoring, based on the questionnaire, shows an increasingtendency during the scenarios, that, similarly to the takeovertime, implies the gaining of SA of the subjects. However,
the results of the rating of the subjects’ own performancefrom the questionnaire, which should also be closely relatedto SA, do not seem to correlate with the takeover time.This contradiction is possibly originating from the subjectivenature of this question of the questionnaire. In the upcominguser studies, with a greater number of subjects and improvedscenarios, these questions might be answered with highercertainty.
The open-source implementation of the platformis available on GitHub at https://github.com/ABC-iRobotics/dvrk_carla.
REFERENCES
[1] V. A. Banks, K. L. Plant, and N. A. Stanton, “Driver error or designererror: Using the Perceptual Cycle Model to explore the circumstancessurrounding the fatal Tesla crash on 7th May 2016,” Safety Science,vol. 108, pp. 278–285, Oct. 2018.
[2] “Taxonomy and Definitions for terms related to driving automationsystems for on-road motor vehicles (J3016),” Society for AutomotiveEngineering (SAE), Tech. Rep., 2016.
[3] T. Haidegger, “Autonomy for Surgical Robots: Concepts andParadigms,” IEEE Trans. on Medical Robotics and Bionics, vol. 1,no. 2, pp. 65–76, 2019.
[4] D. A. Drexler, A. Takacs, D. T. Nagy, and T. Haidegger, “HandoverProcess of Autonomous Vehicles – technology and application chal-lenges,” Acta Polytechnica Hungarica, vol. 15, no. 5, pp. 101–120,2019.
[5] V. A. Banks, A. Eriksson, J. O’Donoghue, and N. A. Stanton, “Ispartially automated driving a bad idea? Observations from an on-roadstudy,” Applied Ergonomics, vol. 68, pp. 138–145, Apr. 2018.
[6] P. Morgan, C. Alford, and G. Parkhurst, “Handover issues in au-tonomous driving: A literature review,” University of the West ofEngland, Bristol, Project Report, 2016.
[7] A. Eriksson and N. A. Stanton, “Takeover Time in Highly AutomatedVehicles: Noncritical Transitions to and From Manual Control,” Hu-man Factors: The Journal of the Human Factors and ErgonomicsSociety, vol. 59, no. 4, pp. 689–705, June 2017.
[8] C. Gold, R. Happee, and K. Bengler, “Modeling take-over performancein level 3 conditionally automated vehicles,” Accident Analysis &Prevention, vol. 116, pp. 3–13, July 2018.
[9] Endsley, M.R., “Situation awareness global assessment technique(SAGAT),” in Proc. of the IEEE 1988 National Aerospace andElectronics Conference, Dayton, OH, USA, 1988, pp. 789–795.
[10] Endsley, M.R., “Situation Awareness in Aviation Systems,” in Hand-book of Aviation Human Factors, Second Edition. CRC Press, Dec.2009.
[11] G. Chrysilla, N. Eusman, A. Deguet, and P. Kazanzides, “A Compli-ance Model to Improve the Accuracy of the da Vinci Research Kit(dVRK),” Acta Polytechnica Hungarica, vol. 16, no. 8, Sept. 2019.
[12] T. D. Nagy, N. Ukhrenkov, D. A. Drexler, A. Takacs, and T. Haideg-ger, “Enabling quantitative analysis of situation awareness: Systemarchitecture for autonomous vehicle handover studies,” in Proc. of the2019 IEEE International Conference on Systems, Man and Cybernetics(SMC), Bari, Italy, 2019, pp. 914–918.
[13] P. Kazanzides, Z. Chen, A. Deguet, G. S. Fischer, R. H. Taylor, andS. P. DiMaio, “An open-source research kit for the da Vinci® SurgicalSystem,” in Proc. of the IEEE International Conference on Roboticsand Automation, Hong Kong, 2014, pp. 6434–6439.
[14] A. Dosovitskiy, G. Ros, F. Codevilla, A. Lopez, and V. Koltun,“CARLA: An open urban driving simulator,” arXiv preprintarXiv:1711.03938, 2017.
[15] A. D’Ausilio, “Arduino: A low-cost multipurpose lab equipment,”Behavior Research Methods, vol. 44, no. 2, pp. 305–313, June 2012.
[16] Z. Chen, A. Deguet, R. H. Taylor, and P. Kazanzides, “SoftwareArchitecture of the Da Vinci Research Kit,” in Proc. of the IEEEInternational Conference on Robotic Computing (IRC), Taichung City,Taiwan, 2017, pp. 180–187.
[17] M. Quigley, B. Gerkey, K. Conley, J. Faust, T. Foote, J. Leibs,E. Berger, R. Wheeler, and A. Ng, “ROS: An open-source RobotOperating System,” in Proc. of the ICRA Workshop on Open SourceSoftware, vol. 3, Kobe, Japan, 2009.