SITUATION ANALYSIS OF DRUG SUPPLY MANAGEMENT IN …
122
SITUATION ANALYSIS OF DRUG SUPPLY MANAGEMENT IN TSHWANE Deusdedit Katetegirwe Mubangizi IJni-.rniiy of ihr Wi;w*ifr;rj)nd A research report submitted to the Faculty of Health Sciences, University of the Witwatersrand, Johannesburg, in partial fulfillment of the requirements for the degree of Master of Science in Medicine in Pharmaceutical Affairs Johannesburg, 2003
Transcript of SITUATION ANALYSIS OF DRUG SUPPLY MANAGEMENT IN …

SITUATION ANALYSIS OF DRUG SUPPLY
MANAGEMENT IN TSHWANE
Deusdedit Katetegirwe Mubangizi
IJni-.rniiy of ihr Wi;w*ifr;rj)nd
A research report submitted to the Faculty of Health
Sciences, University of the Witwatersrand,
Johannesburg, in partial fulfillment of the
requirements for the degree of Master of Science in
Medicine in Pharmaceutical Affairs
Johannesburg, 2003

I, Deusdedit Katetegirwe Mubangizi, declare that this research report is my work. It is
being submitted for the degree o f Master o f Science in Medicine in Pharmaceutical
Affairs in the University o f the Witwatersrand, Johannesburg. It has not been
submitted before for any degree or examination at this or any other University.
[Signature o f candidate]
1 day o f g .2003
11

In memory o f my dear mother
Susan B. Katetegirwe
1932 - 1999
ABSTRACT
Tshwane is one o f three metropolitan municipalities in Gauteng Province and a cross
border district with North West Province. Tshwane has a complex Drug Supply
Management system. Gauteng Provincial Authority (GPA), North West Provincial
Authority (NWPA) and City o f Tshwane Metropolitan Municipality (CTMM) play
significant roles. This has resulted in duplication o f duties and inefficient use o f
resources.
The aim of the study was to describe the current Drug Supply Management System in
Tshwane, identify any weaknesses plus the factors responsible for the observed
weaknesses and formulate recommendations for improvement.
It was both a retrospective and prospective observational study using indicators and
structured questionnaires based on those developed by World Health Organisation and
Health Systems Trust. Prospective data was collected between September and
December 2002 while retrospective data covered the period from July 2001 to the day
of data collection (approximately one year).
Major Observations
Based on the WHO drug use indicators, Drug Supply Management in Tshwane was
below performance targets.
• The facilities and conditions for storage for medicines were inadequate.
• The service level o f the pharmacies/sub-depots to primary health care facilities
was low.
• Availability o f drugs was low and key drugs were frequently out o f stock.
• Stock control procedures were inadequate.
• Availability of, and adherence to, standard operating procedures was inadequate.
• The methods used to quantify drug utilization were inadequate.
• The personnel for Drug Supply Management were inadequate in number and
training. Their skills were not appropriately deployed.
• The use o f generic names was very low.
• The use o f antibiotics was high.
• There was inadequate information flow about budget and budgeting processes.
The cadre, training and method o f deployment o f the staff in charge plus availability
o f standard operating procedures had not had a significant impact on the status of
Drug Supply Management in Tshwane (p > 0.05).
IV

Clinics supplied by independent sub-depots were associated with more availability
and less stock out incidences o f key drugs, as compared to those supplied by hospital
pharmacies (p = 0.0024). Use o f a formal method o f quantification o f drug
requirements was associated with more availability and less stock out incidences of
key drugs, as compared to relying only on working experience to quantify drug
requirements (p = 0.01381).
Major Recommendations
The following recommendations were made to improve Drug Supply Management in
Tshwane:
• Ensure that each clinic has a person properly trained in and dedicated to Drug
Supply Management who should be effectively supervised.
• Ensure that each clinic has and uses well-developed standard operating
procedures.
• Formal quantification methods should be developed, standardized and used in all
areas o f management.
• Primary Health Care Facilities should be supplied from an independent Sub-depot
as opposed to a hospital pharmacy.
• Strengthen and increase accountability for drugs up to dispensing level.
• Improve information flow about budget and budgeting process and involve clinic
staff in budget control.
Some o f these recommendations were presented to and accepted by the Tshwane Joint
Task Team on Drug Supply Management, the Health District Joint Management
Team and the Gauteng Health District Forum in 2003.
v
ACKNOWLEDGEMENTS
I sincerely thank the following for their support, which made this study possible:
¥ Prof. Paul Danckwerts and Dr. Gareth Lowndes (Department o f Pharmacy, WITS
Medical School), my academic supervisors for their guidance.
¥ Dr. Faith Kumalo (ISDS facilitator, Tshwane), my field supervisor, for her
valuable guidance at all stages.
¥ All the members o f the Task Team on Drug Supply Management in Tshwane for
their valuable comments and encouragement.
¥ The staff o f the facilities and sub-depots visited for their valuable time and
information that contributed to the success o f this study.
¥ The Initiative for Sub-District Support (ISDS) o f Health Systems Trust that
provided the grant for this study.
¥ Uganda Health Sector Support Programme that financed my studies.
¥ National Drug Authority that granted me study leave.
¥ My family plus all my friends at the University o f Witwatersrand and at National
Drug Authority who constantly encouraged me.
vi

C iY Y O F T S H W A !M E"ws are the same"
SOCIAL DEVELOPMENT: Health Care
Tel: (012) 308-8600 P O Box 234Fax: (012)324-5135 Pretoria
0001
E-mail: [email protected]
2nd floor, Room H2058, Sammy Marks Health Complex, Pretoria
Your re f/U verw: My ref/M y verw:
22 July 2002
Enquiries / Navrae: Dr M Vermaak
To whom it may concern
AUTHORISATION OF MR. DEUS MUBANGIZI TO CONDUCT A SITUATION ANALYSIS OF DRUG SUPPLY MANAGEMENT IN TSHWANE CLINICS
This is to certify that Mr. Deus K.; Mubangizi, a Pharmacist and Masters Student at the University of the Witwatersrand, has been authorized to conduct a situation analysis of Drug Supply Management in Tshwane clipics. This followed a request by the Tshwane Joint Health Management Committee to Health Systems Trust to help in improving Drug Supply Management in Tshwane. He was engaged by Health Systems Trust to conduct the situation analysis.
I have read the protocol and tools to be used to conduct the situation analysis and find no ethical issues. I therefore have no objection to their use. I also understand that Mr. Mubangizi will use some of the data in his Research Report for his Masters Degree at the University of Witwatersrand and hereby confirm that I have no objection to this.
Please accord him all the necessary assistance.
Dr. Mane Vermaak
GENERAL MANAGER: HEALTH CARE
cc. Mr. Deus K. Mubangizi, WITS/HST
cc. Dr. Faith Kumalo, ISDS/HST Coordinator, Tshwane
vu

HEALTH SYSTEMS TRUSTInitiative for Sub-District SupportTel: (011)403 2415/7 Fax: (011)403 2447 [email protected] http://www.hst.org.za
8th Floor Norvic House
93 De Korte Street Braamfontein
PO Box 31059 Braamfontein
2017
24 July 2002
Authorisation of Mr. Deus Mubangizi to conduct a situation analysis of D rue
Supply management in Tshwane District
To whom it may concern
This is to certify that Mr. Deus K. Mubangizi, a Pharmacist and Masters Student at
the University o f the Witwatersrand, has been authorised to conduct a situation
analysis o f Drug Supply Management in Tshwane clinics. This followed a request by
the Tshwane Joint Health Management Committee to Health Systems Trust to help in
improving Drug Supply Management in Tshwane. He was engaged by Health
Systems Trust to conduct the situation analysis.
1 have read the protocol and tools to be used to conduct the situation analysis and find
no ethical issues. I therefore have no objection to their use.
I also understand that Mr. Mubangizi will use some o f the data in his Research Report
for his Masters Degree at the University o f Witwatersrand and hereby confirm that I
have no objection to this. Please accord him all the necessary assistance.
Initiative for Sub-District Support (ISDS)
Health Sytems Trust
Trustees: Marian Jacobs (Chairperson). Nomonde Bam. Trevor Fowler. Selva GovindsamyThembeka Gwagwa. Leslie London. Francie Lund.Zold Njongwe, Pets Qubekd, OJhver Rsnsome, Thdbo oiueKd v ill

Faculty o f H ealth SciencesUNIVERSITY OF THE WITWATERSRAND, JOHANNESBURGW7 York Road PARKTOWN Johannesburg 2193 Telegrams WITSMED Telex 4-24655.SA
FAX 643-4318 TELEPHONE 717-2075/2076 E-M AIL [email protected]
MR D MUBANGIZI NATIONAL DRUG AUTHORITY PLOT 93BUGANDA ROAD KAMPALA.23096
APPLICATION NUMBER 0210458H STATUS ( DEG 105 ) ( MM044 ) PZZ
2002-12-03UGANDA
Dear Mr Mubangjzi
Approval of protocol entitled Situation analysis of drug supply management in Tshwane, Gauteng Province, South Africa
I should like to advise you that the protocol and title that you have submitted for the degree of Master Of Science lu Medicine (Paii-Time).(Cuursework) have been approved by ihe Postgraduate Couimiitee at its recent meeting. Please remember that any amendment to this title has to be endorsed by your Head of Department and formally approved by the Postgraduate Committee.
Dr GJ Lowndes, Prof P Dankwerts has/have been appointed as your supervisor/s. Please maintain regular contact with your supervisor who must be kept advised of your progress.
Please note that approval by the Postgraduate Committee is always green subject to permission horn the relevant Ethics Committee, and a copy o f your clearance certificate should be lodged with the Faculty Office as soon as possible, if this has not already been done.
Yours sincerely
ME Fick (Mrs)Faculty Registrar Faculty of Health Sciences
Telephone 717-2075/2076
Copies - Head of Department____ Supervisor/s
- A trn / n r» n t i r u/A/icitA* xm/ utuj w i f e a r 7 a / o r ? IX

UNIVERSITY OF THE W1TWATERSRAND. JOHANNESBURG
Division of the Deputy Registrar (Research 1
COMMITTEE FOR RESEARCH ON HUMAN SUBJECTS (MEDICAL!Ref: R14/49 Mubangizi
CLEARANCE CERTIFICATE PROTOCOL NUMBER M03-10-24
PROJECT A Situation Analysis of Drug Supply Management in Tshwane, Gauteng Province South Africa
INVESTIGATORS Mr DK Mubangizi
DEPARTMENT School of Therapeutic Sci, Wits Medical School
DATE CONSIDERED 03-10-31
DECISION OF THE COMMITTEE Approved unconditionally
Unless otherwise specified the ethical clearance is valid for 5 years but may be renewed upon applicationThis ethical clearance will expire on 1 January 2008.
* Guidelines for written "informed consent" attached where applicable.
c c Supervisor: Dr G Lowndes
Dept of school of Clinical Medicine' Wits Medical School Works2\lain0015\HumEth97.wdb\M 0 3 .10.24
DECLARATION OF INVESTIGATOR(S)
To be completed in duplicate and ONE COPY returned to the Secretary at Room 10001, 10th Floor, Senate House, University.
l/we fully understand the conditions under which I am/we are authorized to carry out the abovementioned research and l/we guarantee to ensure compliance with these conditions. Should any departure to be contemplated from the research procedure as approved l/we undertake to resubmit the protocol to the Committee. I agree to a completion of a yearly progress form, l/we agree to inform the Committee once the study is completed.
DATE 03-11-20 CHAIRMAN
PLEASE QUOTE THE PROTOCOL NUMBER IN ALL ENQUIRIES
x

TABLE OF CONTENTS Page
Declaration....................................................................................................................... iiDedication........................................................................................................................ iiiAbstract............................................................................................................................. ivAcknowledgements......................................................................................................... viAuthorization from Tshwane Department o f H ealth..................................................viiAuthorization from Health Systems Trust....................................................................viiiApproval by the Postgraduate Assessors Committee for Research..........................ixClearance from the Human Research Ethics Committee (Medical)..........................xTable o f Contents............................................................................................................xiList o f Tables....................................................................................................................xiiiList o f Figures...................................................................................................................xivAbbreviations....................................................................................................................xvGlossary............................................................................................................................xv
1. INTRODUCTION...................................................................................................11.1. Background Information..................................................................................11.2. The Drug Management Cycle...........................................................................51.3. Literature Survey............................................................................................... 71.4. Objectives............................................................................................................91.5. Structure o f the Report.......................................................................................10
2. M ETHODOLOGY.............................................................................................. II2.1. Introduction to the Indicator Methodology...................................................112.2. Study Design........................................................................................................112.3. Sample Size..........................................................................................................15
2.3.1. Selection o f Health Facilities.................................................................152.3.2. Selection o f Prescribing Patient Encounters........................................16
2.4. Planning and Field Assessment Methods.........................................................172.4.1. Assessment o f Facilities for Drug Supply Management.................... 172.4.2. Assessment o f Prescribing Indicators..................................................172.4.3. Assessment o f Logistics Performance Indicators...............................17
2.5. Performance Targets..........................................................................................182.6. Null hypotheses................................................................................................... 182.7. Data Handling and Analysis...............................................................................192.8. Constraints and Limitations.............................................................................. 21
3. RESULTS...................................................................................................................233.1. Sample Characteristics....................................................................................... 233.2. Status o f Drug Supply Management............................................................... 24
3.2.1. Facility Indicators...................................................................................243.2.2. Drug Supply Management Indicators for Sub-depots...................... 253.2.3. Drug Procurement, Availability and Control...................................... 273.2.4. Personnel for Drug Supply Management and their Training............. 283.2.5. Cold Chain Management Indicators....................................................303.2.6. Prescribing Indicators............................................................................30
3.3. Impact o f Various Factors on the Status o f Drug Supply Management.....333.3.1. Effect o f Category o f Staff (Pharmacists’ Assistant versus Nurse) .333.3.2. Effect o f Rotation o f Staff in Charge...................................................34
xi

3.3.3. Effect o f Training in Drug Supply M anagement............................... 363.3.4. Effect o f Training in Rational Drug U se............................................. 373.3.5. Effect o f Training in Cold Chain Management...................................383.3.6. Effect o f Method o f Quantification on availability o f drugs............. 393.3.7. Effect o f Type o f Supplier (Sub depot versus hospital pharmacy) ..403.3.8. Effect o f Availability o f Standard Operating Procedures..................40
4. DISCUSSION............................................................................................................424.1. Status o f Drug Supply Management............................................................... 42
4.1.1. Facility Indicators...................................................................................424.1.2. Performance o f the Main Suppliers o f PHC facilities.......................424.1.3. Procurement, Availability and Control o f D rugs...............................43
4.1.3.1 .Availability o f Standard Operating Procedures.......................... 434.1.3.2. Receiving Procedures...................................................................434.1.3.3. Availability and Use o f Stock C ards........................................... 444.1.3.4. Quantification M ethod................................................................ 454.1.3.5. Availability o f Tracer Drugs and Non-drug Item s......................46
4.1.4. Cold Chain Management Indicators....................................................464.1.5. Prescribing Indicators............................................................................47
4.2. Evaluation o f Various Factors on Drug Supply Management.....................494.2.1. Effect o f Quantification m ethod...........................................................494.2.2. Effect o f Category o f staff: Pharmacists’ Assistant Versus Nurse ..504.2.3. Effect o f Rotation o f staff in-charge....................................................524.2.4. Effect o f Training in Drug Supply Management............................... 534.2.5. Effect o f Training in Rational Drug U se.............................................544.2.6. Effect o f Training in Cold Chain Management...................................55
5. CONCLUSIONS...................................................................................................... 57
6. RECOMMENDATIONS....................................................................................... 58
7. REFERENCES........................................................................................................ 59
8. APPENDICES...........................................................................................................65
8.1. Appendix A: Tables o f Results........................................................................ 668.2. Appendix B: Tools Used for Data Collection.................................................808.3. Appendix C: Schedule and Programme o f field visits................................... 101
xii

LIST OF TABLES Page
Table 1.1 Inefficiency and Waste in Supply o f Drugs in Africa................................. 1
Table 1.2 A Review o f Drug Use Indicators................................................................8
Table 2.1 Basic Parameters o f Different Types o f Drug Use Studies.......................12
Table 2.2 Tracer Standard Operating Procedures.......................................................13
Table 2.3 Tracer Drugs and Non-drug Item s...............................................................14
Table 2.4 Distribution o f Health Facilities by type and Authority............................ 16
Table 2.5 Performance Indicators and Performance Targets.................................... 18
Table 3.1 Distribution o f Clinics in the Planned Sample and those Included in the
Evaluation.........................................................................................................................23
Table 3.2 Indicators for storage facilities..................................................................... 25
Table 3.3 Summary o f indicators for the sub-depots.................................................. 26
Table 3.4 Summary o f Indicators for Drug Procurement, Availability & Control ..27
Table 3.5 Personnel Indicators Related to Drug Supply Management at Clinics....29
Table 3.6 Cold Chain Management indicators............................................................. 31
Table 3.7 Prescribing Indicators for Clinics in Tshwane............................................ 32
Table 3.8 Effect o f the Type o f Staff in charge on DSM Indicators.........................33
Table 3.9 Effect o f Rotation o f Staff on DSM Indicators.......................................... 35
Table 3.10 Effect o f Training in Drug Supply Management......................................36
Table 3.11 Effect o f Training in RDU on Some Drug Use Indicators......................37
Table 3.12 Variation o f Indicators According to the number o f Personnel Trained in
Cold Chain Management.................................................................................................38
Table 3.13 Impact o f Quantification Method on Drug Availability Indicators........ 39
Table 3.14 Drug Supply Indicators at the Clinics According to Type o f Supplier.. 40
Table 3.15 Distribution o f Clinics and Variation o f Indicators According to
Availability o f Standard Operating Procedures..........................................................40
Table A1 Distribution o f Patient Encounters in the Evaluated Clinics.................... 66
Table A2 Facility Indicators for Primary Health Care Clinics in Tshwane...............67
Table A3 Indicators for Drug Procurement, Availability & C ontrol........................68
Table A4 Supplying Primary Health Care Facilities from an Independent Sub-depot
compared to a Hospital Pharmacy.................................................................................70
Table A5 Relationship between Type o f Staff in charge o f Drug Supply Management,
Nature o f Staff Deployment and some Drug Supply Management Indicators........ 71
xiii
Table A6 Effect o f the Number o f Staff Trained in Drug Supply Management on
some Drug Supply Management Indicators.................................................................72
Table A7 Impact o f Determining Re-Order Level or Minimum-Maximum Levels on
Drug Availability Indicators...........................................................................................73
Table A8 Summary o f Qualitative Observations.........................................................74
LIST OF FIGURES
Figure 1.1 Map showing Municipalities o f Gauteng and Tshwane as a Cross-border
D istrict.............................................................................................................................. 3
Figure 1.2 The Drug Management Cycle..................................................................... 5
xiv
ABBREVIATIONS
A B s........... : .................. Antibiotics
C C M .........: .................. Cold Chain Management
CHC.......... : .................. Community Health Centre
CTM M : ..................City o f Tshwane Metropolitan Municipality
D oH .......... : .................. Department o f Health
DSM.......... : .................. Drug Supply Management
D TC .......... : .................. Drug and Therapeutics Committee
E D L .......... : .................. Essential Drug List
EN............. : .................. Enrolled Nurse
EPI........... : ................... Expanded Programme on Immunisation
F E FO ........: .................. First Expiring First Out
FIFO.......... : .................. First In First Out
G PA .......... : .................. Gauteng Provincial Authority
NWPA.......: .................. North West Provincial Authority
PA............. : .................. Pharmacists’ Assistant
P H C .......... : .................. Primary Health Care
PRP........... : .................. Pretoria Regional Pharmacy
RDU.......... : .................. Rational Drug Use
RN............. : .................. Registered Nurse
R O L.......... : .................. Re-Order Level
SO Ps......... : .................. Standard Operating Procedures
STG........... : .................. Standard Treatment Guidelines
WHO......... : .................. World Health Organisation
GLOSSARY
The following terms shall take the following meaning in this study. These are adapted
from world Health Organisation (WHO) '.
a. Generic name shall be the name that appears in the Standard Treatment
Guidelines and Essential Drug List for South Africa.
b. Consultation time shall be duration from beginning to end for individual
consultations. If patients are seen one by one in a consultation room, this will
mean measuring the time between entering and leaving the consultation room.
xv

c. Dispensing time shall be duration from beginning to the end o f patient interaction
with the dispenser. It shall refer to the time from when the patient approaches the
dispensary window to receive medicine to when he or she leaves the window. The
waiting time before the patient hands the prescription in to be filled is not
counted. If medicines are dispensed by the Prescriber in the consultation room, the
time spent in the room shall be taken as the total consultation and dispensing time.
d. Drugs Dispensed, when the drug dispensed is the one prescribed but in quantities
different from the prescription due to low stocks or an institutional policy limit,
shall be counted as if it has been dispensed as indicated, with a special note on the
record form.
e. Drugs Adequately Labelled shall be those drug packages containing at least
patient name, drug name and when the drug should be taken.
f. Adequate Patient’s knowledge about medication shall be when the patient can
demonstrate knowledge o f when and in what quantity each drug actually
dispensed should be taken. Failure to know either o f these two points about any of
the drugs dispensed shall be scored as inadequate patient knowledge. Terms used
to state when drugs should be taken shall relate to actual time intervals. These
shall be evaluated against data written on drug package or prescription form.
g. Availability of Key Drugs. For the purpose o f this indicator, brand name and
generic drugs are chemically equivalent. The quantity in stock shall not be
considered. Even if only one bottle or a few tablets are available, the drug should
be recorded as being in stock. Each formulation, strength and pack size was
considered as a different item even if they contained the same active ingredient.
h. Antibiotics. For the purpose o f assessing the percentage o f encounters with an
antibiotic prescribed, the following classes o f antimicrobial agents, derived from
the WHO Model List o f Essential Drugs, were included in the definition o f an
antibiotic
> Penicillins
> Other antibacterials
> Anti-infective dermatological drugs
> Anti-infective ophthamological agents
> Anti-diarrhoeal drugs with streptomycin, neomycin, nifuraxazide
or combinations
xvi
For clarity, Metronidazole and co-trimoxazole were considered antibiotics but
nystatin was not.
i. Health Facility is used to collectively mean both a Community Health Centre and
a clinic. Primary Health Care Facility and Facility carry the same meaning.
j. Sub-depot means a drug outlet used for distribution o f drugs to public health
facilities within a District or Region within a province. Depot is the equivalent
term at the provincial level.
k. Independent Sub-depot is one neither operationally nor administratively
attached to another health facility. In this respect, a hospital pharmacy that
supplies primary health care facilities is a sub-depot attached to a hospital.
l. Receiving procedures are considered adequate when received stock are off
loaded in a secure cage where it is quarantined and checked against the order,
invoice and delivery note before placing it in the main store. The delivery note
should be in duplicate and both parties must retain a signed copy. Any
discrepancies should be formally reported within a stipulated period.
XVII

1. INTRODUCTION
1.1.Background Information
Medicines are the second highest expense after staff costs in a country's health care
system.2 Availability o f medicines has been shown to enhance utilisation o f health
facilities, the reputation o f health professionals and the entire health care system in
general.3
In many developing countries, a high percentage o f medicine losses occur in the State
procurement, storage, distribution, and utilisation system. The World Bank estimated
that, in Africa, the patient receives only 12 cents out o f every dollar spent by the
Government on medicines 4. Table 1.1 below lists the inefficiencies associated with this
loss. Inefficiency is the major contributor to these losses.
Table 1.1 Inefficiency and Waste in Supply of Drugs in Africa*
PRACTICE WHERE LOSS OCCURS % LOSS
1 Inadequate buying practices 10%
2 Quantification problems 14%
3 Inefficient procurement 27%
4 Inefficient distribution 19%
5 Irrational prescribing 15%
6 Patient non-compliance 3%
Total loss 88%
* Adopted from World Bank Report: Better Health in Africa, 19944.
All these losses that occur in the supply chain add up to 88% o f the original budget
allocated 4.
In South Africa, 80% o f the population are dependent on the Government to provide for
their health care needs, mainly through the Primary Health Care (PHC) Facilities. It is
1

thus crucial for the Government to ensure efficient availability o f essential medicines for
its citizens at the facilities. Currently in South Africa, both Provincial Governments and
Local Authorities operate Primary Health Care clinics. It is Government policy that,
although Primary Healthcare shall remain a responsibility o f the Provincial Government,
implementation should be integrated and devolved to the Local Authorities. The process
o f integration and devolution must be informed by an accurate evaluation o f the current
status o f the facilities and systems operating under the different authorities5.
Tshwane is one o f the metropolitan municipalities in Gauteng Province and a cross border
district with North West Province (Figure 1.1, page 3). It incorporates parts o f Odi and
Moretele districts from North West Province and former City o f Pretoria areas. As a
result, Tshwane has a complex drug supply system with Gauteng Provincial Authority
(GPA), North West Provincial Authority (NWPA) and City o f Tshwane Metropolitan
Municipality (CTMM) playing significant roles. This has resulted in duplication o f duties,
inefficient use o f resources, weaknesses in the Drug Supply Management System6, and
over-expenditure on drugs7.
In Tshwane, two processes o f integration are taking place, namely: -
• Integration o f some clinics formerly under Moretele and Odi districts o f North West
Province into Tshwane, Gauteng Province.
• Devolving implementation o f all Primary Health Care activities at all clinics in
Tshwane to the Local Authority, including those currently operated by the Gauteng
Provincial Government.
Attempts have been made to assess various aspects o f Primary Health Care services in
Tshwane to inform the integration process in Tshwane. Stafford el al carried out an audit
on drug utilisation in Tshwane8. This audit focused on control o f drugs and expenditure.
Its limitations included a limited sample (17 clinics) and standard drug use indicators
were not used. It was carried out by the staff o f the Department o f Health in Tshwane who
2

Figure 1.1 Map showing Municipalities of Gauteng and Tshwane as a Cross-border District 3
are the implemented o f Drug Supply Management (DSM), against a background o f
counter accusations between Provincial and Local Authority stalf. This introduced the
potential o f bias to underestimate the deficiencies for fear o f being blamed for observed
deficiencies. Despite these limitations, the audit pointed out a number o f weaknesses in
Drug Supply Management in Tshwane.
Another survey o f the Information Infrastructure at all the Primary Health Care clinics
and their respective management structures in Tshwane observed that no proper
pharmaceutical stock management systems existed 9. This survey looked generally at all
services with a special focus to Information Technology and communication facilities but
did not give enough attention to Drug Supply Management facilities. It observed that no
proper pharmaceutical stock management systems exist and different ordering, dispensing
and stock control systems were in use which was likely to impact negatively on the future
consolidation o f pharmaceutical systems 9.
Due to persistent problems in Drug Supply Management in Tshwane, the Joint District
Health Management Committee requested Health Systems Trust to assist in improving
Drug Supply Management, among other things. A preliminary report produced by the
Health Systems Trust facilitator in 2001 noted the following problems10: -
• Duplication o f drug supply systems.
• Inadequate numbers, skills and deployment o f staff responsible for Drug Supply
Management.
• Inadequate controls for drugs at different levels o f supply and use.
• Over expenditure on medicines.
According to the report o f the analysis o f Phase 1 o f the Integrated Development Plan o f
City o f Tshwane Metropolitan Municipality7, the actual drug expenditure was projected to
be R8 million compared to a budget o f R4.12 million. This sparked off a dispute between
the Departments o f Health o f the City o f Tshwane Metropolitan Municipality (CTMM)
4

and the Gauteng Provincial Authority (GPA). Officials from the two authorities could not
agree on whether the primary problem was over-expenditure or under-budgeting. A task
team including the Health Systems Trust facilitator was set up to look into the alleged
over-expenditure. The task team rejected the report compiled in 2000 by Stafford et al
because o f its limitations, namely inadequate sample size, methodology, and possible
bias. They recommended that an independent person be engaged to conduct a situation
analysis on Drug Supply Management in Tshwane to confirm the status, identify any
possible weaknesses and make recommendation for improvement. This current research
report is designed to inform the above process.
1.2.The Drug Management Cycle*
Drug management involves four basic functions as shown in Figure 1.2 below, namely:
selection, procurement, distribution and use11.
Figure 1.2 The Drug Management Cycle
* Adopted from Managing Drug Supply, Second Edition, by Quick JD et al MSH and WHO-DAP, p. 15, West Hartford, Connecticut, USA: Kumarian Press".
5

Selection involves reviewing the prevalent health problems, identifying treatments of
choice, choosing individual drugs and dosage forms, and deciding which drugs will be
available at each level o f health care. This has already been done through the Essential
Drug List and the Standard Treatment Guidelines.
Procurement includes quantifying drug requirements, selecting procurement methods,
managing tenders, establishing contract terms, assuring drug quality, and ensuring
adherence to contact terms. The clinics only participate in quantifying drug requirement.
The others are done either at the National, Provincial or Municipality level.
Distribution includes stock control, stores management, delivery to drug depots, sub
depots and health facilities. This is done by the departments o f health at the National,
Provincial or Municipality level, but sometimes, it is outsourced. The clinic health
workers, however, are supposed to control stock and manage stores at the facility.
Use includes diagnosis, prescribing, dispensing and proper consumption by the patient.
Each function builds on the previous one and leads logically to the next. Costs rise,
shortages become common, and patients suffer when the separate tasks are performed not
as part o f a system but independently and disjointedly. The management support systems
at the centre o f the cycle, which include physical facilities, organisation, financing,
information management, and human resource management, hold the drug management
cycle together. The entire cycle rests on a policy and framework that establishes and
supports the public commitment to essential drug supply.
To ensure an effective Drug Supply Management, all aspects o f the drug management
cycle must be regularly assessed individually and collectively, using objective indicators
and specific performance targets. World Health Organisation (WHO) has come up with
such Drug Supply Management Indicators and Performance Targets. These will be
discussed in more detail while discussing the methodology.
6
In many parts o f the world, studies have been conducted using WHO Drug Supply
Management Indicators. Table 1.2 (page 8) is a review o f the indicator values, which have
been observed in the countries indicated . Indicators were used to mcrease awareness
among prescribers in Malawi13 and Bangladesh14; to identify priorities for action (e.g.,
polypharmacy in Indonesia14 and Nigeria15, overuse o f injections in Uganda16, Sudan17
and Nigeria15, and low percentage o f patients who understood the dosage schedule in
Malawi ); and to quantify the impact o f interventions in Yemen , Uganda , Sudan ,
and Zimbabwe19.
In Northwest Ethiopia, drug use indicators for health centres and health stations were
found to be similar despite differences in manpower20. In Nigeria, an indicator study was
used to describe the current drug use practices at a general hospital and gather baseline
data for use in designing an intervention to improve the drug use profile .
In a randomised controlled indicator study in Zimbabwe, while training o f health workers
throughout the country in drug management (including stock management and rational
drug use) resulted significant improvements in a variety o f drug supply management
indicators; these achievements could not be sustained until a further intervention of
support supervision was introduced .
In Kampong Thom Province o f Cambodia an indicator study was used to obtain baseline
information for the design o f a strategy to address irrational prescribing practices . In
Niger, an indicator study that was used to evaluate an essential drugs and costs recovery
programme, increasing prescription costs were attributed to overuse o f injections,
polypharmacy and poor compliance with standard treatment guidelines24. In addition,
training courses seemed to have a limited impact on prescribing patterns for nurses.
An indicator study was used to assess the proportion o f primary care physician offices in
four cities in USA25 meeting vaccine storage guidelines, identify factors associated with
1.3.Literature Survey
7

Table 1.2 A Review of Drug Use Indicators
Country BAN CAM ECU GHA GUA IND MAL MOZ NEP NIG SUD SWA TAN UGA UGA YEM ZIMDate (mm/yy) 08/91 10/92 10/92 07/91 06/91 05/92 02/92 05/91 02/92 09/90 03/94 03/88 07/91
No o f facilities 20 20 19 20 10 20 72 26 20 20 37 20 20 42 127 19 56
Reference 14 11 29 11 11 14 13 11 28 15 17 11 27 16 26 18 19
INDICATORS
Av. Drugs/Patient 1.4 3.0 1.3 4.3 1.4 3.3 1.8 2.2 2.1 3.8 1.4 3.0 2.2 1.9 2.4 1.5 1.3
% Patients given ABs 31% 51% 27% 47% 27% 43% 34% 43% 43% 48% 63% 54% 39% 56% 53% 46% 29%
%Patients given INJTs 0.2% 41% 17% 56% 13% 17% 19% 18% 5% 37% 36% 38% 29% 48% 36% 25% 11%
%Drugs by Generic name 58% 37% 59% 72% 59% 99% 44% 58% 63% 63% 82% 86% 94%
% drugs on the EDL 86% 88%
Av. consultation (Min) 3.0 2.3 3.7 3.5 6.3 6.1 3.0
Av. Dispensing time (Sec) 86.1 12.5 77.8
%Patients know dosing 63% 82% 27% 82% 56% 81% 87% 75% 29%
% drugs actually dispensed 83% 70%
% o f tracer drugs in stock 38% 67% 87% 90% 62% 92% 72%
KEY: BAN = Bangladesh, CAM = Cameroon, ECU = Ecuador, GHA = Ghana, GUA = Guatema a, IND = Indonesia, MAL = Ma awi, MOZ = Mozambique, NEP = Nepal,
NIG = Nigeria, SUD = Sudan, SWA = Swaziland, TAN = Tanzania, UGA = Uganda, YEM = Yemen, ZIM = Zimbabwe,
ABs = Antibiotics, Av. = Average, INJTs = Injectables, Min = Minutes, Sec = Seconds.
Adopted from Rational Drug Use in Rural Health Units of Uganda: Effect of National Standard Treatment Guidelines on Rational Drug Use, Kafuko et at, p.3, Marianum Press, 199617; Managing Drug Supply, Second Edition, MSH and WHO-DAP, p.437, Kumarian Press" , and How to investigate drug use in health facilities: Selected drug use indicators, WHO/DAP/93.f.
8

low compliance, and evaluate whether a quality improvement activity improves
compliance. Adherence to guidelines improved after the intervention, especially with
respect recording fridge temperature and avoidance o f storage o f vaccine in the fridge
door.
WHO Drug Supply Management Indicators were the basis o f the guidelines
developed by Andy Gray and David McCoy, on behalf o f Health Systems Trust, for
performing a situation analysis o f Drug Supply Management Systems in South
Africa30,31. These guidelines and indicators have also been validated and used to
conduct studies in South Africa32'34.
From the above literature review it can be noted that Drug Supply Management
Indicators are very versatile and can be used to generate useful information about the
entire drug management cycle under a variety o f settings.
1.4.0bjectives
The specific objectives o f this study are: -
• to describe the status o f the current Drug Supply Management system(s) in
Tshwane using the WHO and Health Systems Trust Drug Supply Management
indicators,
• to measure the gap between the currents status and target indicators,
• to identify the factors responsible for any observed weaknesses, and
• to formulate recommendations for the improvement o f Drug Supply
Management systems.
9

The report is organised in five chapters. The first chapter is dedicated to the
description o f the study subject, the objectives o f the study, justification o f the study
and literature review.
The second chapter covers a description o f the methodology, sampling, data
management, the hypotheses tested and the limitations o f the study.
Results o f the study are reported in the third chapter. It begins with a description o f
characteristics o f the sample evaluated. This is followed by a report on the status o f
Drug Supply Management and the results o f the assessment o f the impact o f various
factors as laid out in the hypotheses.
The fourth chapter covers discussion o f results. Results are compared with standard
performance targets to identify gaps, if any. The reasons for the gaps are analysed
using the null hypotheses.
The fifth chapter includes the recommendations and conclusion. A list o f references
comes after the fifth chapter. All bulky tables o f results and the tools used in the study
are included in the appendices.
1.5.Structure of the Report
10
2. METHODOLOGY
2.1.Introduction to the Indicator-Based Methodology
Given the lack o f consensus on the extent o f the problems associated with Drug
Supply Management in Tshwane and in the absence o f independent and reliable
information specific to the area, a new situation analysis using the WHO1 and Health
Systems Trust ’ indicator based tools was needed.
The International Network for Rational Use o f Drugs (INRUD) and WHO-Drug
Action Programme have come up with Drug Supply Management Indicators, which
can be adopted in a study o f drug use1’1 . An indicator is defined as a criterion used to
measure changes, directly or indirectly, and to assess the extent to which the targets
and objectives o f a programme are being attained. Indicators should meet the criteria
o f clarity, usefulness, measurability, reliability, validity and be acceptable to key
stakeholders. These indicators measure key aspects o f the Drug Management Cycle.
They are reliable, highly standardised and are accompanied by a standard
methodology to collect data. Data collected through the indicators can be compared
with studies in other facilities, countries, or performance targets.
The purpose o f each indicator, which was used in this study, is outlined in Appendix
B1 (page 81). The various sub-groups o f the indicators cover the different aspects of
the drug management cycle
2.2.Study Design
Taking into consideration the background to the study, the study objectives and the
resource constraints, a basic cross-sectional study design was used. The guidelines for
basic parameters o f the different types o f drug use studies as recommended by WHO1
are outline in Table 2.1 (page 12).
11
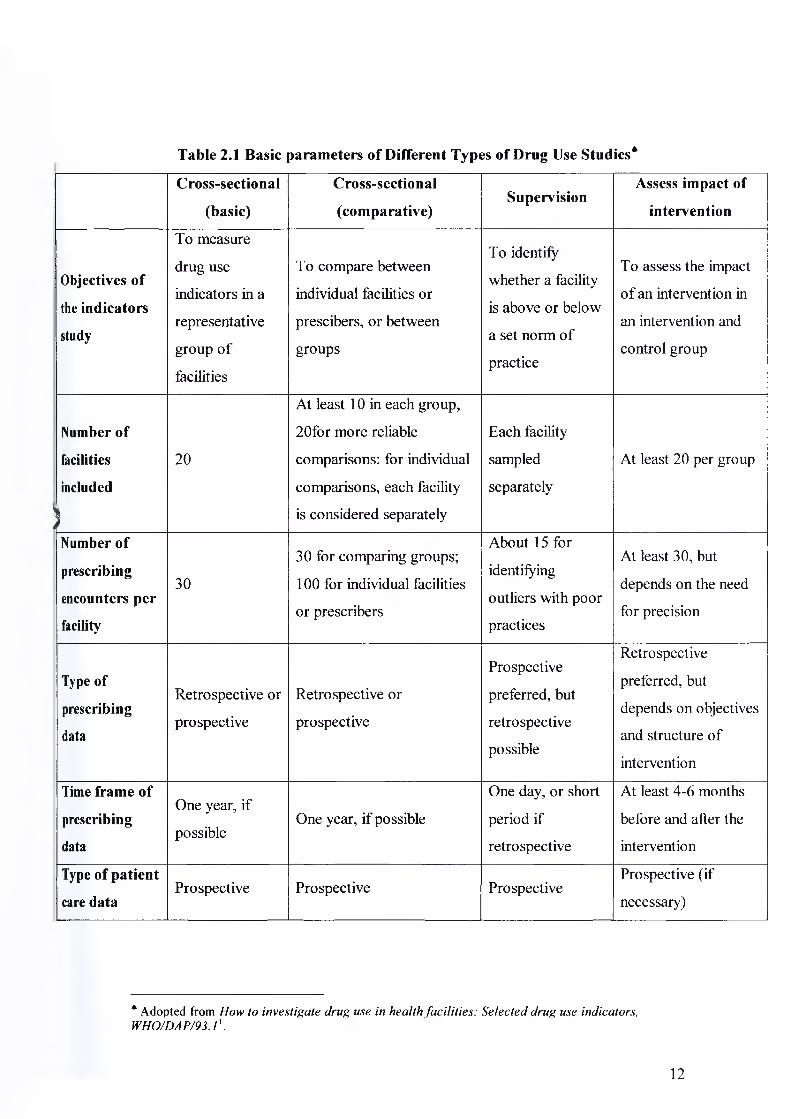
Table 2.1 Basic parameters of Different Types of Drug Use Studies4
Cross-sectional
(basic)
Cross-sectional
(comparative)Supervision
Assess impact of
intervention
Objectives of
the indicators
study
To measure
drug use
indicators in a
representative
group of
facilities
To compare between
individual facilities or
prescibers, or between
groups
To identify
whether a facility
is above or below
a set norm of
practice
To assess the impact
o f an intervention in
an intervention and
control group
Number of
facilities
included
1
20
At least 10 in each group,
20for more reliable
comparisons: for individual
comparisons, each facility
is considered separately
Each facility
sampled
separately
At least 20 per group
Number of
prescribing
encounters per
facility
30
30 for comparing groups;
100 for individual facilities
or prescribers
About 15 for
identifying
outliers with poor
practices
At least 30, but
depends on the need
for precision
Type of
prescribing
data
Retrospective or
prospective
Retrospective or
prospective
Prospective
preferred, but
retrospective
possible
Retrospective
preferred, but
depends on objectives
and structure of
intervention
Time frame of
prescribing
data
One year, if
possibleOne year, if possible
One day, or short
period if
retrospective
At least 4-6 months
before and alter the
intervention
Type of patient
care dataProspective Prospective Prospective
Prospective (if
necessary)
* Adopted from How to investigate drug use in health facilities: Selected drug use indicators, WHO/DA P/93.11.
12
The methodology adopted was an indicator based retrospective and prospective
observational study. Qualitative and quantitative assessment was done through the
review o f historical data, interviews and meetings with key players, and direct
observation o f current practice.
The tools which were used to collect and analyse data were adapted from those
developed by World Health Organisation (WHO) 1 and Health Systems Trust3031.
These included the following: -
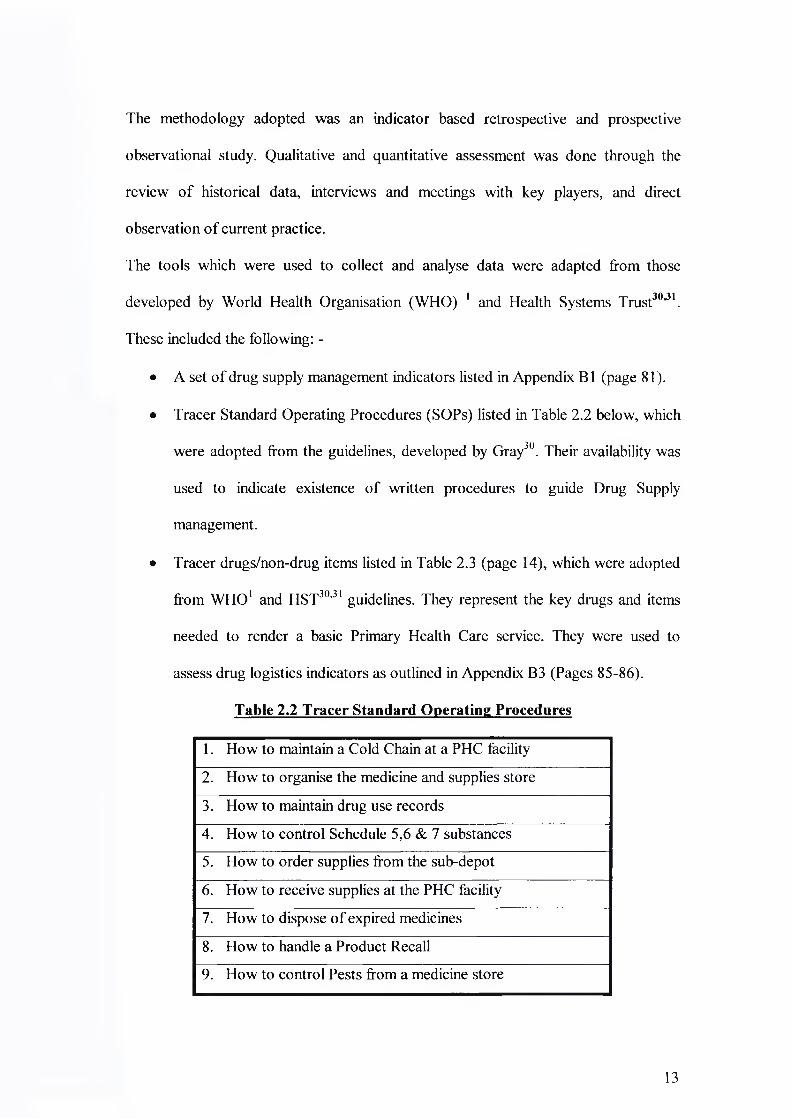
• A set o f drug supply management indicators listed in Appendix B 1 (page 81).
• Tracer Standard Operating Procedures (SOPs) listed in Table 2.2 below, which
were adopted from the guidelines, developed by Gray30. Their availability was
used to indicate existence o f written procedures to guide Drug Supply
management.
• Tracer drugs/non-drug items listed in Table 2.3 (page 14), which were adopted
from WHO1 and HST30'31 guidelines. They represent the key drugs and items
needed to render a basic Primary Health Care service. They were used to
assess drug logistics indicators as outlined in Appendix B3 (Pages 85-86).
Table 2.2 Tracer Standard Operating Procedures
1. How to maintain a Cold Chain at a PHC facility
2. How to organise the medicine and supplies store
3. How to maintain drug use records
4. How to control Schedule 5,6 & 7 substances
5. How to order supplies from the sub-depot
6. How to receive supplies at the PHC facility
7. How to dispose o f expired medicines
8. How to handle a Product Recall
9. How to control Pests from a medicine store
13

Table 2.3 Tracer Drugs and Non-Drug Items*
Drugs
Amoxycillin caps 250mg 15s Glibenclamide tabs 5mg 28s
Amoxycillin caps 250mg 30s Glibenclamide tabs 5mg 56s
Amoxycillin caps 250mg 100s Glibenclamide tabs 5mg 500s
Amoxycillin susp 125mg/5ml 100ml Metronidazole tabs 200mg 28s
Ciprofloxacin tabs 500mg 10s Metronidazole tabs 200mg 21s
Penelente injection 2.4 mU Metronidazole tabs 200mg 250s
Paracetamol Syrup 120mg/5ml 50ml Paracetamol tabs 500mg 10s
Paracetamol Syrup 120mg/5ml 100ml Paracetamol tabs 500mg 20s
Ibuprofen tabs 200mg 15s Paracetamol tabs 500mg 500s
Ibuprofen tabs 200mg 28s Adrenaline injection
Ibupro fen tabs 200mg 42s ORS Sachets
Ibuprofen tabs 200mg 56s Salbutamol inhaler
Ibuprofen tabs 200mg 1000s Tetanus Vaccine
HCTZ tabs 25mg 14s Ringers Lactate IV
HCTZ tabs 25mg 28s
HCTZ tabs 25mg 500s
Non-Drug Items
IV Admin. Set 10 Drops Insulin syringe 0.5ml
IV Admin. Set 15 Drops Syringe 2ml
IV Admin. Set 20 Drops Blue Needles (EPI)-lOOs
IV Admin. Set 60 Drops Gloves non-sterile small-100s
Glucose/Ketones Test Strip Gloves non-sterile medium-100s
Insulin syringe 1ml Gloves non-sterile large-10s
* Adopted from WHO and Health Systems Trust guidelines1'30, as well as the NMTTS study32 and adapted to the study with input from the Health staff of Tshwane. The different pack sizes were assessed separately because in most cases, they reflected a different treatment guideline
14

• Structured questionnaires for the Facility Manager (Appendix B4, page 87)
and Sub-depot Manager (Appendix B5, page 93). These were adopted from
HST guidelines30 and were used to collect general information about
personnel, physical facilities, and routine operations.
These tools have been tested locally32'34and internationally1’11,12,26 and standardised to
generate reliable and comparable data. They were adapted to the study through
comments by health staff o f Tshwane and a pilot study at two clinics in Tshwane.
These included considering different pack sizes o f different drugs and non-drug tracer
items because these represented different indications. Blue needles for immunisation
were added since immunisation was one o f the main activities o f the local authority
clinics.
2.3.Sample Size
2.3.1. Selection of Health Facilities
There were four sub-depots (two Independent Sub-depots and two Hospital
pharmacies) and fifty-eight Primary Health Care facilities in Tshwane at the time.
WHO guidelines for a basic cross-sectional study design require a sample o f at least
twenty Health facilities. However, at the request o f the Tshwane Drug Task Team, all
the facilities were included in the study in order to avoid the limitation o f inadequate
sample size associated with the audit done by Stafford et a f. Apart from Moretele
District, the clinics under other authorities were more than 10 as shown in Table 2.4
(page 16), which would allow comparisons between authorities as recommended
under the WHO guidelines1 (Table 2.1, page 12).
15

Table 2.4 Distribution of Health Facilities by Type and Authority
Authority Pharmacy No. of Clinics No. of CHC Total No. of Clinics
Gauteng PRP 14 3 17
CTMM CTMM Sub-depot 22 0 22
Moretele Jubilee Pharmacy 5 3 8
Odi Odi Pharmacy 8 3 11
Total 4 49 9 58
PRP = Pretoria Regional Pharmacy, CTMM = City o f Tshwane Metropolitan
Municipality, CHC = Community Health Centre
2.3.2. Selection of Patient Prescribing Encounters
Prescribing encounters were sampled retrospectively by drawing random encounters
from historical medical records over a period o f one year from date o f survey. At
least thirty encounters per clinic were randomly selected as follows 1: -
a. The chronological listings, by date, o f all patient visits made during the past
year were identified either from the Clerks’ Attendance Registers or Daily
Clinic Registers maintained by Prescribers.
b. The sampling interval was calculated by dividing the number o f days in the
sample frame (365 days) by the number o f encounters to be selected (30). i.e.
365/30=12.2.
c. Sampling began at the first day in the chronological sample frame, i.e. 1st day,
(1+12.2=13.2, rounded up) 14th day, (13.2+12.2=25.4, rounded up) 26th day,
and so forth.
d. From each selected day a single encounter was picked at random by
multiplying the total number o f encounters listed for that day by a random
number between 0.0 and 1.0, and rounded upwards.
Step (b) to (d) were performed quickly using Microsoft Excel computer programme.
1 6

A pilot study was done at Laudium Community Health Centre and East Lynne in
order to clarify data sources, the suitability o f the tools and estimate the time required
to collect data per facility. The pilot study indicated that one day per clinic and two
days per Community Health Centre (CHC) was optimal for data collection. A
schedule o f visits, including a proposed programme o f the day at the facility, was
made available to all the health facilities included in the study (Appendix C, page
101). A telephone call was made to the clinic at least one week prior to the visit to
confirm suitability o f the scheduled date.
2.4.1. Assessment of Facilities for Drug Supply Management
On the day o f the visit to the facility, a questionnaire in Appendix B4 (page 87) was
administered to the person in-charge o f the health facility. A guided tour o f the health
facility was made to assess the availability and condition o f the facilities for Drug
Supply Management. Findings were recorded on the structured questionnaire.
2.4.2. Assessment of Prescribing Indicators
A sample o f thirty prescribing encounters from records o f patients who attended the
facility during the past year was randomly selected and the details per encounter
recorded directly on computer in the prescribing indicators form as shown in
Appendix B2 (page 84).
2.4.3. Assessment of Logistics Performance Indicators
Stock cards, delivery notes and invoices were reviewed and a physical count was done
to collect information on each tracer item as outlined on Logistics Performance
Indicators form (Appendix B3, pages 85 - 86). The findings were recorded on the
same form.
2.4.Planning and Field Assessment Methods
17

2.5.Performance Targets
Performance targets as listed in Table 2.5 below were used to assess Drug Supply
Management in Tshwane. They were adopted taking into consideration the following:
• Recommendations from WHO1
• Examples o f targets used in earlier studies in South Africa32‘34and other
. 11 l?countries '
• Principles o f the South African National Drug Policy35 (and the Essential
Drugs Programme) as interpreted in the Standard Treatment Guidelines (STG)
and Essential Drug list (EDL)36.
Table 2.5 Performance Indicators and Performance Targets
Performance Indicator Performance Target
Average number o f drugs prescribed per patient <2
% o f drugs prescribed by generic name 100%
% o f patient-encounters with an antibiotic prescribed <25%
% of patient-encounters with an injection prescribed <15%
% o f prescribed drugs that are on the EDL 100%
% of ordered items that are supplied within the stipulated schedule >95%
% o f tracer items in stock >90%
% of tracer items out o f stock at least once in a year <10%
% of tracer items where physical stock = quantity on record 100%
2.6.Null Hypotheses
The following hypotheses were used to identify the factors responsible for the
weaknesses observed. These were based on the preliminary discussions by the
Tshwane Drug task Team.
18

i. The category o f staff responsible for Drug Supply Management does not affect
the status o f Drug Supply Management at the clinic, as measured using WHO
and HST Drug Supply Management Indicators
ii. The number o f staff trained in Drug Supply Management, Rational Drug Use
(RDU) and Cold Chain Management (CCM) has no impact on the status o f
Drug Supply Management, as measured using WHO and HST Drug Supply
Management Indicators
iii. Rotation o f the person in-charge o f Drug Supply Management has no impact
on the status o f Drug Supply Management, as measured using WHO and HST
Drug Supply Management Indicators
iv. A formal quantification method does not improve availability o f drugs at the
clinic
v. There is no difference in availability o f drugs between clinics supplied by
independent pharmacies (sub-depots) and Hospital pharmacies.
2.7.Data Handling and Analysis
The unit o f analysis was the health facility. All filled questionnaires and forms were
checked on the day o f data collection for accuracy, consistency and adequacy. They
were then kept in a dedicated file. All data on the standard indicator forms was
entered in similar forms in Microsoft Excel Program on the computer. From these
forms, health facility summaries were calculated and entered on the Drug Supply
Management Indicators Consolidation form (Appendix B6, page 100). Qualitative and
quantitative data from the questionnaires was summarized on the Qualitative Data
Summary form as shown in Table A8 (pages 74).
The discussion o f results followed indicator groups. First the expected performance
standard was briefly described followed by a comparison o f results with standard
19

performance targets and observations from other studies done in South Africa and
other countries. The following statistics were used to analyze the data: -
• Descriptive statistics to describe the status o f Drug Supply Management .
• Pearson correlation coefficient, r, to assess whether there was a relationship
between the number o f staff trained and some quantitative indicators. This
indicates the measure o f intensity o f linear relationship between two variates. It
varies from -1 to +1 corresponding to perfect negative correlation and perfect
"5*7
positive correlation . A positive correlation indicates that the variables increase
together, while a negative correlation indicates that as one variable increases, the
other decreases38.
• For comparison between groups, the following were used ’ : -
> The two-sided F test for a difference between two independent variances.
> The two-sided t test for a difference between two independent means.
> The two-sided z test or upper tail %2( 1) test for a difference between two
independent proportions, as applicable.
Calculations were performed manually and crosschecked using Microsoft Excel
Program for those statistics supported by the program. A 5% level o f significance
(95% confidence level) was used as expected from this WHO methodology1. The
differences were noted in their absolute terms but were only considered significant if
p>0.05. However, Utts cautions that a very strong relationship will not necessarily
achieve statistical significance if the sample is small38.
There was justification to assume the same level o f confidence since the WHO
methodology was used and the sample o f health facilities and patient encounters
evaluated was more than the recommended minimum.
20

2.8.Constraints and Limitations
i. Although the target was to cover fifty-eight health facilities in Tshwane, only
thirty-nine were covered. Three facilities, though visited, were not included in the
analysis because they belong to Metsweding and not Tshwane. Some facilities
were not visited either because the key personnel or researcher was not available
on the scheduled date. The data collection was terminated prematurely at the
request o f the sponsor following a presentation o f an interim analysis.
Nevertheless, data from thirty-six health facilities (62%) was analysed and twenty
facilities is the minimum number required for a basic cross-sectional design,
which was used in this study1. Therefore, the accuracy and reliability attained in
this study is likely to be better than that anticipated through the WHO
recommended sample size and methodology1. The remaining limitation is that
these facilities were not randomly selected. For a comparative cross-sectional
analysis, it is recommended that each group should have at least ten facilities
(Table 2.1, page 12). This was not the case for Moretele (six) and Odi (five)
districts. Therefore, the trends rather than the absolute figures should be
considered where comparison between authorities is made. In order to make some
group comparison, the option was to consider clinics under Moretele and Odi
districts as one group. Although this would make sense (since they all belong to
North West Province), the fact that they are supplied from different sources may
impart intra-group differences.
ii. The records o f all patients seen on the selected day were not always available. In
some cases, the patients were listed in several books and there was no clear
chronological order to use in sampling. All the available records o f the day were
nevertheless used in the sampling. Since the recording by the clerks was random,
21

absence o f one book from one clerk could not have had any significant effect on
the sampling plan.
iii. The actual date o f ordering stock could not be ascertained at some facilities.
Facilities often ordered early so that their order could reach the sub-depot by the
scheduled date. In such incidences, the scheduled order date was used. This would
mean that the actual lead time was longer than observed. Since the observed lead
time was longer than the ideal target o f seven days (five working days), the
observations made about lead time are still valid.
iv. In assessing whether the drug prescribed was on the Essential Drug List (EDL),
only the name was considered. The study did not assess whether the prescription
complied with the Standard Treatment Guidelines for Primary Health Care
facilities in respect to indication, dose and duration o f treatment. This is an area
for further study.
v. The study did not assess the linkage between the type o f prescriber and the
prescribing indicators. The Ugandan study by Kafuko et al, 26 showed that the type
o f prescriber had an influence on the observed prescribing indicators. This is an
area for further study.
vi. Data was collected based on the cross-sectional descriptive study as requested by
the Tshwane Drug Task Team, without specifically catering for the hypotheses
that have been included for the purpose o f the research report. The sample size in
some comparison groups was too small to allow use o f certain statistical tests.
Nevertheless, use o f appropriate statistical analysis and interpretation with caution
has ensured that the conclusions made are valid. Utts states that strong
relationship will not necessarily achieve statistical significance if the sample is
very small38. This should be borne in mind when interpreting the p values.
22

3. RESULTS
Prospective data was collected between September and December 2002 while
retrospective data covered the period from July 2001 to the day o f data collection
(approximately one year). Results are reported in three major sections. The first one
gives the characteristics o f the sample included in the evaluation. The second section
gives the status o f Drug Supply Management presented according to indicator groups.
Each section on indicator group begins with a table o f results followed by text
highlighting key findings. The third section presents results according to the factors
being evaluated under the null hypotheses.
3.1.Sample Characteristics
Table 3.1 below shows the distribution o f clinics in the planned sample and those
included in the evaluation.
Table 3.1 Distribution of Health Facilities from which Data was Analysed
Authority Pharmacy Unit No. of Clinics No. ofCHCs Total
No %
Gauteng PRPPlan 14 3 17 29.3%
Actual 8 3 11 30%
CTMM CTMM Sub- depot
Plan 22 0 22 37.9%Actual 14 0 14 38.9%
Moretele JubileePharmacy
Plan 5 3 8 13.8%Actual 4 2 6 16.7%
Odi Odi PharmacyPlan 8 3 11 19.0%
Actual 2 3 5 13.9%
Total 4Plan 49 84.5% 9 15.5% 58 100%
Actual 28 77.8% 8 22.2% 36 62%
Data from all four sub-depots and thirty-six health facilities (62%) was analysed.
These are more than the minimum o f twenty required for a basic cross-sectional study
design as recommended by WHO1. However, only Gauteng Provincial Authority and
23

City o f Tshwane had more than the minimum ten clinics to allow comparison between
the groups1. The proportion o f clinics by type and authority in the analysed sample
did not differ significantly from the population (p >0.05) (table 3.1, page 23).
Table A1 (page 66) shows that a total o f 1286 patient encounters were analysed in the
whole study out o f which 965 (75%) were retrospective and 321 (25%) were
prospective. This is well above the required 600 patient encounters to achieve
sufficiently accurate and reliable estimates'.
3.2.Status of Drug Supply Management
This section includes indicators for the resources required for effective Drug Supply
Management (facility indicators; control o f medicine budget indicators; efficiency of
suppliers indicators; drug procurement, availability and control indicators; personnel
indicators) and the core drug use indicators (Cold Chain Management indicators,
Prescribing indicators and Patient Care indicators).
3.2.1. Facility Indicators
The facility indicators are presented in Table A2 (page 67) and summarized in Table
3.2 (page 25). The phrasing o f the indicator in the heading shows the expected norm.
The following observations have been singled out for mention because they depend
on the human factor and were used later to assess the differences between groups.
• In 38.9% o f the clinics stock was found placed directly on the floor.
• Restricted access to the drug store was practiced at 44.4% o f the clinics.
From qualitative observations, it was noted that most facilities under the City o f
Tshwane did not have a store separate from the dispensary. Although most facilities
under Gauteng Provincial Authority had a drug store, they did not have a central
dispensary and so used the consultation room for dispensing.
24
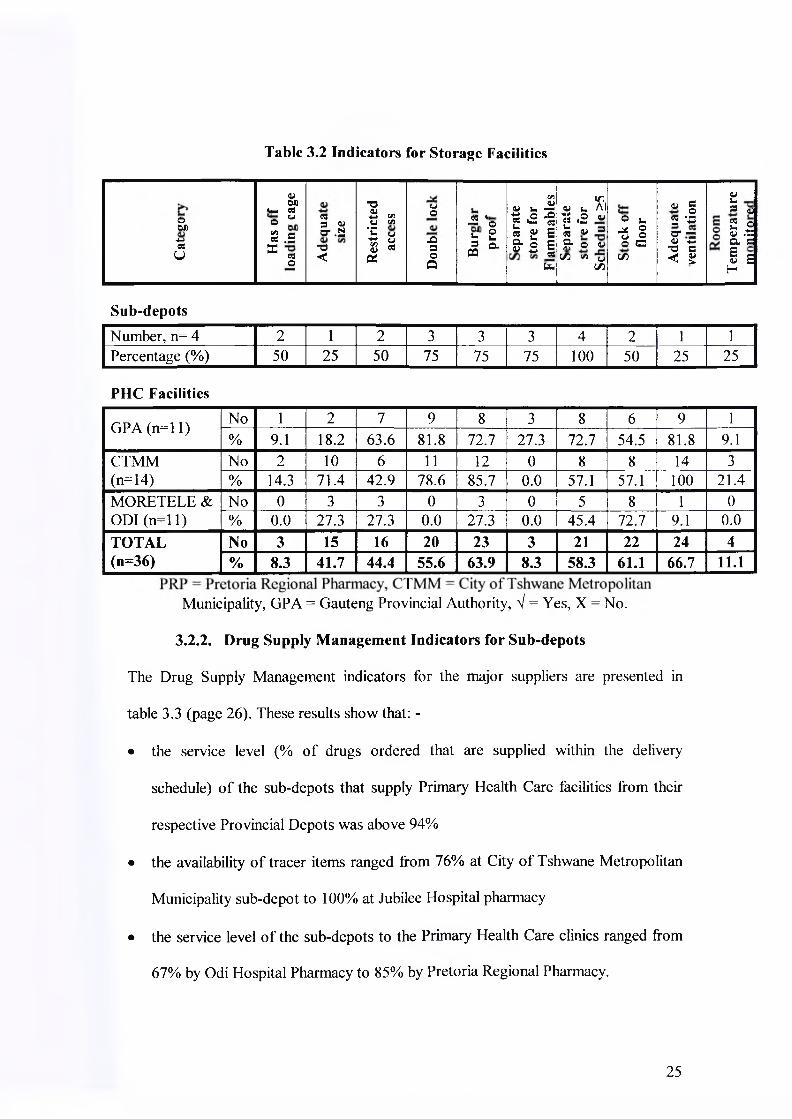
Table 3.2 Indicators for Storage Facilities
oOU-4-»CSu
01 OX) l*. C6o w- ca .5X
03o
C33 Va- .2 -o <
-oa>+ 5 C/5u ^•p£ g 8 * X
CJo
-O3OX
-2 *©£ 23 ClX
C/ia>« u -r1<2 ■§ « g S & 2 |
fa
<u u 1̂ts ,2 « £ « = S" O 4J
C/3 s« uC/3
O u .* ® ° 5O CC/3
0) c o5 '•=U“ ~<y -C ■o a< 2
V u® 442 © a) .t: a cE e0) cH
Sub-depotsNumber, n= 4 2 1 2 3 3 3 4 2 1 1Percentage (%) 50 25 50 75 75 75 100 50 25 25
PHC Facilities
GPA (n = ll) No 1 2 7 9 8 3 8 6 9 1% 9.1 18.2 63.6 81.8 72.7 27.3 72.7 54.5 81.8 9.1
CTMM(n=14)
No 2 10 6 11 12 0 8 8 14 3% 14.3 71.4 42.9 78.6 85.7 0.0 57.1 57.1 100 21.4
MORETELE & ODI (n = ll)
No 0 3 3 0 3 0 5 8 1 0% 0.0 27.3 27.3 0.0 27.3 0.0 45.4 72.7 9.1 0.0
TOTAL(n=36)
No 3 15 16 20 23 3 21 22 24 4% 8.3 41.7 44.4 55.6 63.9 8.3 58.3 61.1 66.7 11.1
Municipality, GPA = Gauteng Provincial Authority, V = Yes, X = No.
3.2.2. Drug Supply Management Indicators for Sub-depots
The Drug Supply Management indicators for the major suppliers are presented in
table 3.3 (page 26). These results show that: -
• the service level (% o f drugs ordered that are supplied within the delivery
schedule) o f the sub-depots that supply Primary Health Care facilities from their
respective Provincial Depots was above 94%
• the availability o f tracer items ranged from 76% at City o f Tshwane Metropolitan
Municipality sub-depot to 100% at Jubilee Hospital pharmacy
• the service level o f the sub-depots to the Primary Health Care clinics ranged from
67% by Odi Hospital Pharmacy to 85% by Pretoria Regional Pharmacy.
25

Table 3.3 Summary of Drug Supply management Indicators for the Sub-depots
IndicatorPretoriaRegional
Pharmacy
CTMMsub-depot
JubileeHospital
Pharmacy
OdiHospital
Pharmacy
CurrentStaffing
Pharmacists 7 1 3 3Pharmacist’sAssistants 4 5 8 12
Others 15 13 6 4
Supplier Auckland ParkAuckland
Park/PrivateSuppliers
VunaHealthcareLogistics
VunaHealthcareLogistics
Facilitiessupplied
Clinics 22 31 26 23Other public 32 6 2 1Psych drugs scripts/month -6000 0 0 0
Private 250 89 0 0Mean supplier Lead time in days (Range)
37(7 to 215)
15(1 to 45)
2(2 to 3)
4(4 to 4)
Ordering interval in days (Range)
88(13 to 378)
97(7 to 276) - 8
(7 to 13)% last order supplied 100 120* - 94% Tracer drugs in stock 85 76 100 97% items o/s in past yr 60 21 - -
% ROL determined 100 100 100 100Inventory control Stock cards Stock cards Computer ComputerStock/card=Stock/shelf 50% - - -
Storage conditions Inadequate Adequate Inadequate FairLead time to clinics 8 14 12 8No o f items on supply list 406 627? 245* 245*
Service level to clinics(%)
85 81 77 67
Prepackaging Fair Adequate Inadequate FairOperate “Back order” No Yes Yes No% o f Expired/Budget for 2001/2 R24,776,251^ 220% R8,274,000^ 122%
Value o f expired drugs in Rands (%Budget) in2001/2
~R500,000(2%)¥
Notavailable
R18,936.02£(0.23%)£
R13,584.61 (0.20%)
figures for 2001/2 not available, figures are for expenditure, figu re for expire drugs from April to October 2002 and % of expenditure over the same period. ^Figure includes 75 bulk packs, 16 duplicate factory & pre-packed patient packs, and non-medical items. vAs a percentage of expenditure, * Includes back orders because system could not differentiate backorders from current order, CTMM Psychotropic
City of Tshwane Metropolitan Municipality. Psych
26
The indicators and performance targets for drug procurement, availability and control
are presented in Table A3 (page 68) and summarized in Table 3.4 below.
Table 3.4 Summary of Indicators for Drug Procurement, Availability & Control
3.2.3. Drug Procurement, Availability and Control Indicators
(Summarised from Table A3, page)
Faci
lity
Has
all
SOPs
Rec
eivi
ngpr
oced
ures
Lead
Tim
e (d
ays)
% O
rder
Su
pplie
dO
rder
ing
Inte
rval
(day
s)
%0/
S in
yea
r
Qua
ntifi
catio
n M
etho
d U
sed
%of
item
s w
hich
had
RO
L
% in
Sto
ck o
n st
udy
day
Use
sto
ck c
ards
%C
ard=
Shel
f
Mean 11.2 79.0 56.1 33.1 33.8 87.6 55.9
Maximum 23.2 97.7 126.4 83.3 100.0 100.0 100.0Minimum 3.4 57.7 16.5 0.0 0.0 70.0 8.3PerformanceTarget Yes Adequate - >95 - <10
ROL/Min-Max 100 >90 Yes 100
% of clinics which meet target 47 56 - 4 - 7 53 3 58 67 4
SOPs = Standard operating procedures, O/S = Out o f stock, ROL = Re-Orc er Leve 1Min-Max = Minimum-Maximum level, Card=Shelf means the balance quantity on the
card was equal to the quantity physically on the shelf.The major findings were: -
• Only 47% o f the clinics had the entire tracer Standard Operating Procedures.
• The method o f quantification o f drugs was found to be adequate at 53% of the
clinics.
• Only 56% o f the clinics had adequate receiving procedures.
• Out o f 36 facilities visited, 24 (67%) used stock cards. On average physical stock
on the shelf was found to be equal to the balance quantities on the stock card only
in 55.9% (range 8.3% to 100%) o f the tracer items.
• On average 33.1% (range 0% to 83.3%) o f the tracer items had been out o f stock
at least once in the past year.
• On the day o f the study, on average 87.6% (range 70% to 100%) o f the tracer item
were in stock.
27

Once drugs are available at the clinic and there are adequate facilities, professional
guidelines require that they should be managed full time by someone with basic
training in Pharmacy and/or further training in Drug Supply Management.
Information on personnel responsible for Drug Supply Management and their training
is presented in Table 3.5 (page 29). It shows that Pharmacist’s Assistants (PAs) were
in-charge o f Drug Supply Management at seven facilities (19%). Although each
Pharmacist’s Assistant had a base clinic, most Pharmacist’s Assistants were each
assigned two to three facilities thereby rotating between them and concentrating on
none.
Nursing personnel were in charge o f Drug Supply Management at most (81%) o f the
facilities. These were mainly Registered Nurses (RNs) (66.7%). In some facilities, an
Enrolled Nurse (EN) was assigned to work in the drug store and dispensary, under
supervision o f a Registered Nurse. Nurses who were assigned Drug Supply
Management responsibilities also performed clinical duties. They reported that Drug
Supply Management was not viewed as a primary function. It was thus attended to
last.
Most o f the clinics had at least one staff trained in Drug Supply Management (88%),
or Rational Drug Use (82%) or Cold Chain Management (79%).
Drug Supply Management was performed on a rotational basis in 18 (50%) o f the
facilities visited and on a permanent basis in the other 18 (50%) facilities. In most
facilities, no person had the full-time responsibility for Drug Supply Management.
3.2.4. Personnel for Drug Supply Management and their Training
28

Table 3.5 Personnel Indicators Related to Drug Supply Management at Clinics
FacilityType Owner I/C of DSM No. Trained
Qualification Duration DSM RDU CCMBoikhutsong Clinic GPA Reg.Nurse Permanent 4 10 10Bophelong Clinic GPA Reg.Nurse Permanent 1 0 1Eesterust Clinic GPA Reg.Nurse Permanent 8 7 NDLaud iu m CHC GPA Reg.Nurse Rotation 4 16 16Mandisa Shiceka Clinic GPA Reg.Nurse Rotation 5 0 5Pretoria North Clinic GPA Reg.Nurse Permanent 1 17 4Skinner Street Clinic GPA Reg.Nurse Permanent 10 0 10Soshanguve 3 CHC GPA Reg.Nurse Rotation 4 ND 3Soshanguve JJ Clinic GPA Reg.Nurse Permanent 1 1 7Stanza Bopape CHC GPA Enrld Nurse Rotation 3 11 3Sedibeng HC Clinic GPA Reg.Nurse Permanent 1 2 0Jubilee Gateway Clinic Moretele Reg.Nurse Rotation 1 1 0New Eersterust Clinic Moretele Reg.Nurse Rotation 0 1 1Ramotse Clinic Moretele Enrld Nurse Rotation 1 1 1Refentse CHC Moretele Reg.Nurse Permanent 1 0 0Suurman Clinic Moretele Enrld Nurse Permanent 2 2 2Temba CHC Moretele Enrld Nurse Rotation 11 11 11Boekenhout CHC ODI Reg.Nurse Rotation 6 6 6Itireleng Clinic ODI Reg.Nurse Permanent 0 0 0Kgabo CHC ODI Enrld Nurse Permanent 16 16 27Mpho ya Batho Clinic ODI Reg.Nurse Rotation 2 0 0Phedison I CHC ODI Reg.Nurse Rotation 4 1 0Atteridgeville Clinic CTMM Pharm Asst Rotation 1 5 6Danville Clinic CTMM Pharm Asst Rotation 1 3 1Folang Clinic CTMM Pharm Asst Rotation 1 10 1Gazankulu Clinic CTMM Reg.Nurse Permanent ND 1 1Hercules Clinic CTMM Reg.Nurse Permanent 3 3 3Karenpark Clinic CTMM Reg.Nurse Permanent 1 4 0Laudium Clinic CTMM Reg.Nurse Permanent 0 5 5Lyttelton Clinic CTMM Reg.Nurse Permanent 1 6 1Mamelodi West Clinic CTMM Pharm Asst Permanent ND ND NDPhahameng Clinic CTMM Pharm Asst Rotation 1 5 5Phomolong Clinic CTMM Pharm Asst Rotation 1 6 2Rosslyn Clinic CTMM Reg.Nurse Permanent 1 5 1Silverton Clinic CTMM Reg.Nurse Rotation 0 3 1Stanza Bopape 2 Clinic CTMM Pharm Asst Rotation 2 10 8Performance Target ((£> clinic) Pharm Asst Permanent >1 >1 >1% of clinics which comply 19% 50% 88% 82% 79%
I/C = In-charge, DSM = Drug Supply Management, RDU = Rational Drug Use,CCM = Cold Chain Management, ND = No data, CTMM = City of Tshwane Metropolitan Municipality, GPA = Gauteng Provincial Authority, Reg = Registered, Enrld = Enrolled, Pharm. Asst = Pharmacist’s Assistant
29

3.2.5. Cold Chain Management Indicators
The ideal way to maintain a vaccine cold chain is to use a standard Expanded
Programme for Immunisation (EPI) fridge, record the fridge temperature daily using a
Minimum-Maximum thermometer, avoid keeping stock in the fridge door and avoid
using the vaccine fridge to store food and drinks.
Result presented in table 3.6 (page 31) show that only 35% (12 out o f 34) o f fridges
were standard Expanded Programme for Immunisation fridges. Most o f the clinics
(85%) recorded the fridge temperature daily, though only 45% used the Minimum-
Maximum thermometer. Other facilities used a normal thermometer and recorded the
fridge temperature twice daily to try and capture the coolest and hottest times o f the
day. In 18% o f the clinics with a fridge, stock was found stored in the fridge door
while in 9% o f the clinics, food or drinks were found stored in the vaccine fridge.
3.2.6. Prescribing Indicators
This group o f indicators was evaluated in thirty-three clinics. The prescribing
indicators together with their performance targets are shown in table 3.7 (page 32). It
shows that: -
• The average number o f drugs per patient encounter was 2.27 (range: 1.57 to 3.67).
• On average 51.6% (range 12.5% to 98.0%) o f the drugs were prescribed by
generic name.
• At least one antibiotic was prescribed in, on average, 35% (range 0% to 65.5%) of
all patient encounters.
• On average, 17.2% (range 0% to 46.7%) o f all patient encounters received an
injection.
• On average 95.6% (range 81.8% to 100%) o f drugs prescribed were on the
Essential Drug List for Primary Health Care facilities.
30

Table 3.6 Cold Chain Management Indicators
Facility Type OwnerTy pe of Fridge Cold Chain Management
EPI Dom Hasfridge
Stock in door
Food in Fridge Daily Therm
TypePower
Back-upBoikhutsong Clinic GPA NoBophelong Clinic GPA Yes Yes No No Yes Normal YesEesterust Clinic GPA Yes Yes Yes No No None NoLaudium CHC GPA Yes Yes No No Yes Min-Max YesMandisa Shiceka Clinic GPA Yes Yes No No Yes Normal NoPretoria North Clinic GPA Yes Yes No No Yes Normal NoSkinner Street Clinic GPA Yes Yes No Yes Yes Normal NoSoshanguve 3 CHC GPA Yes Yes No No Yes Normal YesSoshanguve JJ Clinic GPA Yes Yes No Yes No None NoStanza Bopape CHC GPA Yes Yes No No Yes Min-Max YesSedibeng HC Clinic GPA NoJubilee Gateway Clinic Moretele Yes Yes Yes No Yes Normal YesNew Eersterust Clinic Moretele Yes Yes Yes No Yes Normal NoRamotse Clinic Moretele Yes Yes No No No Normal NoRefentse CHC Moretele Yes Yes No No Yes Normal NoSuurman Clinic Moretele NoTemba CHC Moretele Yes Yes Yes No Yes Normal NoBoekenhout CHC ODI Yes Yes No No No Normal NoItireleng Clinic ODI Yes Yes No No No Normal NoKgabo CHC ODI Yes Yes No No Yes Normal NoMpho ya Batho Clinic ODI Yes Yes No No Yes Normal NoPhedison I CHC ODI Yes Yes No No Yes Normal NoAtteridgeville Clinic CTMM Yes Yes No No Yes Min-Max NoDanville Clinic CTMM Yes Yes No No Yes Min-Max NoFolang Clinic CTMM Yes Yes Yes No Yes Min-Max YesGazankulu Clinic CTMM Yes Yes No No Yes Min-Max NoHercules Clinic CTMM Yes Yes No Yes Yes Min-Max NoKarenpark Clinic CTMM Yes Yes No No Yes Min-Max NoLaudium Clinic CTMM Yes Yes No No Yes Min-Max NoLyttelton Clinic CTMM Yes Yes Yes No No Yes Min-Max NoMamelodi West Clinic CTMM Yes Yes Yes No Yes Min-Max NoPhahameng Clinic CTMM Yes Yes No No Yes Min-Max NoPhomolong Clinic CTMM Yes Yes No No Yes Min-Max NoRosslyn Clinic CTMM Yes Yes No No Yes Normal NoSilverton Clinic CTMM Yes Yes No No Yes Min-Max NoStanza Bopape 2 Clinic CTMM Yes Yes No No Yes Min-Max NoPerformance Target ((a), clinic) Yes Yes No No Yes Min-max Yes% of clinics which comply 36% 92% 82% 91% 85% 45% 18%
Dom = Domestic, Therm = Thermometer, EPI = Expanded Programme for Immunisation, CTMM = City o f Tshwane Metropolitan Municipality, GPA =
Gauteng Provincial Authority
31
Table 3.6 Cold Chain Management Indicators
Facility Type OwnerT> pe of Fridge Cold Chain Management
EPI Dom Hasfridge
Stock in door
Food in Fridge Daily Therm
TypePower
Back-upBoikhutsong Clinic GPA NoBophelong Clinic GPA Yes Yes No No Yes Normal YesEesterust Clinic GPA Yes Yes Yes No No None NoLaudium CHC GPA Yes Yes No No Yes Min-Max YesMandisa Shiceka Clinic GPA Yes Yes No No Yes Normal NoPretoria North Clinic GPA Yes Yes No No Yes Normal NoSkinner Street Clinic GPA Yes Yes No Yes Yes Normal NoSoshanguve 3 CHC GPA Yes Yes No No Yes Normal YesSoshanguve JJ Clinic GPA Yes Yes No Yes No None NoStanza Bopape CHC GPA Yes Yes No No Yes Min-Max YesSedibeng HC Clinic GPA NoJubilee Gateway Clinic Moretele Yes Yes Yes No Yes Normal YesNew Eersterust Clinic Moretele Yes Yes Yes No Yes Normal NoRamotse Clinic Moretele Yes Yes No No No Normal NoRefentse CHC Moretele Yes Yes No No Yes Normal NoSuurman Clinic Moretele NoTemba CHC Moretele Yes Yes Yes No Yes Normal NoBoekenhout CHC ODI Yes Yes No No No Normal NoItireleng Clinic ODI Yes Yes No No No Normal NoKgabo CHC ODI Yes Yes No No Yes Normal NoMpho ya Batho Clinic ODI Yes Yes No No Yes Normal NoPhedison I CHC ODI Yes Yes No No Yes Normal NoAtteridgeville Clinic CTMM Yes Yes No No Yes Min-Max NoDanville Clinic CTMM Yes Yes No No Yes Min-Max NoFolang Clinic CTMM Yes Yes Yes No Yes Min-Max YesGazankulu Clinic CTMM Yes Yes No No Yes Min-Max NoHercules Clinic CTMM Yes Yes No Yes Yes Min-Max NoKarenpark Clinic CTMM Yes Yes No No Yes Min-Max NoLaudium Clinic CTMM Yes Yes No No Yes Min-Max NoLyttelton Clinic CTMM Yes Yes Yes No No Yes Min-Max NoMamelodi West Clinic CTMM Yes Yes Yes No Yes Min-Max NoPhahameng Clinic CTMM Yes Yes No No Yes Min-Max NoPhomolong Clinic CTMM Yes Yes No No Yes Min-Max NoRosslyn Clinic CTMM Yes Yes No No Yes Normal NoSilverton Clinic CTMM Yes Yes No No Yes Min-Max NoStanza Bopape 2 Clinic CTMM Yes Yes No No Yes Min-Max NoPerformance Target (@ clinic) Yes Yes No No Yes Min-max Yes% of clinics which comply 36% 92% 82% 91% 85% 45% 18%
Dom = Domestic, Therm = Thermometer, EPI = Expanded Programme for Immunisation, CTMM = City o f Tshwane Metropolitan Municipality, GPA =
Gauteng Provincial Authority
31

Table 3.7 Prescribing IndicatorsSer.No Facility Type Owner Drugs/Pt %Generics %ABs % Injections %on EDL
1 Boikhutsong Clinic GPA 2.59 64.0 65.5 6.9 98.72 Bophelong Clinic GPA 2.83 52.9 24.1 10.3 100.03 Eesteaist Clinic GPA 2.00 12.5 0.0 25.0 100.04 Laudium CHC GPA 3.63 52.0 48.1 22.2 92.95 Mandisa Shiceka Clinic GPA - - - - -6 Pretoria North Clinic GPA 2.62 46.1 17.2 3.4 94.77 Skinner Street Clinic GPA 3.07 38.0 33.3 10.0 100.08 Soshanguve 3 CHC GPA 2.07 45.2 44.8 34.5 100.09 Soshanguve JJ Clinic GPA 1.87 37.5 53.6 3.6 96.410 Stanza Bopape CHC GPA 2.13 39.1 33.3 13.3 100.011 Sedibeng HC Clinic GPA 3.67 39.1 50.0 0.0 100.012 Jubilee Gateway Clinic Moretele 2.00 66.7 33.3 6.7 86.713 New Eersterust Clinic Moretele 2.87 47.7 56.7 10.0 98.814 Ramotse Clinic Moretele 2.03 62.3 26.7 23.3 98.415 Refentse CHC Moretele 2.03 82.0 36.7 6.7 98.416 Suurman Clinic Moretele 1.57 80.9 20.0 0.0 100.017 Temba CHC Moretele 1.67 52.0 30.0 33.3 96.018 Boekenhout CHC Odi 1.87 69.6 33.3 10.0 98.019 Itireleng Clinic Odi 2.83 42.4 46.7 6.7 89.420 Kgabo CHC Odi 1.83 58.2 30.0 16.7 98.221 Mpho Ya Batho Clinic Odi 1.80 42.6 10.0 13.3 90.722 Phedisong 1 CHC Odi 1.83 47.3 40.0 6.7 94.523 Atteridgeville Clinic CTMM 1.83 32.7 50.0 33.3 81.824 Danville Clinic CTMM 2.36 56.1 29.6 37.0 98.525 Folang Clinic CTMM 2.33 38.6 64.3 7.1 98.626 Gazankulu Clinic CTMM 1.85 60.4 15.4 42.3 93.627 Hercules Clinic CTMM 2.50 50.7 16.7 40.0 93.328 Karenpark Clinic CTMM 1.97 96.6 39.3 17.9 100.029 Laudium Clinic CTMM 2.20 22.7 40.0 10.0 93.930 Lyttelton Clinic CTMM - - - - -31 Mamelodi West Clinic CTMM 2.40 40.0 25.0 25.0 91.732 Phahameng Clinic CTMM 2.57 29.9 43.3 26.7 93.533 Phomolong Clinic CTMM 2.23 55.2 13.3 46.7 91.034 Rosslyn Clinic CTMM 1.63 98.0 57.7 7.7 89.835 Silverton Clinic CTMM 2.13 43.8 26.7 10.0 98.436 Stanza Bopape 2 Clinic CTMM - - - - -
Mean 2.27 51.6 35.0 17.2 95.6Maximum 3.67 98.0 65.5 46.7 100.0Minimum 1.57 12.5 0.0 0.0 81.8
Performance target <2 100 <25 <15 100% of Clinics which meet the target 39% 0% 27% 58% 24%
‘or Clinics in Tshwane
32
3.3.Impact of Various Factors on the Status of Drug Supply
Management in TshwaneIn order to assess the impact o f various factors on the status o f Drug Supply
Management in Tshwane, several hypotheses were used.
3.3.1. Effect of Category of Staff (Pharmacist’s Assistant versus Nurse)
on Drug Supply Management Indicators
Table 3.8 (derived from Table A5 [page 71] and Table A8 [pages 74-79]) below
shows that a Pharmacist’s Assistant was in charge o f Drug Supply Management at
seven clinics and a nurse was in charge at twenty-nine clinics.
Table 3.8 Effect of type of staff in charge (Pharmacist’s Assistant versus Nurse)
on Drug Supply Management Indicators
Indicator
Staff in charge of DSM
p valuePA, n = 7 Nurse, n = 29
No % No %
Restricted access 2 28.6 14 48.3 0.6045All stock off the floor 5 71.4 17 58.6 0.8485Adequate receiving procedures 1 14.3 19 65.5 0.9521
Has all SOPs 0 0.0 17 58.6 0.0180Use formal quantification method 6 85.7 13 44.8 0.1277Use stock cards 0 0 24 82.8 0.0002Av. %items stock on card = shelf - - - 57.8 -Record fridge temperature daily 7 100.0 21 80.8* 0.5056No stock in fridge door 5 71.4 22 84.6* 0.8019
No food/drink in vaccine fridge 7 100 23 88.5* 0.8399Av. % o f items O/S at least once - 22.9 - 36.2 0.1826
Av. % in stock on day o f study - 90.1 - 86.9 0.4288
SOPs = Standard Operating Procedures, Av = Average, PA = Pharmacist’s Assistant,
DSM = Drug Supply Management, O/S = Out o f stock, *n=26
33

The indicators o f the two categories were as follows: -
• Only 28.6% o f the clinics run by a Pharmacist’s Assistant controlled access to the
drug store, compared to 48.3% run by a nurse.
• All stock was off the floor at 71.4% o f the clinics run by Pharmacist’s Assistants,
compared to 58.6% run by nurses.
• Receiving procedures were adequate at 14.3% o f the clinics run by a Pharmacist’s
Assistant, compared to 65.5% run by a nurse.
• There was no clinic run by a Pharmacist’s Assistant that had the entire tracer
Standard Operating Procedures compared to 58.6% o f the clinics run by a nurse.
• The majority (85.7%) o f the clinics run by a Pharmacist’s Assistant used a formal
quantification method, compared to 44.8% o f the clinics run by a nurse.
• None o f the clinics ran by a Pharmacist’s Assistant had a standard stock card,
compared to 82.8% o f the clinics run by a nurse.
• At all the clinics run by a Pharmacist’s Assistant the fridge temperature was
monitored daily, compared to 80.8% o f the clinics run by a nurse.
• No stock was found in the fridge door at 71.4% o f the clinics run by a
Pharmacist’s Assistant, and at 84.6% o f those run by a nurse.
• No food or drink was found in the vaccine fridge at all clinics run by a Pharmacist
Assistant, and at 88.5% o f those run by a nurse.
3.3.2. Effect of Rotation of Staff In-charge on Drug Supply Management
Indicators
Table 3.9 (page 35) shows that the number o f clinics at which the staff in charge o f
the Drug Supply Management was rotated was equal to that where the staff in-charge
was permanent.
34

Table 3.9 Effect of Rotation of Staff In-charge on Drug Supply Management
Indicators
Indicator
Nature of Deploymentp valuePermanent, n=18 Rotation, n = 18
No % No %
Restricted access 10 55.6 6 33.3 0.3143All stock off the floor 10 55.6 12 66.7 0.7324Adequate receiving procedures 12 66.7 8 44.4 0.3143Has all SOPs 9 50.0 8 44.4 0.6318Use formal quantification method 9 50.0 10 55.6 0.3682Use stock cards 13 72.2 11 61.1 0.7237Av. %items stock on card = shelf - 61.6 - 50.5 0.3492Record fridge temperature daily 12 80.0** 16 88.9 0.8246No stock in fridge door 13 86.7** 14 77.8 0.8368No food/drink in vaccine fridge 12 80.0** 18 100 0.1670Av. % o f items O/S at least once - 35.1 - 31.7 0.6948Av. % in stock on day o f study - 86.2 - 88.7 0.4549
SOPs = Standard Operating Procedures, Av = Average, **n=15, O/S = Out o f stock
The indicators o f the two categories were as follows: -
• Access to the drug store was controlled at 33.3% o f the clinics where the in
charge was rotated, compared to 55.6% where the in-charge was permanent.
• All the stock was off the floor at 66.7% o f the clinics where the in-charge was
rotated compared to 55.6% where the in-charge was permanent.
• Receiving procedures were adequate at 44.4% o f the clinics where the in-charge
was rotated, compared to 66.7% where the in-charge was permanent.
• A formal quantification method was used at 55.6% o f the clinics where the in
charge was rotated, compared to 50% where the in-charge was permanent.
• Standard stock cards were used at 61.1% o f the clinics where the in-charge was
rotated, compared to 72.2% where the in-charge was permanent.
35
The fridge temperature was recorded daily at 88.9% of the clinics where the in
charge was rotated, compared to 80% where the in-charge was permanent.
3.3.3. Impact of Training in Drug Supply Management
Table 3.10 below (derived from Table A6 [page 72] and Table A8 [pages 74-79])
shows that thirty clinics had at least one staff trained in Drug Supply Management
while four clinics had none. Data on training in Drug Supply Management at two
clinics was not available as there was no record.
Table 3.10 Impact of Training in Drug Supply Management
Indicator
Number of staff trained in DSM
p valueAt least one, n = 30 None, n = 4
No % No %
Restricted access 13 43.3 2 50.0 0.7766All stock off the floor 19 63.3 2 50.0 0.9743Adequate receiving procedures 19 63.3 1 25.0 0.3563Has all SOPs 3 10.0 1 25.0 0.9612Use formal quantification method 16 53.3 1 25.0 0.5945Use stock cards 22 73.3 2 50.0 0.7055Av. %items stock on card = shelf - 57.6 - 37.5 0.3390Record fridge temperature daily 23 85.2*** 3 75.0 0.8325No stock in fridge door 23 85.2*** 3 75.0 0.8325No food/drink in vaccine fridge 24 gg q*** 4 100 0.8379Av. % o f items O/S at least once - 33.0 - 50.9 0.3026Av. % in stock on day o f study - 86.8 - 95.6 0.0683
SOPs = Standard Operating Procedures, Av = Average, **n=15, O/S = Out o f stock,
DSM = Drug Supply Management
The indicators o f the two categories were as follows: -
• Access to the drug store was controlled at 43.3% o f the clinics where at least one
staff was trained, compared to 50% where no staff was trained.
36

• All the stock was off the floor at 63.3% of the clinics where at least one staff was
trained compared to 50% o f the clinics where no staff was trained.
• Receiving procedures were adequate at 63.3% o f the clinics where at least one
staff was trained compared to 25% where no staff was trained.
• The entire tracer Standard Operating Procedures were available at 10% o f the
clinics where at least one staff was trained, compared to 25% where no staff was
trained.
• A formal quantification method was used at 53.3% o f the clinics where at least
one staff was trained, compared to 25% where no staff was trained.
• Standard stock cards were used at 73.3% o f the clinics where at least one staff was
trained, compared to 50% where no staff was trained.
3.3.4. Impact of Training in Rational Drug Use
Training in Rational Drug Use is more likely to influence prescription and patient care
indicators. Table 3.11 (derived from Table A8 page 74-79) below shows indicators of
a group o f clinics with at least one person trained in Rational Drug Use and the other
group with nobody trained in Rational Drug Use.
Table 3.11 Impact of training in Rational Drug Use on some Drug SupplyManagement Indicators
Number of staff trained inRational Drug Use
IndicatorAt least one None
Target p value
n = 26 n = 5
Average Number of Drugs per Patient 2.22 2.51 <2 0.2799
Av.% Drugs Prescribed by Generic name 52.3 51.6 100 0.9412
Av. % of Encounters given an Antibiotic 35.9 30.2 <25 0.4778
Av. % of Encounters given an Injection 17.7 9.4 <15 0.0099
Av. % Prescribed drugs on the EDL 95.6 95.7 100 0.9664
Av. = Average, EDL = Essential Drug List
37

The average number o f drugs per patient encounter among clinics with at least one
person trained was 2.22 compared to 2.51 in the group with nobody trained. Generic
names were used in 52.3% o f all the prescribed drugs among the group with trained
personnel compared to 51.6% among the group with nobody trained. On average,
35.9% o f the patient encounters among clinics with at least one trained person
received an antibiotic compared to 30.2% in the group with no one trained. On
average, 17.7% o f the patient encounters in the group with at least one trained person
received an injection compared to 9.4% among the group with no one trained. On
average, 95.6% o f the drugs prescribed at the clinics with at least one trained person
were on the Essential Drugs List for Primary Health Care facilities compared to
95.7% at the clinics with no one trained.
3.3.5. Impact of Training in Cold Chain Management
Table 3.12 below (derived from Table A8 page 74-79) shows the indicators o f the
twenty-five clinics with at least one person trained in Cold Chain Management and
six with nobody trained.
Table 3.12 Variation of Indicators According to number of Personnel Trained inCold Chain Management
Indicator Affected
Number Trained in Cold Chain Management
p valueAt least one (n=25) None (n=6)
No % No %Record fridge temperature daily 22 88.0 5 83.3 0.08544No stock in fridge door 22 88.0 5 83.3 0.08544No food/drink in vaccine fridge 22 88.0 6 100 0.37346
The clinics with at least one person trained in Cold Chain Management performed
better in recording the fridge temperature and avoiding storage o f stock in the fridge
door compared to those with no one trained. No food or drink was found in the fridge
38

at all the clinics with no one trained compared to 88% o f those with at least one
person trained.
3.3.6. Effect of the Method of Quantification on Availability of Drugs
An adequate quantification method is expected to enhance drug availability at the
facility. Table 3.13 below (derived from Table A7, page 73) shows drug availability
indicators according to the method o f quantification and their correlation with the
percentage o f tracer items whose re-order level had been determined (%ROL).
On average, 23.7% o f the tracer items had been out o f stock at least once in the past
year among clinics with a good quantification method compared to 43.8% at the
clinics without a good quantification method. Among the clinics with a good
quantification method, 88.2% o f the tracer items were in stock on the day o f the study
compared to 86.6% at the clinics that used only experience.
Table 3.13 The Impact of Quantification Method on Drug Availability
Indicators.
Quantification Method r of %ROL
Indicator ROL/Min-
MaxExperience
p valueversus
availability
indicator
% o f tracer items O/S in the past year 23.7 43.8 0.0138 r = -0.299
% of tracer items in stock on day o f study 88.2 86.2 0.6778 r = +0.104
r = Correlation coefficient, ROL =Re-Order Level, Min-Max = Minimum- Maximum
Levels, %ROL = % o f items whose ROL had been determined
39
3.3.7. Effect of Supply from Independent Sub-depot or Hospital
Pharmacy on Some Drug Supply Management indicators
The drug supply indicators for the two categories o f suppliers are presented in Table
3.14 below (derived from Table A4, page 70).
Table 3.14 Drug Supply Indicators at the Clinic According to Type of Supplier
Type of supplierLead time
(days)
% of order
supplied
% O/S in past
year
% in stock on
study day
Average for all Sub-depots 11.2 79.0 33.1 87.6
Independent sub-depots 11.7 82.5 24.6 88.8
Hospital pharmacies 10.3 70.9 50.0 85.0
p values 0.4521 0.0069 0.0024 0.2813
O/S = Out o f stock
Independent Sub-depots and Hospital Pharmacies had practically similar lead times
but the former had a better service level. Clinics supplied by independent Sub-depots
had better availability and less stock out o f key drugs compared to those supplied by
Hospital Pharmacies.
3.3.8. Effect of Availability of Standard Operating Procedures on Status
of Drug Supply Management
Table 3.15 below shows indicators according to availability o f standard operating
procedures.
Table 3.15 Distribution of clinics and variation of Indicators According to
Availability of Standard Operating Procedures
Receivingadeq
Proceduresuate
Stock Off the floor
Good Quantification Method
% ROL determined
Yes No Yes No Yes No AverageHas all SOPs 12 5 12 5 8 9 66.5No SOPs 8 11 10 9 11 8 81.3p values 0.1673 0.4467 0.7522 0.5098
ROL Re-Order Level
40
In the next chapter, the above results are discussed in comparison with standard
performance targets and results from other studies carried out in South Africa and
other countries.
41

4. DISCUSSION
4.1.Status of Drug Supply Management
4.1.1. Facility Indicators
The status o f facilities has an impact on the quality o f Drug Supply Management.
Table 3.2 (page 25) shows that the proportion o f clinics with adequate storage
facilities was generally low, although clinics under City o f Tshwane Metropolitan
Municipality had generally better facility indicators than those under Gauteng
Provincial Authority, Moretele and Odi Districts. The status o f facilities for Drug
Supply Management was similar to what was observed by Summers et al in NMTTS
District o f Northern Province .
4.1.2. Performance of the Main Suppliers of Primary Health Care
Clinics in Tshwane
Table 3.3 (page 26) shows that all the sub-depots received a good service level
(>94%) from the provincial depots compared to the WHO recommended standard
(95%). However, their average service level (79%) to the Primary Health Care clinics
was below this standard performance target. Only a few clinics (4%) received a level
o f service above the standard. Nevertheless, this service level was better than what
was observed in NMTTS District o f Northern Province (66.7%)32.
Table 3.14 (page 40) shows that clinics supplied by independent sub-depots (Pretoria
Regional Pharmacy and Tshwane Metro Pharmacy) had better drug availability and
less out o f stock o f tracer items compared to those supplied by hospital pharmacies
(Jubilee and Odi). The differences between the two groups were significant with
respect to average service level (p = 0.0069) and average percentage o f items that had
been out o f stock at least once in the past year (p = 0.0024), but the data could not
42

prove the difference with respect to average lead time (p = 0.452) and percentage o f
tracer items in stock on the day o f the study (p = 0.281).
This data shows that drugs were less likely to be out o f stock and hence more
available at clinics supplied by an independent sub-depot compared to those supplied
by a hospital pharmacy. It is likely that a hospital pharmacy gave priority to the
hospital in case o f drug shortage thus causing shortages at the clinics supplied.
Stafford et a f did not perform this assessment during the pharmaceutical audit in
Tshwane.
4.1.3. Procurement, Availability and Control of Drugs
4.1.3.1. Availability of Standard Operating Procedures
Availability and use o f standard operating procedures ensures consistency in carrying
out operations. All clinics were expected to have all the tracer standard operating
procedures but only 47% o f the clinics had all o f them (Table 3.15, page 40).
However, the differences between indicators o f the group o f clinics with standard
operating procedures and the group without were not statistically significant (p>0.05).
This confirms the observation that in most cases where the standard operating
procedures were available, they were filed away and not available to the staff
performing the duties.
4.1.3.2. Receiving Procedures
The standard way to receive stock is for received stock to be off-loaded in a secure
cage where it is quarantined and checked against the order, invoice and delivery note
before placing it in the main store. The delivery note should be in duplicate and both
parties must retain a signed copy. Any discrepancies should be formally reported
within a stipulated period40. These measures are meant to enhance control o f and
accountability for drugs throughout the supply chain. This was practised at only 56%
43
o f the clinics. This points to poor accountability for drugs since one cannot account
for drugs for which there is no confirmation o f receipt.
4.1.3.3.Availability and Use of Stock Cards.
A Stock card is an important tool for drug management. According to Gray41, stock
cards serve four basic functions:
• They allow staff to account for and monitor the movement o f drugs over a period
o f time. By comparing physical stock with record o f stock balance on the card
(stocktaking) one is able to identify stock losses or disappearance o f drugs.
• They are used to calculate the quantities o f drugs that need to be ordered. If
correctly maintained, one is able to calculate consumption and hence quantities to
order.
• They can be used to monitor the efficiency o f the Drug Management System. If
well maintained, one can calculate Lead Time, Ordering Frequency and stock out
levels from stock cards.
• They aid proper storage o f drugs and stock rotation by alerting staff to the expiry
dates.
For effective drug control, there should be one stock card per item. A separate stock
card is created for each item, in each pack size and strength. The necessary
information must be recorded at the time o f each stock movement (receipts, issues and
write-offs)41.
The maintenance o f stock cards was studied using the tracer drugs and non-drug
items. Out o f 36 facilities evaluated, 24 (67%) used stock cards (Table 3.4, page 27).
On average physical stock on the shelf was found to be equal to the balance quantities
on the stock card only for 55.9% (range 8.3% to 100%) o f the tracer items, compared
44

to the performance standard o f 100%. Errors in management o f stock cards arose
because o f reasons similar to those identified by Gray 41:
• Stores were disorganised so that stock could not be linked to the correct card.
• “Closed” stock was accessible without restrictions.
• Stocktaking was not done and discrepancies not traced and corrected.
• Stock was received or issued but not recorded.
• No one was made responsible for stock management.
• Personnel were not well trained.
• Different facilities used different systems making monitoring difficult.
• Stock cards were poorly designed or did not record all the information needed.
The availability o f stock cards was better than what was observed earlier in Tshwane
by Stafford et al (47%)8 in 2000, and in Northern Province by Summers et al,
(42.9%)32. Balancing o f stock was more accurate than what Stafford et al found
earlier (41%)8, but less accurate than what Summers et al found in Northern Province
(95%)32. This further points to poor control and accountability for drugs.
4.1.3.4.Quantification Method
A good quantification method is important to avoid stock-outs and ensure continuous
availability o f essential drugs and supplies; to avoid wastage due to overstocking; to
make the best use o f scarce resources, and; to provide accurate data to lobby for
adequate funding.
All clinics were therefore expected to have a formal quantification method to
determine the quantities o f drugs to order. During this study, both the Re-Order Level
(ROL) and Minimum-Maximum Level (Min-Max) methods were considered
adequate, but use o f only experience was not considered adequate. Therefore, the Re-
Order Levels o f all tracer items were expected to have been determined.
45

Table 3.4 (page 27) shows that the method o f quantification was found adequate at
53% o f the clinics. This was worse than what was found earlier (88%)8, but better
than what was observed in Northern Province (0%)32. On average, the Re-Order
Levels o f only 33.8% o f the tracer items had been determined, compared to the
standard target o f 100%. It is possible that poor quantification methods may have
contributed to the dispute over the actual drug budget requirements and the observed
stock outs.
4.1.3.5.Availability of Tracer Drugs
Drug availability is the litmus test for the status o f Drug Supply Management. Table
3.4 (page 27) shows that on average 33.1% (range 0% to 83.3%) o f the tracer items
had been out o f stock at least once in the past year, compared to the standard o f <10%.
Only 7% o f the clinics met this standard. On the day o f the study, on average 87.6%
(range 70% to 100%) o f the tracer item were in stock, compared to the standard target
o f 90%. Slightly more than half (58%) o f the clinics met the target. Drug availability
was similar to what was observed in Kampong Thom Province in Cambodia
(86.6%)23, but better than what was observed in NMTTS District o f Northern
Province (75.2%)32. Data obtained by Stafford et al8 could not be compared because
different indicators were used. Nevertheless, these results point to weaknesses in Drug
Supply Management in Tshwane.
4.1.4. Cold Chain Management Indicators
The ideal way to maintain a vaccine cold chain is to use a standard Expanded
Programme for Immunisation fridge, record the fridge temperature daily using a
Minimum-Maximum thermometer, avoid keeping stock in the fridge door and avoid
using the vaccine fridge to store food and drinks11,42. The cold chain indicators are
presented in table 3.6 (page 31). These observations show that cold chain
46

management was generally adequate, although there was great variation between the
clinics. The majority o f the clinics (92%) had a fridge, although only 35% (12 out of
34) o f the fridges were o f the Expanded Programme for Immunisation standard type.
Most o f these clinics (85%) complied with the standard o f recording the fridge
temperature daily, though only a few (45%) used the ideal Minimum-Maximum
thermometer. Other clinics used a normal thermometer and recorded the fridge
temperature twice daily to try and capture the coolest and hottest parts o f the day. This
practice has limitations given the fluctuation o f weather in Gauteng. Some incidences
o f poor practice were found; stock was found stored in the fridge door in six (18%) of
the clinics with a fridge and food or drinks were found stored in the vaccine fridge in
three (9%) the clinics. The level o f cold chain management was comparable to that
observed by Summers et al in Northern Province32 and Gazmararrian el al at primary
care offices in four cities in USA25.
4.1.5. Prescribing Indicators
Table 3.7 (page 32) shows that prescribing was generally below the performance
targets. Only 13 clinics (39%) scored within the performance target o f not more than
an average o f 2 drugs per patient encounter. The average number o f drugs per patient
encounter was 2.27 (range o f 1.57 to 3.67). This is similar to what was observed by
Stafford et al (2 .43)8 in Tshwane, but higher than what was observed by Summer et
al (1.85) in NMTTS District o f Northern Province32. It is also similar to what was
observed in Mozambique (2.2)11, Tanzania (2.2)27 and Cambodia (2.35)23, but lower
than what was found in Indonesia (3.3)14, Swaziland (3.0)11, Cameroon (3.0)11,
Nigeria (3.8)15, and Ghana (4.3) n .
None o f the clinics had all the drugs prescribed by generic name, as recommended.
On average, 51.6% (range 12.5% to 98.0%) o f the drugs were prescribed by generic
47

name. This is below what was observed in Northern Province (60.4) 32 and most
studies cited earlier from other countries12 (Table 1.2, page 8), except Nepal (44%)28
and Ecuador (37%)29.
On average 35% (range 0% to 65.5%) o f all patient encounters received at least one
antibiotic. This is higher than the target upper limit o f 25% patient encounters, but
similar to what was observed in Northern Province (37.8%)32 and Malawi (34%)13.
The use o f antibiotics was higher in most o f the other studies earlier cited12 (Table
1.2, page 8). Nevertheless, 75% o f the clinics were within the target o f not more than
25%.
On average, 17.2% (range 0% to 46.7%) o f all patient encounters received an
injection. This was slightly higher than the target upper limit o f 15% patient
encounters, and higher than what was observed in Northern Province (9.8%) . It is
similar to what was observed in Malawi (19%)13, Indonesia (17%)14, Mozambique
(18% )" and Ecuador (17%)29, but lower than what was observed in Uganda (36%)26,
Sudan (36%)17, Swaziland (38%)11, Tanzania (29%)27, Nigeria (37%)15, Ghana
(56% )" and Cameroon (41%)n . Less than a half (42%) o f the clinics were within the
target o f not more than 15%.
Although the average percentage o f drugs prescribed that were on the Essential Drug
List for Primary Health Care Facilities (95.6%) was below the 100% target43, it was
higher than what was observed in Northern Province (83.9%)32, Tanzania (88%)27 and
Nepal (86%)28. It is however similar to what was observed in Cambodia (99.7%)23.
Only 24% o f the clinics met the target o f 100%.
Although the prescription indicators for most clinics were below the performance
target the overall performance was reasonable. Nevertheless, the use o f antibiotics
was high and needs further investigation.
48

4.2.Evaluations of the Gaps Observed in Drug Supply
Management in Tshwane
The discussion in the previous section shows that the status o f Drug Supply
Management in Tshwane was generally inadequate compared to the WHO
recommended performance standards. The following is an evaluation o f some o f the
possible reasons for the observed gaps. It is based on the hypotheses set up for the
study.
4.2.1. Effect of Quantification Method on Drug Availability
An adequate quantification method is expected to enhance drug availability at the
facility. Table 3.13 (page 39) shows that on average, 23.7% o f the tracer items had
been out o f stock at least once in the past year among clinics with a good
quantification method compared to 43.8% at the clinics without a good quantification
method. Among the clinics with a good quantification method, 88.2% o f the tracer
items were in stock on the day o f the study compared to 86.6% at the clinics that used
only experience. There was a slightly positive correlation between the percentages o f
tracer items whose re-order level had been determined and both the percentage o f
tracer items in stock on the day o f the study (r = +0.104). There was a slightly
negative correlation between the percentage o f tracer items whose re-order level had
been determined and the percentage o f items that had been out o f stock at least once
in the past year (r = -0.299). The differences between the two groups were significant
with respect to the average percentage o f items that had been out o f stock at least once
in the past year (p = 0.01381). However, the data could not prove the difference
between the two groups with respect to the average percentage o f tracer items in stock
on the day o f the study (p = 0.6778).
49

This data shows that determination o f the Re-Order Levels facilitated drug
quantification, which in turn enhanced drug availability and reduced stock outs. It can
therefore be concluded that a good quantification method was associated with better
drug availability and less stock outs.
Stafford et al8 did not perform this assessment during the pharmaceutical audit in
Tshwane.
4.2.2. Effect of Category of Staff (Pharmacist’s Assistant versus Nurse)
on Drug Supply Management Indicators
Once drugs are available at the clinic and there are adequate facilities, professional
guidelines require that drugs should be managed full time by someone with basic
training in Pharmacy and/or further training in Drug Supply Management. Table 3.5
(page 29) shows that staffing for Drug Supply Management was not adequate in terms
o f appropriate cadre and nature o f deployment. Pharmacist’s Assistants (PAs) were
in-charge o f Drug Supply Management at seven facilities (19%), all belonging to the
City o f Tshwane, compared to twenty-nine (81%) by nurses.
Table 3.8 (page 33) shows that 28.6% o f the clinics where a Pharmacist’s Assistant
was in charge practised restricted access to the store compared to 48.3% o f those
where a nurse was in charge (p = 0.6045). Receiving procedures were adequate at
14.3% o f the clinics where a Pharmacist’s Assistant was in charge compared to 65.5%
o f those where a nurse was in charge (p = 0.9521). Although these differences were
insignificant, they were also contrary to expectations. A possible explanation for the
differences was that Pharmacist’s Assistants actually only used these seven clinics as
base stations but were assigned more than one clinic. In their absence, nurses took
charge o f Drug Supply Management, thus having unrestricted access. Often, drugs
were delivered in the absence o f the Pharmacist’s Assistant and no one took
50
responsibility for the receiving procedures because this was seen as the responsibility
o f the Pharmacist’s Assistant.
The average percentage o f tracer items that had been out o f stock at least once in the
past year was 22.9% in clinics where the person in charge was a Pharmacist’s
Assistant compared to 36.2% in clinics where the person in charge was a nurse (p =
0.1826). The average percentage o f tracer items found in stock on the day o f the study
was 90.1% in clinics where the person in charge was a Pharmacist’s Assistant
compared to 86.9% in clinics where the person in charge was a nurse (p = 0.4288).
The differences too were not significant.
The only significant differences between the two groups were with respect to
availability o f standard operating procedures (SOPs) (p = 0.0180) and use o f stock
cards (p = 0.0002), where the clinics at which the person in charge was a nurse
performed better. A possible explanation to these differences lies in the fact that SOPs
and stock cards are policy documents, which are normally developed at the
departmental level. All the clinics where the person in charge was a Pharmacist’s
Assistant belonged to the City o f Tshwane, which had not developed these
documents.
Therefore, the data from this study did not prove that the type o f health worker
(Pharmacist’s Assistant versus nurse) in charge o f Drug Supply Management at the
clinic had a significant impact on drug availability. The possible effect o f the small
number o f clinics where the Pharmacist’s Assistant was in charge (seven), on the level
o f significance should be borne in mind38. The rotation o f the Pharmacist’s Assistant
between several clinics made them ineffective. Drug Supply Management was
effectively in the hands o f nurses at all clinics, hence, the lack o f significant
difference. In fact lack o f responsibility was likely to result in poor controls and lack
51

o f accountability for drugs at the clinics among which the Pharmacist’s Assistants
rotated. There is also a possibility that more factors influence the level o f Drug
Supply Management, than the category o f health worker in charge. An assessment of
rational drug use and prescribing in primary health care facilities in Northwest
Ethiopia showed that, apart from a few exceptions, the drug use indicators in health
centres and health stations and between retrospective and prospective studies were
similar despite differences in manpower and facilities .
4.2.3. Effect of Rotation of Personnel in Charge of Drug Supply
Management Indicators
Table 3.5 (page 29) shows that the clinics at which the person in charge o f Drug
Supply Management was permanent were equal in number to those where the person
in charge was rotated.
Table 3.9 (page 35) shows that clinics with a permanent person in charge had better
indicators for practising restricted access to the store, receiving procedures,
availability o f SOPs and use o f stock cards, compared to those where the person in
charge was rotated. This further clarifies the observations at clinics where the
Pharmacist’s Assistants were in charge but rotated among several clinics.
Nevertheless, the differences between the indicators for the two groups were not
significant (p > 0.05).
Also differences in drugs availability were noted between the groups. Also the
differences between the two groups were found not to be significant for percentage of
tracer items that had been out o f stock at least once in the past year (p = 0.6948);
percentage o f tracer items that were found in stock on the day o f the study (p =
0.4549), and; the percentage o f tracer items whose physical stock was equal to the
balance as shown on the card (p = 0.3492).
52

Therefore, although a permanent person in charge was associated with better Drug
Supply Management indicators, the data did not prove that rotation o f the person in
charge had a significant impact on the status o f Drug Supply Management.
4.2.4. Effect of Training in Drug Supply Management on the Status of
Drug Supply management
Professional guidelines require that drugs should be managed full time by someone
with basic training in Pharmacy and/or further training in Drug Supply Management.
This implies that clinics that have at least one person trained in Drug Supply
Management are expected to manage drugs better.
Table 3.5 (page 29) shows that the majority (30 out o f 34) o f the clinics evaluated had
at least one staff trained in Drug Supply Management. Table 3.10 (page 36) shows
that this group had better indicators for keeping stock off the floor, adequate receiving
procedures, good quantification method, use o f stock cards and balance o f physical
stock with record on the card. However, the differences were found not to be
significant (p > 0.05).
The small sample in the comparison group (4 clinics without anybody trained) could
• • t ohave contributed to this unexpected observation . In addition, the study observed
that, in most cases, the skills acquired from the training were not passed on to other
staff and the person trained was not always the one in charge o f Drug Supply
Management. The study also observed that health managers did not effectively
supervise the personnel in charge o f drugs at most o f the clinics. Under such
circumstances, any improvements could not be sustained. This view is supported by
the observations by Trap et al, in a randomised controlled indicator study in
Zimbabwe, to assess the impact o f supervision on stock management and adherence
to treatment guidelines . It was observed that, while training o f health workers
53

throughout the country in drug management (including stock management and
rational drug use) resulted in significant improvements in a variety o f drug supply
management indicators; these achievements could not be sustained until a further
intervention o f support supervision was introduced.
Therefore, the skills acquired from training were not properly deployed to influence
quality Drug Supply Management.
4.2.5. Effect of Training in Rational Drug Use on the Status of Drug
Supply Management
Training in Rational Drug Use is more likely to influence prescription indicators.
Table 3.11 (page 37) shows that the clinics with at least one person trained in Rational
Drug Use performed better with respect to the number o f drugs per patient encounter
(p = 0.2799), use o f generic names (p = 0.9412) and percentage o f patient encounters
with an antibiotic prescribed (p = 0.4778) compared to the clinics with nobody
trained. On the other hand, the clinics with at least one person trained in Rational
Drug Use performed worse with respect to the percentage o f patient encounters with
an injection prescribed (p = 0.0099) and the percentage o f drugs prescribed that was
on the Essential Drug List for Primary Health Care facilities (0.9664) compared to the
Clinics with no one trained. However, only the difference between the percentages of
encounters that received an injection was significant. Otherwise, training in Rational
Drug Use seemed to have had no significant impact on prescribing indicators. This is
similar to what Mallet et al observed in their evaluation o f prescription practices and
the rational use o f medicines, as part o f evaluating an essential drugs and costs
recovery program in Niger24. It was observed that training nurses in using National
Standard Treatment Guidelines seemed to have a limited impact on their prescribing
patterns.
54

Various factors influence the magnitude o f impact o f Rational Drug Use training.
These include the content o f the training and support supervision, among others.
Health Systems Trust observed that the content o f the Rational Drug Use Training
Project in South Africa was limited and was not a solution in itself, particularly if
there was no continuous support supervision44. This observation is consistent with the
findings o f Kafuko et al2b and Trap et al22 who concluded that availability o f Standard
Treatment Guidelines and training without effective support supervision will not lead
to sustained improvements in drug use.
The personnel in the clinics evaluated were trained under the Rational Drug Use
Project referred to above and support supervision in the clinics studied was
inadequate. These factors may be responsible for lack o f significant differences
between the indicators o f the two groups. The possible effect o f the small number of
clinics with no one trained in Rational Drug Use (five), on the level o f significance
T O
should also be borne in mind .
4.2.6. Effect of Training in Cold Chain Management
Table 3.12 (page 38) shows that the clinics with at least one person trained in Cold
Chain Management had better indicators in recording the fridge temperature (p =
0.08544) and avoiding storage o f stock in the fridge door (p = 0.08544) compared to
those with no one trained. No food or drink was found in the fridge at 100% o f the
clinics with no one trained compared to 88% o f those with at least one person trained
(p = 0.37346).
However, the differences between the two groups were found not to be significant (p
> 0.05). This data did not show that training had a significant impact on Cold Chain
Management indicators in Tshwane. The possible effect o f the small number of
clinics with no one trained in Cold Chain Management (six), on the level o f
55
significance should also be borne in mind38. Gazmararian et al observed that several
factors influenced compliance o f primary care physician offices, in four cities in USA,
with vaccine storage guidelines . Practice location, type o f physician, participation in
vaccine programmes, and using guidelines were associated with compliance.
Therefore, factors beyond training may have influenced the level o f cold chain
management in Tshwane.
56

5. CONCLUSION
The results o f a situation analysis into Drug Supply management in Tshwane show
that Drug Supply Management was generally below the WHO recommended
performance indicators1,11. It was below what Stafford et al observed in 20008, but
better than what Summers et al observed in NMTTS District o f Northern Province .
The status was comparable with, and in some instances better than, what was
observed in other countries11,12,17. Inadequate control o f and accountability for drugs
at all levels was the main shortcoming observed.
The study proved that in Tshwane, the type o f staff, staff training and rotation o f the
staff in charge o f Drug Supply Management did not have a significant impact on the
status o f Drug Supply Management. The main reasons for this observation were that
there was no one given full time responsibility for Drug Supply Management. The
trained personnel were neither appropriately deployed nor effectively supervised and
there was no effective cascading o f information after training. The adequacy o f the
content o f some o f the training received by the staff was questionable, according to
the literature surveyed41. The possible effect o f the small sample size in some o f the
comparison groups, on the level o f significance should also be borne in mind when
1 o
interpreting the p values .
Availability o f standard operating procedures was not associated with better Drug
Supply Management. This was due to the fact that in most cases where the standard
operating procedures were available, they were filed away and not available to the
staff performing the duties. However, a formal quantification method was associated
with better availability and less drug stock out incidences. Clinics supplied by
independent Sub-depots received a better service level and had less stock out
incidences o f key drugs compared with those supplied by Hospital Pharmacies.
57

6. RECOMMENDATIONS
There is need to improve accountability for and control o f drugs and consequently
improving the status o f Drug Supply Management in Tshwane by:
• ensuring that there is someone at each clinic with full-time responsibility for Drug
Supply Management, who should be effectively trained, appropriately deployed
and well supervised. This will ensure focused attention to all Drug Supply
Management issues
• ensuring that all clinics are supplied from an independent Sub-depot, as opposed
to a hospital pharmacy. Consideration should be made to merge operations o f
Pretoria Regional Pharmacy and the City o f Tshwane Sub-depot in order to
eliminate duplication and improve efficiency through cost-effective use o f
available resources
• ensuring all clinics have and use standard operating procedures. This will
standardise operations thereby facilitating control o f and accountability for drugs
• ensuring that all clinics adopt a formal method o f quantifying drugs. This will
facilitate budgeting for drugs, improve drug availability and reduce drug stock
outs
• increasing accountability for drugs up to the dispensing level by promoting, and
training staff in, the use o f stock cards
• improving information flow about the budget plus the budgeting process and
encouraging use o f the budget when ordering drugs.
58

7. REFERENCES
1. WHO/DAP (World Health Organisation/Action Programme on Essential Drugs).
How to Investigate Drug Use in Health Facilities: Selected Drug Use Indicators.
WHO/DAP/93.1. Geneva: WHO/DAP. 1993.
2. World Health Organisation: Highlights - WHO Medicine Strategy, 2000-2003.
Geneva: WHO/DAP. 2000.
3. World Health Organisation: Relationship between Drug Policies and Health
Policies, WHO/DAP/90.4. Geneva: WHO/DAP. 1990.
4. World Bank. Better Health in Africa: Experience and Lessons Learned. World
Bank Report No. 12577-Afr. English (ISBN: 0-8213-2817-4). Washington DC,
USA: World Bank. 1994.
5. Pillay Y, Leon N, Wilson T, Asia B, Barron P, Dudley L. Department o f Health
RSA, Guidelines for Functional Integration. Pretoria: National DoH. November
2002.
6. Health Systems Trust: National Primary Health Care Facilities Survey (Gauteng),
2000. ISBN: 1-919839-19-4. Durban: HST.2000.
7. City o f Tshwane Metropolitan Municipality: Analysis o f Phase 1 o f the Integrated
Development Plan - Social Development: Health Care. Pretoria: City o f Tshwane.
23 November 2001.
8. Stafford L, Muller K, Mabena C, Venter K, Brink C, Mmlatwa G, el al. Gauteng
Provincial Authority, Department o f Health, Region C: Report o f Pharmaceutical
Audit, Task Team C. Pretoria: Region C o f Gauteng DoH. June 2000.
9. Botha F, Venter K, Shadi C, Thomani R, Mmlatwa G, Choabi T, et al. City o f
Tshwane Metropolitan Municipality, Health and Welfare Services: Information
Infrastructure Review. Pretoria: City o f Tshwane. December 2001.
59

10. Kumalo F, Health Systems Trust: A Preliminary Situation Analysis o f Drug
Management in Tshwane and Metsweding (Region C). Pretoria/CISR: HST. 2001.
11. Quick JD, Rankin JR, Laing RO, O ’connor RW, Hogerzeil HV, Dukes MNG ei
al. MSH/ WHO-DAP (Management Sciences for Health & World Health
Organization- Action Programme on Essential Drugs). Managing Drug Supply:
The Selection, Procurement, Distribution, and Use o f Pharmaceuticals. (Second
Edition, Revised and Expanded). West Hartford, Connecticut, USA: Kumarian
Press. 1997.
12. Hogerzeil HV, Bimo, Ross-Degnan D, Laing RO, Ofori-Adjei D, Sontoso B, et al.
Field tests for rational drug use in twelve developing countries. Lancet 1993.
342:1408-10. 1993.
13. Gelders SFAM. Malawi essential drugs programme drug use indicator survey,
1991. Geneva: WHO-DAP. 1992.
14. Bimo. Field testing o f drug use indicators o f INRUD: report o f a field trip to
Indonesia, Bangladesh, Nepal, June-July 1991. 1991. Geneva: WHO-DAP.
15. Bimo. Report ofNigeria field test. INRUD News 1992; 3(1)9-10. Washington
DC: MSH-INRUD. 1992.
16. Christensen. Uganda Essential Drugs Management Programme: A strategy for the
improvement o f prescribing and drug use in rural health facilities in Uganda.
UEDMP, 2 September - 11 October 1990. Kampala, Uganda: Ministry o f Health.
1990.
17. Bannenberg WJ, Forshaw CJ, Fresle D, Sallami AO, Wahab HA. Evaluation o f
the Sudan Nile Province essential drugs project. WHO/DAP/91.10. Geneva:
WHO-DAP. 1991.
60

18. Hogerzeil HV, Walker GJA, Sallami AO, Alwan AA, Fernando G, Kassam FA.
Evaluation o f rational drug prescribing in Democratic Yemen. Social Science and
Medicine 1990; 31:823-828. Also published in 1989 by Hogerzeil HV, Walker
GJA, Sallami AO, Fernando G. Impact o f an essential drugs programme on
availability and rational use o f drugs. Lancet 1989; (1): 141-142. 1989.
19. ZEDAP (Zimbabwe Essential Drugs Action Programme). Ministry o f Health and
Child Welfare, Directorate o f Pharmacy. ZEDAP essential drugs survey. Harare,
Zimbabwe. 1991.
20. Desta Z, Abula T, Beyene L, Fantahun M, Yohannes AG, Ayalew S. Assessment
o f rational drug use and prescribing in Primary Health Care facilities in Northwest
Ethiopia. East African Medical Journal, December 1997; 74(12): 758-63. 1997.
21. Chukwuani CM, Onifade M, Sumonu K. Survey o f drug use practices and
antibiotic prescribing pattern at a general hospital in Nigeria. Pharmacy World and
Science, October 2002; 24(5): 188-95. 2002.
22. Trap B, Todd CH, Moore H, Laing R. The impact o f supervision on stock
management and adherence to treatment guidelines: A randomised controlled trial.
Health Policy and Planning. September 2001. 16(3): 273-80. Harare, Zimbabwe.
2001 .
23. Chareonkul C, Khun VL, Boonshuyar C. Rational drug use in Cambodia: study o f
three pilot health centres in Kampong Thom Province. Southeast Asian Journal of
Tropical Medicine and Public Health, June 2002; 33(2): 418-24. 2002.
24. Mallet HP, Njikam A, Scouflaire SM. Evaluation o f prescribing practices and of
the rational use o f medicine in Niger. Sante. 2001 July - September; 11(3): 185-
93. 2001.
61

25. Gazmararian JA, Oster NV, Green DC, Schuessler L, Howell K, Davis J, et al.
Vaccine storage in Primary Care Physician offices: assessment and intervention.
American Journal o f Preventive Medicine. November 2002: 23(4): 246-53. 2002.
26. Kafuko J.M, Zirabamuzaale C, Bagenda D. Uganda Essential Drugs Management
Programme: Rational Drug Use in Rural Health Units o f Uganda: Effect o f
National Standard Treatment Guidelines on Rational Drug Use, Marianum Press.
Kampala, Uganda: National Drug Authority. 1996.
27. Ofori Adjei D. 1992. Report on Tanzania field test. INRUD News 1992; 3(1): 9.
Washington DC: MSH-INRUD. 1992.
28. Kafle KK and members o f INRUD Nepal Core Group. INRUD drug use
indicators in Nepal: practice patterns in health posts in four districts. INRUD
News 1992; 3(1): 15. Washington DC: MSH-INRUD. 1992.
29. Sallet JP, Van Ommen AM. Equador: field test o f the pharmaceutical
management indicators matrix. Report o f work carried out under the USAID/LAC
Health and Sustainability Project. Washington DC: MSH. 1992.
30. Gray A. Performing an In-Depth Situational Analysis o f the Drug Management
System in a Health District. Durban: ISDS/HST. November 1999.
31. McCoy D and Bamford L. How to conduct a rapid Situational Analysis, ISDS.
Durban: ISDS/HST. January 1998.
32. Summers R, Conry I, Joubert A, Singh N, MEDUNSA/HST: Public sector
medicines supply and management in districts: an example from the Northern
Province. (ISBN No: 0-620-24377-5). Durban: HST. July 1999
33. Kishuna A, University o f Durban-Westville/HST: Assessment o f Pharmaceutical
Service Delivery at Primary Healthcare Clinics in KwaZulu/Natal. [n.d].
<http//www.hst.org.za/update/updl5.htm,> [Accessed 15.03.2002],
62

34. Health Systems Trust: Collecting and using Drug Use Indicators in Districts,
Kwik-Skwiz #19. Durban: ISDS/HST. [n.d],
35. Department o f Health: National Drug Policy South African, January 1996.
Pretoria: National DoH. 1996.
36. The National Department o f Health: Standard Treatment Guidelines and Essential
Drug List for South Africa, Primary Health Care. 1998 Edition.
37. Schoeman HS. 2002. Biostatistics for the Health Sciences. Second Edition, 2002.
Lecture Notes. Pretoria: Clinistat. 2002.
38. Utts JM. Seeing through Statistics. Pages 157-159. ISBN: 0-534-25776-3. Belmot,
Califonia 94002, USA: Duxbury Press, an imprint o f Wadsworth Publishing
Company, the division o f International Thomson Publishing Inc. 1996.
39. Mendenhall W and Sincich T. Statistics for Engineering and the Sciences. Fourth
edition. ISBN: 0-13-181017-0. Englewood Cliffs, New Jersey 07632, USA:
Prentice-Hall International Inc. 1995.
40. Gauteng Provincial Government: Regional and District Pharmacy Standard
Operating Procedures, 15 May 2000. Johannesburg: Gauteng DoH. 2000.
41. Gray A: Using Stock Cards to improve Drug Management, ISDS/HST Kwik-
Skwiz N ol3. Durban: ISDS/HST. [n.d],
42. Guinebault A. Storage and sterilisation techniques: the specific role o f the cold
chain. Children in the Tropics. 1986; (162-163): 53-68. 1986.
43. Gauteng Department o f Health: Implementation o f the Essential Drug Programme
(EDP) in Gauteng, Annexure C o f Circular minute No. 15 o f 1997. Johannesburg:
Gauteng DoH. 1997.
63
44. Health Systems Trust: Rational Drug Use Training Project: Review o f experience
in 1997: Problems identified and lessons learnt: Technical Report 6 and Kwik-
Skwiz #4. Durban: HST. [n.d].
64

APPENDICES
65

APPENDIX A; TABLES OF RESULTS
Table A1 Distribution of Patient Encounters in the Evaluated Clinics
Facility Type Owner Prospective Retrospective Total EncountersAtteridgeville Clinic CTMM 22 30 52Danville Clinic CTMM 12 28 40Folang Clinic CTMM 23 30 53Gazankulu Clinic CTMM - 26 26Hercules Clinic CTMM 7 30 37Karenpark Clinic CTMM - 30 30Laudium Clinic CTMM - 30 30Lyttelton Clinic CTMM - - 0Mamelodi West Clinic CTMM 30 25 55Phahameng Clinic CTMM 30 30 60Phomolong Clinic CTMM 26 30 56Rosslyn Clinic CTMM - 30 30Silverton Clinic CTMM 22 30 52Stanza Bopape 2 Clinic CTMM 30 - 30Laudium CHC GPA - 27 27Soshanguve 3 CHC GPA - 30 30Stanza Bopape CHC GPA - 30 30Boikhutsong Clinic GPA - 29 29Bophelong Clinic GPA 30 30 60Eesterust Clinic GPA 2 20 22Mandisa Shiceka Clinic GPA 30 1 31Pretoria North Clinic GPA 11 29 40Skinner Street Clinic GPA - 30 30Soshanguve JJ Clinic GPA - 30 30Sedibeng HC Clinic GPA 15 30 45Refentse CHC Moretele 7 30 37Temba CHC Moretele - 30 30Jubilee Gateway Clinic Moretele - 30 30New Eersterust Clinic Moretele - 30 30Ramotse Clinic Moretele 24 30 54Suurman Clinic Moretele - 30 30Boekenhout CHC ODI - 30 30Kgabo CHC OD1 - 30 30Phedison I CHC ODI - 30 30Itireleng Clinic ODI - 30 30Mpho ya Batho Clinic ODI - 30 30TOTAL 321 965 1286
CTMM = City of Tshwane Metropolitan Municipality, GPA = Gauteng Provincial Authority,
CHC = Community Health Centre
66
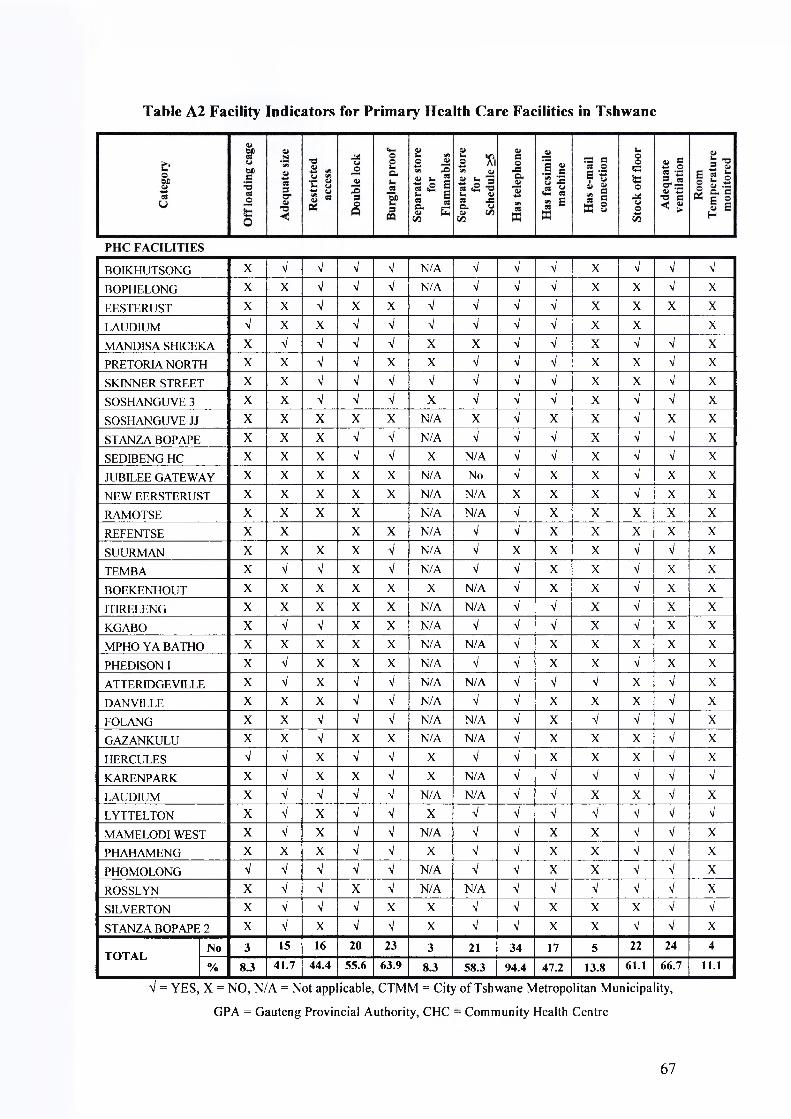
Table A2 Facility Indicators for Primary Health Care Facilities in Tshwane
BOIKHUTSONG X V V V V N/A V V V X V V V
BOPHELONG X X V V V N/A V V a/ X X V XEESTERUST X X a/ X X V a/ V V X X X XLAUDIUM V X X V V V V V V X X XMAND1SA SHICEKA X V V V V X X V V X V V XPRETORIA NORTH X X V V X X V V V X X V XSKINNER STREET X X V V V V V V V X X V XSOSHANGUVE 3 X X a/ V V X V V V X V V XSOSHANGUVE JJ X X X X X N/A X V X X V X XSTANZA BOPAPE X X X V V N/A V V V X V V XSEDIBENG HC X X X V V X N/A V V X V V XJUBILEE GATEWAY X X X X X N/A No V X X V X XNEW EERSTERUST X X X X X N/A N/A X X X V X XRAMOTSE X X X X N/A N/A V X X X X XREFENTSE X X X X N/A V V X X X X XSUURMAN X X X X V N/A V X X X V V XTEMBA X V V X V N/A V V X X V X XBOEKENHOUT X X X X X X N/A V X X V X XITIRELENG X X X X X N/A N/A V a/ X V X XKGABO X V V X X N/A V V V X V X XMPHO YA BATHO X X X X X N/A N/A V X X X X XPHEDISON I X V X X X N/A a/ V X X V X XATTERIDGEVILLE X V X V V N/A N/A V V V X V XDANVILLE X X X V V N/A V V X X X V XFOLANG X X V V V N/A N/A V X V V V XGAZANKULU X X a/ X X N/A N/A V X X X V XHERCULES V V X V a/ X V V X X X V XKARENPARK X V X X V X N/A V V V V V V
LAUDIUM X V V V V N/A N/A V V X X V XLYTTELTON X V X V V X V V V V V V V
MAMELODI WEST X V X V V N/A V V X X V V XPHAHAMF.NG X X X V a/ X V a/ X X V V XPHOMOLONG V V V V V N/A V V X X V V XROSSLYN X V V X V N/A N/A V V V V V XSILVERTON X V V V X X V V X X X V V
STANZA BOPAPE 2 X V X V V X V V X X V V X
TOTAL No 3 15 16 20 23 3 21 34 17 5 22 24 4
% 8.3 41.7 44.4 55.6 63.9 8.3 58.3 94.4 47.2 13.8 61.1 66.7 11.1
V = YES, X = NO, N/A = Not app icable, CTMM = City
GPA = Gauteng Provincial Authority, CHC
of Tshwane Metropolitan Municipa
: Community Health Centre
ity,
67

Table A3 Indicators for Drug Procurement, Availability and Control
No F a c i l i ty T y p e O w n e rH a sall
S O P s
R e c e iv in gp r o c e d u r e s
L e a dT im e(d a y s )
%O r d e r
S u p p l ie d
O r d e r in gIn terv a l
(d a y s )
% 0 / Sin
y e a r
Q u a n t .M e th o d
% h a s R O L
% in S to c k
U ses to c kc a r d s
%C a r d = S h e l f
1 Boikhutsong Clinic GPA Yes Adequate - - - - Max-Min 0.0 82.4 Yes 61.12 Bophelong Clinic GPA Yes Inadequate 3.4 90.0 40.5 20.0 ROL 50.0 81.0 Yes 54.53 Eesterust Clinic GPA No Adequate 14.1 82.1 52.6 39.1 Experience 0.0 95.7 No 46.24 Laudium CHC GPA Yes Adequate 7.0 78.8 51.3 12.5 ROL 100.0 90.6 Yes 28.15 Mandisa Shiceka Clinic GPA No Adequate 9.1 77.2 16.5 11.1 ROL 88.9 92.6 Yes 55.66 Pretoria North Clinic GPA No Adequate 3.7 86.5 20.0 0.0 Experience 0.0 89.5 Yes 26.37 Skinner Street Clinic GPA No Adequate - - - - ROL - - Yes -8 Soshanguve 3 CHC GPA Yes Inadequate 10.6 - 36.2 26.3 ROL 63.2 94.7 Yes 31.69 Soshanguve JJ Clinic GPA No Inadequate - - - - Experience - - Yes -10 Stanza Bopape CHC GPA Yes Inadequate 9.5 83.8 34.3 0.0 ROL 87.5 93.8 Yes 62.511 Sedibeng HC Clinic GPA No Adequate 3.6 97.7 83.2 59.1 Experience 0.0 78.3 Yes 100.012 Jubilee Gateway Clinic Moretele Yes Inadequate 17.1 - 39.4 83.3 Experience 0.0 83.3 Yes 54.513 New Eersterust Clinic Moretele No Inadequate 9.3 - 52.8 40.9 Experience 0.0 90.9 Yes 66.714 Ramotse Clinic Moretele No Inadequate 15.8 - 62.2 33.3 Experience 0.0 70.8 Yes 85.715 Refentse CHC Moretele Yes Adequate 9.8 86.7 58.4 46.2 Experience 0.0 88.0 Yes 64.016 Suurman Clinic Moretele Yes Adequate 9.3 74.7 57.2 70.0 Experience 60.0 75.0 Yes 90.917 Temba CHC Moretele Yes Adequate 11.4 70.1 45.3 73.9 Experience 43.5 91.3 Yes 87.018 Boekenhout CHC Odi Yes Adequate 7.5 61.9 37.3 42.9 Experience 0.0 90.0 Yes 16.719 Itireleng Clinic Odi No Inadequate 12.6 57.9 57.7 - Experience 0.0 100.0 Yes 8.320 Kgabo CHC Odi Yes Adequate 8.8 69.5 27.4 66.7 Experience 0.0 76.2 Yes 83.321 Mpho Ya Batho Clinic Odi Yes Adequate 4.6 57.7 65.8 18.2 Experience 0.0 100.0 Yes 20.022 Phedisong 1 CHC Odi Yes Adequate 6.7 88.9 41.0 25.0 Experience 0.0 70.0 Yes 85.723 Atteridgeville Clinic CTMM No Inadequate 9.6 77.6 85.7 14.3 Experience 0.0 90.5 NO -24 Danville Clinic CTMM No Inadequate 5.6 - 53.5 50.0 Max-Min 91.7 87.5 NO 12.5
68

T a b le A 3 In d ic a to r s fo r D r u g P r o c u r e m e n t , A v a i la b i l i ty a n d C o n tr o l
No F a c i l i ty T y p e O w n e rH a sall
S O P s
R e c e iv in gp r o c e d u r e s
L ea dT im e(d a y s )
%O r d e r
S u p p l ie d
O r d e r in gIn terv a l
(d a y s )
% o /sin
y e a r
Q u a n t .M e th o d
% has R O L
% in S to c k
U ses to ckc a r d s
%C a r d = S h e l f
25 Folang Clinic C T M M No Inadequate 16.2 74.2 86.0 16.0 Max-Min 80.0 96.0. NO -26 Gazankulu Clinic C T M M No Inadequate - 93.8 - 15.0 Max-Min 80.0 70.0 NO -27 Hercules Clinic C T M M No Adequate 10.6 73.7 126.4 26.9 ROL 0.0 92.3 NO -28 Karenpark Clinic C T M M Yes Adequate 18.0 - 95 5 50.0 ROL 0.0 70.8 Yes 81.029 Laudium Clinic C T M M Yes Inadequate 12.7 92.9 61.4 - Experience 0.0 100.0 NO -
30 Lyttelton Clinic C T M M Yes Adequate 14.8 78.3 71.5 - Max-Min - - Yes -
31 Mamelodi West Clinic C T M M No Inadequate 23.2 - 84.5 17.6 Max-Min 0.0 93.8 NO -
32 Phahameng Clinic C T M M No Adequate 19.1 75.6 87.9 16.7 Max-Min 75.0 78.3 NO -33 Phomolong Clinic C T M M No Inadequate 12.7 76.9 52.6 10.5 Max-Min 84.2 94.7 NO -
34 Rosslyn Clinic C T M M Yes Adequate 10.2 93.3 51.4 11.1 ROL 61.1 100.0 Yes 62.535 Silverton Clinic C T M M No Adequate 22.5 78.3 56.3 60.9 Max-Min 60.9 91.3 NO -
36 Stanza Bopape 2 Clinic C T M M No Inadequate 10.0 75.0 98.6 35.0 Max-Min 90.0 90.0 NO -
M e a n 11.2 79 .0 56.1 33.1 3 3 .8 8 7 .6 55 .9
M a x im u m 23.2 9 7 .7 126 .4 83 .3 10 0 .0 100 .0 1 0 0 .0
M in im u m 3.4 5 7 .7 16.5 0 .0 0 .0 7 0 .0 8.3
P E R F O R M A N C E T A R G E T Y e s A d e q u a t e - 95 - < 1 0R O L /M i n -
M a x100 9 0 Y e s 100
% o f c l in ic s w h ic h m e e t ta r g e t 47 5 6 - 4 - 7 53 3 58 67 4
SOPs = Standard operating procedures, O/S = Out o f stock, ROL = Re-Order Level, % has ROL = Percentage o f tracer items whose Re-Order Level had been determined, Min-Max = Minimum-Maximum level, Card=Shelf means the balance quantity on the card was equal to the quantity
physically on the shelf.
69
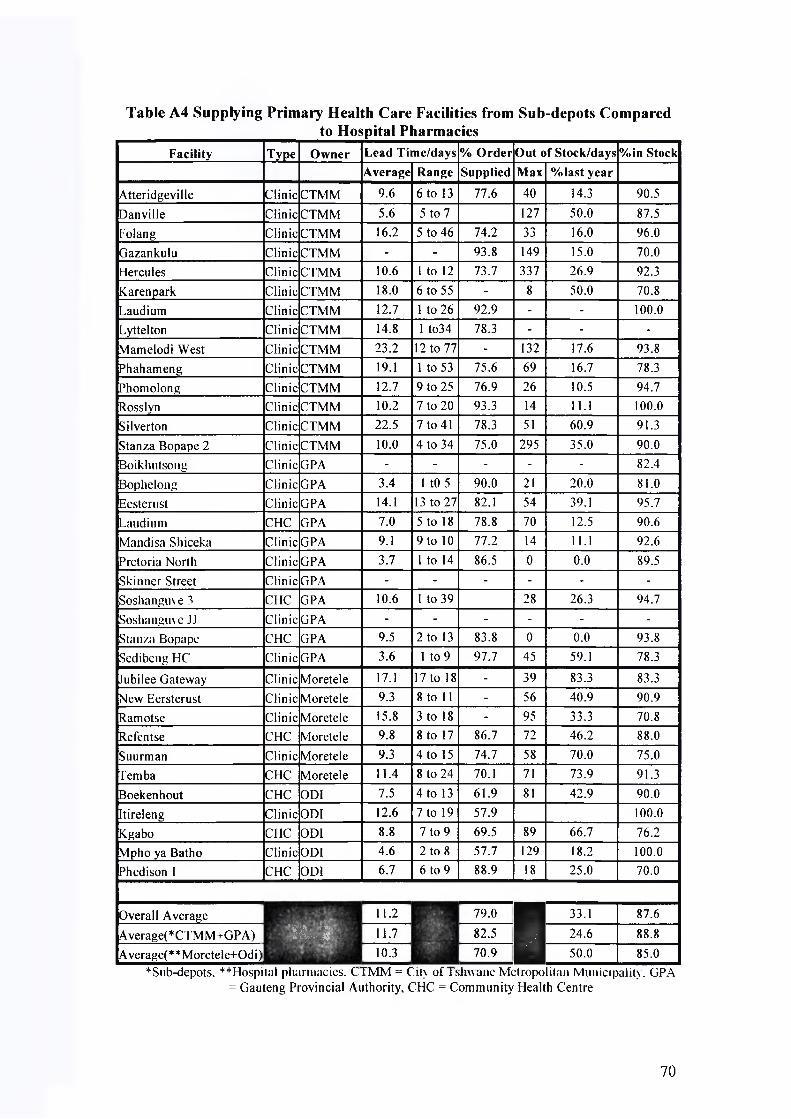
Table A4 Supplying Primary Health Care Facilities from Sub-depots Comparedto Hospital Pharmacies
F a c i l i ty T y p c O w n e r L e a d T i m e / d a y s % O r d e r O u t o f S t o c k /d a y s % in S to c k
A v e r a g e R a n g e S u p p l ie d M a x % la s t y e a r
Atteridgeville Clinic CTMM 9.6 6 to 13 77.6 40 14.3 90.5Danville Clinic CTMM 5.6 5 to 7 127 50.0 87.5Folang Clinic CTMM 16.2 5 to 46 74.2 33 16.0 96.0Gazankulu Clinic CTMM - - 93.8 149 15.0 70.0Hercules Clinic CTMM 10.6 1 to 12 73.7 337 26.9 92.3Karenpark Clinic CTMM 18.0 6 to 55 - 8 50.0 70.8Laudium Clinic CTMM 12.7 1 to 26 92.9 - - 100.0Lyttelton Clinic CTMM 14.8 1 to34 78.3 - - -Mamelodi West Clinic CTMM 23.2 12 to 77 - 132 17.6 93.8Phahameng Clinic CTMM 19.1 1 to 53 75.6 69 16.7 78.3Phomolong Clinic CTMM 12.7 9 to 25 76.9 26 10.5 94.7Rosslyn Clinic CTMM 10.2 7 to 20 93.3 14 11.1 100.0Silverton Clinic CTMM 22.5 7 to 41 78.3 51 60.9 91.3Stanza Bopape 2 Clinic CTMM 10.0 4 to 34 75.0 295 35.0 90.0Boikhutsong Clinic GPA - - - - - 82.4Bophelong Clinic GPA 3.4 1 tO 5 90.0 21 20.0 81.0Eestenist Clinic GPA 14.1 13 to 27 82.1 54 39.1 95.7Laudium CHC GPA 7.0 5 to 18 78.8 70 12.5 90.6Mandisa Shiceka Clinic GPA 9.1 9 to 10 77.2 14 11.1 92.6Pretoria North Clinic GPA 3.7 1 to 14 86.5 0 0.0 89.5Skinner Street Clinic GPA - - - - - -Soshanguve3 CHC GPA 10.6 1 to 39 28 26.3 94.7Soshanguve JJ Clinic GPA - - - - - -Stanza Bopape CHC GPA 9.5 2 to 13 83.8 0 0.0 93.8Sedibeng HC Clinic GPA 3.6 1 to 9 97.7 45 59.1 78.3
Jubilee Gateway Clinic Moretele 17.1 17 to 18 - 39 83.3 83.3New Eersterust Clinic Moretele 9.3 8 to 11 - 56 40.9 90.9Ramotse Clinic Moretele 15.8 3 to 18 - 95 33.3 70.8Refentse CHC Moretele 9.8 8 to 17 86.7 72 46.2 88.0Suurman Clinic Moretele 9.3 4 to 15 74.7 58 70.0 75.0Temba CHC Moretele 11.4 8 to 24 70.1 71 73.9 91.3Boekenhout CHC OD1 7.5 4 to 13 61.9 81 42.9 90.0Itireleng Clinic ODI 12.6 7 to 19 57.9 100.0Kgabo CHC ODI 8.8 7 to 9 69.5 89 66.7 76.2Mpho ya Batho Clinic ODI 4.6 2 to 8 57.7 129 18.2 100.0Phedison I CHC ODI 6.7 6 to 9 88.9 18 25.0 70.0
1 1Overall Average
’O A ■ t i l M K ' 1
11.2v
79.0 s 33.1 87.6
Average(*CTMM+GPA) 11.7 82.5 24.6 88.8Average(**Moretele+Odi) 10.3 70.9 50.0 85.0
*Sub-depots. **Hospit;il pharmacies. CTMM = City of Tshwane Metropolitan Municipality. GPA = Gauteng Provincial Authority, CHC = Community Health Centre
70

Table A5 Relationship between Staff in-charge of Drug Supply Management,
Nature of Deployment and some Drug Supply Management Indicators
F a c il ity T y p e O w n e r In c h a r g e o f D S M R e s tr ic ta c c e ss
A d e q u a teR e c e iv in g
p r o c e d u r e s
S to ck o f f th e f lo o rQ u a lif ic a t io n D u ra tio n
Suurman Clinic Moretele Nurse (Enrld) Permanent X V VKgabo CHC ODI Nurse (Enrld) Permanent V V VStanza Bopape CHC GPA Nurse (Enrld) Rotation X X VRamotse Clinic Moretele Nurse (Enrld) Rotation X X XTemba CHC Moretele Nurse (Enrld) Rotation V V VGazankulu Clinic CTMM Nurse (Reg) Permanent V X XHercules Clinic CTMM Nurse (Reg) Permanent X V XKarenpark Clinic CTMM Nurse (Reg) Permanent X V VLaudium Clinic CTMM Nurse (Reg) Permanent V X XLyttelton Clinic CTMM Nurse (Reg) Permanent X V VRosslyn Clinic CTMM Nurse (Reg) Permanent V V VBoikhutsong Clinic GPA Nurse (Reg) Permanent V V VBophelong Clinic GPA Nurse (Reg) Permanent V X XEestemst Clinic GPA Nurse (Reg) Permanent V V XPretoria North Clinic GPA Nurse (Reg) Permanent V V XSkinner Street Clinic GPA Nurse (Reg) Permanent V V XSoshanguve JJ Clinic GPA Nurse (Reg) Permanent X X VSedibeng HC Clinic GPA Nurse (Reg) Permanent X V VRefen tse CHC Moretele Nurse (Reg) Permanent V V XItireleng Clinic ODI Nurse (Reg) Permanent X X VSilverton Clinic CTMM Nurse (Reg) Rotation V V XLaudium CHC GPA Nurse (Reg) Rotation X V XMandisa Shiceka Clinic GPA Nurse (Reg) Rotation V V VSoshanguve3 CHC GPA Nurse (Reg) Rotation V X VJubilee Gateway Clinic Moretele Nurse (Reg) Rotation X X VNew Eersterust Clinic Moretele Nurse (Reg) Rotation X X VBoekenhout CHC ODI Nurse (Reg) Rotation X V VMpho ya Batho Clinic ODI Nurse (Reg) Rotation X V XPhedisong 1 CHC ODI Nurse (Reg) Rotation X V VMamelodi West Clinic CTMM Pharm Asst Permanent X X VAtteridgeville Clinic CTMM Pharm Asst Rotation X X XDanville Clinic CTMM Pharm Asst Rotation X X XFolang Clinic CTMM Pharm Asst Rotation V X VPhahameng Clinic CTMM Pharm Asst Rotation X V VPhomolong Clinic CTMM Pharm Asst Rotation V X VStanza Bopape 2 Clinic CTMM Pharm Asst Rotation X X VO d d R a tio : P A v e r su s N u r se (R e g + E n r ld ) O R 0.429 0.088 1.765
O d d R a tio : P e r m a n e n t v e r su s R o ta tio n O R 2.500 2.500 0.625
V = Yes, X = No, Reg = Registered, CTMM = City of Tshwane Metropolitan Municipality, GPA =
Gauteng Provincial Authority, CHC = Community Health Centre
71

Table A6 Effect of the Number of Staff Trained in Drug Supply Management on
some Drug Supply Management Indicators
F a c i l i ty T y p e O w n e r N oT r a in e d in D S M
% I te m s S t o c k = c a r d
R e s tr ic ta c c e s s
A d e q u a t eR e c e iv in g
p r o c e d u r e s
S to c k o f f the f lo o r
Kgabo CHC ODI 16 83.3 V V VTemba CHC Moretele 11 87.0 V V VSkinner Street Clinic GPA 10 - V V XEestemst Clinic GPA 8 46.2 V V XBoekenhout CHC ODI 6 16.7 X V VMandisa Shiceka Clinic GPA 5 55.6 V V VBoikliutsong Clinic GPA 4 61.1 V V VLandium CHC GPA 4 28.1 X V XPhedisong I CHC ODI 4 85.7 X V VSoshanguve3 CHC GPA 4 31.6 V X VHercules Clinic CTMM 3 - X V XStanza Bopape CHC GPA 3 62.5 X X VMpho ya Batho Clinic ODI 2 20.0 X V XStanza Bopape 2 Clinic CTMM 2 - X X VSuurman Clinic Moretele 2 90.9 X V VAtteridgeville Clinic CTMM 1 - X X XBophelong Clinic GPA 1 54.5 V X XDanville Clinic CTMM 1 12.5 X X XFolang Clinic CTMM 1 - V X <Jubilee Gateway Clinic Moretele 1 54.5 X X VKarenpark Clinic CTMM 1 81.0 X V VLyttelton Clinic CTMM 1 - X V VPh ah am eng Clinic CTMM 1 - X < VPhomolong Clinic CTMM 1 - V X VPretoria North Clinic GPA 1 26.3 V V XRamotse Clinic Moretele 1 85.7 X X XRefentse CHC Moretele 1 64.0 V V XRosslyn Clinic CTMM 1 62.5 V V VSedibeng HC Clinic GPA 1 100.0 X V VSoshanguve JJ Clinic GPA 1 - X X VItireleng Clinic ODI 0 8.3 X X VLaudium Clinic CTMM 0 - V X XNew Eersterust Clinic Moretele 0 66.7 X X VSilverton Clinic CTMM 0 - V V XGazankulu Clinic CTMM - - V X XMamelodi West Clinic CTMM - - X X VOdd Ratio: 1 Vs 0 trained in DSM OR 0 .765 5.182 1.727
Correlation with No. trained in DSM r + 0 .194
V = YES, X = NO, CTMM = City of Tshwane Metropolitan Municipality, GPA = Gauteng Provincial
Authority, CHC = Community Health Centre, DSM = Drug Supply Management
72

Table A7 Impact of Determining Re-Order Level/Minimum-Maximum Levels on
Drug Availability Indicators
Facility Type Owner % Items with
ROL/Max
% Out of Stock last
year
% in Stock % Prescribed drugs
dispensedLaudium CHC GPA 100.0 12.5 90.6Danville Clinic CTMM 91.7 50.0 87.5 100.0Stanza Bopape 2 Clinic CTMM 90.0 35.0 90.0 100.0Mandisa Shiceka Clinic GPA 88.9 11.1 92.6 100.0Stanza Bopape CHC GPA 87.5 0.0 93.8 -
Phomolong Clinic CTMM 84.2 10.5 94.7 96.5Folang Clinic CTMM 80.0 16.0 96.0 -
Gazankulu Clinic CTMM 80.0 15.0 70.0 -
Phahameng Clinic CTMM 75.0 16.7 78.3 100.0Soshanguve 3 CHC GPA 63.2 26.3 94.7 -
Rosslyn Clinic CTMM 61.1 11.1 100.0 -
Silverton Clinic CTMM 60.9 60.9 91.3 100.0Suurman Clinic Moretele 60.0 70.0 75.0 -
Bophelong Clinic GPA 50.0 20.0 81.0 100.0Temba CHC Moretele 43.5 73.9 91.3 -
Atteridgeville Clinic CTMM 0.0 14.3 90.5 -
Boekenhout CHC ODI 0.0 42.9 90.0 -
Boikhutsong Clinic GPA 0.0 - 82.4 -
Eesterust Clinic GPA 0.0 39.1 95.7 100.0Hercules Clinic CTMM 0.0 26.9 92.3 100.0Itireleng Clinic ODI 0.0 - 100.0 -
Jubilee Gateway Clinic Moretele 0.0 83.3 83.3 -
Karenpark Clinic CTMM 0.0 50.0 70.8 -
Kgabo CHC ODI 0.0 66.7 76.2 -
Laudium Clinic CTMM 0.0 - 100.0 -
Mamelodi West Clinic CTMM 0.0 17.6 93.8 100.0Mpho ya Batho Clinic ODI 0.0 18.2 100.0 -
New Eersterust Clinic Moretele 0.0 40.9 90.9 -Phedison I CHC ODI 0.0 25.0 70.0 -Pretoria North Clinic GPA 0.0 0.0 89.5 100.0Ramotse Clinic Moretele 0.0 33.3 70.8 93.6Refentse CHC Moretele 0.0 46.2 88.0 -Sedibeng HC Clinic GPA 0.0 59.1 78.3 98.1Lyttelton Clinic CTMM - - - -Skinner Street Clinic GPA - - - -Soshanguve JJ Clinic GPA - - - -Correl. with % of Items with ROL r -0.299 0.104 0.200
ROL/Max = Re-Order Level and Minimum-Maximum Level, CTMM = City of Tshwane Metropolitan Municipality, GPA = Gauteng Provincial Authority, CHC = Community Health Centre,
Correl = Correlation
73

Tab e A8 Summary of Qualitative Observations*F a c i l i t y T y p e O w n e r In c h a r g e o f D S M N u m b e r T r a in e d
A c c e s sP o l icy
S t o r a g e F a c i l i t ie s
Q u a l i f i c a t io n D u r a t io n D S M R D U C C M R e str ic te d S ize B u r g .p r o o f O f f th e f lo o r V e n t i la t io n R o o m T e m p R e c .C a g e
Boikhutsong Clinic GPA Reg.Nurse Permanent 4 10 10 Yes Adequate Yes Yes AC Yes NoBophelong Clinic GPA Reg.Nurse Permanent 1 0 1 Yes Inadequate Yes No AC No NoEesterust Clinic GPA Reg.Nurse Permanent 8 7 - Yes Inadequate No No Ceiling No NoLaudium CHC GPA Reg.Nurse Rotation 4 16 16 No Inadequate Yes No AC No YesMandisa Shiceka Clinic GPA Reg.Nurse Rotation 5 0 5 Yes Adequate Yes Yes AC No No
Pretoria North Clinic GPA Reg.Nurse Permanent 1 17 4 Yes Inadequate No No AC No NoSkinner Street Clinic GPA Reg.Nurse Permanent 10 0 10 Yes Inadequate Yes No AC No NoSoshanguve 3 CHC GPA Reg.Nurse Rotation 4 - 3 Yes Inadequate Yes Yes AC No NoSoshanguve JJ Clinic GPA Reg.Nurse Permanent 1 1 7 No Inadequate No Yes Ceiling No NoStanza Bopape CHC GPA Enrld Nurse Rotation 3 11 3 No Inadequate Yes Yes AC No NoSedibeng HC Clinic GPA Reg.Nurse Permanent 1 2 0 No Inadequate Yes Yes Desk fan No NoJubilee Gateway Clinic Moretele Reg.Nurse Rotation 1 1 0 No Inadequate No Yes Ceiling No NoNew Eersterust Clinic Moretele Reg.Nurse Rotation 0 1 1 No Inadequate No Yes Ceiling No NoRamotse Clinic Moretele Enrld Nurse Rotation 1 1 1 No Inadequate Yes No Ceiling No NoRefentse CHC Moretele Reg.Nurse Permanent 1 0 0 Yes Inadequate No No Ceiling No NoSuurman Clinic Moretele Enrld Nurse Permanent 2 2 2 No Inadequate Yes Yes Desk fan No NoTemba CHC Moretele Enrld Nurse Rotation 11 11 11 Yes Adequate Yes Yes Ceiling No NoBoekenhout CHC ODI Reg.Nurse Rotation 6 6 6 No Inadequate No Yes Ceiling No NoItireleng Clinic ODI Reg.Nurse Permanent 0 0 0 NO Inadequate No Yes Ceiling No No
* DSM = Drug Supply Management, RDU = Rational Drug Use, CCM = Cold Chain Management, CTMM = City of Tshwane Metropolitan Municipality, GPA = Gauteng Provincial Authority, CHC = Community Health Centre, Burg. = Burglar, Rec.= Receiving, AC = Air Conditioner.
74

Tab e A8 Summary of Qualitative Observations*
F a c i l i t y T y p e O w n e r In c h a r g e o f D S M N u m b e r T r a in e dA c c e s sP o licy
S t o r a g e F a c i l i t ie s
Q u a l i f ic a t io n D u r a t io n D S M R D U C C M R e s tr ic te d S ize B u r g .p r o o f O f f th e f loor V e n t i la t io n R o o m T e m p R e c .C a g e
Kgabo CHC ODI Enrld Nurse Permanent 16 16 27 Yes Adequate No Yes Ceiling No No
Mpho ya Batho Clinic ODI Reg.Nurse Rotation 2 0 0 No Inadequate No No Ceiling No No
Phedison I CHC ODI Reg.Nurse Rotation 4 1 0 No Adequate No Yes Ceiling No No
Atteridgeville Clinic CTMM Pharm Asst Rotation 1 5 6 No Adequate Yes No AC No No
Danville Clinic CTMM Pharm Asst Rotation 1 3 1 No Inadequate Yes No AC No No
Folang Clinic CTMM Pharm Asst Rotation 1 10 1 Yes Adequate Yes Yes AC No No
Gazankulu Clinic CTMM Reg.Nurse Permanent 1 1 Yes Inadequate No No Desk fan No No
Hercules Clinic CTMM Reg.Nurse Permanent 3 3 3 No Inadequate Yes No AC No Yes
Karenpark Clinic CTMM Reg.Nurse Permanent 1 4 0 No Adequate Yes Yes AC Yes NoLaudium Clinic CTMM Reg.Nurse Permanent 0 5 5 Yes Adequate Yes No AC No NoLyttelton Clinic CTMM Reg.Nurse Permanent 1 6 1 No Adequate Yes Yes AC Yes NoMamelodi West Clinic CTMM Pharm Asst Permanent - - No Adequate Yes Yes AC No NoPhahameng Clinic CTMM Pharm Asst Rotation 1 5 5 No Inadequate Yes Yes AC No NoPhomolong Clinic CTMM Pharm Asst Rotation 1 6 2 Yes Adequate Yes Yes AC No YesRosslyn Clinic CTMM Reg.Nurse Permanent 1 5 1 Yes Adequate Yes Yes AC No NoSilverton Clinic CTMM Reg.Nurse Rotation 0 3 1 Yes Adequate No No AC Yes NoStanza Bopape 2 Clinic CTMM Pharm Asst Rotation 2 10 8 No Adequate Yes Yes AC No No
T A R G E T P h a r m A ss tP e r m a n ent 1 1 1 Y e s A d e q u a t e Y e s Y e s A C /F a n Y e s Y e s
% w h o c o m p ly 19 % 5 0 % 8 8 % 8 2 % 7 9 % 4 4 % 4 2 % 6 4 % 6 1 % 6 7 % 11 % 8 %
75

Table A8 Summary o ‘Qualitative Observations*Facility Type Owner Separate storage for Has Phone Has Fax Type of Fridge Cold Chain Management
Flammables Schedule 5 EPI Domestic Has fridge Stock in door Food in Fridge Daily Therm Type Back-up
Boikhutsong Clinic GPA N/A Yes Yes Yes - - No - - - - -
Bophelong Clinic GPA N/A Yes Yes Yes - Yes Yes No No Yes Actual Yes
Eesterust Clinic GPA Yes Yes Yes Yes - Yes Yes Yes No No None No
Laudium CHC GPA Yes Yes Yes Yes Yes - Yes No No Yes Min-Max Yes
Mandisa Shiceka Clinic GPA No No Yes Yes Yes - Yes No No Yes Actual No
Pretoria North Clinic GPA No Yes Yes Yes Yes - Yes No No Yes Actual No
Skinner Street Clinic GPA Yes Yes Yes Yes - Yes Yes No Yes Yes Actual No
Soshanguve 3 CHC GPA No Yes Yes Yes Yes - Yes No No Yes Actual Yes
Soshanguve JJ Clinic GPA N/A No Yes No - Yes Yes No Yes No None No
Stanza Bopape CHC GPA N/A Yes Yes Yes - Yes Yes No No Yes Min-Max Yes
Sedibeng HC Clinic GPA No N/A Yes Yes - No - - - - -
Jubilee Gateway Clinic Moretele N/A No Yes No - Yes Yes Yes No Yes Actual Yes
New Eersterust Clinic Moretele N/A N/A No No - Yes Yes Yes No Yes Actual No
Ramotse Clinic Moretele N/A N/A Yes No - Yes Yes No No No Actual No
Refentse CHC Moretele N/A Yes Yes No Yes - Yes No No Yes Actual No
Suurman Clinic Moretele N/A Yes No No - - No - - - - -
Temba CHC Moretele N/A Yes Yes No - Yes Yes Yes No Yes Actual No
Boekenhout CHC ODI No N/A Yes No Yes - Yes No No No Actual No
Itireleng Clinic ODI N/A N/A Yes Yes Yes Yes No No No Actual No
Kgabo CHC ODI N/A Yes Yes Yes Yes - Yes No No Yes Actual No
* CTMM = City of Tshwane Metropolitan Municipality, GPA = Gauteng Provincial Authority, CHC = Community Health Centre, EPI = Expanded Programme of Immunisation, Min-Max = Minimum- Maximum, Therm. = Thermometer.
76

Table A8 Summary o 'Qualitative Observations*Facility Type Owner Separate storage for Has Phone Has Fax Type of Fridge Cold Chain Management
Flammables Schedule 5 EPI Domestic Has fridge Stock in door Food in Fridge Daily Therm Type Back-up
Mpho ya Batho Clinic ODI N/A N/A Yes No Yes - Yes No No Yes Actual No
Phedison I CHC ODI N/A Yes Yes No Yes - Yes No No Yes Actual No
Atteridgeville Clinic CTMM N/A N/A Yes Yes - Yes Yes No No Yes Min-Max No
Danville Clinic CTMM N/A Yes Yes No - Yes Yes No No Yes Min-Max No
Folang Clinic CTMM N/A N/A Yes No - Yes Yes Yes No Yes Min-Max Yes
Gazankulu Clinic CTMM N/A N/A Yes No - Yes Yes No No Yes Min-Max No
Hercules Clinic CTMM No Yes Yes No - Yes Yes No Yes Yes Min-Max No
Karenpark Clinic CTMM No N/A Yes Yes Yes - Yes No No Yes Min-Max No
Laudium Clinic CTMM N/A N/A Yes Yes Yes Yes No No Yes Min-Max No
Lyttelton Clinic CTMM No Yes Yes Yes Yes Yes Yes No No Yes Min-Max No
Mamelodi West Clinic CTMM N/A Yes Yes No - Yes Yes Yes No Yes Min-Max No
Phahameng Clinic CTMM No Yes Yes No - Yes Yes No No Yes Min-Max No
Phomolong Clinic CTMM N/A Yes Yes No - Yes Yes No No Yes Min-Max No
Rosslyn Clinic CTMM N/A N/A Yes Yes Yes - Yes No No Yes Actual No
Silverton Clinic CTMM No Yes Yes No - Yes Yes No No Yes Min-Max No
Stanza Bopape 2 Clinic CTMM No Yes Yes No - Yes Yes No No Yes Min-Max No
TARGET Yes Yes Yes Yes Yes Yes N o N o Yes Min-Max Yes
% who comply 8% 58% 94% 47% 36% 92% 82% 91% 85% 45% 18%
77

Table A8 Summary of Qualitative Observations4F a c i l i ty T y p e O w n e r P R O C E D U R E S M E D I C I N E B U D G E T
A ll S O P s Q u a n t i f i c a t io n R e c e iv in g S to c k c a r d s K n o w s % L a s t y e a r % T h is y e a r C o n tr o l
Boikhutsong Clinic GPA Yes Max-Min Adequate Yes Yes 74 31.1 YesBophelong Clinic GPA Yes ROL Inadequate Yes Yes No figure 45.6 No
Eesterust Clinic GPA No Experience Adequate NO No 145.2 Not calc No
Laudium CHC GPA Yes ROL Adequate Yes Yes Only exp Only exp Yes
Mandisa Shiceka Clinic GPA No ROL Adequate Yes Yes Don't know Not calc No
Pretoria North Clinic GPA No Experience Adequate Yes No Don't know Don’t know No
Skinner Street Clinic GPA No ROL Adequate Yes Yes Disputed 30.3 Yes
Soshanguve 3 CHC GPA Yes ROL Inadequate Yes Yes 139.1 96.8 No
Soshanguve JJ Clinic GPA No Experience Inadequate Yes No None None No
Stanza Bopape CHC GPA Yes ROL Inadequate Yes Yes 94.1 Not calc No
Sedibeng HC Clinic GPA No Experience Adequate Yes No 116.5 Only exp No
Jubilee Gateway Clinic Moretele Yes Experience Inadequate Yes No None None No
New Eersterust Clinic Moretele No Experience Inadequate Yes No Only exp Only exp No
Ramotse Clinic Moretele No Experience Inadequate Yes No Don't know Not calc No
Refentse CHC Moretele Yes Experience Adequate Yes No Don't know Not calc No
Suurman Clinic Moretele Yes Experience Adequate Yes No Don't know Not calc No
Temba CHC Moretele Yes Experience Adequate Yes Yes R 221,369 R 117,670 No
Boekenhout CHC ODI Yes Experience Adequate Yes No Don't know Not calc No
Itireleng Clinic ODI No Experience Inadequate Yes No Don't know Not calc No
Kgabo CHC ODI Yes Experience Adequate Yes No Don't know Not calc No
* CTMM = City of Tshwane Metropolitan Municipality, GPA = Gauteng Provincial Authority, CHC = Community Health Centre, SOPs = Standard Operating Procedures, ROL = Re-Order Level, calc. = calculated, Min-Max = Minimum-Maximum Level.
78

Table A8 Summary of Qualitative Observations4F a c ility T y p e O w n e r P R O C E D U R E S M E D IC IN E B U D G E T
A ll S O P s Q u a n t if ic a t io n R e c e iv in g S to c k c a r d s K n o w s % L a st y e a r % T h is y e a r C o n tr o l
Mpho ya Batho Clinic ODI Yes Experience Adequate Yes No Don’t know Not calc No
Phedison I CHC ODI Yes Experience Adequate Yes No Don’t know Not calc No
Atteridgeville Clinic CTMM No Experience Inadequate NO No Don’t know Not calc No
Danville Clinic CTMM No Max-Min Inadequate NO No Don't know Not calc No
Folang Clinic CTMM No Max-Min Inadequate NO No Don't know Not calc No
Gazankulu Clinic CTMM No Max-Min Inadequate NO Yes Don't know Not calc No
Hercules Clinic CTMM No ROL Adequate NO No Don't know Not calc No
Karenpark Clinic CTMM Yes ROL Adequate Yes Yes Only exp 47.7 No
Laudium Clinic CTMM Yes Experience Inadequate NO Yes Don't know Not calc Yes
Lyttelton Clinic CTMM Yes Max-Min Adequate Yes Yes Don't know Not calc Yes
Mamelodi West Clinic CTMM No Max-Min Inadequate NO No Don't know Not calc No
Phahameng Clinic CTMM No Max-Min Adequate NO Yes Don't know Not calc Yes
Phomolong Clinic CTMM No Max-Min Inadequate NO No Don't know Don’t know No
Rosslyn Clinic CTMM Yes ROL Adequate Yes Yes Don't know Not calc No
Silverton Clinic CTMM No Max-Min Adequate NO No Don't know 32.1 Yes
Stanza Bopape 2 Clinic CTMM No Max-Min Inadequate NO Yes Don't know 45.4 Yes
T A R G E T Y e s R O L /M in -M a x A d e q u a te Y e s Y es Y es
% w h o c o m p ly 4 7 % 53% 5 6 % 67 % 42 % 22 %
79

APPENDIX B:
TOOLS USED IN DATA COLLECTION
8 0

APPENDIX B1 Description of the WHO and HST Drug Supply Management
Indicators, their Purpose and Method of Calculation
INDICATOR PURPOSE CALCULATIONPrescribing Indicators
1 Average number o f drugs per encounter.
To measure the degree o f polypharmacy.
Divide total number o f drugs prescribed by the number of encounters surveyed.
2% o f drugs prescribed by generic name
To measure the tendency to prescribe by generic name to allow generic substitution as a cost-minimisation strategy.
Divide the number o f drugs prescribed by generic name by the total number o f drugs prescribed, multiplied by 100%.
3% o f encounters with an antibiotic prescribed.
To measure the overall level o f use o f two important, but commonly overused and costly forms o f drug therapy.
Divide the number o f patient encounters with an antibiotic or injection prescribed, by the total number o f encounters surveyed, multiplied by 100%.4
% o f encounters with an injection prescribed.
5% o f drugs prescribed from the EDL.
To measure the degree to which practices conform to a national drug policy as indicated by prescribing from the national EDL for the type o f facility.
Divide the number o f products prescribed which are listed on the EDL, by the total number o f products prescribed, multiplied by 100%.
Drug Procurement, Availability and Control Indicators
6 Availability o f key drugs.
To measure the availability at health facilities o f key drugs recommended for treatment o f some common health problems.
Divide the number o f specified products actually in stock by total number o f drugs on the checklist, multiplied by 100%
7
% o f drugs ordered that are supplied within the delivery schedule
To measure the service level o f the supplier to the health facility.
Divide the total number o f drugs issued, by the total number o f drugs ordered, multiplied by 100%
8 Adequate receiving procedure.
To identify measures that support drug control and accountability in the supply chain.
Identify where received drugs were checked against orders and invoices before use, and any discrepancies formally reported within a stipulated period, as adequate.
9 Lead Time.To measure how long the supplier takes to deliver ordered items.
Measure the duration in days it takes from date a tracer item is ordered to the time it is received.
10 Ordering Interval.
To measure the frequency o f ordering whether it is in line with the schedule and safety levels.
Measure the duration in days between two most recent consecutive ordering dates for each tracer item.
11% o f Tracer items that had been out o f stock at least once in
To measure the extent to which key drugs are not available.
Divide the number o f tracer items out o f stock at least once in the past year, by the total number o f tracer
81

INDICATOR PURPOSE CALCULATIONthe past year. items checked, multiplied by 100%.
11 Quantification method used.
To identity whether there is an adequate method o f quantifying drug requirements.
Record the method used out o f Re- Order Level method, Minimum- Maximum Level Method or mere reliance on working experience.
12% o f items with ROL or Min-max levels.
To identify the extent to which a formal quantification method is used.
Divide the number o f tracer items with ROL or Min-max levels, by the total number o f tracer items checked, multiplied by 100%
13 Use o f stock card.To identify the method used to control and account for drugs used.
Record whether a standard stock card was in use or not.
14
% o f items where physical stock balanced with the record.
To measure the effectiveness o f drug control and accountability.
Divide the number o f tracer items where stock balanced with the record, by the total number o f tracer items checked, multiplied by 100%.
Cold Chain Management Indicators
15 Type o f fridge available.
To measure availability o f adequate storage facilities for vaccines.
Record availability o f a fridge and they type o f fridge available
16 Stock found stored in the fridge door To identify existence o f some
o f the common poor cold chain management practices.
Record the presence or not o f stock in the fridge door or food or drinks in the fridge.17 Food/drinks found
stored in the fridge.
18
Recording fridge temperature daily and the type o f thermometer used.
To measure the extent to which the cold chain is monitored effectively.
Check the type o f thermometer used and the temperature chart and note whether the fridge temperature is monitored daily, including weekends and public holidays, or not.
19 Existent o f a power back-up system.
To measure the ability to maintain the cold chain in case there is a power failure.
Record existence or not o f an alternative source o f power or o f a system to protect vaccines from damage in cases o f power failure.
Facility Indicators
20 Availability o f an offloading cage.
To identify the availability o f facilities to facilitate adequate receiving o f drugs and ensure they are not used before they are checked
Record whether there was a secure place where received drugs are physically separate and inaccessible for use, until they are checked, or not.
21Availability o f a store o f adequate size.
To identify existent o f a store to support good storage practices
Record whether the store had the size and shelves to hold the maximum available stock without congestion and placing stock on the floor, or not.
22No stock found placed directly on the floor.
To identify the adequacy of the storage facilities and practices.
Record whether any stock was found on the floor or not.
23 Adequate store To measure the conditions Record whether a fan or Air
8 2

INDICATOR PURPOSE CALCULATIONventilation. under which storage o f drugs. conditioning system used or not.
24 Monitoring o f room temperature.
To identify whether storage conditions were regularly monitored.
Record whether there was a temperature chart, which showed that room temperature in the store was regularly monitored.
25 Practice o f restricted access to the store.
To identify the extent o f drug control measures in place.
Record whether access to the store was restricted to only one or two persons working there, or not.
26Use o f a double lock System
To identify the security measures in place for drugs.
Record the existence or not o f either two padlocks or two doors on the same entrance to the drug store, and controlled by two different people.
27 Availability o f Burglar proofing
To identify the security measures in place for drugs.
Record whether or not all doors and windows (even those not opened frequently) were protected by burglarproof bars or any other system.
28Existent o f a separate store for flammable items
To identify extent to which special requirements for these categories o f items are complied with.
Record whether or not a separate secure storage area for each o f these categories o f items was available and being used properly.29
Existent o f a separate store for schedule >5 items
Personnel Indicators
30
Category o f staff in charge o f Drug Supply Management.
To identify the professional appropriateness o f the person in charge o f Drug Supply Management.
Record the professional training of the person usually or found in charge o f Drug Supply Management.
31
The nature o f deployment o f staff for Drug Supply Management
To measure whether there is continuous accountability for drugs.
Record whether the person in charge o f Drug Supply Management is permanent or there is rotation between several health workers.
32Number o f staff trained in DSM, RDU or CCM
To measure to what extent the personnel are trained in their specific areas o f their work.
Record the number o f health workers who have received specific training in DSM, RDU and CCM.
DSM = Drug Supply Management, RDU = Rational Drug Use, CCM = Cold ChainManagement
83

APPEN DIX B2: PRESCRIBING INDICATORS FORM
84

APPENDIX B3: DRUG SUPPLY MANAGEMENT LOGISTICS PERFORMANCE INDICATORS FORMDrug A verage lead tim e O rder interval D uration O/S M ax stock Q uantity o f stock Expiry FIFO /FE FO
O rd er date Receipt date Lead time 2ndlast order O rder interval Start End O /S RO L O n card O n sh e lf 1 not expired Any expired
A m o x y c a p s 2 5 0 m g 1 5s
A m o x v c a p s 2 5 0 m g 3 0 s
A m o x v c a p s 2 5 0 m g 1 0 0 s
A m o x y su sp 1 2 5 m g /5 m l 100m l
C ip ro flo x ac in tab s 5 0 0 m g 10s
P e n e len te inj 2 .4 m U
P a ra c e t S y r 120m g 5 m l 50m l
P a ra c e t S v r 120n ig 5 m l 100m l
Ib u p ro fe n tab s 2 0 0 m g 15s
Ib u p ro fe n tab s 2 0 0 m g 2 8 s
Ib u p ro fe n tab s 2 0 0 m g 4 2 s
Ib u p ro fe n tab s 2 0 0 m " 56s
Ib u p ro fe n ta b s 2 0 0 m g 1 0 0 0 s
H C T Z ta b s 25 m g 14s
H C T Z ta b s 25 m g 2 8 s
H C T Z ta b s 25 m g 5 0 0 s
G lib e n c la in id e tab s 5 m g 2 8 s
G lib e n c lam id e ta b s 5 m g 56s
G lib e n c la in id e tab s 5 m g 500s
M etro n id azo le tab s 2 0 0 m g 28s
M etro n id azo le tab s 2 0 0 m g 21s
M etro n id azo le tab s 2 0 0 m g 250s
P a ra c e tam o l tabs 5 0 0 m g 10s
P a ra c e tam o l tabs 5 0 0 m g 20s
P a ra c e ta m o l tabs 5 0 0 m g 500s
85

A d ren a lin e inj
O R S Sachets
S a lb u tam o l in h a le r
T e ta n u s V acc ine
R in g e rs L a c ta te IV
Ite m
IV A dm in . Set 10 D rops
IV A dm in . Set 15 D rops
IY A dm in . Set 2 0 D rops
IV A dm in. Set 6 0 D rops
G lu c o se /K e to n e s T es t S trip
In s u lin sy rin g e 1m l
In su lin sy rin g e 0 .5 m l
S y rin g e 2m l
G lo v e s n o n -s te rile sm all-lO O s
G lo v e s n o n -s te rile m edium -lO O s
G lo v e s no n -s te rile large-lO O s
N o . o f item s rece iv ed on la s t o rd e r %
T o ta l N o .o f item s o rdered on la s t o rder
86

APPENDIX B4: HEALTH FACILITY QUESTIONNAIRE
DRUG MANAGEMENT SITUATION ANALYSIS FACILITY EVALUATION FORM
Facility Name: Location:Type o f Facility (tick appropriate box):
ClinicOther
Community Health Centre Hospital Mobile
Date:
Investigators:
A: Personnel and organisational structureQUESTION RESULTS
Position o f person interviewedPostal address
Tel:................................................Fax:...............................................e-mail:--------------------------------No o f filled pharmacist posts:— No o f vacant pharmacist posts:-No o f assistant posts filled:------
Basic level:Post-basic level:Trainee basic level: Trainee post-basic level:
No o f vacant assistant posts:—
Contact details
Pharmaceutical staff establishment
Location and Position o f Pharmacist in-charge_________________________What is the Qualification o f person responsible for drug supply management (ordering stock, control over storage and issue)?____________
Qualification:
Dedicate/Perm^nent Rotational:
Who are the other staff working in the Pharmacy or Dispensary?
Title Role Number
Position o f person in a supervisory position (e.g. district pharmacist, regional pharmacist, clinic supervisor)_______________________How often does the supervisor visit Weekly Monthly
87
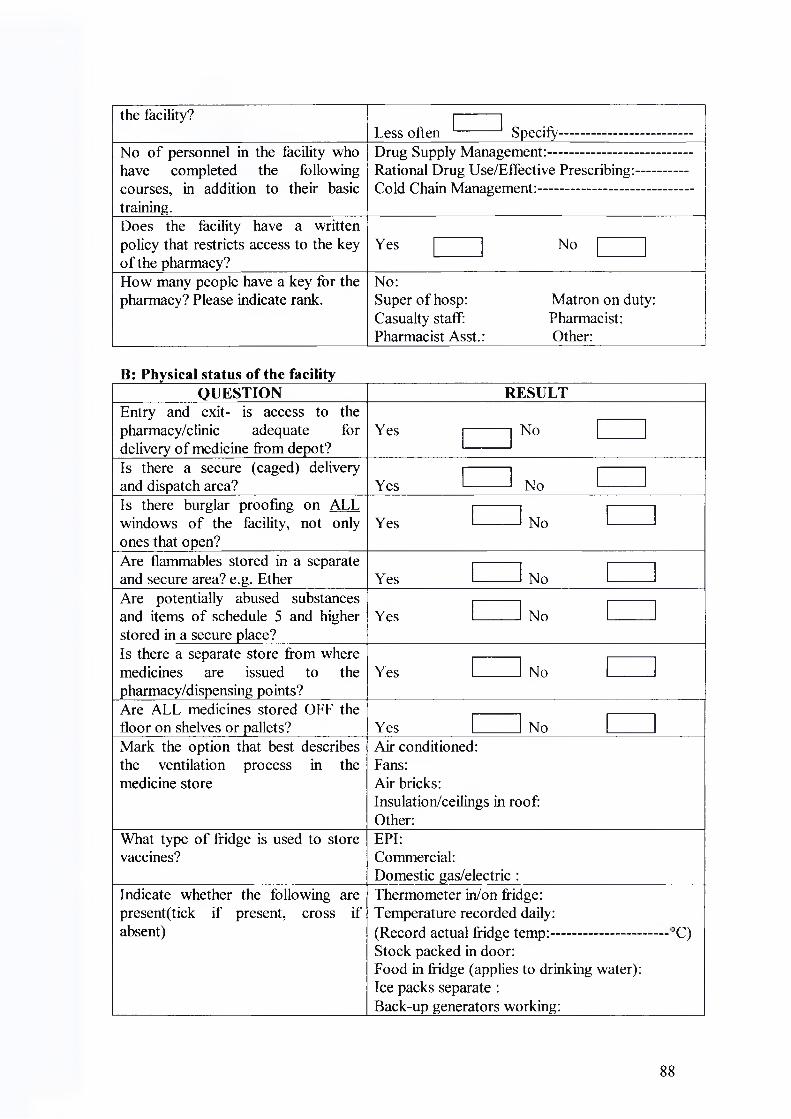
the facility?Less often --------- Specify....................................
No o f personnel in the facility who have completed the following courses, in addition to their basic training.
Drug Supply Management:------------------------------Rational Drug Use/Effective Prescribing:..............Cold Chain Management:..........................................
Does the facility have a written policy that restricts access to the key o f the pharmacy?
Yes No
How many people have a key for the pharmacy? Please indicate rank.
No:Super o f hosp: Matron on duty: Casualty staff: Pharmacist: Pharmacist Asst.: Other:
B: Physical status of the facilityQUESTION RESULT
Entry and exit- is access to the pharmacy/clinic adequate for delivery o f medicine from depot?
Yes No
Is there a secure (caged) delivery and dispatch area?_________________ Yes NoIs there burglar proofing on ALL windows o f the facility, not only ones that open?___________________
Yes No
Are flammables stored in a separate and secure area? e.g. Ether_________ Yes NoAre potentially abused substances and items o f schedule 5 and higher stored in a secure place?
Yes No
Is there a separate store from where medicines are issued to the pharmacy/dispensing points?________
Yes No
Are ALL medicines stored OFF the floor on shelves or pallets?_________ Yes NoMark the option that best describes the ventilation process in the medicine store
Air conditioned:Fans:Air bricks:Insulation/ceilings in roof: Other:
What type o f fridge is used to store vaccines?
EPI:Commercial:Domestic gas/electric :
Indicate whether the following are present(tick if present, cross if absent)
Thermometer in/on fridge:Temperature recorded daily:(Record actual fridge temp:------------------Stock packed in door:Food in fridge (applies to drinking water): Ice packs separate :Back-up generators working:___________
3C)
88

VVM indicators:Rate the performance o f the equipment used by the facility to communicate with the hospital/deport (only rate what is available)
Excellent Adequate PoorTelephones:.............. ......................... -.........................Fax :.............................. -........ — --------------Radio :-------------------- —.......................... ........E-mail :..................................................................Comment:— .......................................... -...................
C:QUESTION RESULTS
Total No o f drugs available in the pharmacy. Include all dosage forms and pack sizesNo o f drugs listed by generic name on the stock sheet/list.No o f drugs on the stock sheet/list which appear on the EDLAvailability o f the Essential Drug List/Standard Treatment Guidelines.
Total No o f prescribers and dispensers:No o f these staff who have a personal copy o f the EDL/STG:
Do prescribers have direct access to a Provincial Formulary? Yes NoDo prescribers have direct access to a list o f drugs available at this facility? Elaborate.
Yes No
Indicate which o f the following drug information resources are available in the facility:
SA Medicines Formulary:Primary Health Care Medicines Formulary: Computer-based resource (e.g. Micromedex CD- ROM)
If prescibers require additional information about medicines, where can they obtain it?
Drug Information Centre:"Mother" hospital:Visiting Doctor:Regional Pharmacist:Other (specify):............................................................
C: ProcurementQUESTION RESULTS
Where are the medicine supplies obtained from?
Regional Pharmacy: Local Authority Deport: "Mother " hospital: Private supplier:
Who prepares the order for medicines?
Name:.....................................................................Position:.................................................................
Who authorises the orders for medicines?
Pharmacy/dispensary in-charge: Facility Manager:Area supervisor:Regional Pharmacist:
How are the quantities to be ordered Re-order level & state ROF:
89

determined? Have ROL &/or Max- Min levels been determined for each drug?
Maximum/minimum order levels: Automated system:Based on experience:
How are orders for drugs placed with the supplier?
Requisition book:Order forms:By phone; fax; e-mail; post; personal delivery Other, specify:
How often are routine orders placed with the supplier? Indicate the No of routine orders in the past 3 monthsHow often are emergency orders placed with the supplier? Indicate the No o f unscheduled orders in the past 3 monthsIs there written policy on how non- EDL drug is obtained for a patient or added to the facility’s list? Specify.
Yes No
Where are patients from your facility referred to (Referral Route)?How are drug supplies transported to the facility?
Provincial transport:Courier company:Dedicated Transport (used only for delivering drug supplies):
If repackaging is performed at the facility, how may lines are packaged? Are the conditions adequate?
Tablets/Capsules: Liquids/Syrups: Extemal/Ointments: Antiseptic Solutions:
El: Distribution and storageQUESTION RESULTS
Are there written SOPs/Guidelines for:• Cold Chain Management• Organisation o f the store• Record-keeping• Schedule 5,6 & 7 subst. control• Ordering Supplies• Receiving Supplies• Disposal o f expired medicines• Product Recall• Pest control
Yes No Date o f publication
Indicate which o f the following receiving procedures are followed:
Check No o f boxes and sign driver's note: Check stock received against delivery note: Discrepancy reports submitted to supplier:
Indicate which o f the following inventory control procedures are used in the store:
Computerised stock control system: Stock cards on shelf:Stock cards in office:Ordering cards only: Maximum/minimum stock levels:
90

Reorder levels:Quantity at time of stocktaking only: None:
What system is used to record medicines that are dispensed to patients, including injectables?
Prescription book: --------------Tally for @ medicine: --------------Tally for total No. dispensed: --------------Quantity to Dispensary/Cupboard: --------------Other, specify: --------------None: ...................
When last was a stock-take done in the facility? How often is it done?
Date: % Deviation: Frequency:
Are there any overstocked or obsolete or redundant items on the shelves?
Yes No
Budgeting and Finance ManagementQUESTION RESULTS
Who determines the Drug Budget for the Facility?
Pharmacy In-charge: Facility Manager: Local Authority: Provincial Authority: Don’t know:
What criterion is used to determine the drug budget for the facility?
Quantification o f needs: Rough estimate: Previous year’s budget: Don’t know:
What is the facility’s budget for drugs for the current financial year:
RDon’t know:
How much o f the budget has been consumed to date?
RDon’t know:
Is the facility budget considered when authorising orders?What was the expenditure in the last financial year and how did it relate to the budget for that year?
R ( %) Don’t know:
What was the cost o f expired stock last financial year?
RNot Valued:
What is the source o f funding for drugs for your facility?
Local Authority: Provincial Gov’t: User fees:Don’t know:
What are some o f the problems that are encountered in drug management in this facility?
91

In your opinion what would you recommend as possible solutions to the problems that were mentioned above?
Thank you for your time and patience.
92

APPENDIX B5: SUB-DEPOT/PHARMACY QUESTIONNAIRE
DRUG MANAGEMENT SITUATION ANALYSIS PHARMACY EVALUATION FORM
Pharmacy Name;Location:______Date:
Investigators: ------------------------------------
A: Personnel and organisational structureQUESTION RESULTS
Position o f person interviewedPostal address
Contact details Tel:— - Fax:— e-mail:-
Pharmaceutical staff establishment No o f filled pharmacist posts:------------No o f vacant pharmacist posts:.............No o f assistant posts filled:....................No of vacant assistant posts:.............. —No o f assistants trained and registered:
Basic level:.................................Post-basic level:........... ..............
No o f assistants in training:Trainee basic level:....................
_______Trainee post-basic level:---------Location and Position o f Pharmacist in-charge_________________________Are there non-pharmaceutical Personnel involved in handling drugs? If YES, state qualification and number.
Yes Qualification/
No>osition Number
To whom does the Pharmacy Manager report? State Position and and qualification only.______________
Position:
Qualification:How often does the supervisor visit the Pharmacy?
Weekly Monthly
Less often Specify-Outline the main duties o f pharmacy staff. State duty, cadre & no involved.
Duty descriptionQuantificationOrderingReceivingStorageRepackagingPricing_________
Cadre Number
93

Issuing ........................ .......... ..............Picking ................................... ..............Dispatch -------------------------- ----------Preparing Voucher ................................... ..............Discrepancies .............................. — -----------
No o f personnel in the Pharmacy who have completed the following courses(indicate No next to @ course title)
Drug Supply Management:.......................................Rational Drug Use::...............................................—Cold Chain Management:--------------------------------
Does the Pharmacy have a policy that restricts access to the key o f the pharmacy?
Yes No
How many people have a key for the pharmacy? Please indicate rank.
No:Pharmacist:Pharmacist Asst.: Other:
B: Physical status of the PharmacyQUESTION
Entry and exit- is access to the pharmacy adequate for the largest vehicle used for delivery?___________
RESULT
Yes No
Is there a secure (caged) delivery and dispatch area?_________________ Yes NoIs there burglar proofing on ALL windows o f the Pharmacy, not only ones that open?___________________
Yes No
Are flammables stored in a separate and secure area? Yes NoAre potentially abused substances and items o f schedule 5 and higher stored in a secure place?___________
Yes No
Is there a separate dispatch area from where medicines are issued to the facilities?
Yes No
Are ALL medicines stored OFF the floor? Yes NoMark the option that best describes the ventilation process in the medicine store. Is room temperature monitored and recorded on daily basis?
Air conditioned: YesFans:Airbricks:Insulation/ceilings in roof: Temp:Other:
No
What type o f fridge is used to store vaccines?
EPI:Commercial:Domestic gas/electric Walk-in fridge:______
Indicate whether the following are present(tick if present, cross if absent)
Thermometer in/on fridge: Temperature recorded daily: (Record actual fridge temp:- Stock packed in door:_____
3C)
94

Food in fridge (applies to drinking water): Ice packs separate :Back-up generators working:VVM indicators:
Rate the performance o f the equipment used by the Pharmacy to communicate with the facilities and suppliers (only rate what is available)
Excellent Adequate PoorTelephones:...................................................................Fax :............................................ -.................Radio :...................................................................E-mail :...................................................................Comment:.............................................................................. ..........
C:QUESTION RESULTS
Total No o f drugs available in the pharmacy. Include all dosage forms and pack sizesNo o f drugs listed by generic name on the stock sheet/list.How are the No and type o f drugs to be stocked determined?No o f non-EDL drugs which appear on the PHC stock sheet/list.Do facilities have access to a list o f drugs available at this Pharmacy? Yes --------- No ---------Indicate which o f the following drug information resources are available in the Pharmacy:
SA Medicines Formulary:Primary Health Care Medicines Formulary:Provincial Formulary:PHC EDL/STG:Computer-based resource (e.g. Micromedex CD-ROM)
C: ProcurementQUESTION RESULTS
Where are the drug supplies obtained from?
National Medical Stores: Provincial Pharmacy: Wholesaler: Manufacturer:
What procurement system is used by the Pharmacy?
Competitive tender:Selective biding from pre-selected suppliers: Direct purchase:Government Central Deport:
How are orders for drugs placed with the supplier?
Requisition book:Order forms:By phone; fax; e-mail; computer link: Other, specify:
How are orders for drugs placed by the facilities?
Requisition book:Order forms:By phone; fax; e-mail; computer link: Other, specify:
95
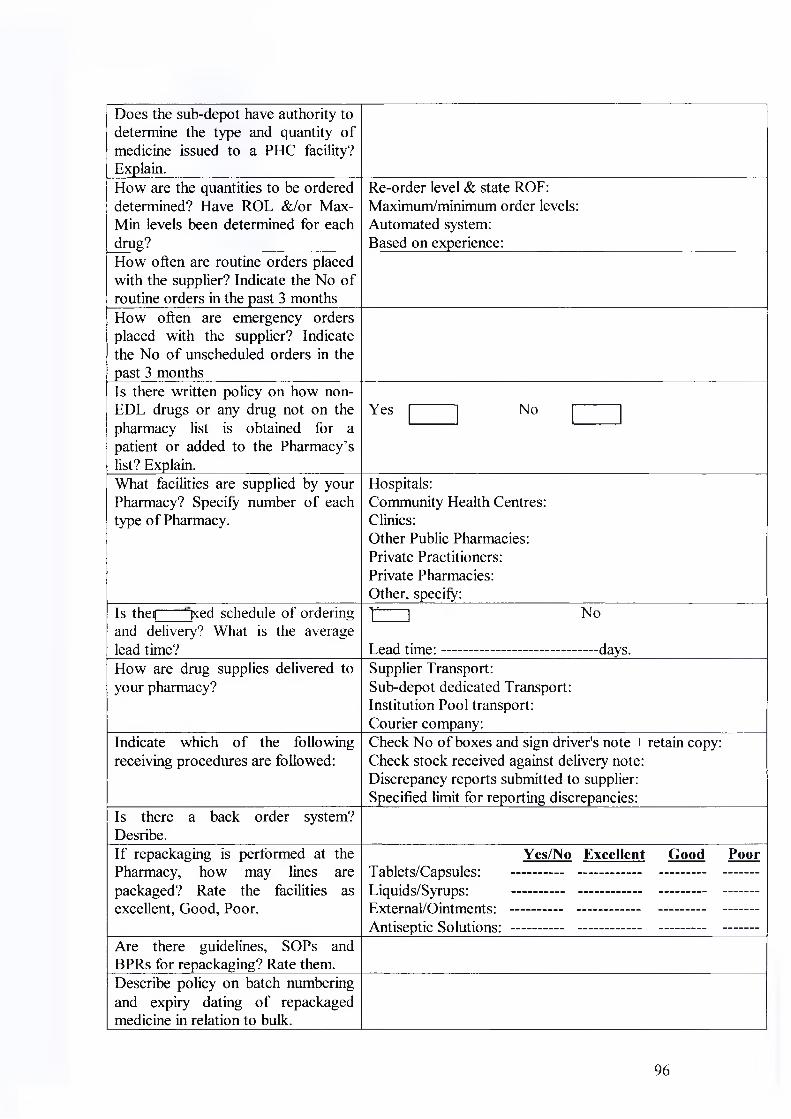
Does the sub-depot have authority to determine the type and quantity o f medicine issued to a PHC facility? Explain.How are the quantities to be ordered determined? Have ROL &/or Max- Min levels been determined for each drug?
Re-order level & state ROF: Maximum/minimum order levels: Automated system:Based on experience:
How often are routine orders placed with the supplier? Indicate the No o f routine orders in the past 3 monthsHow often are emergency orders placed with the supplier? Indicate the No o f unscheduled orders in the past 3 monthsIs there written policy on how non- EDL drugs or any drug not on the pharmacy list is obtained for a patient or added to the Pharmacy’s list? Explain.
Yes No
What facilities are supplied by your Pharmacy? Specify number o f each type o f Pharmacy.
Hospitals:Community Health Centres: Clinics:Other Public Pharmacies: Private Practitioners:Private Pharmacies:Other, specify:
Is thei| ' ‘ |xed schedule o f ordering and delivery? What is the average lead time?
r ___ i no
Lead tim e:--------------------------------days.How are drug supplies delivered to your pharmacy?
Supplier Transport:Sub-depot dedicated Transport: Institution Pool transport: Courier company:
Indicate which o f the following receiving procedures are followed:
Check No of boxes and sign driver's note + retain copy: Check stock received against delivery note: Discrepancy reports submitted to supplier:Specified limit for reporting discrepancies:
Is there a back order system? Desribe.If repackaging is performed at the Pharmacy, how may lines are packaged? Rate the facilities as excellent, Good, Poor.
Yes/No Excellent Good PoorTablets/Capsules: .................................................................. -Liquids/Syrups: ...................................................................Extemal/Ointments: ........ ......................... - ---------- -------Antiseptic Solutions: ...............................................................—
Are there guidelines, SOPs and BPRs for repackaging? Rate them.Describe policy on batch numbering and expiry dating o f repackaged medicine in relation to bulk.
96

Are facilities supplied bulk medicines for repackaging? Rate the guidelines/SOPs given to facilities.
El: Distribution and storage
Yes/No Excellent Good PoorTablets/Capsules: ..............................................................—Liquids/Syrups: ------ -------------------- --------- -------Extemal/Ointments: ..................................................... ..........Antiseptic Solutions: —.................................................. ..........
QUESTION RESULTSHow are drug supplies transported to the facilities?
Provincial/District pool transport: Dedicated sub-depot Transport: Courier company:Clinic Transport:
Which o f the following dispatch procedures are followed?
Final contents check:Sealing/locking o f parcels:Dispatch note signed by Pharmacist: Delivery note to be signed by recipient: Invoice accompanying consignment:
Are ties require submit discrepancy reports wlmin a
Yes No ..................... Days.
specified period o f receipt?How many have been received in the last 3 months? Specify.
Description Number Action taken
Are there written SOPs/Guidelines for:• Cold Chain Management• Organisation o f the store• Record-keeping• Schedule 5,6 & 7 subst. control• Ordering Supplies• Receiving Supplies• Disposal o f expired medicines• Product Recall• Pest controlAre these or similar guidelines availed to the clinics?
Yes No Date o f publication
Does the pharmacy conduct suport supevision to the facilities?Who does it and at what is the frequency? Is there a checklist? Is there written feedback?
Yes NoSupport supervision: ------------- --------- --------Checklist: ................. ........................Written feedback: ------------- ------- -----------Cadre: —.......................... Frequency:— .................. -
Is FEFO/FIFO practiced in the store?
Yes No
Indicate which o f the following inventory control procedures are used:
Computerised stock control system: Stock cards on shelf:Stock cards in office:Ordering cards only: Maximum/minimum stock levels:
97

Reorder levels: Other, specify:
When last was a stock-take done in Date: Frequency:the Pharmacy? How often is it done? % Deviation:Are there any overstocked or obsolete or redundant items on the Yes Noshelves?
Budgeting and Finance ManagementQUETION RESULTS
Who determines the Drug Budget for the Pharmacy?
Pharmacist In-charge: Regional Director: District Manager: Don’t know:
What criterion is used to determine the drug budget for the Pharmacy?
Quantification o f needs: Rough estimate: Previous year's budget: Don’t know:
What is the Pharmacy’s budget for drugs for the current financial year:
RDon’t know:
How much o f the budget has been consumed to date?
RDon’t know:
What was the expenditure in the last financial year and how did it relate to the budget for that year?
R ( %) Don’t know:
What was the cost o f expired stock last financial year?
RNot Valued:
What is the source o f funding for drugs for your Pharmacy?
Provincial Gov’t: Local Authority: Revenue from sales: Don’t know:
How are drugs supplied to facilities paid for?
Directly by the facility:By the Region/District after presentation o f a signed invoice/delivery note:Debiting facility deposit accounts:
Who controls to ensure facilities are supplied within budget? Is the control based on the budget?
Based on budget? YES NO Facility Manager:Area/Cluster Manager: .....................................Area Pharmacist: ------------ ---------Other, specify: .....................................No control: ------------ ---------
How are facilities informed o f the cost o f the drugs supplied?
Invoice at time o f delivery: Invoice o f total monthly supplies: At the end o f the financial year: Never informed:
What are some o f the problems that are encountered in drug management in this Pharmacy and supplying the facilities?
98

In your opinion what would you recommend as possible solutions to the problems that were mentioned above?
Thank you for your time and patience
99

APPENDIX B6
DRUG USE IN D IC A TO R S C O N SO U ID A T IO N FO R M
U ocation :__________________________________________________________ Date:
D ate F acility A v.drugsprescribed
%generics
%antibiotics
%injections
% on EDL
C onsulttim e
Disptim e
%drugsdisp
%adequate
label
% adequate know ledge
Im partialin form at’n
% drugs in stock
M ean
MaximumMinimum
100

APPENDIX C: SCHEDULE AND PROGRAMME FOR FIELD VISITS TO HEALTH FACILITIES
NAME OF FACILITY OWNER ADDRESS DISTRICT CONTACT PERSON &TEL. NO
DATE OF VISIT
1 . Pretoria Regional Pharm Gauteng Pr. Aut Conr. Bossman andPretorious, Pretoria Central Marla-Twe 08345289552. CTMM Sub-depot Local Authority Cnr. Prinsloo and Vermuelen Street Central Vuka Butelezi, 30888043. Adelaide Tambo Clinic Gauteng Pr Aut Fanic Van Rensburg Str PYRAMID Central Ms. Julies, 54599374. Atteridgeville Clinic Local Authority Mokobane Street, Atteridgeville Central Sr. Makola, 3085111
5. Danville Clinic Local Authority Lucas van der Berg, Transoranje Rd. PTA WEST Central Sr. Maqubela, 3866052
6 Eastlynne Clinic Local Authority Pieter Krynauw Centre, Cnr. Meeu & Stegman Street. EAST LYNNE Central Sr. A. Fisher, 8001419
7. Eersterust Clinic Gauteng Pr. Aut 214 Willie Swarts Ave, EESTERUST Central Sr. L. Leyds, 80670008. Eersterust Clinic Local Authority Willie Swartlaan Central Sr. N. Roberts, 80695719. Folang Clinic Local Authority D.F. Malan Rylaan, C.De Wet Build. 175 Central Sr. M. Mofokeng, 308048010. Gazankulu Clinic Local Authority Mphalane & Makhaza Street Central Sr. V Ngobene, 375739211. Hercules Clinic Local Authority Cnr Ribbens & Taljaar street. HERCULES Central Sr. T. Ndlovu 379203912. Mamelodi East Clinic Local Authority 11043 Cnr. Lodwaba & Tlou street. Central Sr. Mononyane, 801104113. Mamelodi West Clinic Local Authority Cnr. Schabangu & Ntshabeleng Central Sr. Serna, 8054170
14. Mandisa Shiceka Clinic Gauteng Pr. Aut Portion 60 Mandela Village, HAMMANSKRAAL Central Ms. M. Koma, 7113906
15. Nelmapius Clinic Local Authority 494 Lorie Fontein Str. Nelmapius Central Sr. M. Hausler, 803599416. Phahameng Clinic Local Authority 19619 Hinterland Ave, Ext. 17, MAMELODI Central Sr. J. Mokale, 840101217. Phomolong Clinic Local Authority Cnr. Ndlovu & Dubazana Str, Extension 7 Central Sr. Sibiya, 375641918. Pretoria North Clinic Gauteng Pr. Aut 376 Jack Ibodon Str. PRETORIA NORTH Central Ms. R.Mtimkulu, 565666719. Pretoria North Clinic Local Authority City Hall, Brits Rd & Emily Hobhou C entral Sr. T. Ndlovu, 5466151
101

20. Pretorius Park Clinic Local Authority Cnr Bulge & Loris Street, Pretorius Park Central Sr. M. Haulser, 998641621. Sammy Marks Clinic Local Authority Cnr Prinsloo & Vermeulen Street Central Sr. R De Klerk, 308877022. Saulsville Clinic Local Authority 33 Sekhu Street, Saulsville Central Sr. M Matsei, 375594623. Silverton Clinic Local Authority City Hall, Pretoria Road, Silverton Central Sr. Fisher, 8048958 j24. Skinner Str Clinic Gauteng Pr. Aut 357 Skinner Str. PRETORIA Central Ms. A. Roux, 320034625. Stanza Bopape 2 Local Authority 255905 Hector Petersen, Extension 8 Central Sr. J. Makole, 840101226. Stanza Bopape CHC Gauteng Pr. Aut Stand No 2 Shilovhane Str. X5 Mamelodi East Central Ms. J. Mogoboya, 812033627. Bophelong Clinic Gauteng Pr. Aut 66 Masokha Str. SAULSVILLE Southern Ms. M. Senosha, 3755955
28. Laudium CHC Gauteng Pr. Aut Cnr. Bengal &25th Ave, LAUDIUM Southern Ms. S. Kolapan, 3744022/23
29. Laudium Clinic Local Authority Cnr. 6th Str. & Tangerian Ave, LAUDIUM Southern Mrs. D.Venter, 374207030. Lyttelton Clinic Local Authority Cnr. Cantonments & Clifton Southern Sr. A. Hide, 671728931. Sedibeng Clinic Gauteng Pr. Aut No.30 Mokobane Str. ATTERIDGEVILLE Southern Sr. S. Slabbert 373669932. Boikhutsong Clinic Gauteng Pr. Aut 1266 Block T SOSHANGUVE Northern Ms. M. Mekgbe, 7900091
33. Bronkhorstspruit Clinic Gauteng Pr. Aut Cnr. Kruger & Botha Str, Muni Forum Building, BRONKHORSTSTSPRUIT Northern Sr. E. Mashia & Sr. A.
Strydom, 932620034. Karenpark Clinic Local Authority Akasia Medical Centre, Hendrik Ave Northern Sr. De Villiers, 521814935. Rayton Clinic Gauteng Pr. Aut Cnr. Montey Rose & Oakley Str, RAYTON Northern Ms. C. Broedt, 734427436. Refilwe Clinic Gauteng Pr. Aut 1165 Masina Drive COLLINAN Northern Ms. T. Mbeletsi,732067137. Rosslyn Clinic Local Authority 91 Piet Rautenbauch street. ROSSLYN Northern Sr.S.Van der Walt,521831238. Soshanguve 1 Clinic Gauteng Pr Aut 30 Block II SOSHANGUVE Northern Ms. Amangeipo, 797223339. Soshanguve 2 Clinic Gauteng Pr. Aut 1850 Block G SOSHANGUVE Northern Ms. N. Sibulela, 797271440. Soshanguve Block JJ Gauteng Pr. Aut 1834 Block BB, SOSHANGUVE Northern Mrs. K.E. Sithole, 790330441. Soshanguve CHC (3) Gauteng Pr. Aut 1834 Block BB SOSHANGUVE Northern Ms. L. Sithole, 790330442. Dilopye Clinic NWP- Moretele Stinkwater cluster, next to Primary school Stinkwater c/oSr.Mnguni, 072189735543. Jubilee Gateway Clinic NWP- Moretele Hammanskraal, Entrance o f Jubilee Hospital Moretele Sr. M. Mosetlha,717201144. New Earsterust Clinic NWP-Moretele Stinkwater cluster, next to beer hall Stinkwater Sr.D.K Chabangu45. Kekanastat/Majaneng CHC NWP-Moretele Temba cluster, next to post office Temba Sr. Maleka, 7100016
102

46. Ramotse Clinic NWP-Moretele Temba cluster, next to Primary school Temba Sr.J.Makhetha, 719607347. Stinkwater/Refentse CHC NWP-Moretele Stinkwater cluster, next to Fuel Filling station Stinkwater Sr.M.Disemelo, 715517848. Suurman Clinic NWP-Moretele Temba cluster, next to Primary school Temba Sr.Ratlabala,083109489349. Jubilee Hospital Pharmacy NWP-Moretele Hammanskraal, Entrance of Jubilee Hospital Moretele Mr Peter Dr50. Temba CHC NWP-Moretele Temba cluster, next to Temba shopping centre Temba Sr.W.Selomo, 717335751. Boekenhout Clinic NWP- ODI Block A, Mabopane Mabopane Sr.D.Makhudu, 702149552. Odi Hospital Pharmacy NWP- ODI Mabopane, Inside Odi Hospital Odi Mr.A.K.Leballo, 701346053. Itireleng Clinic NWP-ODI Zone 2, Ga-Rankuwa Ga-Rankuwa Sr. N.Kwapeng, 7039014/554. Kgabo CHC NWP-ODI Wintervelt Wintervelt Sr.M.Loroke, 704012855. Mpho ya Batho Clinic NWP-ODI Kromkuil, Wintervelt Wintervelt Sr.M. Ntsie, 083109321256. Phedisong 1 Clinic NWP-ODI Zone 1, Ga-Rankuwa Ga-Rankuwa Sr.E.Kawesa, 703397857. Phedisong 4 Clinic NWP-ODI Zone 4, Ga-Rankuwa Ga-Rankuwa 012-703 299358. Phedisong 6 Clinic NWP-ODI Zone 6, Ga-Rankuwa Ga-Rankuwa 012-703 470059. Sedilega Clinic NWP- ODI Block U, Mabopane Mabopane 012-702 230060. TIamelong Clinic NWP- ODI Block B, Mabopane Mabopane 012-702 110161. Winterveld (Dube) Clinic NWP-ODI Wintervelt 012-704 013562. Pabalelo Place o f Safety NWP-ODI Zone 2, Ga-Rankuwa Ga-Rankuwa 012-7031766
CHH = Community Health Centre, Pr. Aut. = Provincial Authority. NWP = North West Province. Blue Font = Belong to Metsweding, Red Font = Sub-depots. Yellow Fill = Not visited
The plan is to spend one day at a clinic and 2 days at Community Health Centre. Preferably, the facilities covered in one week should be equally distributed between the Province and the Local Authority. This will facilitate periodical analysis, comparison and reporting.
The following should be available on that day:• The person in-charge o f the facility.• The person in-charge of the pharmacy, dispensary and store.• Records showing daily attendance o f patients and monthly totals since 1st July 2001 to date.• Stock cards• Ordering cards or record o f orders made since 1st July 2001 to date.• Budget and expenditure on medicines and medical supplies for the financial years 2001/02 and 2002/03.
103

PRO G RAM M E A T THE C O M M U N IT Y H E A LT H CENTREDAY ONE09 00 hours 09 15 hours09 45 hours10 00 hours 1130 hours12 45 hours13 30 hours15 00 hours16 00 hours
Arrival at the FacilityInterview with the Facility Manager.Introduction to staff.Sampling o f prescription encounters.Monitoring Prescription practices/consultation time.Lunch break.Monitoring dispensing practices, time and patient knowledge. Evaluating Prescribing indicators data.Leave Facility
DAY TWO09 00 hours 09 15 hours09 45 hours10 30 hours12 45 hours13 30 hours 15 00 hours15 30 hours16 00 hours
Arrival at the Facility.Interview with in-charge o f pharmacy, dispensary, store. Inspection o f physical facilities o f the pharmacy/dispensary/store. Examination o f stock cards and stocktaking.Lunch break.Examination o f ordering cards/forms/records.Miscellaneous data collection and observation.Wrap up.Leave Facility.
PR O G R AM M E FOR TH E C L IN IC09 00 hours Arrival at the Facility, and interview with the Facility Manager. 09 20 hours Introduction to staff.09 30 hours Sampling and evaluation o f prescription encounters10 15 hours Monitoring Prescription practices/consultation time11 00 hours Monitoring dispensing practices, time and patient knowledge12 30 hours Lunch break.13 00 hours Inspection o f physical facilities o f the pharmacy/dispensary/store.15 00 hours Examination o f stock cards, ordering cards and stocktaking14 30 hours Wrap up16 00 hours Leave Facility
104