
The Archaeology of a 'Destroyed' Site: Surface Survey and ...

Sydney Illawarra Eurobodalla
Site Surface Water Management Plan
Report Prepared for: Alexandria Landfill Pty Ltd
November 2008 Project No. 717
Prepared by: STORM CONSULTING PTY LTD
Head Office Suite 3, 6 West Street Pymble NSW 2073 Australia T +61 (02) 9499 4333 F +61 (02) 0499 4311 www.stormconsulting.com.au
i
Document Verification Project title Light Horse SWA ACN 080 852 231
ABN 73 080 852 231 Project number Document title Surface Water Management Report
717
Description Light Horse Waste Facility – Surface Water Assessment
Client Contact Chris Biggs, DADI
Name Signature Issue: Date Prepared by Georgia de Biasi / Nicola Lo
Checked by Brad Farr / Nicola Lo
Issued by Georgia de Biasi
Filename 717 Light Horse SW_21Nov08.doc
A B C D
15/12/07 07/02/08 27/3/08 24/11/08
Document History
Issue A Issue B Issue C Issue D Issue to: Date No. Copies Date No. Copies Date No. Copies
Jodi Kelehear (ERM) 15/12/07 PDF 7/2/08 PDF
Rene Bakeri 27/3/08 PDF
Chris Biggs (DADI) 24/11/08 PDF
Commercial in Confidence
All intellectual property rights, including copyright, in designs developed and documents created by STORM CONSULTING Pty Ltd remain the property of that company. Any use made of any such design or document without the prior written approval of STORM CONSULTING Pty Ltd will constitute an infringement of the rights of that company which reserves all legal rights and remedies in respect of any such infringement.
The information, including the intellectual property, contained in this document is confidential and proprietary to STORM CONSULTING Pty Ltd. It may only be used by the person to whom it is provided for the stated purpose for which it is provided, and must not be imparted to any third person without the prior written approval of STORM CONSULTING Pty Ltd. STORM CONSULTING Pty Ltd reserves all legal rights and remedies in relation to any infringement of its rights in respect of its confidential information.
© 2008 STORM CONSULTING Pty Ltd
Disclaimer
This report is prepared by STORM CONSULTING Pty Ltd for its clients' purposes only. The contents of this report are provided expressly for the named client for its own use. No responsibility is accepted for the use of or reliance upon this report in whole or in part by any third party.
This report is prepared with information supplied by the client and possibly other stakeholders. While care is taken to ensure the veracity of information sources, no responsibility is accepted for information that is withheld, incorrect or that is inaccurate. This report has been compiled at the level of detail specified in the report and no responsibility is accepted for interpretations made at more detailed levels than so indicated.
ii
EXECUTIVE SUMMARY This Surface Water Management report was prepared as part of the Environmental Assessment for the Light Horse Business Centre which is proposed to include the construction and operation of a resource recovery facility and a landfill facility. It was revised following a request for further information. The Project site is located at Eastern Creek in western Sydney and comprises four separate parcels of land, identified as Lot 2 DP 262213, Lot 1 DP 400697, Lot W DP 419612, and Lot 10, DP 241859. Storm has prepared a Surface Water Management Plan (SWMP) taking into account Blacktown City Council’s stormwater management objectives and also the Director-General’s Requirements for the Project.
The SWMP addresses erosion and sediment control, water quantity and water quality.
In summary, the proposed stormwater management system includes:
Each building should have its own rainwater tank (min. 10kL volume) to harvest roof water for reuse on site, including for toilet flushing and wheel wash top up;
Runoff generated from the Materials Processing Centre and green waste area are to be diverted to sewer and managed accordingly;
Stormwater runoff from the other operational areas of the site will be treated through a gross pollutant trap prior to discharge to a combined on-site detention (OSD) basin with wetland treatment for water quality
Additional volume is allowed in the OSD / treatment basin for irrigation water storage; drawdown would occur regularly for irrigation and dust suppression.
The proposed OSD storage requirements for the operational area is 370m3/Ha (5500m3 based on 14.8ha impervious area) and has been designed to manage peak flows up to the 1 in 100yr ARI storm event.
A sprinkler system is proposed to be located along the berms and utilised for both dust suppression and irrigation purposes.
Stormwater runoff control within the quarry pit is to be used to assist in reducing leachate volumes. A collection basin is proposed which can be drawn down following storm events for reuse for dust suppression by water carts.

iii
TABLE OF CONTENTS 1.0 INTRODUCTION ........................................................................................................1
1.1. Background ........................................................................................................................................ 1
1.2. Development Overview ....................................................................................................................... 2
1.3. Project Scope ..................................................................................................................................... 2
1.4. Planning Controls and Policy Objectives .............................................................................................. 3
1.4.1. Director-General’s Requirements....................................................................................... 3
1.4.2. Eastern Creek Precinct Plan.............................................................................................. 3
1.4.3. Other Relevant Documents ............................................................................................... 3
2.0 SITE DESCRIPTION ..................................................................................................4
2.1. Location and Land Use ........................................................................................................................ 4
2.2. Catchments, Hydrology and Drainage.................................................................................................. 5
3.0 SURFACE WATER MANAGEMENT...........................................................................8
3.1. Background ........................................................................................................................................ 8
3.2. Soil and Water Management ............................................................................................................... 8
3.2.1. General............................................................................................................................. 8
3.2.2. Stockpile and green waste areas ...................................................................................... 9
3.3. Operational Areas ............................................................................................................................... 9
3.4. Quarry Pit / Landfill ........................................................................................................................... 10
3.4.1. Quarry Pit Storage Basin ................................................................................................ 11
3.5. Flooding............................................................................................................................................ 12
3.6. Proposed Changes to Catchment Drainage........................................................................................ 12
4.0 ON-SITE DETENTION (OSD)....................................................................................13
4.1. Background ...................................................................................................................................... 13
4.2. Methodology..................................................................................................................................... 13
4.3. Assumptions ..................................................................................................................................... 13
4.4. Results ............................................................................................................................................. 14
4.5. Discussion ........................................................................................................................................ 14
4.6. Dam Safety Committee requirements................................................................................................ 15

iv
5.0 WATER CYCLE MANAGEMENT..............................................................................16
5.1. Water Balance Methodology and Concept ......................................................................................... 16
5.2. Modelling Inputs ............................................................................................................................... 17
5.2.1. Rainfall........................................................................................................................... 17
5.2.2. Harvestable areas........................................................................................................... 17
5.2.3. Water demands............................................................................................................... 17
5.3. Results - Catchment runoff ............................................................................................................... 18
5.4. Storage sizing ................................................................................................................................... 18
5.4.1. Raintanks and building roofs ........................................................................................... 18
5.4.2. Surface runoff from operational area .............................................................................. 19
5.4.3. Surface runoff from quarry ............................................................................................. 20
5.5. Summary of Storage Volumes ........................................................................................................... 21
6.0 WATER QUALITY ....................................................................................................22
6.1. Water Quality Management .............................................................................................................. 22
6.1.1. Pollutant Treatment Priorities......................................................................................... 22
6.1.2. Maintenance and Monitoring........................................................................................... 24
6.2. MUSIC modelling .............................................................................................................................. 25
6.2.1. Methodology................................................................................................................... 25
6.2.2. Assumptions................................................................................................................... 25
6.2.3. Results ........................................................................................................................... 26
6.2.4. Discussion ...................................................................................................................... 27
6.3. Salinity ............................................................................................................................................. 27
6.3.1. Site Water Management for Salinity ............................................................................... 27
7.0 SUMMARY ..............................................................................................................29
7.1. Summary of Stormwater Management Measures.............................................................................. 29
8.0 REFERENCES...........................................................................................................31

v
APPENDICES APPENDIX A
Surface Water Management Plan
APPENDIX B
Blue Book calculations
APPENDIX C
Model outcomes – RAFTS
APPENDIX D
Model – MUSIC layout

1
1.0 INTRODUCTION 1.1. Background
This is a revised report commissioned by Alexandria Landfill Pty Ltd to provide additional information to that supplied in STORM_CONSULTING’s Site Surface Water Management Plan dated February 2008.
ThaQuarry Pty Ltd and ACN 114 843 453 Pty Ltd seek project approval for the construction and operation of resource recovery facility (including a materials processing centre (MPC) and waste transfer station (WTS)), and a Class 2 inert and solid waste landfill at Eastern Creek, in Sydney’s west. Project approval is sought under Part 3A of the Environmental Planning and Assessment Act, 1979. The application process is to be managed on behalf of both parties by ThaQuarry Pty Ltd under the project name Light Horse Business Centre.
STORM_CONSULTING was commissioned by Environmental Resources Management Australia Pty Ltd (ERM) on behalf of the proponent to prepare a site Surface Water Management Plan for the Project, as part of the overall Environmental Assessment. This report has been revised to include additional information and amended data following a request for additional information from Blacktown City Council.
The site’s location is shown in Figure 1-1. It is within the Blacktown City Council (BCC) Local Government Area. The Pioneer Quarry previously operated at the site. It has now reached the end of its economic life and all quarrying activities at the site ceased in September 2006, though the quarry void remains.
State Environmental Planning Policy No 59 – Central Western Sydney Economic and Employment Area (SEPP 59) applies to a number of landholdings in western Sydney, including the Project site, which lies within the Eastern Creek Precinct of the SEPP 59 lands.
Figure 1-1: Site Location
Site

2
1.2. Development Overview For the purposes of this assessment, the area of operations has been divided into two areas, termed the operational area and the quarry area. The operational area is depicted in Figure 1-2 and will be bounded by berms to the north, west and south, and by the quarry pit to the east. It will incorporate the following features:
Access and internal roads; Car and truck parking areas; Administration and workshop buildings; Weighbridge and associated building; Materials Processing Centre (MPC) and Waste Transfer Station (WTS); Green waste processing/stockpile area; and Drop-off zone and materials stockpile areas.
The quarry area refers to the existing quarry pit, which is the main feature of the site. It is proposed to become a licensed class 2 inert and solid waste landfill.
Figure 1-2. Site layout
1.3. Project Scope STORM’s scope of works for this surface water assessment report included:
Preparation of site catchment plans and justification for any proposed redistribution between catchment areas, as defined in the Precinct Plan;
Development of a concept stormwater drainage plan, including provision of water sensitive urban design (WSUD) elements where possible;
Preparation of a soil and water management plan in accordance with Landcom’s (2004) Managing Urban Stormwater- Soils and Construction – “The Blue Book”;
Green waste/ stockpile area
Operational area boundary
Buildings
Drop-off zone/ stockpile areas
3
Stormwater detention calculations to determine relevant details of basins and drainage works; Water balance/ water management for wet, dry and average years, including water requirements (quantity,
quality and sources) and proposed stormwater and wastewater disposal, including type, volumes, proposed treatment and management methods and reuse options;
Identification of the quantity and physico-chemical properties of potential water pollutants and the risks they pose;
Review of flood reports; Preparation of a Surface Water Assessment Report.
1.4. Planning Controls and Policy Objectives
1.4.1. Director-General’s Requirements The Director-General’s (DG’s) requirements issued on 22 June 2006 require a detailed assessment of specified key issues. In this report STORM addresses the DG’s requirements for surface water, which are included in the Soil and Water category of Key Issues. These include:
Surface water impacts; Stormwater management, including detailed consideration of any potential offsite drainage and flooding
impacts; Erosion and sediment control; Salinity, in the context of site surface water management.
Other items identified in the DG’s requirements (including groundwater, soil contamination, and other aspects of salinity at the site) are beyond the scope of this report and have been addressed in the Environmental Assessment Report prepared by ERM (2008).
Where necessary, STORM has consulted with Blacktown City Council with respect to regulatory requirements.
1.4.2. Eastern Creek Precinct Plan The Eastern Creek Precinct Plan – Stage 3 has been prepared in accordance with the provisions of SEPP 59 for land identified as Release Area 3 within the Eastern Creek Precinct (inclusive of the Project site). The draft Precinct Plan was adopted by Council on 7 December 2005, and came into force on 14 December 2005. It outlines the provisions relating to development of the Stage 3 Release Area, to ensure the SEPP aims are met.
This report aims to ensure the Project meets the relevant Environmental, Urban Amenity, Engineering and Economic objectives as set out in Section 5.5 of the Precinct Plan.
1.4.3. Other Relevant Documents Other documents considered in the preparation of this report include:
Institution of Engineers (2000) Australian Rainfall and Runoff; Blacktown City Council (2005) Engineering Guide for Development; Landcom (2004) Managing Urban Stormwater: Soils and Construction Volume 1, 4th Edition and Volume
2B – Waste Landfills (currently available as a draft for consultation only); Blacktown City Council (2005) Stormwater Quality Control Policy P01100; SMEC (2004) SEPP59 Landholder Group Eastern Creek Precinct Plan Stormwater Management Strategy.
4
2.0 SITE DESCRIPTION 2.1. Location and Land Use
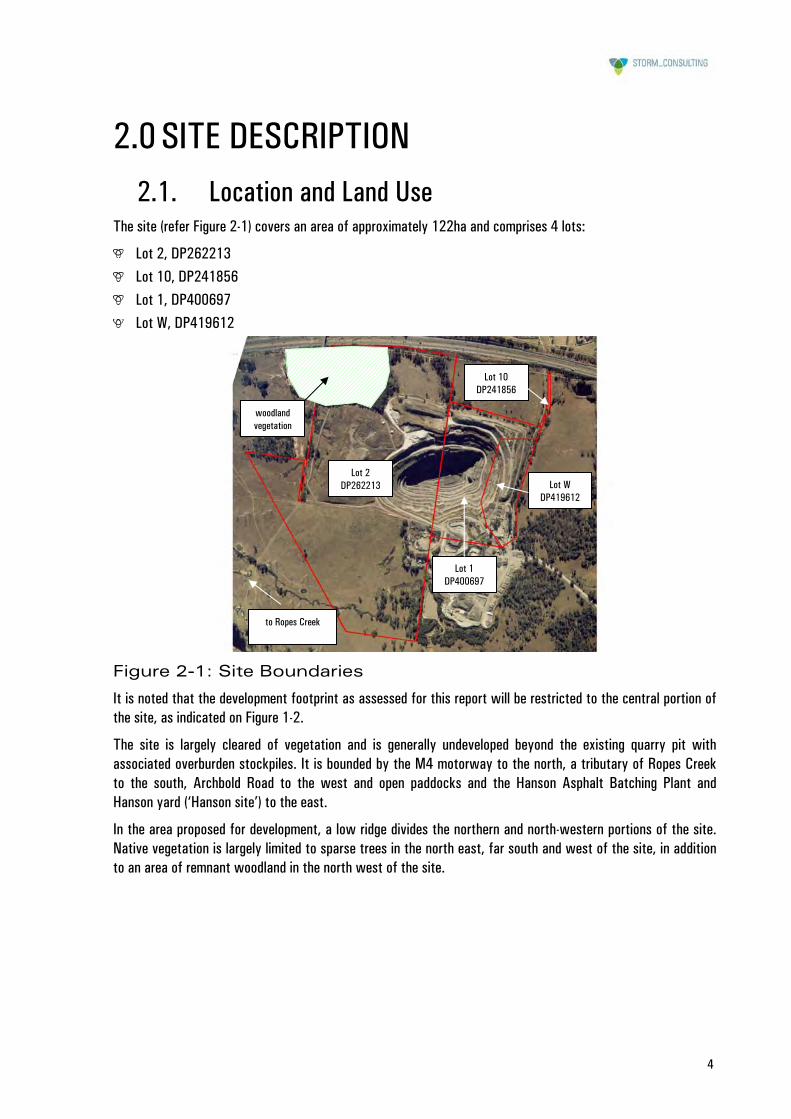
The site (refer Figure 2-1) covers an area of approximately 122ha and comprises 4 lots:
Lot 2, DP262213 Lot 10, DP241856 Lot 1, DP400697 Lot W, DP419612
Figure 2-1: Site Boundaries
It is noted that the development footprint as assessed for this report will be restricted to the central portion of the site, as indicated on Figure 1-2.
The site is largely cleared of vegetation and is generally undeveloped beyond the existing quarry pit with associated overburden stockpiles. It is bounded by the M4 motorway to the north, a tributary of Ropes Creek to the south, Archbold Road to the west and open paddocks and the Hanson Asphalt Batching Plant and Hanson yard (‘Hanson site’) to the east.
In the area proposed for development, a low ridge divides the northern and north-western portions of the site. Native vegetation is largely limited to sparse trees in the north east, far south and west of the site, in addition to an area of remnant woodland in the north west of the site.
Lot 2 DP262213
Lot 10 DP241856
Lot 1 DP400697
Lot W DP419612
to Ropes Creek
woodland vegetation
5
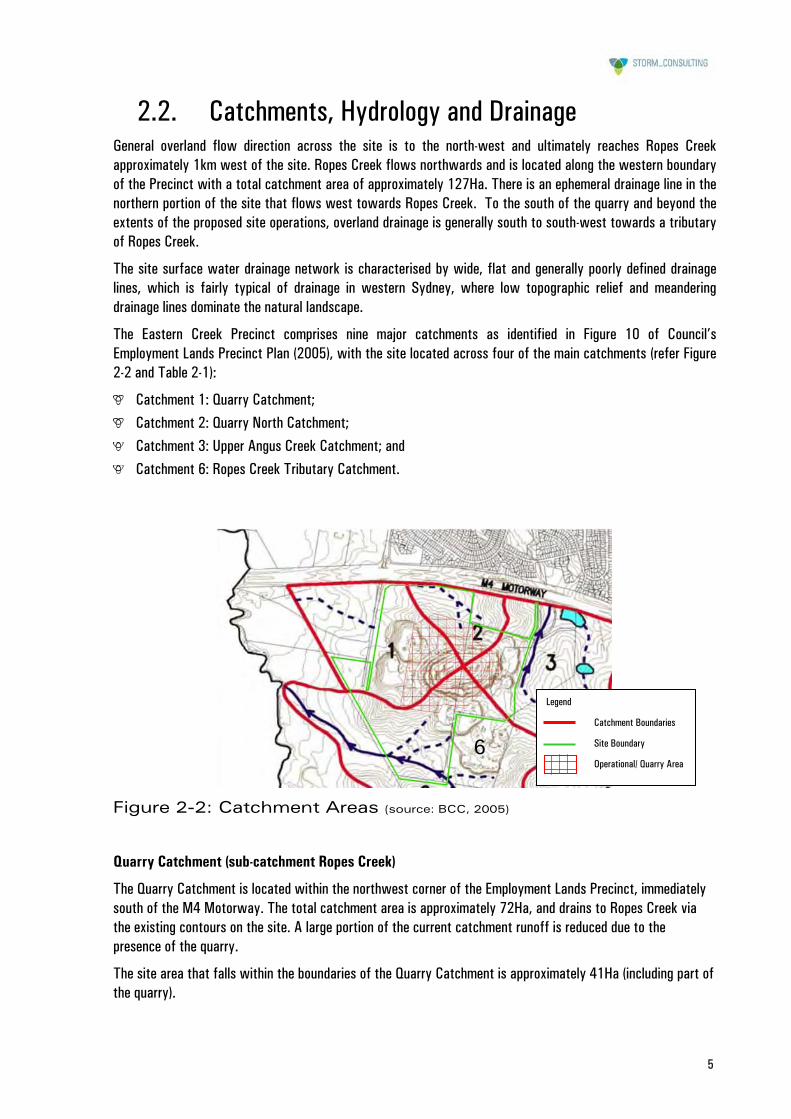
2.2. Catchments, Hydrology and Drainage General overland flow direction across the site is to the north-west and ultimately reaches Ropes Creek approximately 1km west of the site. Ropes Creek flows northwards and is located along the western boundary of the Precinct with a total catchment area of approximately 127Ha. There is an ephemeral drainage line in the northern portion of the site that flows west towards Ropes Creek. To the south of the quarry and beyond the extents of the proposed site operations, overland drainage is generally south to south-west towards a tributary of Ropes Creek.
The site surface water drainage network is characterised by wide, flat and generally poorly defined drainage lines, which is fairly typical of drainage in western Sydney, where low topographic relief and meandering drainage lines dominate the natural landscape.
The Eastern Creek Precinct comprises nine major catchments as identified in Figure 10 of Council’s Employment Lands Precinct Plan (2005), with the site located across four of the main catchments (refer Figure 2-2 and Table 2-1):
Catchment 1: Quarry Catchment; Catchment 2: Quarry North Catchment; Catchment 3: Upper Angus Creek Catchment; and Catchment 6: Ropes Creek Tributary Catchment.
Figure 2-2: Catchment Areas (source: BCC, 2005)
Quarry Catchment (sub-catchment Ropes Creek)
The Quarry Catchment is located within the northwest corner of the Employment Lands Precinct, immediately south of the M4 Motorway. The total catchment area is approximately 72Ha, and drains to Ropes Creek via the existing contours on the site. A large portion of the current catchment runoff is reduced due to the presence of the quarry.
The site area that falls within the boundaries of the Quarry Catchment is approximately 41Ha (including part of the quarry).
Legend
Catchment Boundaries
Site Boundary
Operational/ Quarry Area 6

6
Quarry North Catchment
The Quarry North Catchment is approximately 28Ha and is located immediately south of the M4 and east of the Quarry Catchment. The quarry void would intercept a large portion of the runoff from this catchment. Stormwater from this catchment drains through culverts located under the M4, to the area north of the M4.
The area of the Quarry North Catchment included within the site boundaries is approximately 19Ha.
Upper Angus Creek Catchment
The Upper Angus Creek Catchment is located in the northern section of the Precinct and has an area of 89Ha and drains northwards beneath the M4 Motorway.
The site area that lies in the Upper Angus Creek Catchment is 16Ha. It consists primarily of the quarry, whilst the remaining area is not subject to any development proposed under this DA.
Ropes Creek Tributary Catchment
Ropes Creek Tributary flows from east to west. There is a small farm dam located near the top of its catchment. Some signs of erosion are present near the dam.
The site area that falls within the Ropes Creek Tributary Catchment comprises quarry and undeveloped lands of approximately 44Ha.
Table 2-1: Site Catchment
Catchment Number
Catchment Name Site Area in Catchment (Ha)
Total Catchment Area (ha) 1
1 Quarry Catchment 41 72
2 Quarry North Catchment 19 28
3 Upper Angus Creek Catchment
17.6 89
6 Ropes Creek Tributary Catchment
44 127
TOTAL 121.6 316 1 Source: Blacktown City Council Eastern Creek Precinct Plan 2005
For the purposes of modelling for this surface water assessment, the development area has been divided into two catchment areas. It has been assumed that the remaining site area will retain its current characteristics (pre-development state). The two developable areas comprise:
1) Operational area of the resource recovery facility (RRF), 14.8ha
2) Quarry area, approximately 26.5Ha.
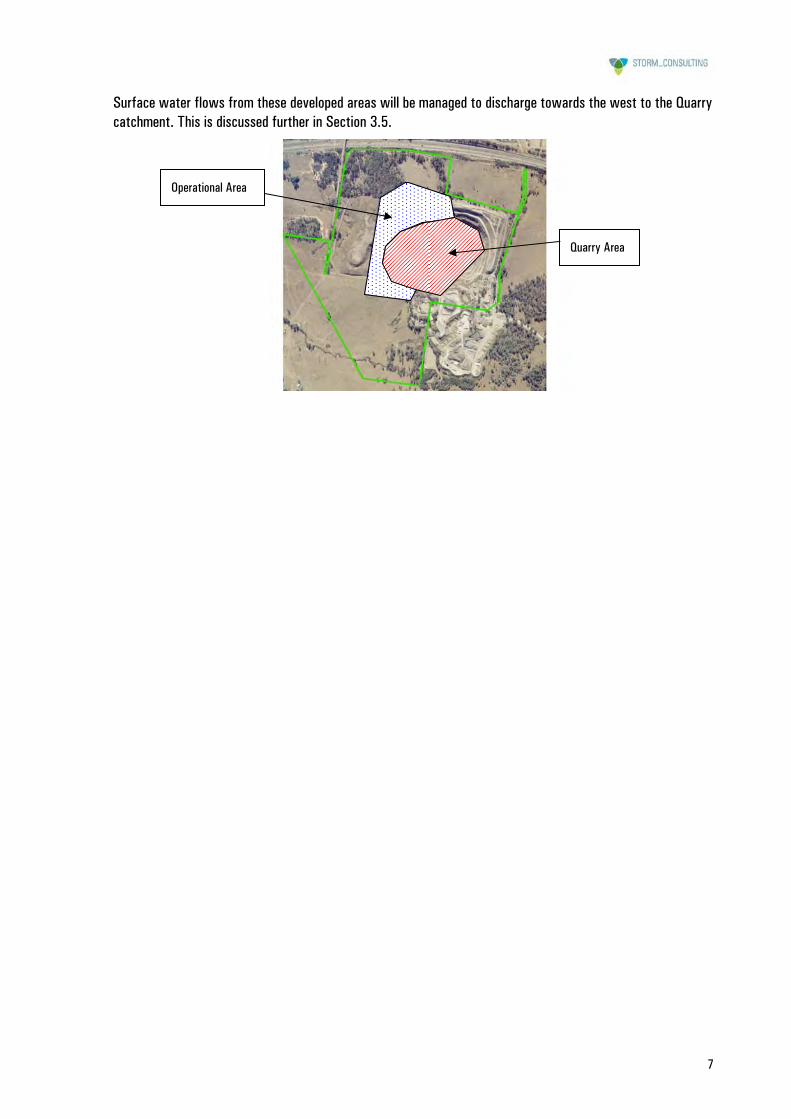
7
Surface water flows from these developed areas will be managed to discharge towards the west to the Quarry catchment. This is discussed further in Section 3.5.
Operational Area
Quarry Area
8
3.0 SURFACE WATER MANAGEMENT 3.1. Background
Part of the analysis required for successful development of the Resource Recovery Facility (RRF) and Landfill Facility includes planning of surface water management for the site. As water is both an input and output (waste product) of site activities, site planning needs to adopt an integrated approach to water management.
The key issues concerning site surface water management comprise:
Segregation and management of ‘clean’ (water from operational areas) and ‘dirty’ runoff (i.e. leachate, or water that has come into contact with mixed wastes, green and timber wastes and uncovered landfilled wastes);
Erosion and sediment control including protection of the drainage system from sediment influx; Quarry pit/haul road water management; Water quality control; and Provision of adequate on-site detention for the proposed operations.
Additionally, the Precinct Plan and Engineering Guide to Development require that pipe sizes be based on a 20 year ARI design flow and that the major drainage system be designed to safely convey the critical 100 year event under normal operating conditions.
Surface runoff generated on-site will fall into two categories
1) ‘clean’ (not leachate) – available for reuse (following roof water collection in rainwater tanks or runoff from clean operational areas which may require treatment for sediment only), and
2) ‘dirty’ (leachate) – generated from the base of the landfill, green waste areas and run off that has come into contact with mixed wastes, green and timber wastes and uncovered landfilled wastes.
Given the recent and impending changes to climate (including pronounced drought conditions), it is intended that the site remains as independent as possible of external water sources, and that the potential for off-site impacts to local receiving waters is minimised. The site layout for stormwater management is presented in Appendix A.
3.2. Soil and Water Management Appendix A contains the Soil and Water Management Plan.
3.2.1. General Site soil and water management will be required throughout the life of the project. The SWMP will adhere to the following principles:
It is proposed to direct all operational area (hardstand clean) surface runoff (excluding water managed within the quarry pit) towards the Quarry catchment;
Sediment-laden stormwater from the materials stockpile area will be directed through permanent sediment capture sumps or mini-basins along surface drainage to intercept sediment prior to reduce sediment ‘slugs’ reaching the GPT. Site grading is to be used to direct sediment-laden drainage away from hardstand areas;
The MPC work floor and green waste area is to be diverted to sewer;
9
Truck access to and from the unsealed areas are to be stable and designed to prevent influx of run-on and escape of untreated flows where possible;
Runoff from site operational areas (as defined in Section 3.3) is to be directed through treatment devices (sediment traps and low-flow wetland treatment) and OSD for reuse prior to release to the site’s drainage network. Overland flow paths for flows in excess of the design event are to follow natural drainage lines to the west of the site;
Treatment devices around the site would provide sediment capture, gross pollutants where necessary, and must also be capable of capturing oil and fuel spills. Proprietary devices such as CDS, Humeceptor or similar can be selected and designed in consultation with the manufacturer to accommodate the required treatment;
The treatment devices proposed for soil and water management are: Small sediment sumps or mini-basins along swales to trap sediment ‘slugs’ if entrained in stormwater
flow; Sediment traps, e.g. proprietary gross pollutant trap (GPT) (CDS, Humeceptor or similar) or baffled
settlement tank capable of retaining gross pollutants, sediment, oils and grease; Within OSD basin: allowance for wet storage component, as a low-flow wetland for low-flow water
quality treatment to remove fine suspended sediments as well as nutrients. Energy dissipation in the OSD basin settling basin for pre-treatment before entry to the OSD basin will
provide further attenuation and capture of sediment that may reach the detention basin.
3.2.2. Stockpile and green waste areas Sediment controls installed within the materials stockpile area will be maintained to prevent clogging and to prevent excessive sediment and nutrients entering the drainage system. These controls are to include:
Small sediment sumps or mini-basins along swales to trap sediment ‘slugs’ if entrained in stormwater flow; Treatment through a GPT or baffled sediment settlement underground tank at the drainage outlet of these
two areas, Protection of drains within these areas using:
o vehicle exclusion,
o stabilisation or lining of drains,
o check-devices such as sediment sumps or mini-basins approximately every 50 metres to attenuate flows and encourage sediment dropout.
Regular maintenance of drains and sediment traps to reduce loads within the system. Runoff within the MPC work floor/ green waste collection area is to be managed as described in Section 3.2.
The green waste area, MPC floor, and materials stockpile area are graded away from the quarry to reduce the risk of overflows entering the quarry/landfill area.
3.3. Operational Areas Surface runoff from the operational area will be managed separately from runoff generated in the quarry pit and haul road. Sources of stormwater runoff from the operational area include:
Building roofs – workshop, MPC/ WTS, administration building and weighbridge shed – clean; Roads, car parks and other hardstand areas – clean, containing sediment; MPC work floor/ green waste stockpiles – dirty (to be directed to sewer);

10
Materials stockpiles / drop off zones– clean, containing sediment. Runoff collected from the clean or sediment-only areas will be reused on site, for uses including building internal uses (toilet flushing), wheel wash facility, dust suppression (via water carts) and irrigation/dust suppression from sprinkler systems around the site. (A water balance which utilises runoff generated on-site and estimated demands for the above uses have been developed and are discussed in Section 5.0.)
Drainage from the MPC work floor/green waste area is to remain in a ‘closed loop’ system with connections only to sewer. Drainage from this area is not considered in detail in this report.
Run off from other areas of the MPC/ WTS and stockpile/drop-off zones is considered to be “clean operational waters” but runoff from these areas will be subject to treatment (sediment removal) prior to reuse. Clean runoff from roofs will be collected in rainwater tanks for reuse on-site. Runoff from other parts of the operational area (e.g. roads, open areas away from stockpiles and buildings) will also be considered clean runoff and suitable for treatment and reuse on-site. This water may be directed to the OSD basin or storage tanks on-site (location to be determined), subject to satisfactory water quality.
Stormwater runoff will be conveyed by a combination of major and minor drainage systems, as shown in Appendix A, including:
An underground piped system with provision for overland flow in swales and along roads; Stormwater detention and pollution control structures, and The natural drainage systems including creeks and overland flow.
BCC requirements are that piped networks are designed to convey 1 in 20 year flows without surcharge. Drainage overflows (greater than 1 in 100yr flows) from both these areas will be discharged away from the quarry pit via overland flow paths. Alternatively if required, overflows will be treated and sent to sewer (at an increased capacity if required).
Vehicle entry points for MPC work floor, green waste and materials stockpile / drop-off areas are to be located to minimise uncontrolled runoff and sediment release outside these areas.
Overland flow paths around the site are to remain stable in 100 year critical flows.
3.4. Quarry Pit / Landfill The in pit haul road will be graded towards the quarry wall. The haul road will be graded towards the quarry wall and will follow a dish drain along the length of the road to a sediment basin proposed for the base of the quarry. Small check dams (e.g. sand bags or aggregate material approx 50mm diameter) located along the dish drain will assist in controlling flow velocities and erosion. At the base of the haul road, a temporary settlement sump is to be installed (e.g. concrete tank or temporary basin lined with geotextile and rock that can be moved as required) to slow down flows and to allow sediment to drop out prior to diversion to a clean area for pumping out (during initial 10m lift) or diversion to the in-pit basin (later stages of landfill management)
A storage basin will be required in the quarry pit to collect clean runoff from quarry walls, haul road and capped landfill areas. This basin is to be progressively relocated throughout landfilling, however no basin is proposed for the first 10m landfill lift.
Runoff collected from these areas will be suitable for reuse if it has not come into contact with waste, and it is expected that the water carts will be able to draw from the sediment basin and reuse this water for dust suppression on haul roads.
11
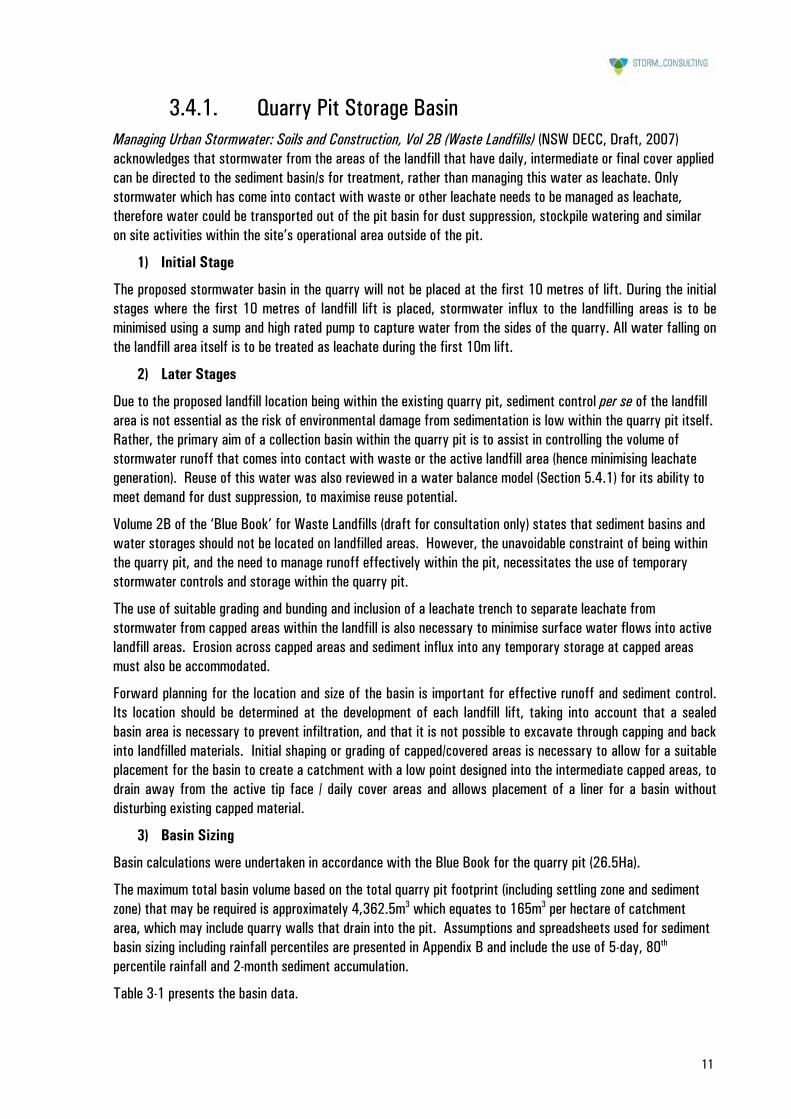
3.4.1. Quarry Pit Storage Basin Managing Urban Stormwater: Soils and Construction, Vol 2B (Waste Landfills) (NSW DECC, Draft, 2007) acknowledges that stormwater from the areas of the landfill that have daily, intermediate or final cover applied can be directed to the sediment basin/s for treatment, rather than managing this water as leachate. Only stormwater which has come into contact with waste or other leachate needs to be managed as leachate, therefore water could be transported out of the pit basin for dust suppression, stockpile watering and similar on site activities within the site’s operational area outside of the pit.
1) Initial Stage
The proposed stormwater basin in the quarry will not be placed at the first 10 metres of lift. During the initial stages where the first 10 metres of landfill lift is placed, stormwater influx to the landfilling areas is to be minimised using a sump and high rated pump to capture water from the sides of the quarry. All water falling on the landfill area itself is to be treated as leachate during the first 10m lift.
2) Later Stages
Due to the proposed landfill location being within the existing quarry pit, sediment control per se of the landfill area is not essential as the risk of environmental damage from sedimentation is low within the quarry pit itself. Rather, the primary aim of a collection basin within the quarry pit is to assist in controlling the volume of stormwater runoff that comes into contact with waste or the active landfill area (hence minimising leachate generation). Reuse of this water was also reviewed in a water balance model (Section 5.4.1) for its ability to meet demand for dust suppression, to maximise reuse potential.
Volume 2B of the ‘Blue Book’ for Waste Landfills (draft for consultation only) states that sediment basins and water storages should not be located on landfilled areas. However, the unavoidable constraint of being within the quarry pit, and the need to manage runoff effectively within the pit, necessitates the use of temporary stormwater controls and storage within the quarry pit.
The use of suitable grading and bunding and inclusion of a leachate trench to separate leachate from stormwater from capped areas within the landfill is also necessary to minimise surface water flows into active landfill areas. Erosion across capped areas and sediment influx into any temporary storage at capped areas must also be accommodated.
Forward planning for the location and size of the basin is important for effective runoff and sediment control. Its location should be determined at the development of each landfill lift, taking into account that a sealed basin area is necessary to prevent infiltration, and that it is not possible to excavate through capping and back into landfilled materials. Initial shaping or grading of capped/covered areas is necessary to allow for a suitable placement for the basin to create a catchment with a low point designed into the intermediate capped areas, to drain away from the active tip face / daily cover areas and allows placement of a liner for a basin without disturbing existing capped material.
3) Basin Sizing
Basin calculations were undertaken in accordance with the Blue Book for the quarry pit (26.5Ha).
The maximum total basin volume based on the total quarry pit footprint (including settling zone and sediment zone) that may be required is approximately 4,362.5m3 which equates to 165m3 per hectare of catchment area, which may include quarry walls that drain into the pit. Assumptions and spreadsheets used for sediment basin sizing including rainfall percentiles are presented in Appendix B and include the use of 5-day, 80th percentile rainfall and 2-month sediment accumulation.
Table 3-1 presents the basin data.
12
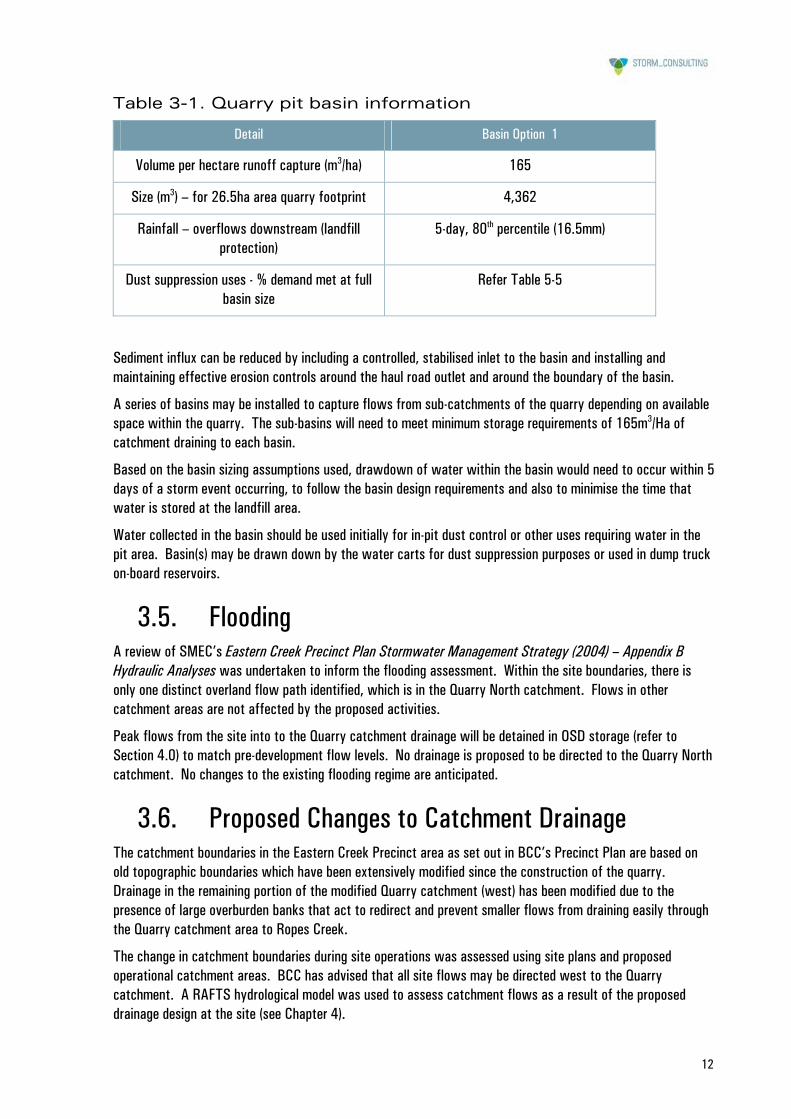
Table 3-1. Quarry pit basin information
Detail Basin Option 1
Volume per hectare runoff capture (m3/ha) 165
Size (m3) – for 26.5ha area quarry footprint 4,362
Rainfall – overflows downstream (landfill protection)
5-day, 80th percentile (16.5mm)
Dust suppression uses - % demand met at full basin size
Refer Table 5-5
Sediment influx can be reduced by including a controlled, stabilised inlet to the basin and installing and maintaining effective erosion controls around the haul road outlet and around the boundary of the basin.
A series of basins may be installed to capture flows from sub-catchments of the quarry depending on available space within the quarry. The sub-basins will need to meet minimum storage requirements of 165m3/Ha of catchment draining to each basin.
Based on the basin sizing assumptions used, drawdown of water within the basin would need to occur within 5 days of a storm event occurring, to follow the basin design requirements and also to minimise the time that water is stored at the landfill area.
Water collected in the basin should be used initially for in-pit dust control or other uses requiring water in the pit area. Basin(s) may be drawn down by the water carts for dust suppression purposes or used in dump truck on-board reservoirs.
3.5. Flooding A review of SMEC’s Eastern Creek Precinct Plan Stormwater Management Strategy (2004) – Appendix B Hydraulic Analyses was undertaken to inform the flooding assessment. Within the site boundaries, there is only one distinct overland flow path identified, which is in the Quarry North catchment. Flows in other catchment areas are not affected by the proposed activities.
Peak flows from the site into to the Quarry catchment drainage will be detained in OSD storage (refer to Section 4.0) to match pre-development flow levels. No drainage is proposed to be directed to the Quarry North catchment. No changes to the existing flooding regime are anticipated.
3.6. Proposed Changes to Catchment Drainage The catchment boundaries in the Eastern Creek Precinct area as set out in BCC’s Precinct Plan are based on old topographic boundaries which have been extensively modified since the construction of the quarry. Drainage in the remaining portion of the modified Quarry catchment (west) has been modified due to the presence of large overburden banks that act to redirect and prevent smaller flows from draining easily through the Quarry catchment area to Ropes Creek.
The change in catchment boundaries during site operations was assessed using site plans and proposed operational catchment areas. BCC has advised that all site flows may be directed west to the Quarry catchment. A RAFTS hydrological model was used to assess catchment flows as a result of the proposed drainage design at the site (see Chapter 4).

13
4.0 ON-SITE DETENTION (OSD) 4.1. Background
A series of regional detention basins are proposed in BCC’s Eastern Creek Precinct Plan. One of these regional detention basins is proposed to be located at the site, within the Quarry North Catchment adjacent to the northern site boundary and the M4 Motorway. Another is proposed to the west of the site towards Ropes Creek.
Discussions with Council indicated that these regional basins were still subject to investigation therefore site basin(s) would be required for any proposed development in the interim.
This section presents the results of site specific OSD modelling.
4.2. Methodology An XP-RAFTS computer model was generated to replicate pre- and post-development flows for the operational area which is subject to change in land-use following construction for the proposed operational area, to calculate OSD volume requirements. This was based on the assumption that the remaining site area will not change form or characteristics from the pre-development situation, and hence, any flows generated in these areas will remain the same as for the pre-development scenario.
Council guidelines require post-development peak flows to match pre-development peak flows up to the 100yr storm events. The model was run for the 2 year and 100 year ARI storm event to derive the required OSD volumes.
XP-RAFTS software allows the user to optimise OSD volume requirements with the use of a storage node receiving flows from the subject catchment. A two-stage discharge (2yr and 100yr) was modelled to check preliminary discharge calculations for peak flow hydrographs.
4.3. Assumptions The operational area (including berms) was modelled in XP-RAFTS and incorporated an area of 14.8Ha. The operational area was divided into two separate catchments to reduce the total anticipated basin size. Basin 1 catchment is the northern section of the operational area with a modelled area of 10.03ha. Basin 2 catchment occupies the southern section of the operational area with a modelled area of 4.74ha.
The catchments were considered to be 100% pervious in the pre-development model and 100% impervious post-development. These assumptions would result in conservative estimates for flow and OSD storage requirements.
Other XP-RAFTS modelling assumptions are documented in Table 4-1.

14
Table 4-1: RAFTS modelling criteria for on-site detention determination
Parameter Pre-development Post-development
Initial Loss/Continuing Loss (assumes wet antecedent conditions and is a conservative approach)
15mm/3mm 5mm/1mm
Roughness value across site 0.04 0.02
Proportion impervious (%) 0 100
4.4. Results Peak flows from the site operational areas were calculated using RAFTS for the predevelopment and post-development scenarios. This was used to calculate the required OSD storage volume to prevent downstream hydraulic impacts as a result of site development and allow matching of pre- and post-development flows off site. Table 4.4 shows the results of peak flow modelling.
Table 4-2: Results for OSD modelling
Catchment ARI Pre-development Peak Flows (m3/s)
Post-development Peak Flows without
detention (m3/s)
Post-development
Peak Flows with detention (m3/s)
Required OSD Storage Volume
(m3)
100 yr 1.156 5.277 1.110 Basin 1 Catchment
2yr 0.416 2.643 0.403 3,900
100yr 0.605 2.511 0.621 Basin 2 Catchment
2yr 0.215 1.249 0.206 1,600
Staged discharge was initially determined using the orifice equation to estimate an orifice outlet diameter, then modelled in several iterations to ensure that pre-development and post-development flows and hydrographs were as close as possible for the 2 year and 100 year ARI. Charts showing pre- and post-development hydrographs and basin hydrographs are presented in Appendix C.
4.5. Discussion Based on the OSD modelling results presented in Table 4-2, an OSD basin storage volume of 5,500m3 is required for the proposed operational area. The quarry area itself will not require detention storage and following final completion and capping of the landfill, drainage from the area is to be diverted around detention storages. In the event that there is a change in impervious area, an OSD volume of 370m3/Ha may be adopted based on the modelling in this report.

15
4.6. Dam Safety Committee requirements The New South Wales Dam Safety Committee (DSC) Risk Management Policy Framework for Dam Safety (2006) was reviewed for requirements and criteria for risk assessment.
Among other goals, the DSC states that its mission is to develop and implement effective policies and procedures for regulation of dam safety. In general, dam safety is initially determined through a risk assessment that uses the probability of failure per dam in one year (with probabilities ranging from 10-7 to 10-3) and the number of fatalities that would occur as a result of dam failure. An appropriate dam safety assessment would need to be undertaken at the relevant detailed design stage for the OSD basin.
For this site, the proposed OSD basin sizes are 3,900m3 and 1,600m3, smaller than several of the existing dams at the Eastern Creek Precinct. Generally basins will be constructed so that maximum water levels will be at most 1 metre above existing downstream ground levels, overland flow travels across rural land towards Ropes Creek.
Flows from either basin could be classed as “slow and shallow” in relation to overland flow paths, non-defined drainage lines allowing flow dispersion, and relatively long overland flow paths over un-occupied land to the nearest defined drainage line.
Moreover, STORM notes that the intended construction of a much larger regional detention basin in the vicinity of the proposed OSD basins. The larger OSD basin may present higher risks than that proposed for this site for the operations phase of the development, and will also require scrutiny particularly as the structure is intended to be in place through the long term.
In a Probable Maximum Flood the dam will have already overtopped from a smaller 1:100 event as part of its design. In a PMF event, the volume of catchment flows from further up the catchment beyond the site are likely to be having a greater impact at this point in the catchment, in which the contribution of any (unlikely) dam failure would be negligible.
As a result, these factors are likely to contribute to a negligible risk.
16
5.0 WATER CYCLE MANAGEMENT 5.1. Water Balance Methodology and Concept
A daily water balance analysis was used to determine the feasibility of the proposed rain and stormwater harvesting scheme and in particular the effects of various storage sizes for stormwater harvesting along with changes to demand. The water balance utilised flows generated using a simple runoff calculation using historical rainfall data, analysed for various rainfall patterns including dry, mean and wet rainfall years.
The purpose for modelling dry, mean and wet years was to assess the performance of various tank sizes given the changes to rainfall patterns. It is noted that with the potential effects of climate change and the current trend of dry rainfall patterns, the need to consider lower annual rainfalls for rain and stormwater harvesting reuse schemes is becoming more and more necessary. In addition, any excess stormwater produced (especially during wet season periods) need to be considered for the management of on-site surface waters.
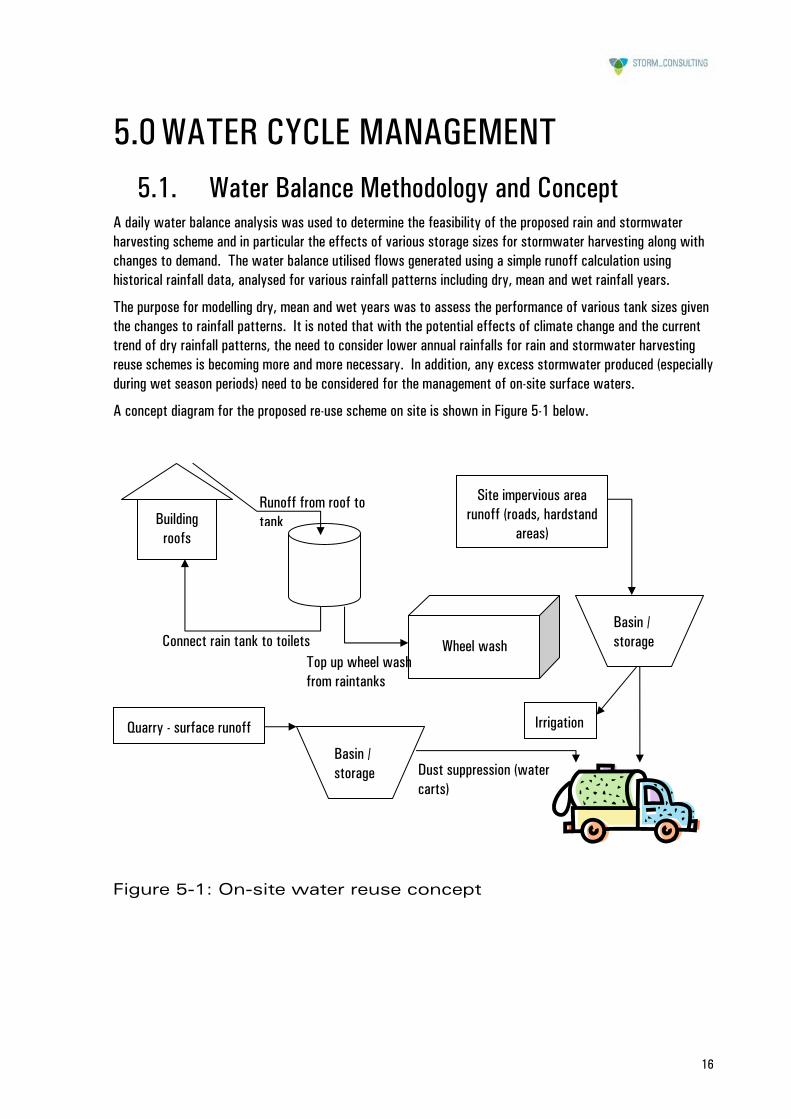
A concept diagram for the proposed re-use scheme on site is shown in Figure 5-1 below.
Figure 5-1: On-site water reuse concept
Building roofs
Runoff from roof to tank
Connect rain tank to toilets Wheel wash Top up wheel wash from raintanks
Site impervious area runoff (roads, hardstand
areas)
Basin / storage
Basin / storage Dust suppression (water
carts)
Irrigation Quarry - surface runoff

17
5.2. Modelling Inputs
5.2.1. Rainfall Data from St Clair (BOM station #67102) was used in this analysis. Seventeen years of daily rainfall data (1985 – 2002) was assessed to determine a dry, median and wet rainfall sequence for use in the water balance model.
The following dry, median and wet year rainfalls were derived, and compared against long term averages for Prospect.
Table 5-1: Rainfall Records
Annual Rainfall (mm)
Modelled average rainfall and years Prospect (long term average)
Dry 553
(1994 / 1995 / 2001/ 2002)
562
Median 851
(1987 / 1989 / 1991)
831
Wet 1104
(1986 / 1987 / 1988 / 1989 / 1990)
1183
Note: median rainfall at St Clair is below Sydney Observatory's average of 1162mm/yr.
5.2.2. Harvestable areas The proposed roof and stormwater reuse scheme can harvest runoff from the operational area catchment, comprising the areas identified in Table 5-2. This is conservative (under-estimates area available) and excludes the proposed green waste area.
Table 5-2: Harvestable Areas
Precinct Area (Ha) Initial loss (mm)
Building roofs 0.6 1
Remaining Site Operational Area 13.1 5
Quarry 26.5 10
5.2.3. Water demands The demands for harvested water for reuse includes toilet flushing, dust suppression, sprinklers (irrigation) and the wheel wash. Estimated water demands used in the water balance model are presented in Table 5-3 below.
18
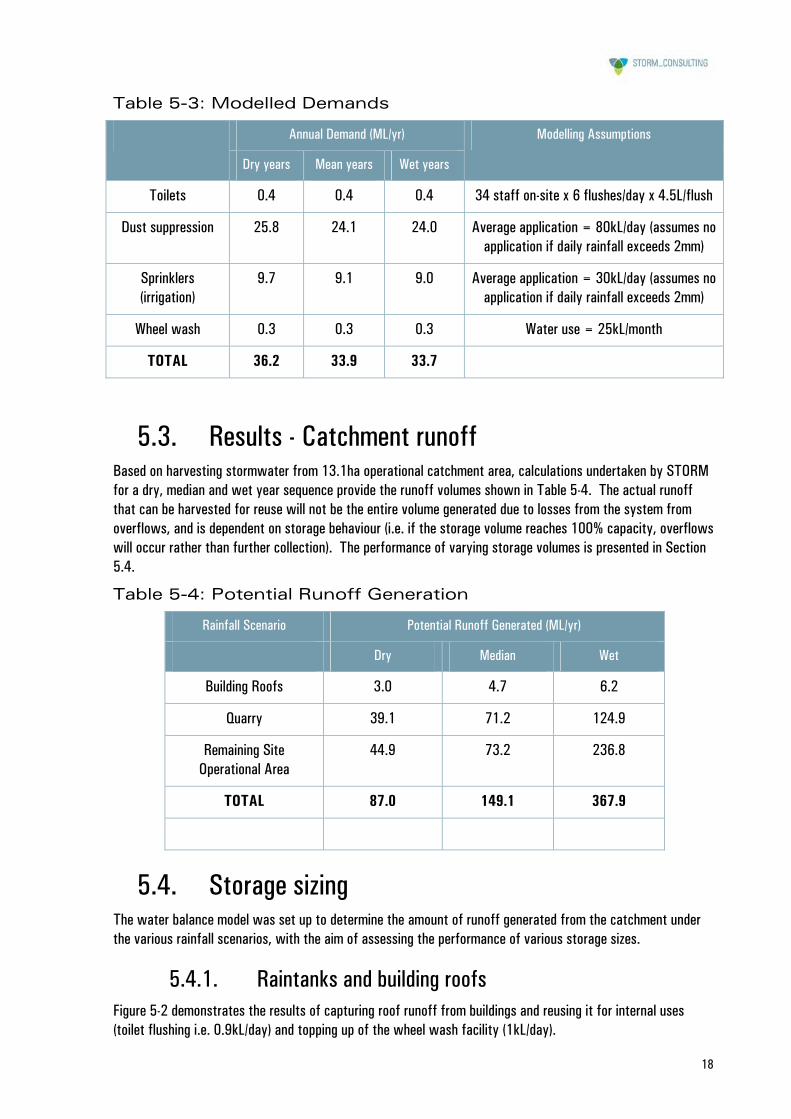
Table 5-3: Modelled Demands
Annual Demand (ML/yr)
Dry years Mean years Wet years
Modelling Assumptions
Toilets 0.4 0.4 0.4 34 staff on-site x 6 flushes/day x 4.5L/flush
Dust suppression 25.8 24.1 24.0 Average application = 80kL/day (assumes no application if daily rainfall exceeds 2mm)
Sprinklers (irrigation)
9.7 9.1 9.0 Average application = 30kL/day (assumes no application if daily rainfall exceeds 2mm)
Wheel wash 0.3 0.3 0.3 Water use = 25kL/month
TOTAL 36.2 33.9 33.7
5.3. Results - Catchment runoff Based on harvesting stormwater from 13.1ha operational catchment area, calculations undertaken by STORM for a dry, median and wet year sequence provide the runoff volumes shown in Table 5-4. The actual runoff that can be harvested for reuse will not be the entire volume generated due to losses from the system from overflows, and is dependent on storage behaviour (i.e. if the storage volume reaches 100% capacity, overflows will occur rather than further collection). The performance of varying storage volumes is presented in Section 5.4.
Table 5-4: Potential Runoff Generation
Rainfall Scenario Potential Runoff Generated (ML/yr)
Dry Median Wet
Building Roofs 3.0 4.7 6.2
Quarry 39.1 71.2 124.9
Remaining Site Operational Area
44.9 73.2 236.8
TOTAL 87.0 149.1 367.9
5.4. Storage sizing The water balance model was set up to determine the amount of runoff generated from the catchment under the various rainfall scenarios, with the aim of assessing the performance of various storage sizes.
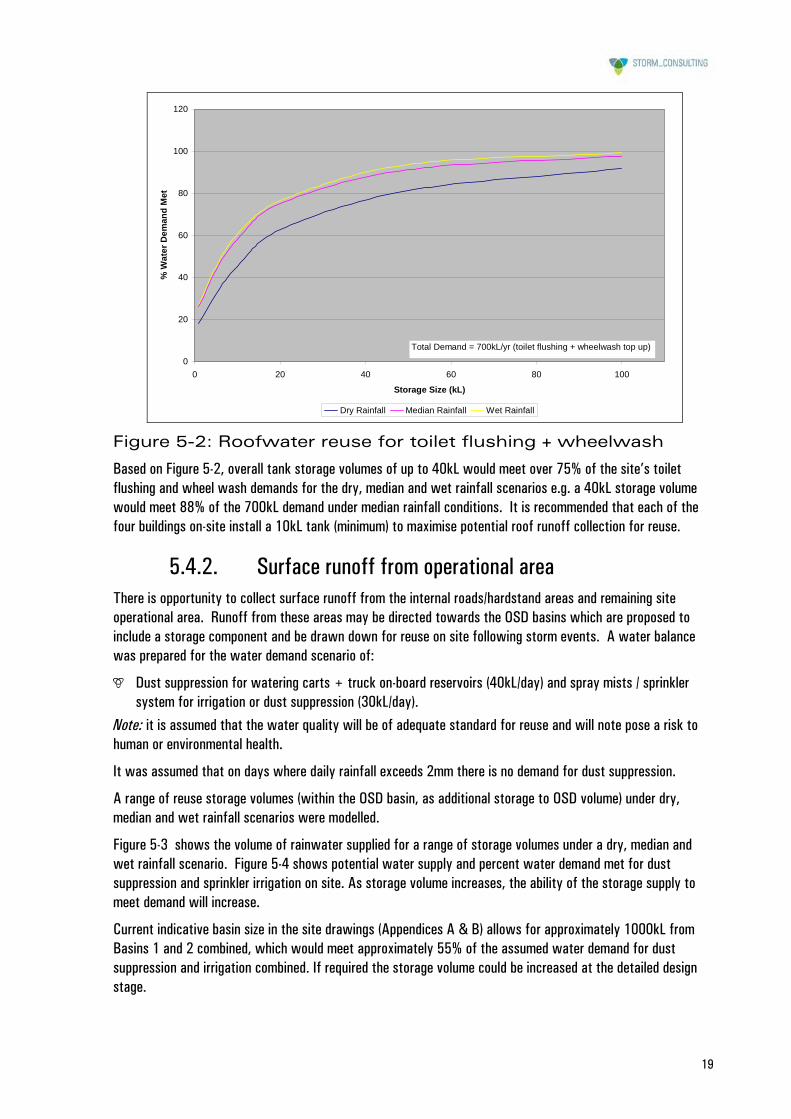
5.4.1. Raintanks and building roofs Figure 5-2 demonstrates the results of capturing roof runoff from buildings and reusing it for internal uses (toilet flushing i.e. 0.9kL/day) and topping up of the wheel wash facility (1kL/day).
19
0
20
40
60
80
100
120
0 20 40 60 80 100
Storage Size (kL)
% W
ater
Dem
and
Met
Dry Rainfall Median Rainfall Wet Rainfall
Total Demand = 700kL/yr (toilet flushing + wheelwash top up)
Figure 5-2: Roofwater reuse for toilet flushing + wheelwash
Based on Figure 5-2, overall tank storage volumes of up to 40kL would meet over 75% of the site’s toilet flushing and wheel wash demands for the dry, median and wet rainfall scenarios e.g. a 40kL storage volume would meet 88% of the 700kL demand under median rainfall conditions. It is recommended that each of the four buildings on-site install a 10kL tank (minimum) to maximise potential roof runoff collection for reuse.
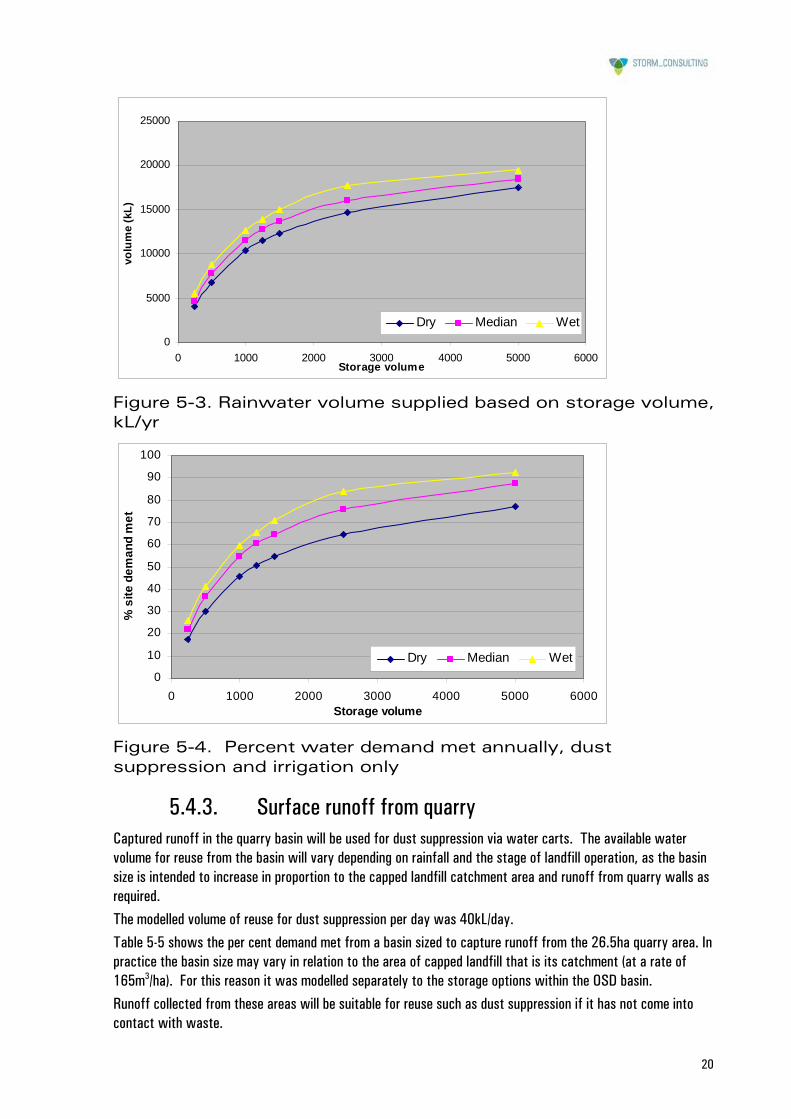
5.4.2. Surface runoff from operational area There is opportunity to collect surface runoff from the internal roads/hardstand areas and remaining site operational area. Runoff from these areas may be directed towards the OSD basins which are proposed to include a storage component and be drawn down for reuse on site following storm events. A water balance was prepared for the water demand scenario of:
Dust suppression for watering carts + truck on-board reservoirs (40kL/day) and spray mists / sprinkler system for irrigation or dust suppression (30kL/day).
Note: it is assumed that the water quality will be of adequate standard for reuse and will note pose a risk to human or environmental health.
It was assumed that on days where daily rainfall exceeds 2mm there is no demand for dust suppression.
A range of reuse storage volumes (within the OSD basin, as additional storage to OSD volume) under dry, median and wet rainfall scenarios were modelled.
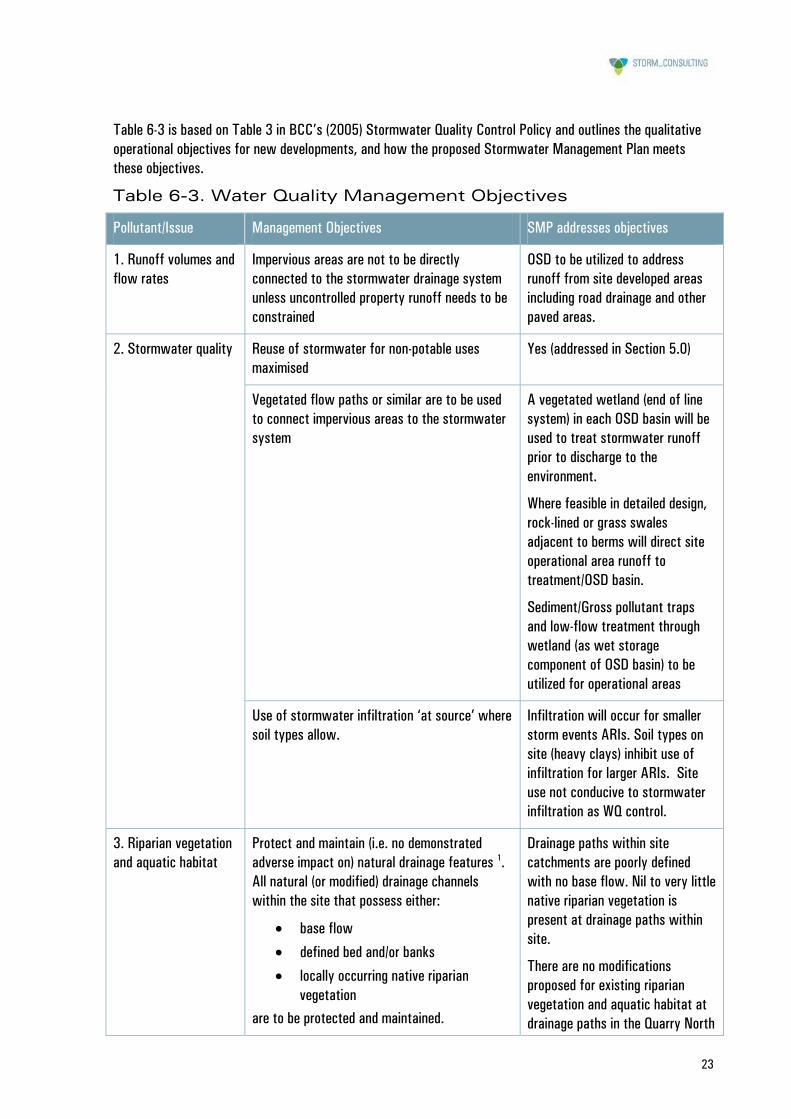
Figure 5-3 shows the volume of rainwater supplied for a range of storage volumes under a dry, median and wet rainfall scenario. Figure 5-4 shows potential water supply and percent water demand met for dust suppression and sprinkler irrigation on site. As storage volume increases, the ability of the storage supply to meet demand will increase.
Current indicative basin size in the site drawings (Appendices A & B) allows for approximately 1000kL from Basins 1 and 2 combined, which would meet approximately 55% of the assumed water demand for dust suppression and irrigation combined. If required the storage volume could be increased at the detailed design stage.
20
0
5000
10000
15000
20000
25000
0 1000 2000 3000 4000 5000 6000Storage volume
volu
me
(kL)
Dry Median Wet
Figure 5-3. Rainwater volume supplied based on storage volume, kL/yr
0
10
20
30
40
50
60
70
80
90
100
0 1000 2000 3000 4000 5000 6000Storage volume
% s
ite d
eman
d m
et
Dry Median Wet
Figure 5-4. Percent water demand met annually, dust suppression and irrigation only
5.4.3. Surface runoff from quarry Captured runoff in the quarry basin will be used for dust suppression via water carts. The available water volume for reuse from the basin will vary depending on rainfall and the stage of landfill operation, as the basin size is intended to increase in proportion to the capped landfill catchment area and runoff from quarry walls as required. The modelled volume of reuse for dust suppression per day was 40kL/day. Table 5-5 shows the per cent demand met from a basin sized to capture runoff from the 26.5ha quarry area. In practice the basin size may vary in relation to the area of capped landfill that is its catchment (at a rate of 165m3/ha). For this reason it was modelled separately to the storage options within the OSD basin. Runoff collected from these areas will be suitable for reuse such as dust suppression if it has not come into contact with waste.

21
Table 5-5. Quarry basin reuse - % demand met
Rainfall scenario Basin (4,362m3)
Total water demand ML/yr % water demand met
Dry 12.97 72%
Median 12.07 87%
Wet 12.13 91%
5.5. Summary of Storage Volumes The following recommended storage volumes are based on the analysis above:
Each building should have its own rainwater tank (min. 10kL volume) to harvest roof water runoff for reuse including toilet flushing and wheel wash top up;
The OSD storage proposed for the operational area is of sufficient volume (min. 370m3/Ha) to contain the 1 in 2 year storm event 1 in 100yr storm event and by use of additional depth in the basin (nominal 0.5m in indicative basin sizes supplied) to act as storage for reuse on-site. It is anticipated that drawdown will occur regularly for dust suppression (water carts and sprinkler) and irrigation.
The proposed sediment basin in the quarry has been sized using the Blue Book (approx. 165m3/Ha) and can be drawn down following storm events for dust suppression (water carts).

22
6.0 WATER QUALITY 6.1. Water Quality Management
The stormwater management controls for the site including water quality management measures are presented in Appendix A.
6.1.1. Pollutant Treatment Priorities Table 1 in BCC’s Stormwater Quality Control Policy (2005) presents treatment priorities for a range of pollutants generated from various land uses. The proposed development is deemed industrial and as such the pollutant treatment priorities are identified in Table 6-1, based on Table 1 in the Policy. The Policy also states that for developments on sites greater than 5Ha, the pollution treatment methods selected must treat all pollutants cited with emphasis on the first three priority pollutants.
Table 6-1 Pollutant Treatment Priorities for Industrial Areas
Development Type
Litter (Gross Pollutants)
Coarse Sediment
Nutrients Fine Sediment Hydrocarbons, Motor Spirit, Oil
& Grease
Industrial 3 4 5 1 2
Table 6-2 outlines the pollutant retention criteria for development sites, based on Table 2 in BCC’s (2005) Stormwater Quality Control Policy. MUSIC modelling (refer to Section 6.2) was undertaken to assess the effectiveness of the proposed treatment system based on the information in this table.
Table 6-2 Pollutant Retention Criteria
Pollutant Description Retention Criteria for Development Sites
Fine Sediment Contaminant particles 0.1mm diameter or less 50% of the total annual load
Hydrocarbons, Motor Spirit, Oil & Grease
Whichever is greater:
1. 90% of the total annual load; or
2. Total discharge from site of TPH 1 <10mg/L at all times.
Litter (gross pollutants) Trash litter and vegetation larger than 5mm 90% of the total annual load
Coarse sediment Contaminant particles between 0.1mm and 5mm diameter
80% of the total annual load
Nutrients Total phosphorus and total nitrogen 45% of the total annual load for each nutrient
Notes: 1. TPH – Total petroleum hydrocarbons
23
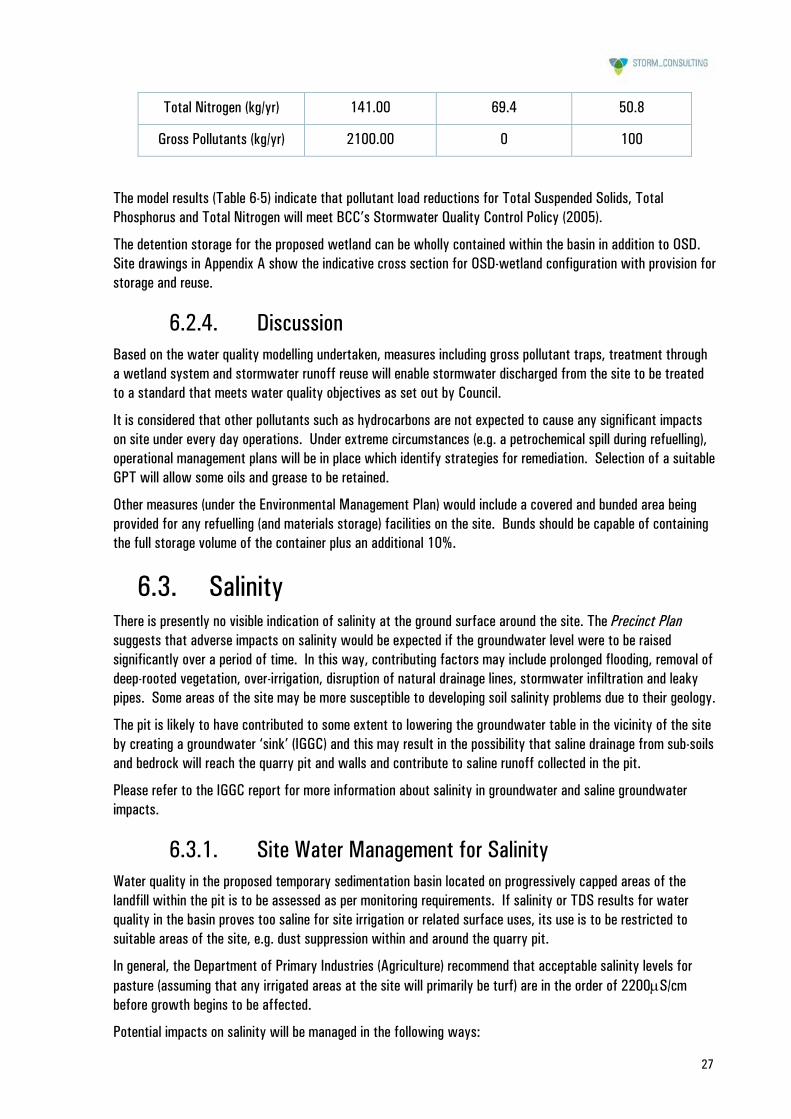
Table 6-3 is based on Table 3 in BCC’s (2005) Stormwater Quality Control Policy and outlines the qualitative operational objectives for new developments, and how the proposed Stormwater Management Plan meets these objectives.
Table 6-3. Water Quality Management Objectives
Pollutant/Issue Management Objectives SMP addresses objectives
1. Runoff volumes and flow rates
Impervious areas are not to be directly connected to the stormwater drainage system unless uncontrolled property runoff needs to be constrained
OSD to be utilized to address runoff from site developed areas including road drainage and other paved areas.
2. Stormwater quality Reuse of stormwater for non-potable uses maximised
Yes (addressed in Section 5.0)
Vegetated flow paths or similar are to be used to connect impervious areas to the stormwater system
A vegetated wetland (end of line system) in each OSD basin will be used to treat stormwater runoff prior to discharge to the environment.
Where feasible in detailed design, rock-lined or grass swales adjacent to berms will direct site operational area runoff to treatment/OSD basin.
Sediment/Gross pollutant traps and low-flow treatment through wetland (as wet storage component of OSD basin) to be utilized for operational areas
Use of stormwater infiltration ‘at source’ where soil types allow.
Infiltration will occur for smaller storm events ARIs. Soil types on site (heavy clays) inhibit use of infiltration for larger ARIs. Site use not conducive to stormwater infiltration as WQ control.
3. Riparian vegetation and aquatic habitat
Protect and maintain (i.e. no demonstrated adverse impact on) natural drainage features 1. All natural (or modified) drainage channels within the site that possess either:
• base flow
• defined bed and/or banks
• locally occurring native riparian vegetation
are to be protected and maintained.
Drainage paths within site catchments are poorly defined with no base flow. Nil to very little native riparian vegetation is present at drainage paths within site.
There are no modifications proposed for existing riparian vegetation and aquatic habitat at drainage paths in the Quarry North

24
6.1.2. Maintenance and Monitoring The developer will be responsible for the maintenance of the proposed stormwater controls. A maintenance plan will be developed during the detailed design phase. In general, the maintenance plan should allow for:
Regular visual inspection of the stormwater treatment measures, for example on a monthly basis and after rain events;
OSD Basin and GPT cleaning program – more frequently as site settles from development and then based on results of regular visual inspections. Cleaning generally to consist of:
Sediment and weed removal from the OSD basin and its associated sediment control/stilling basin, and checking integrity of in-pit stormwater basin, plus sediment removal
‘Natural channel designs’ should be adopted in lieu of floodways in areas in areas where there is no natural (or unmodified) channel.
and Quarry site catchments
4. Flow Natural flow paths, discharge points and runoff volumes from the site should not be altered.
Frequency of bank-full flows should not increase as a result of development. Generally, no increase in the 2-yr and 100-yr ARI peak flows.
Key discharge points for site are to be maintained or will remain unaffected by site development.
OSD is proposed to maintain peak discharges at pre-development levels. Staged discharge modelling undertaken for 2yr &100 yr events
5. Amenity Multiple uses of stormwater facilities to the degree compatible with other management objectives.
OSD aligns with requirements for onsite detention in Eastern Creek Precinct. Site OSD needs could be integrated with regional detention basin in future following assessment.
No clashes with other management objectives
Stormwater harvesting and reuse to reduce potable water demands and peak runoff volumes.
6. Natural bushland No demonstrated adverse impact from stormwater into urban bushland area.
No stormwater to be directed to new discharge points including bushland areas. Stormwater from site operational areas is directed through sediment trap, wetland and OSD prior to release at existing discharge points.
Notes: 1. Wetlands, watercourses and riparian corridors.

25
(Optional) water sampling of OSD basin and in-pit stormwater collection basin, e.g. on a quarterly basis for the first year of the basin’s operation as each basin is developed, then 6-monthly in following years, to ensure reused/released water is of suitable quality for end-use, e.g. in irrigation equipment (if necessary can refer to ANZECC guidelines and relevant NSW guidance;
A maintenance and monitoring check-sheet should be developed that allows for the data entry, location of stormwater management device on site (e.g. based on a map with numbered locations), type of inspection (visual, water sampling, etc), outcome (e.g. all clear, device needs cleaning), actions taken, and any follow up required.
Site salinity management with reference to water collected within the quarry pit is addressed in Section 6.3.
The quality of the water released (if any) should be in accordance with the site’s Environment Protection Licence. Typically the licence will only permit discharge once the water in storage has been tested to ensure it complies with specified water quality standards for discharge. Sampling requirements may include total suspended solids (TSS), Electrical conductivity, Turbidity, Ammonia, Biochemical Oxygen Demand (BOD), Total Nitrogen and Total Phosphorus.
6.2. MUSIC modelling
6.2.1. Methodology The MUSIC model was chosen to model water quality. This model has been released by the Cooperative Research Centre for Catchment Hydrology (CRCCH) and is a standard industry model for this purpose. MUSIC (the Model for Urban Stormwater Improvement Conceptualisation) is suitable for simulating catchment areas of up to 100 km2 and utilises a continuous simulation approach to model water quality.
By simulating the performance of stormwater management systems, MUSIC can be used to determine if these proposed systems and changes to land use are appropriate for their catchments and are capable of meeting specified water quality objectives (CRC 2002). The water quality constituents modelled in MUSIC and of relevance to this report include Total Suspended Solids (TSS), Total Phosphorus (TP) and Total Nitrogen (TN).
Only the site operational area and quarry area were modelled as these undergo the greatest change in land use. The post-development model was used to compare the pollutant loads generated from the proposed development with, and without treatment controls.
The pollutant retention criteria set out in BCC’s Stormwater Policy were used as a basis for assessing the effectiveness of the selected treatment trains.
The layout of the MUSIC model is presented in Appendix D.
6.2.2. Assumptions Rainfall
Rainfall data was obtained from the Bureau of Meteorology (BOM) for Prospect Dam (BOM station #67109) the closest station to the site with continuous rainfall data. Meteorological data from 1984 - 2004 (slightly above average rainfall conditions) was used in the model in an attempt to replicate climatic conditions typical of the site.

26
The MUSIC User Manual (CRCCH, 2004) suggests that the time-step should not be greater than the time of concentration of the smallest sub catchment, but consideration should also be given to the smallest detention time of treatment nodes in the system. To accurately model the performance of the treatment nodes, a daily time step was chosen.
Soil Properties
Various parameters are required to be entered in MUSIC regarding soil properties. The soil profile of the existing site is fairly uniform and soil parameters were set to default Sydney values throughout the modelling.
Event Mean Concentrations
The default MUSIC Event Mean Concentration (EMC) values have been adjusted to reflect more recent data available by Duncan (2004) for specific land uses such as roads, roofs and urban areas. The parameter concentrations adopted are shown in Table 6-4.
Table 6-4: MUSIC Modelling EMCs
EMC (mg/L) Land Use1
TSS TP TN
Roofs 20 0.13 2
Other site areas 270 0.5 2.2
1 Fletcher, T., Duncan, H., Poelsma, P. & Lloyd, S. (CRC, 2004)
Proposed Treatment Method
Treatment measures modelled include gross pollutant traps, treatment through a wetland system and inclusion of stormwater runoff reuse.
6.2.3. Results The results of the post-development model are shown in Table 6-5. The reduction rate is expressed as a percentage and compares the post-development pollutant loads without treatment versus post-development loads with treatment. When a positive reduction percentage is achieved there is a net decrease in pollutant loads as a result of development. The development can then be considered to have a beneficial effect. However, if a negative reduction percentage occurs then there is an increase in pollutant loads in that particular post-development scenario.
Table 6-5: Flow and Pollutant Load Reductions
Parameter A
Post-Development Results (without
treatment controls)
B
Post-Development Results
(with treatment controls)
Reduction %
(A-B)/A
Flow (ML/yr) 64.80 42.7 34.1
Total Suspended Solids (kg/yr)
15600.00 770 95.1
Total Phosphorus (kg/yr) 29.70 6.33 78.7
27
Total Nitrogen (kg/yr) 141.00 69.4 50.8
Gross Pollutants (kg/yr) 2100.00 0 100
The model results (Table 6-5) indicate that pollutant load reductions for Total Suspended Solids, Total Phosphorus and Total Nitrogen will meet BCC’s Stormwater Quality Control Policy (2005).
The detention storage for the proposed wetland can be wholly contained within the basin in addition to OSD. Site drawings in Appendix A show the indicative cross section for OSD-wetland configuration with provision for storage and reuse.
6.2.4. Discussion Based on the water quality modelling undertaken, measures including gross pollutant traps, treatment through a wetland system and stormwater runoff reuse will enable stormwater discharged from the site to be treated to a standard that meets water quality objectives as set out by Council.
It is considered that other pollutants such as hydrocarbons are not expected to cause any significant impacts on site under every day operations. Under extreme circumstances (e.g. a petrochemical spill during refuelling), operational management plans will be in place which identify strategies for remediation. Selection of a suitable GPT will allow some oils and grease to be retained.
Other measures (under the Environmental Management Plan) would include a covered and bunded area being provided for any refuelling (and materials storage) facilities on the site. Bunds should be capable of containing the full storage volume of the container plus an additional 10%.
6.3. Salinity There is presently no visible indication of salinity at the ground surface around the site. The Precinct Plan suggests that adverse impacts on salinity would be expected if the groundwater level were to be raised significantly over a period of time. In this way, contributing factors may include prolonged flooding, removal of deep-rooted vegetation, over-irrigation, disruption of natural drainage lines, stormwater infiltration and leaky pipes. Some areas of the site may be more susceptible to developing soil salinity problems due to their geology.
The pit is likely to have contributed to some extent to lowering the groundwater table in the vicinity of the site by creating a groundwater ‘sink’ (IGGC) and this may result in the possibility that saline drainage from sub-soils and bedrock will reach the quarry pit and walls and contribute to saline runoff collected in the pit.
Please refer to the IGGC report for more information about salinity in groundwater and saline groundwater impacts.
6.3.1. Site Water Management for Salinity Water quality in the proposed temporary sedimentation basin located on progressively capped areas of the landfill within the pit is to be assessed as per monitoring requirements. If salinity or TDS results for water quality in the basin proves too saline for site irrigation or related surface uses, its use is to be restricted to suitable areas of the site, e.g. dust suppression within and around the quarry pit.
In general, the Department of Primary Industries (Agriculture) recommend that acceptable salinity levels for pasture (assuming that any irrigated areas at the site will primarily be turf) are in the order of 2200µS/cm before growth begins to be affected.
Potential impacts on salinity will be managed in the following ways:

28
Modifications to existing site vegetation are kept to a minimum. Most site development is to occur on existing disturbed or cleared areas adjacent to the quarry pit;
Minimise additions to groundwater table by avoiding waterlogged areas and over-irrigation; and The proposed OSD basin serving the proposed development, at a depth of approximately 3m below existing
ground surface, is not likely to intercept potentially saline groundwater.
29
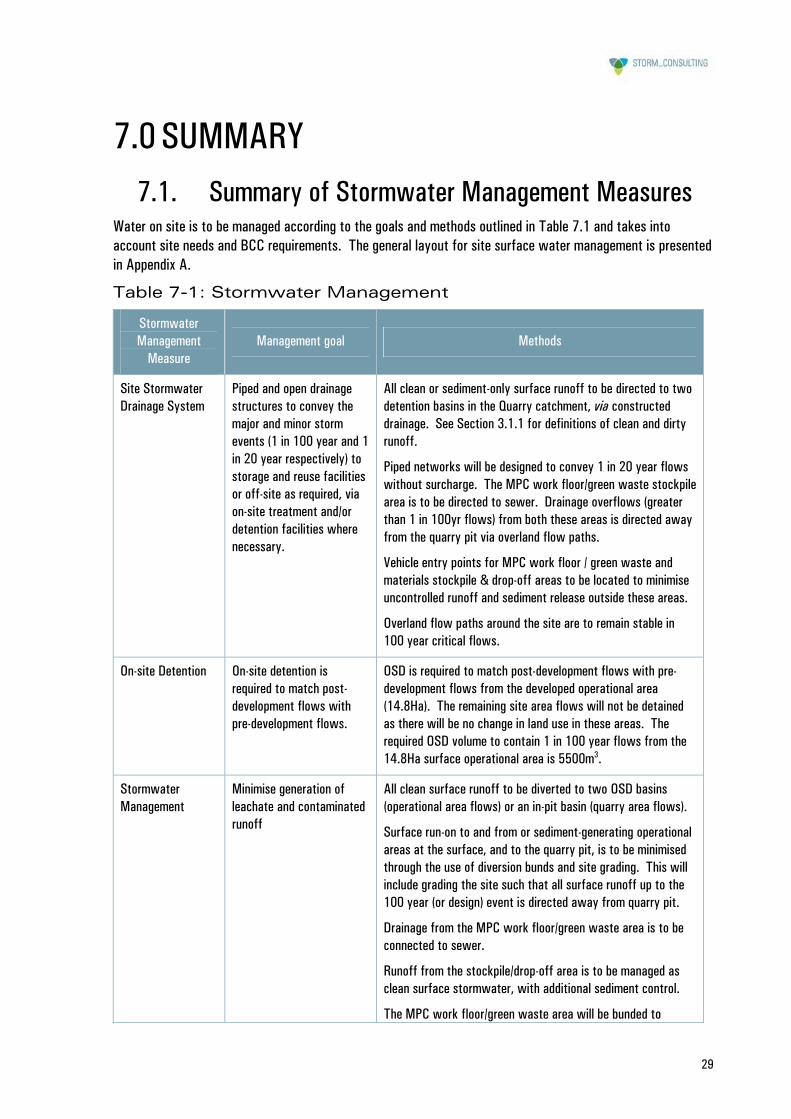
7.0 SUMMARY 7.1. Summary of Stormwater Management Measures
Water on site is to be managed according to the goals and methods outlined in Table 7.1 and takes into account site needs and BCC requirements. The general layout for site surface water management is presented in Appendix A.
Table 7-1: Stormwater Management
Stormwater Management
Measure Management goal Methods
Site Stormwater Drainage System
Piped and open drainage structures to convey the major and minor storm events (1 in 100 year and 1 in 20 year respectively) to storage and reuse facilities or off-site as required, via on-site treatment and/or detention facilities where necessary.
All clean or sediment-only surface runoff to be directed to two detention basins in the Quarry catchment, via constructed drainage. See Section 3.1.1 for definitions of clean and dirty runoff.
Piped networks will be designed to convey 1 in 20 year flows without surcharge. The MPC work floor/green waste stockpile area is to be directed to sewer. Drainage overflows (greater than 1 in 100yr flows) from both these areas is directed away from the quarry pit via overland flow paths.
Vehicle entry points for MPC work floor / green waste and materials stockpile & drop-off areas to be located to minimise uncontrolled runoff and sediment release outside these areas.
Overland flow paths around the site are to remain stable in 100 year critical flows.
On-site Detention On-site detention is required to match post-development flows with pre-development flows.
OSD is required to match post-development flows with pre-development flows from the developed operational area (14.8Ha). The remaining site area flows will not be detained as there will be no change in land use in these areas. The required OSD volume to contain 1 in 100 year flows from the 14.8Ha surface operational area is 5500m3.
Stormwater Management
Minimise generation of leachate and contaminated runoff
All clean surface runoff to be diverted to two OSD basins (operational area flows) or an in-pit basin (quarry area flows).
Surface run-on to and from or sediment-generating operational areas at the surface, and to the quarry pit, is to be minimised through the use of diversion bunds and site grading. This will include grading the site such that all surface runoff up to the 100 year (or design) event is directed away from quarry pit.
Drainage from the MPC work floor/green waste area is to be connected to sewer.
Runoff from the stockpile/drop-off area is to be managed as clean surface stormwater, with additional sediment control.
The MPC work floor/green waste area will be bunded to
30
prevent stormwater entering the area.
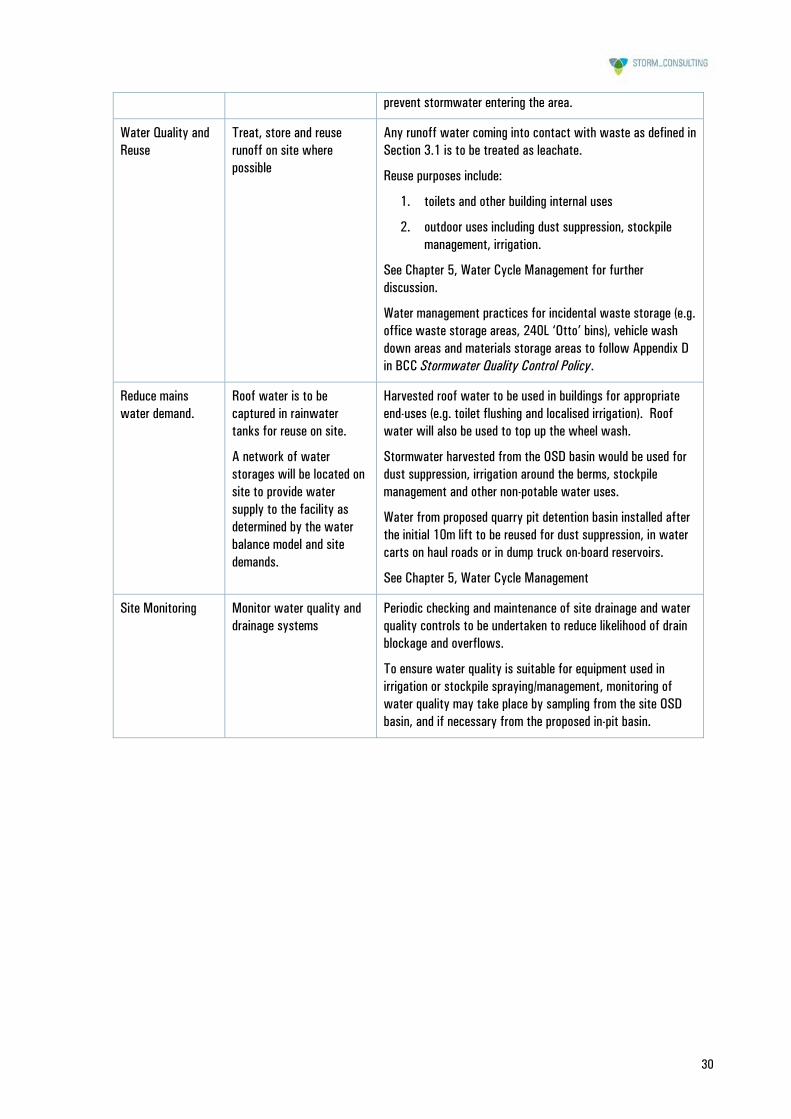
Water Quality and Reuse
Treat, store and reuse runoff on site where possible
Any runoff water coming into contact with waste as defined in Section 3.1 is to be treated as leachate.
Reuse purposes include:
1. toilets and other building internal uses
2. outdoor uses including dust suppression, stockpile management, irrigation.
See Chapter 5, Water Cycle Management for further discussion.
Water management practices for incidental waste storage (e.g. office waste storage areas, 240L ‘Otto’ bins), vehicle wash down areas and materials storage areas to follow Appendix D in BCC Stormwater Quality Control Policy.
Reduce mains water demand.
Roof water is to be captured in rainwater tanks for reuse on site.
A network of water storages will be located on site to provide water supply to the facility as determined by the water balance model and site demands.
Harvested roof water to be used in buildings for appropriate end-uses (e.g. toilet flushing and localised irrigation). Roof water will also be used to top up the wheel wash.
Stormwater harvested from the OSD basin would be used for dust suppression, irrigation around the berms, stockpile management and other non-potable water uses.
Water from proposed quarry pit detention basin installed after the initial 10m lift to be reused for dust suppression, in water carts on haul roads or in dump truck on-board reservoirs.
See Chapter 5, Water Cycle Management
Site Monitoring Monitor water quality and drainage systems
Periodic checking and maintenance of site drainage and water quality controls to be undertaken to reduce likelihood of drain blockage and overflows.
To ensure water quality is suitable for equipment used in irrigation or stockpile spraying/management, monitoring of water quality may take place by sampling from the site OSD basin, and if necessary from the proposed in-pit basin.
31
8.0 REFERENCES
Blacktown City Council (2005) Eastern Creek Precinct Plan – Stage 3 Blacktown City Council (2005) Engineering Guide for Development Blacktown City Council (2005) Stormwater Quality Control Policy P01100 Institution of Engineers (2000) Australian Rainfall and Runoff Landcom (2004) Managing Urban Stormwater: Soils and Construction Volume 1, 4th Edition NSW DECC (2007) Managing Urban Stormwater: Soils and Construction Volume 2B – Waste Landfills
(currently available as a draft for consultation only) SMEC (2004) SEPP59 Landholder Group Eastern Creek Precinct Plan Stormwater Management Strategy

APPENDIX A Surface Water Management Plan


APPENDIX B Blue Book calculations
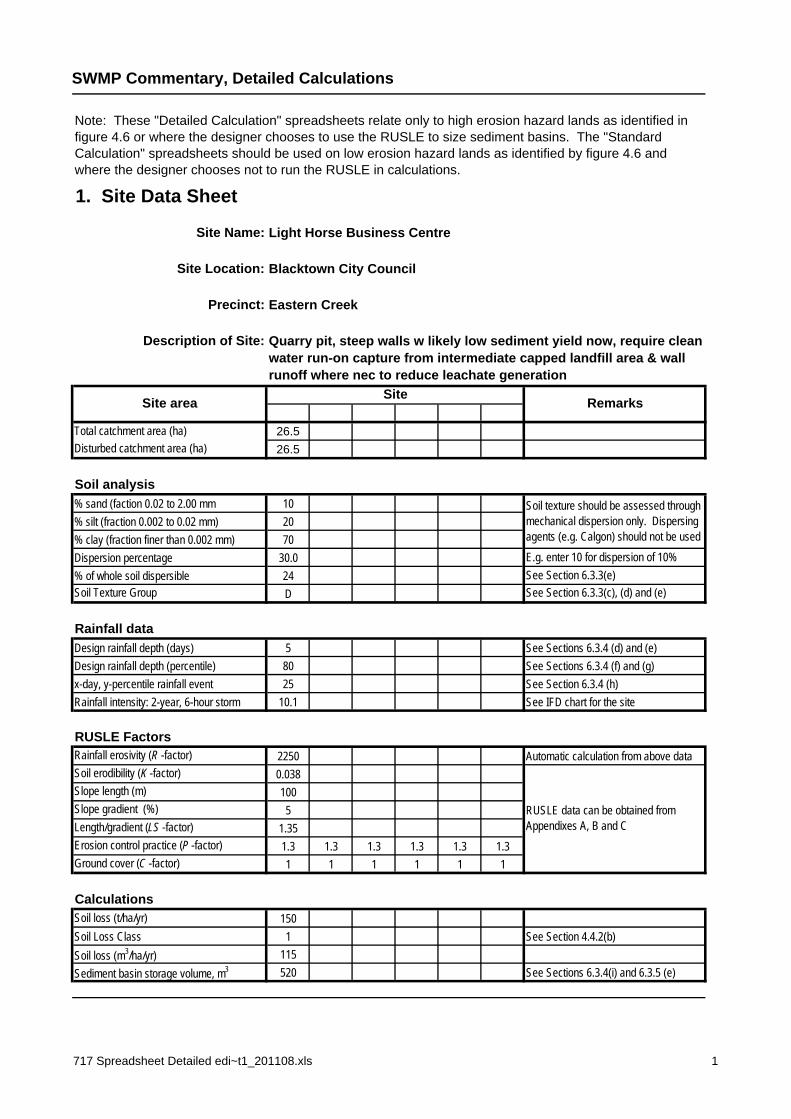
SWMP Commentary, Detailed Calculations
26.526.5
% sand (faction 0.02 to 2.00 mm 10% silt (fraction 0.002 to 0.02 mm) 20% clay (fraction finer than 0.002 mm) 70Dispersion percentage 30.0% of whole soil dispersible 24
D
Design rainfall depth (days) 5 See Sections 6.3.4 (d) and (e)Design rainfall depth (percentile) 80 See Sections 6.3.4 (f) and (g)x-day, y-percentile rainfall event 25 See Section 6.3.4 (h)Rainfall intensity: 2-year, 6-hour storm 10.1 See IFD chart for the site
Rainfall erosivity (R -factor) 2250 Automatic calculation from above data0.0381005
1.351.3 1.3 1.3 1.3 1.3 1.31 1 1 1 1 1
150Soil Loss Class 1 See Section 4.4.2(b)Soil loss (m3/ha/yr) 115Sediment basin storage volume, m3 520 See Sections 6.3.4(i) and 6.3.5 (e)
Note: These "Detailed Calculation" spreadsheets relate only to high erosion hazard lands as identified in figure 4.6 or where the designer chooses to use the RUSLE to size sediment basins. The "Standard Calculation" spreadsheets should be used on low erosion hazard lands as identified by figure 4.6 and where the designer chooses not to run the RUSLE in calculations.
1. Site Data Sheet
Light Horse Business CentreSite Name:
Blacktown City Council
Eastern Creek
Quarry pit, steep walls w likely low sediment yield now, require clean water run-on capture from intermediate capped landfill area & wall runoff where nec to reduce leachate generation
Description of Site:
Site Location:
Precinct:
Soil texture should be assessed through mechanical dispersion only. Dispersing agents (e.g. Calgon) should not be used
RemarksSiteSite area
Total catchment area (ha)
RUSLE Factors
Rainfall data
E.g. enter 10 for dispersion of 10%See Section 6.3.3(e)See Section 6.3.3(c), (d) and (e)Soil Texture Group
Disturbed catchment area (ha)
Soil analysis
Soil loss (t/ha/yr)
Length/gradient (LS -factor)Erosion control practice (P -factor)Ground cover (C -factor)
RUSLE data can be obtained from Appendixes A, B and C
Calculations
Slope length (m)Slope gradient (%)
Soil erodibility (K -factor)
717 Spreadsheet Detailed edi~t1_201108.xls 1

SWMP Commentary, Detailed Calculations
Peak flow is given by the Rational Formula:
where: Qy is peak flow rate (m3/sec) of average recurrence interval (ARI) of "Y" yearsC10
Fy
A is the catchment area in hectares (ha)Iy, tc is the average rainfall intensity (mm/hr) for an ARI of "Y" years
and a design duration of "tc" (minutes or hours)
Peak flow calculations, 1
1 yr,tc 5 yr,tc 10 yr,tc 20 yr,tc 50 yr,tc 100 yr,tc
26.5 28 36.2 60 68 78 91 101 0.85
5
(m3/s) (m3/s) (m3/s) (m3/s) (m3/s) (m3/s)1 yr,tc 0.8 1.8135 yr,tc 0.95 3.56910 yr,tc 1 4.25820 yr,tc 1.05 5.12950 yr,tc 1.15 6.553
100 yr,tc 1.2 7.589
Time of concentration (tc) =
2. Storm Flow Calculations
is the runoff coefficient (dimensionless) for ARI of 10 years. Rural runoff coefficients are given in Volume 2, figure 5 of Pilgrim (1998), while urban runoff coefficients are given in Volume 1, Book VIII, figure 1.13 of Pilgrim (1998) and construction runoff coefficients are given in Appendix Fis a frequency factor for "Y" years. Rural values are given in Volume 1, Book IV, Table 1.1 of Pilgrim (1998) while urban coefficients are given in Volume 1, Book VIII, Table 1.6 of Pilgrim (1998)
0.76 x (A/100)0.38 hrs (Volume 1, Book IV of Pilgrim, 1998)
0.00278 x C10 x FY x Iy, tc x A
Note: For urban catchments the time of concentration should be determined by more precise calculations or reduced by a factor of 50 per cent.
Site A(ha)
tc(mins)
Rainfall intensity, I, mm/hrC10
Qy =
Peak flow calculations, 2
ARI(yrs)
Frequencyfactor(Fy)
Peak flows
Comment
Page D-11 BCC eng guideliens for development
717 Spreadsheet Detailed edi~t1_201108.xls 1

SWMP Commentary, Detailed Calculations
where:
10 = a unit conversion factor
Cv =
A =
x
0.58 25 26.5 3842.5 520 4362.5
4. Volume of Sediment Basins, Type D and Type F Soils
settling zone volume + sediment storage zone volumeBasin volume =
Settling Zone VolumeThe settling zone volume for Type F and Type D soils is calculated to provide capacity to contain all runoff expected from up to the y-percentile rainfall event. The volume of the basin's settling zone (V) can be determined as a function of the basin's surface area and depth to allow for particles to settle and can be determined by the following equation:
10 x Cv x A x Rx-day, y-%ile (m3)V =
2 months soil loss calculated by RUSLE
the volumetric runoff coefficient defined as that portion of rainfall that runs off as stormwater over the x-day period
is the x-day total rainfall depth (mm) that is not exceeded in y percent of rainfall events. (See Sections 6.3.4(d), (e), (f), (g) and (h)).
total catchment area (ha)
Sediment Storage Zone Volume
Rx-day, y-%ile =
In the detailed calculation on Soil Loss Classes 1 to 4 lands, the sediment storage zone can be taken as 50 percent of the settling zone capacity. Alternately designers can design the zone to store the 2-month soil loss as calculated by the RUSLE (Section 6.3.4(i)(ii)). However, on Soil Loss Classes 5, 6 and 7 lands, the zone must contain the 2-month soil loss as calculated by the RUSLE (Section 6.3.4(i)(iii).
Place an "X" in the box below to show the sediment storage zone design parameters used here50% of settling zone capacity,
Total Basin VolumeSettling
zonevolume
(m3)
Sedimentstoragevolume
(m3)
Totalbasin
volume(m3)
Site Cv Rx-day, y-%ile
Totalcatchment
area(ha)
717 Spreadsheet Detailed edi~t1_201108.xls 1

APPENDIX C Model outcomes – RAFTS

link3
link5link6
link7
link8link14link15link16
link19
link2
link4
link1link10
link11
preoutlet
basin nth
outlet nth
QN2
QW3
QN1QW1
QW2
QN2+QW2pre dummy2
basin sth
node6
QW3predev
outlet sth
node1
link3
link5link6
link7
link8link14link15link16
link19
link2
link4
link1link10
link11
preoutlet
basin nth
outlet nth
QN2
QW3
QN1QW1
QW2
QN2+QW2pre dummy2
basin sth
node6
QW3predev
outlet sth
node1
link3
link5link6
link7
link8link14link15link16
link19
link2
link4
link1link10
link11
preoutlet
basin nth
outlet nth
QN2
QW3
QN1QW1
QW2
QN2+QW2pre dummy2
basin sth
node6
QW3predev
outlet sth
node1
link3
link5link6
link7
link8link14link15link16
link19
link2
link4
link1link10
link11
preoutlet
basin nth
outlet nth
QN2
QW3
QN1QW1
QW2
QN2+QW2pre dummy2
basin sth
node6
QW3predev
outlet sth
node1
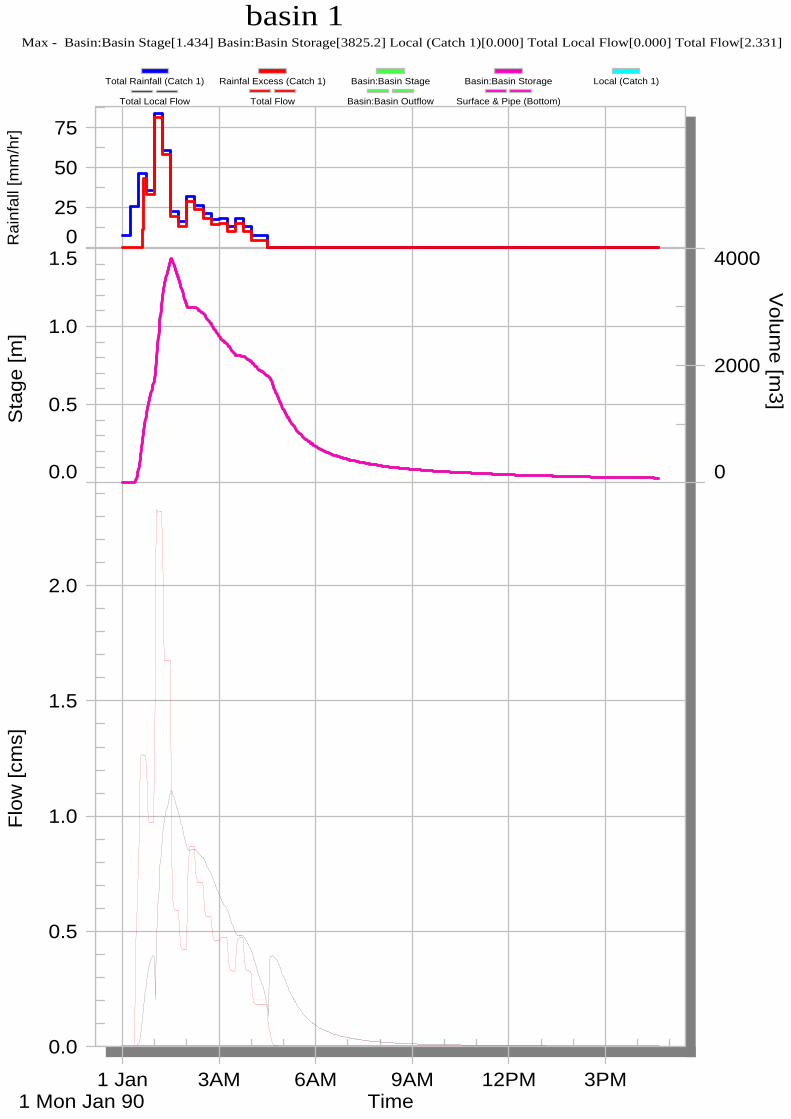
025
50
75
0.0
0.5
1.0
1.5
0
2000
4000
0.0
0.5
1.0
1.5
2.0
1 Jan1 Mon Jan 90
3AM 6AM 9AM 12PM 3PM
basin 1Max - Basin:Basin Stage[1.434] Basin:Basin Storage[3825.2] Local (Catch 1)[0.000] Total Local Flow[0.000] Total Flow[2.331]
Rai
nfal
l [m
m/h
r]S
tage
[m]
Volum
e [m3]
Flow
[cm
s]
Time
Total Rainfall (Catch 1) Rainfal Excess (Catch 1) Basin:Basin Stage Basin:Basin Storage Local (Catch 1)
Total Local Flow Total Flow Basin:Basin Outflow Surface & Pipe (Bottom)

050
100
150
0.0
0.5
1.0
0
500
1000
1500
0.0
0.5
1.0
1.5
2.0
1 Jan1 Mon Jan 90
3AM 6AM 9AM 12PM 3PM
basin 2 Max - Basin:Basin Stage[1.186] Basin:Basin Storage[1580.7] Local (Catch 1)[0.000] Total Local Flow[0.000] Total Flow[2.205]
Rai
nfal
l [m
m/h
r]S
tage
[m]
Volum
e [m3]
Flow
[cm
s]
Time
Total Rainfall (Catch 1) Rainfal Excess (Catch 1) Basin:Basin Stage Basin:Basin Storage Local (Catch 1)
Total Local Flow Total Flow Basin:Basin Outflow Surface & Pipe (Bottom)
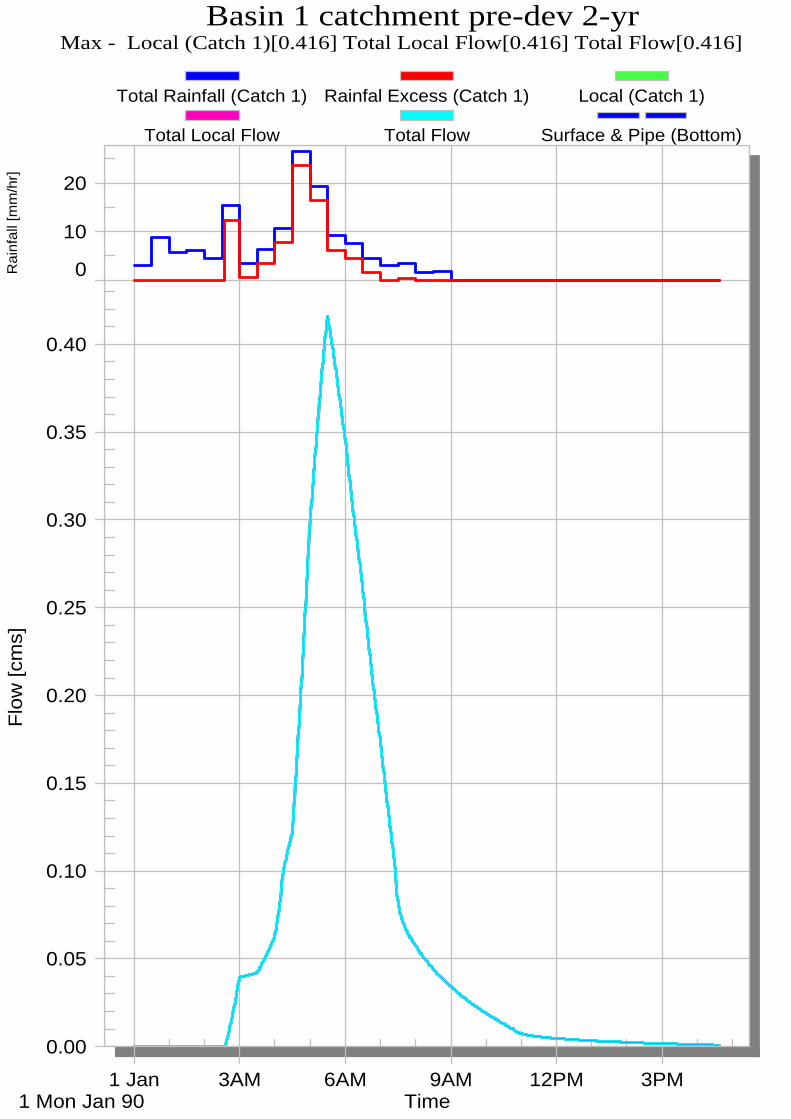
0
10
20
0.00
0.05
0.10
0.15
0.20
0.25
0.30
0.35
0.40
1 Jan1 Mon Jan 90
3AM 6AM 9AM 12PM 3PM
Basin 1 catchment pre-dev 2-yrMax - Local (Catch 1)[0.416] Total Local Flow[0.416] Total Flow[0.416]
Rai
nfal
l [m
m/h
r]Fl
ow [c
ms]
Time
Total Rainfall (Catch 1) Rainfal Excess (Catch 1) Local (Catch 1)
Total Local Flow Total Flow Surface & Pipe (Bottom)

0
10
20
0.00
0.05
0.10
0.15
0.20
0.25
0.30
0.35
0.40
1 Jan1 Mon Jan 90
3AM 6AM 9AM 12PM 3PMBasin
Basin 1 catchment postdev 2-yrMax - Local (Catch 1)[0.000] Total Local Flow[0.000] Total Flow[0.403]
Rai
nfal
l [m
m/h
r]Fl
ow [c
ms]
Time
Total Rainfall (Catch 1) Rainfal Excess (Catch 1) Local (Catch 1)
Total Local Flow Total Flow Surface & Pipe (Bottom)
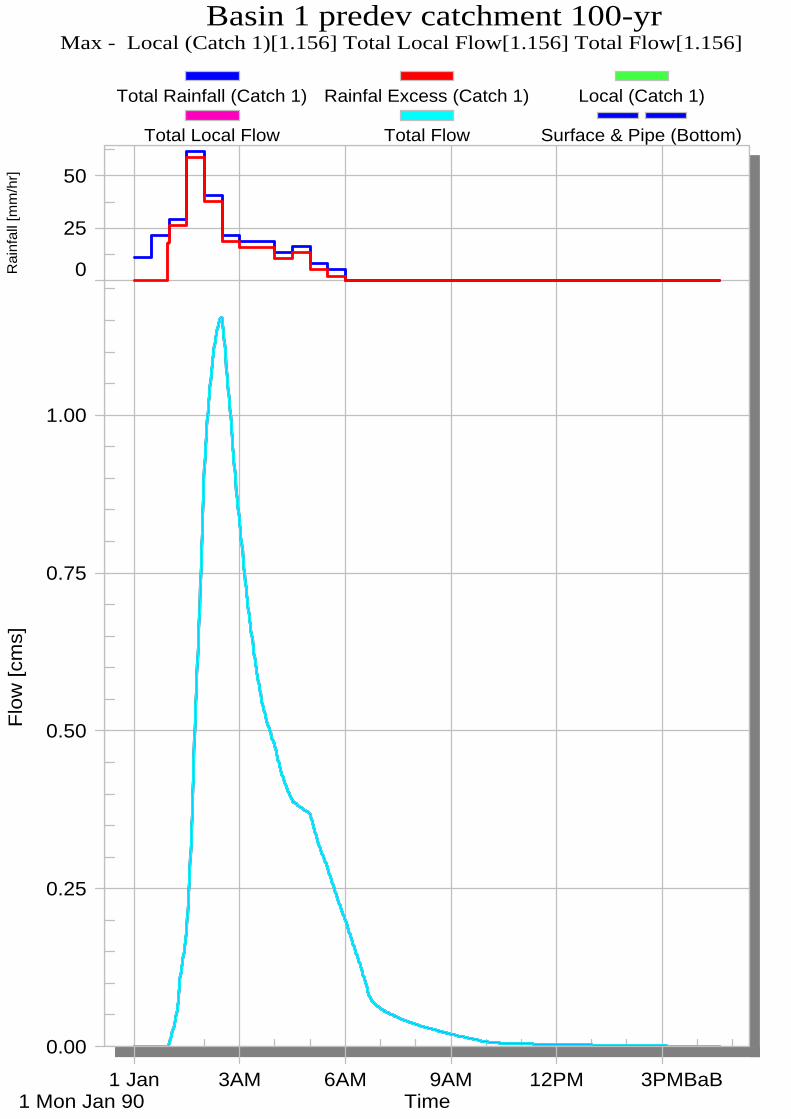
0
25
50
0.00
0.25
0.50
0.75
1.00
1 Jan1 Mon Jan 90
3AM 6AM 9AM 12PM 3PMBaB
Basin 1 predev catchment 100-yrMax - Local (Catch 1)[1.156] Total Local Flow[1.156] Total Flow[1.156]
Rai
nfal
l [m
m/h
r]Fl
ow [c
ms]
Time
Total Rainfall (Catch 1) Rainfal Excess (Catch 1) Local (Catch 1)
Total Local Flow Total Flow Surface & Pipe (Bottom)
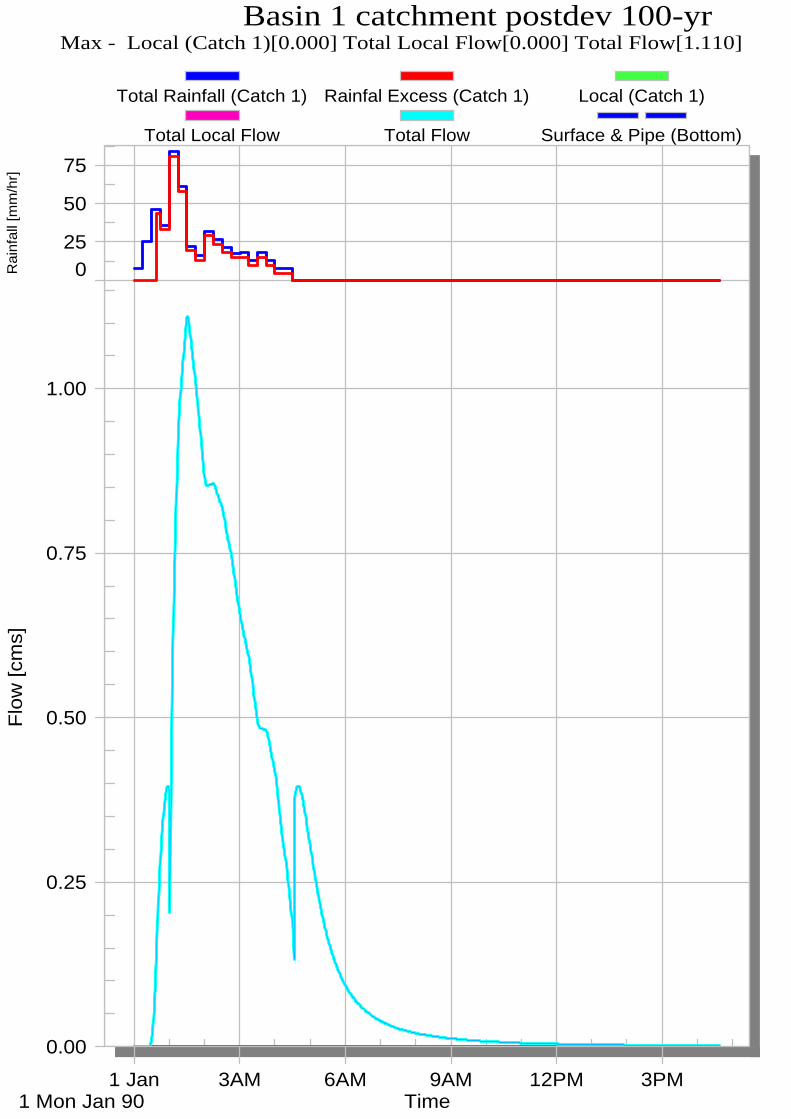
025
50
75
0.00
0.25
0.50
0.75
1.00
1 Jan1 Mon Jan 90
3AM 6AM 9AM 12PM 3PM
Basin 1 catchment postdev 100-yrMax - Local (Catch 1)[0.000] Total Local Flow[0.000] Total Flow[1.110]
Rai
nfal
l [m
m/h
r]Fl
ow [c
ms]
Time
Total Rainfall (Catch 1) Rainfal Excess (Catch 1) Local (Catch 1)
Total Local Flow Total Flow Surface & Pipe (Bottom)
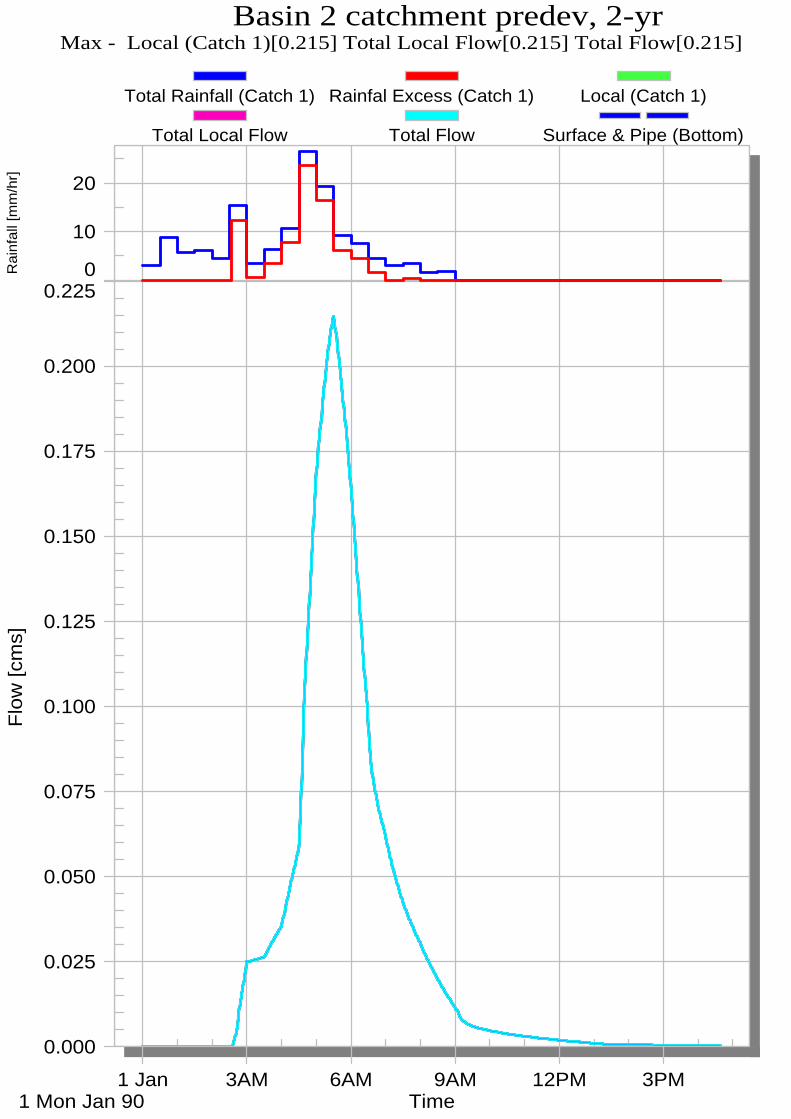
0
10
20
0.000
0.025
0.050
0.075
0.100
0.125
0.150
0.175
0.200
0.225
1 Jan1 Mon Jan 90
3AM 6AM 9AM 12PM 3PM
Basin 2 catchment predev, 2-yrMax - Local (Catch 1)[0.215] Total Local Flow[0.215] Total Flow[0.215]
Rai
nfal
l [m
m/h
r]Fl
ow [c
ms]
Time
Total Rainfall (Catch 1) Rainfal Excess (Catch 1) Local (Catch 1)
Total Local Flow Total Flow Surface & Pipe (Bottom)
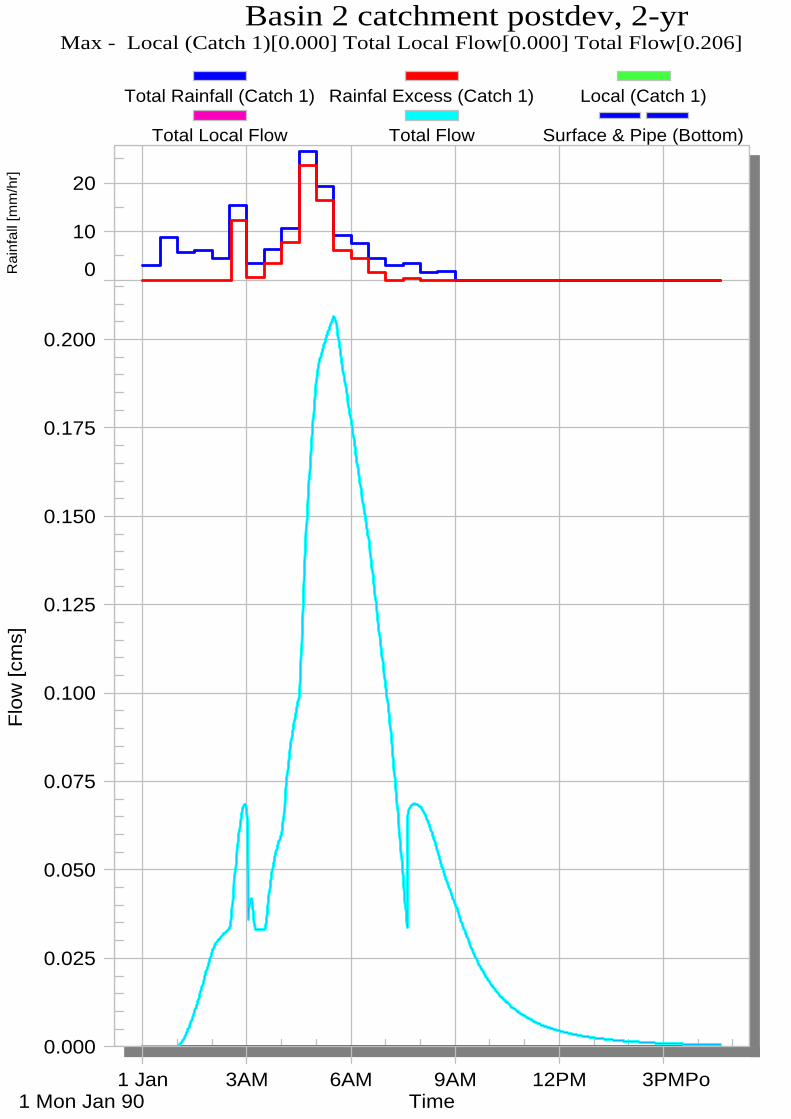
0
10
20
0.000
0.025
0.050
0.075
0.100
0.125
0.150
0.175
0.200
1 Jan1 Mon Jan 90
3AM 6AM 9AM 12PM 3PMPo
Basin 2 catchment postdev, 2-yrMax - Local (Catch 1)[0.000] Total Local Flow[0.000] Total Flow[0.206]
Rai
nfal
l [m
m/h
r]Fl
ow [c
ms]
Time
Total Rainfall (Catch 1) Rainfal Excess (Catch 1) Local (Catch 1)
Total Local Flow Total Flow Surface & Pipe (Bottom)
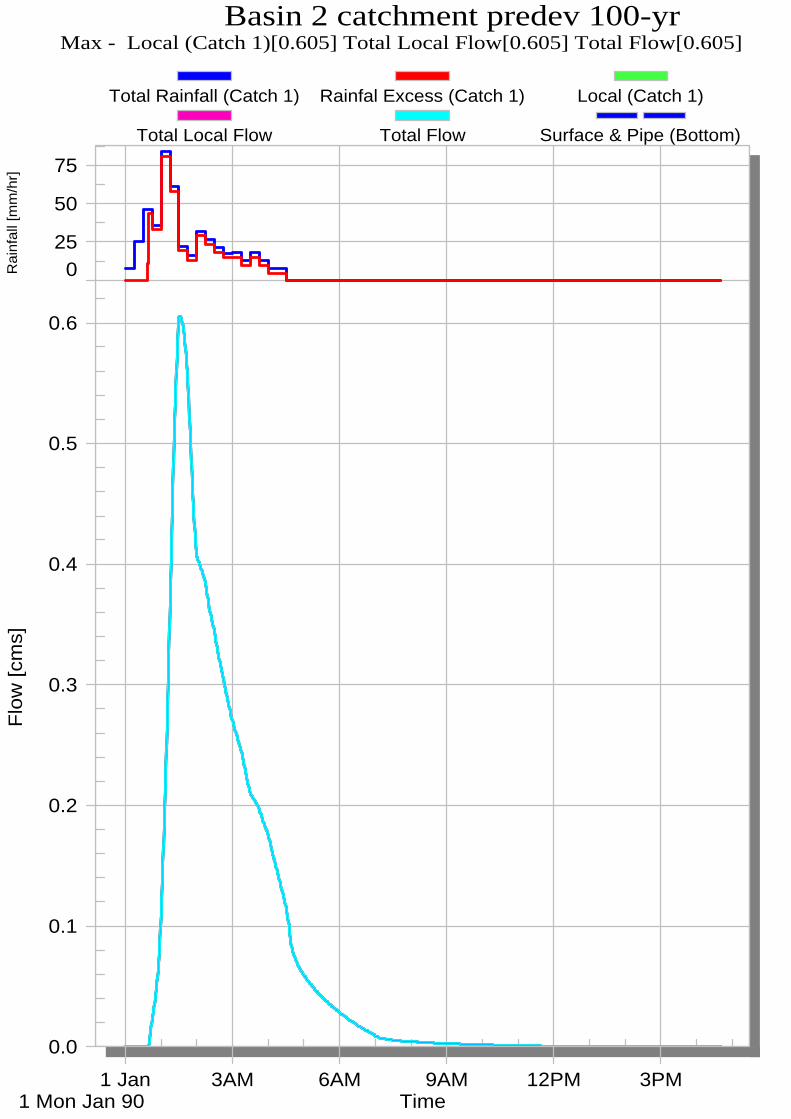
025
50
75
0.0
0.1
0.2
0.3
0.4
0.5
0.6
1 Jan1 Mon Jan 90
3AM 6AM 9AM 12PM 3PM
Basin 2 catchment predev 100-yrMax - Local (Catch 1)[0.605] Total Local Flow[0.605] Total Flow[0.605]
Rai
nfal
l [m
m/h
r]Fl
ow [c
ms]
Time
Total Rainfall (Catch 1) Rainfal Excess (Catch 1) Local (Catch 1)
Total Local Flow Total Flow Surface & Pipe (Bottom)

050
100
150
0.0
0.1
0.2
0.3
0.4
0.5
0.6
1 Jan1 Mon Jan 90
3AM 6AM 9AM 12PM 3P
Basin 2 catchment postdev 100-yrMax - Local (Catch 1)[0.000] Total Local Flow[0.000] Total Flow[0.621]
Rai
nfal
l [m
m/h
r]Fl
ow [c
ms]
Time
Total Rainfall (Catch 1) Rainfal Excess (Catch 1) Local (Catch 1)
Total Local Flow Total Flow Surface & Pipe (Bottom)

APPENDIX D Model – MUSIC layout

Roads
Receiving Node
Other area
Roofs
Rainwater Tank
WetlandCopy of Wetland
Copy of RoadsCopy of Roofs
Copy of Rainwater Tank
Copy of Other area
P1012
P1512
MUSIC - Model for Urban Stormwater Improvement Conceptualisation 24/11/2008 12:43:56 PM