
Site Servicing & Stormwater Site Management Report
36
FUNCTIONAL SERVICING & STORMWATER MANAGEMENT REPORT Proposed Light Industrial Development 250 Vanguard Drive Ottawa, Ontario Prepared for: S&R Mechanical. 2035 Lanthier Drive Orleans, Ontario K4A 3V3 Attention: Mr. Serge Robert LRL Associates Ltd. 1-2884 Chamberland Street Tel: (613) 446-7777 or (877) 632-5664 Rockland, Ontario Website: www.LRL.ca K4K 1M6 Fax: (613) 446-1427 LRL File No.: 130427 December 9, 2013
-
Upload
eduardo-lubo -
Category
Documents
-
view
228 -
download
0
Transcript of Site Servicing & Stormwater Site Management Report

FUNCTIONAL SERVICING &STORMWATER MANAGEMENT
REPORT
Proposed Light Industrial Development250 Vanguard Drive
Ottawa, Ontario
Prepared for:
S&R Mechanical.2035 Lanthier Drive
Orleans, OntarioK4A 3V3
Attention: Mr. Serge Robert
LRL Associates Ltd.1-2884 Chamberland Street Tel: (613) 446-7777 or (877) 632-5664
Rockland, Ontario Website: www.LRL.caK4K 1M6 Fax: (613) 446-1427
LRL File No.: 130427 December 9, 2013

Functional Servicing and Stormwater Management Report LRL File: 130427250 Vanguard DriveCity of Ottawa
December 9, 2013
i
LRL Associates Ltd.
Table of Contents1 INTRODUCTION ................................................................................................................ 1
1.1 Site Description ......................................................................................................... 1
1.2 Proposed Development ............................................................................................. 1
2 SANITARY SERVICING ..................................................................................................... 3
3 WATER SERVICING .......................................................................................................... 4
4 STORMWATER MANAGEMENT ....................................................................................... 5
4.1 Design Criteria ........................................................................................................... 5
4.1.1 Water Quality ........................................................................................................ 5
4.1.2 Water Quantity...................................................................................................... 5
4.2 Method of Analysis .................................................................................................... 5
4.3 Allowable Release Rate ............................................................................................. 5
4.4 Proposed Stormwater Quantity Controls ................................................................. 5
4.4.1 Rooftop Controls................................................................................................... 6
4.4.2 Hydrovex ICD and 825mm diameter HDPE Storage pipes.................................... 6
4.5 Proposed Stormwater Quality Controls ................................................................... 7
5.0 CONCLUSIONS.............................................................................................................. 8
Functional Servicing and Stormwater Management Report LRL File: 130427250 Vanguard DriveCity of Ottawa
December 9, 2013
ii
LRL Associates Ltd.
FiguresFigure 1 Site Location Plan.................................................................................... 2
AppendicesAppendix A Sanitary AnalysisAppendix B Water Demand CalculationsAppendix C Stormwater Management CalculationsAppendix D Downstream Defender Oil Grit Separator
Drawing List
C.101 Erosion and Sediment Control PlanC.301 Grading PlanC.401 Servicing PlanC.601 Storm Water Management PlanC.701, C.702 Pre and Post Development Drainage PlanC.901 Details Plan
Functional Servicing and Stormwater Management Report LRL File: 130427250 Vanguard DriveCity of Ottawa
December 9, 2013
Page 1 of 8
LRL Associates Ltd.
1 INTRODUCTION
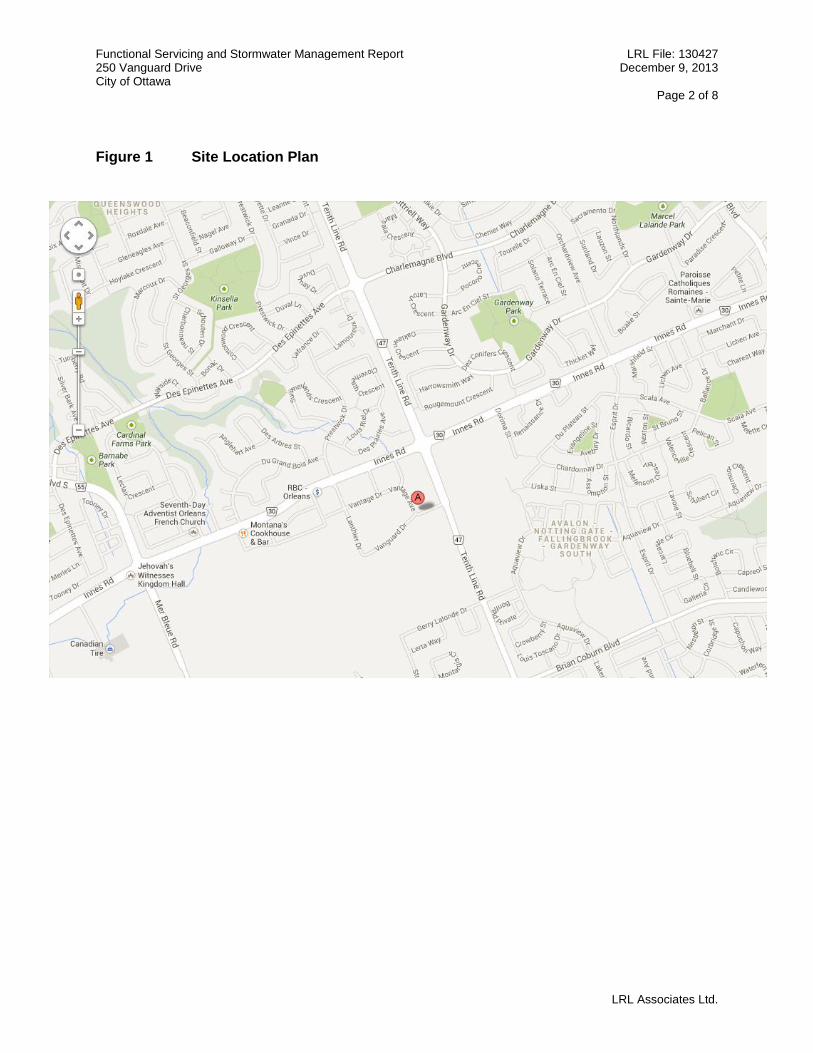
LRL Associates Ltd. (LRL) has been retained as the Consulting Engineers by S&R Mechanicalto prepare a Site Servicing and Stormwater Management Report in support of a proposed lightindustrial development located at 250 Vanguard Drive, Orleans, Ontario. Refer to Figure 1 forthe key plan.
This Servicing and Stormwater Management Report will:
Calculate the anticipated sanitary contribution from the proposed site. Calculate the anticipated site domestic and fire water demands. Calculate the allowable stormwater release rate. Calculate the anticipated post development stormwater release rates. Demonstrate how the allowable release rate will be met with the use of Stormwater
Management Best Practices. Provide recommendations for stormwater management maintenance.
All of the above will be done in accordance with accepted engineering practices criteria from thegoverning approval agencies.
1.1 Site DescriptionThe subject land is 0.682 ha in area and has an irregular shape with a frontage on VanguardDrive of 100.6m and an average lot depth of +/-69m. The site is a vacant green-field covered bywild grasses. The property is bound to the north by Vanguard Drive; to the east, west and southby vacant lots.
The property is flat and gradually drains toward Vanguard Drive with slopes ranging from 0.01%up to 0.5%.
1.2 Proposed DevelopmentThe proposed development will see the construction of a 0.202 ha light industrial building with awarehouse and office units. The building will have a sloped rooftop utilized for stormwaterstorage. The roof drainage will be controlled by a total of 6 Zurn Control Flo roof drains. Thebuilding will be surrounded by a drive aisle, parking spaces and loading areas. The proposeddevelopment will be completely serviced from the municipal infrastructure located on VanguardDrive.
Functional Servicing and Stormwater Management Report LRL File: 130427250 Vanguard DriveCity of Ottawa
December 9, 2013
Page 2 of 8
LRL Associates Ltd.
Figure 1 Site Location Plan
Functional Servicing and Stormwater Management Report LRL File: 130427250 Vanguard DriveCity of Ottawa
December 9, 2013
Page 3 of 8
LRL Associates Ltd.
2 SANITARY SERVICING
The proposed site will be serviced with a 150mm diameter sanitary sewer, which will connect tothe 250mm diameter sanitary sewer located along Vanguard Drive and is directed toward525mm diameter trunk sanitary sewer also located on Vanguard Drive..
The parameters used to calculate the anticipated site sanitary flows are: a light industrialaverage flow demand of 35000 L/ha/day, a light industrial peaking factor of 7.2 (based onAppendix 4-B of the Ottawa Sewer Guidelines) and an infiltration rate of 0.28 L/s/ha. Based onthese parameters and the site area of 0.682 ha, the total anticipated sanitary flow is 2.18 L/s.Refer to Appendix A for the site sanitary sewer design sheet and light industrial peaking factorchart.
Our findings suggest that this development can be serviced with the sanitary sewer alongVanguard Drive. The services have been designed and will be constructed to comply with theapplicable City of Ottawa criteria and standards.
Functional Servicing and Stormwater Management Report LRL File: 130427250 Vanguard DriveCity of Ottawa
December 9, 2013
Page 4 of 8
LRL Associates Ltd.
3 WATER SERVICING
The proposed site will be serviced with a 200mm diameter PVC DR-18 watermain and will beconnected to the 300mm diameter watermain located along Vanguard Drive. The building willbe sprinklered; therefore a Siamese connection will be located within 10m from the frontentrance. The site will have a 200mm diameter isolation valve and valve box at the frontproperty line.
A hydrant is proposed to be installed on-the site to ensure all areas of the building are within90m. A Siamese connection is also provided and is within 45m of a hydrant, as required. Thereis an existing hydrant located on the south side of Vanguard Drive fronting the site, which is alsowithin 90m of the proposed development.
The anticipated domestic demand for this development is 0.7 L/s and the fire flow requirementsare 105 L/s. Refer to Appendix B for water domestic demand and fire flow calculations.
The City of Ottawa provided boundary conditions for the 300mm diameter watermain alongVanguard Drive for the proposed development in an email on September 03, 2013 based on thedemands calculated above. Refer to Appendix B for the boundary conditions email. Theboundary conditions for this site are:
Max Day Demand + Fire Flow = 125.7mPeak Hourly Demand = 122.7mHigh Pressure = 130.1m
The water supply has been analyzed to ensure that the City of Ottawa design criteria are met.For the maximum daily demand + fire flow rate of 105 L/s (2,398 USgpm), the anticipatedpressure on Vanguard Drive is 364 KPa. We have estimated the pressure drop between theconnection on Vanguard Drive and the building is at 14 KPa for the maximum daily demand andfire flow to the sprinklers through a 200mm diameter PVC DR-18 pipe. The calculated pressureat the floor slab elevation is 350 KPa.The minimum residual pressure of 140KPa is achieved.Therefore the proposed site is serviced adequately with the 300mm diameter watermain onVanguard Drive and with the 200mm diameter lateral service. We also recommend that thedomestic water connection inside the building be 40mm diameter.
Functional Servicing and Stormwater Management Report LRL File: 130427250 Vanguard DriveCity of Ottawa
December 9, 2013
Page 5 of 8
LRL Associates Ltd.
4 STORMWATER MANAGEMENT
4.1 Design CriteriaThe stormwater management criteria for this development are based on the Gloucester andCumberland East Urban Community Expansion Area and Bilberry Creek Industrial Park MasterServicing Update by Stantec Consulting Ltd. Updated July 2006, City of Ottawa Sewer DesignGuidelines including City of Ottawa Stormwater Management Design Guidelines, and RideauValley Conservation Authority (RVCA) input.
4.1.1 Water Quality
Enhanced (80% TSS removal) quality control will be provided as required by the RVCA.
4.1.2 Water Quantity
The 5 and 100 year post development flows will be controlled to 50 L/s/ha, as specified by theGloucester and Cumberland East Urban Community Expansion Area and Bilberry CreekIndustrial Park Master Servicing Update.
4.2 Method of AnalysisThe Rational Method has been used to calculate the runoff rate from the drainage catchment toquantify the detention storage for all control measures, which is in keeping within therequirements. Refer to Appendix C for all stormwater calculations and storm sewer designsheet.
4.3 Allowable Release RateThe allowable release rate from the site to the municipal sewer is based on 50 L/s/ha for the 5year storm event. The site is required to control flows for storm events greater that the 5 year,up to the 100 year.
The site area totaling 0.682 ha is permitted to release 34.10 L/s for the 5 year and 100 yearstorm event.
4.4 Proposed Stormwater Quantity ControlsThe proposed stormwater management quantity controls for this development will beaccomplished through the use of: rooftop storage, Zurn Control Flo roof drains, a Hydrovex ICDand underground storage pipes. The proposed site storm sewer and stormwater managementsystem can be seen on drawing C.401 & C.601 and detailed calculations, including designsheet, can be found in Appendix C.
The majority of the site, 0.524 ha, will be controlled on-site with the use of a Hydrovex ICD. Ofthis 0.524 ha, 0.128 ha is rooftop area from the single-storey portion of the building. The singlestorey rooftop drainage will be stored and controlled with roof drains. From these roof drains,the controlled flow will exit through roof leaders onto the site asphalt. From there the roof
Functional Servicing and Stormwater Management Report LRL File: 130427250 Vanguard DriveCity of Ottawa
December 9, 2013
Page 6 of 8
LRL Associates Ltd.
drainage will flow to a site catchbasin and will be controlled again by the hydrovex ICD alongwith the rest of the major site area. The two-storey rooftop area, 0.074 ha, will also be controlledby roof drains. However, the roof leaders are directly connected to the storm service, which willconnect to the site storm system downstream of the Hydrovex ICD and upstream of the oil gritseparator. Finally a portion of the site, 0.085 ha, will flow uncontrolled to the Vangaurd right ofway (ROW).
4.4.1 Rooftop Controls
Rooftop drainage will be controlled with the use of 6 Zurn ‘Control Flo’ roof drains: 3 drains onthe single-storey roof and 3 drains on the two-storey roof, as can be seen on Drawing C.401 &C.601. These roof drains are to be fitted with 1 weir each at a rated capacity of 0.15 L/s/cm ofhead.
The single-storey ‘Control Flo’ roof drains will service the proposed sloped rooftop, 0.128 ha,and will have a peak release rate of 4.91 L/s combined during the 100 year storm event and willprovide a maximum anticipated storage of 46.88 m3 at a maximum expected height of 110 mm.Scupper drains are to be provided 150 mm above the rooftop elevation to provide an outlet forgreater storm events as well as act as an emergency overflow in case of blockage. Additionally,the rooftop will need to be structurally designed to accommodate the maximum 150mm waterlevel.
The two-storey ‘Control Flo’ roof drains will service the proposed sloped rooftop, 0.074 ha, andwill have a peak release rate of 5.26 L/s combined during the 100 year storm event and willprovide a maximum anticipated storage of 28.66 m3 at a maximum expected height of 118 mm.Scupper drains are to be provided 150 mm above the rooftop elevation to provide an outlet forgreater storm events as well as act as an emergency overflow in case of blockage. Additionally,the rooftop will need to be structurally designed to accommodate the maximum 150mm waterlevel.
4.4.2 Hydrovex ICD and 825mm diameter HDPE Storage pipes
The final component for the stormwater attenuation will be the use of a Hydrovex ICD,specifically the 125VHV-2 model, and will be located in the control manhole, CBMH 4, on site.This Hydrovex ICD will ensure the allowable release rate is met during the 5 year and 100 yearstorm events. In order to throttle the 5 year and 100 year storm flows, on-site storage isrequired. The Hydrovex ICD will produce a head of 2.78 m and will require 205 m3 of on-sitestorage. The majority of this storage will be provided with the use of 4 rows of 825mm diameterHDPe 320kPa pipes. The rest of the storage will be provided through use of the on-site stormpipes and structures as well as some parking lot ponding. The maximum expected HWL duringthe 100 year event is 2.78m (87.91 masl). Refer to Appendix C for storage calculations.
Under the 100 year storm event, the Hydrovex ICD will release a maximum of 17.32 L/s into theVanguard Drive municipal sewer system. The uncontrolled area, 0.076 ha, of the site willrelease a peak 100 year flow of 11.51 L/s. The two-storey rooftop drains will provide a maximumflow of 5.26 L/s into the Vanguard Drive municipal sewer system downstream of the HydrovexICD. Therefore, the total release rate from the site during the 100 year event is 34.10 L/s, whichis meets than the allowable release requirement.
Functional Servicing and Stormwater Management Report LRL File: 130427250 Vanguard DriveCity of Ottawa
December 9, 2013
Page 7 of 8
LRL Associates Ltd.
4.5 Proposed Stormwater Quality Controls
Enhanced 80% TSS removal will be accomplished through the use of an ADS 1200mmdiameter Downstream Defender (DD1200) capable of treating the site to 89.5% TSS removal.
The first in the treatment train will be the 300mm sumps in all catchbasins and catchbasinmanholes located in the parking lots and drive aisle of the site. The sumps will allow sediment tosettle to the bottom of the structures and be cleaned when required.
The final component in the stromwater treatment train will be the DD1200, which will be locatedafter the Control Manhole. Through the DD1200, 89.5% of the remaining TSS will be removedaccording to the manufacturer ADS. Refer to Appendix D for the Downstream Defender analysisand information.
This combination of treatment solutions will provide an overall TSS removal of 89.5%,exceeding the RVCA requirements of enhanced 80% TSS removal.
During construction, erosion and sediment controls will be provided primarily via a sedimentcontrol fence to be erected along the perimeter of the site where runoff has the potential ofleaving the site. Inlet sediment control devices are also to be provided in any catchbasins andmanholes in and around the site that may be impacted by the site construction. Refer to drawingC.101 for details.

Functional Servicing and Stormwater Management Report LRL File: 130427250 Vanguard DriveCity of Ottawa
December 9, 2013
Page 8 of 8
LRL Associates Ltd.
5.0 CONCLUSIONS
In accordance with the report objectives, the analysis of the proposed development can besummarized as follows:
Sanitary The anticipated sanitary flow from the proposed development is 2.00 L/s at 35,000
L/ha/d and a light industrial peaking factor of 6.6.Water
The anticipated domestic demand for the site is 0.7 L/s at 35,000 L/ha/d and a maximumhourly demand peaking factor of 1.8.
The maximum expected fire flow demand is 105 L/s. A municipal fire hydrant is available to service a portion of the proposed development. A
proposed private fire hydrant is to be located on-site to service the remaining portion ofthe site.
Stormwater Based on City of Ottawa requirements, the allowable release rate to the municipal sewer
network is 34.10 L/s for the 5 year and 100 year storm event. For greater rainfall events,the site is permitted to release at an uncontrolled rate to the fronting street, VanguardDrive.
Stormwater attenuation will be provided through the use of six (6) Zurn ‘Control Flo’ roofdrains, and a Hydrovex ICD located in the Control Manhole.
The Zurn ‘Control Flo’ roof drains are to have one (1) notch each. Scupper drains are tobe located 15cm above the rooftop elevation and the rooftop will need to be structurallydesigned to hold the expected water storage load.
Parking lot ponding, pipe storage and the 4 additional rows of 825mm diameter HDPEstorage pipes will be used to store a 205 m3 with a HWL of 2.78m (87.91 masl) abovethe Hydrovex ICD centre (85.13 masl) for the 100 year major system event.
Under the 100 year event the controlled release rate through the Hydrovex ICD will be17.32 L/s, the uncontrolled release is 11.51 L/s, and the roof controlled storm serviceconnected to the system downstream of the Hydrovex ICD will have a maximum flow of5.26 L/s. This totals 34.10 L/s, which meets the allowable release rate requirement of34.10 L/s.
Enhanced quality protection will be provided through the use of ADS 1200mmDownstream Defender accomplishing 89.5% TSS removal, exceeding the enhanced80% TSS removal requirement.
Prepared by:
LRL Associates Ltd.
Gabrielle Schaeffer, B.Sc.E. Jean-Claude Lalonde, P.Eng.Civil Designer Project Engineer
APPENDIX ASanitary Servicing
LRL Associates Ltd.Sanitary Design Sheet
C+I+I
AREA(Ha) POP.
BLDG MH 101 0.0 0.0 0.0 0.0 4.0 0.00 0.0 0.0 0.682 0.682 7.2 0.0 0.0 1.99 0.68 0.68 0.19 2.18 25.8 150.0 1.00% 15.23 0.86 85.35 85.09MH 101 EXIST. 0.0 0.0 0.0 0.0 4.0 0.00 0.0 0.0 0.000 0.682 7.2 0.0 0.0 1.99 0.00 0.68 0.19 2.18 17.9 150.0 1.00% 15.23 0.86 85.03 84.85
December 9, 2013 1 of 1
Dwg. Reference: File Ref.: Date: Sheet No.Maximum Residential Peak Factor = 4.0Commercial & Institutional Peak Factor = 1.5
C.401 130427
Commercial & Institutional Flow = 50000 L/ha/day Extraneous Flow = 0.28 L/s/gross ha Checked: LOCATION:Light Industrial Flow = 35000 L/ha/day Minimum Velocity = 0.60 m/s
J.C. Lalonde 250 Vanguard Drive, OttawaManning's n = 0.013Heavy Industrial Flow = 55000 L/ha/day
DOWNINVERT
(m)
DESIGN PARAMETERS Designed: PROJECT:
G. Schaeffer S&R MechanicalAverage Daily Flow = 350 L/p/day Industrial Peak Factor = as per Appendix 4-B = 7.2 (attached)
LENGTH(m)
DIA.(mm)
SLOPE(%)
CAP.(FULL)
(l/s)
VEL.(FULL)(m/s)
UPINVERT
(m)
INFILT.FLOW
(l/s)
PEAKFLOW
(l/s)
AREA(Ha)
ACCU.AREA(Ha)
AREA(Ha)
ACCU.AREA(Ha)
PEAKFACT.(MOE)
AREA(Ha)
ACCU.AREA(Ha)
PEAKFLOW
(l/s)
TOTALAREA(Ha)
ACCU.AREA(Ha)
TOTALFLOW
(l/s)
PIPE MANHOLE
STREET FROMMH TO MH AREA
(Ha) POP.CUMMULATIVE PEAK
FACT.
LOCATION RESIDENTIAL AREA AND POPULATION COMMERCIAL INDUSTRIAL INSTITUTIONAL INFILTRATION
W:\FILES 2013\130427\3-Reports\Civil\Dec 2013\130427_Dec 2013.xlsx 10/12/2013
Ottawa Sewer Design Guidelines
APPENDIX 4-B PEAKING FACTOR FOR INDUSTRIAL AREAS
City of Ottawa Appendix 4-B.1 November 2004
gschaeffer
Line
gschaeffer
Line

APPENDIX BWater Demand Calculations
CALCULATION SHEET
Prepared by:
Project: 250 Vanguard Drive Proposed Development Checked by:
Water Demand Calculations Project No:
Date:
Fire Flow Calculation
Based on Fire Underwriters Survey
1 F= 220 C ( sqrt (A))
Where F= Fire flow in Lpm
C= construction type coefficient
= 0.8 for non-combustible construction
A = total floor area in sq.m.
Building Area= 2764.00 sq.m
F = 9,252.98 L/min
Round to nearest 1000 l/min
F = 9,000 Ll/min
2 No Fire Hazard Reduction
0% No reduction for non-combustible construction
Reduction = 0 L/min
F = 9,000 L/min
3 Sprinkler Reduction
30% No sprinklers
Reduction = 2700 L/min
4 Separation Charge
0% North-East Side
0% North-West Side 45m+
0% South-West Side 45m+
0% South-East Side 45m+
0% 0 L/min
Note: Maximum Total Separation Charge is 75%
F = 9,000 - 2700 + 0 = 6,300.00 L/min
F = 105 L/s
F = 1663 USGPM
Domestic Flow Calculations
Site Area = 0.68 ha
Average Day Demand = 35000 L/(gross)ha/day
= 0.3 L/s
= 4 USGPM
Max. Daily Demand Peaking Factor = 1.5 *As per City of Ottawa standards
Max. Daily Demand = 0.4 L/s
= 7 USGPM
OR
Max. Hourly Demand Peaking Factor = 1.8 *As per City of Ottawa standards
Max. Hourly Demand = 0.7 L/s
= 12 GPM
Therefore,
Dommestic Flow= 0.7 L/s = 12 USGPM
Fire Flow= 105 L/s = 1663 USGPM
J. Lenhart
J.C. Lalonde
130427
August 20, 2013
Total Separation Charge,

1
Julien Lenhart
From: Sevigny, John <[email protected]>
Sent: September-04-13 12:59 PM
To: 'Julien Lenhart'
Subject: RE: 250 Vanguard Dr. - Master Servicing Study and As-built drawings
Hi Julien,
There would be a small change to the Maxday + Fireflow boundary condition however it is not significant enough to
affect your design. Therefore, you can proceed with the original BC.
Sincerely,
John Sevigny, C.E.T. Project Manager - Infrastructure Approvals Development Review - Suburban Services Branch - East Unit Planning & Growth Management Dept. Infrastructure Services and Community Sustainability 110 Laurier Avenue West 4th floor Ottawa, ON K1P 1J1 tel.: (613) 580-2424 ext.14388 fax: (613) 560-6006 e-mail: [email protected] Mail Code: 01-14
From: Julien Lenhart [mailto:[email protected]] Sent: September 04, 2013 9:21 AM
To: Sevigny, John
Subject: RE: 250 Vanguard Dr. - Master Servicing Study and As-built drawings
Hi John,
My client decided to add sprinklers in the building, this changes the Boundary conditions so I have recalculated the
demands accordingly.
Fire Flow = 105 L/s
Average day = 0.3 L/s
Maximum Day = 0.4 L/s
Maximum Hour = 0.7 L/s
Regards,
Julien Lenhart,
Civil Engineering Tech.
LRL Associates Ltd. 1-2884 Chamberland Street
Rockland, Ontario K4K 1M6
Tel: (613) 446-7777
Cell: (613) 978-4652
Fax: (613) 446-1427
Website: www.LRL.ca
From: Sevigny, John [mailto:[email protected]]
Sent: September-03-13 8:31 AM
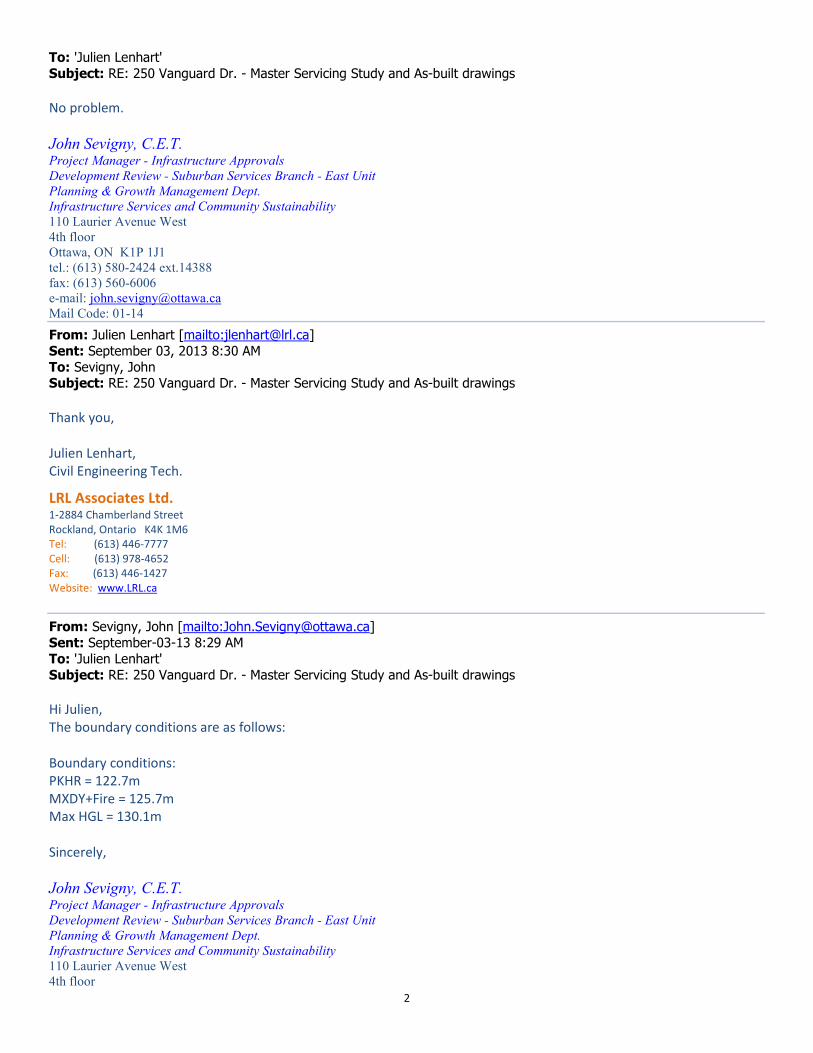
2
To: 'Julien Lenhart'
Subject: RE: 250 Vanguard Dr. - Master Servicing Study and As-built drawings
No problem.
John Sevigny, C.E.T. Project Manager - Infrastructure Approvals Development Review - Suburban Services Branch - East Unit Planning & Growth Management Dept. Infrastructure Services and Community Sustainability 110 Laurier Avenue West 4th floor Ottawa, ON K1P 1J1 tel.: (613) 580-2424 ext.14388 fax: (613) 560-6006 e-mail: [email protected] Mail Code: 01-14
From: Julien Lenhart [mailto:[email protected]]
Sent: September 03, 2013 8:30 AM
To: Sevigny, John Subject: RE: 250 Vanguard Dr. - Master Servicing Study and As-built drawings
Thank you,
Julien Lenhart,
Civil Engineering Tech.
LRL Associates Ltd. 1-2884 Chamberland Street
Rockland, Ontario K4K 1M6
Tel: (613) 446-7777
Cell: (613) 978-4652
Fax: (613) 446-1427
Website: www.LRL.ca
From: Sevigny, John [mailto:[email protected]]
Sent: September-03-13 8:29 AM
To: 'Julien Lenhart'
Subject: RE: 250 Vanguard Dr. - Master Servicing Study and As-built drawings
Hi Julien,
The boundary conditions are as follows:
Boundary conditions:
PKHR = 122.7m
MXDY+Fire = 125.7m
Max HGL = 130.1m
Sincerely,
John Sevigny, C.E.T. Project Manager - Infrastructure Approvals Development Review - Suburban Services Branch - East Unit Planning & Growth Management Dept. Infrastructure Services and Community Sustainability 110 Laurier Avenue West 4th floor

APPENDIX CStormwater Management Calculations
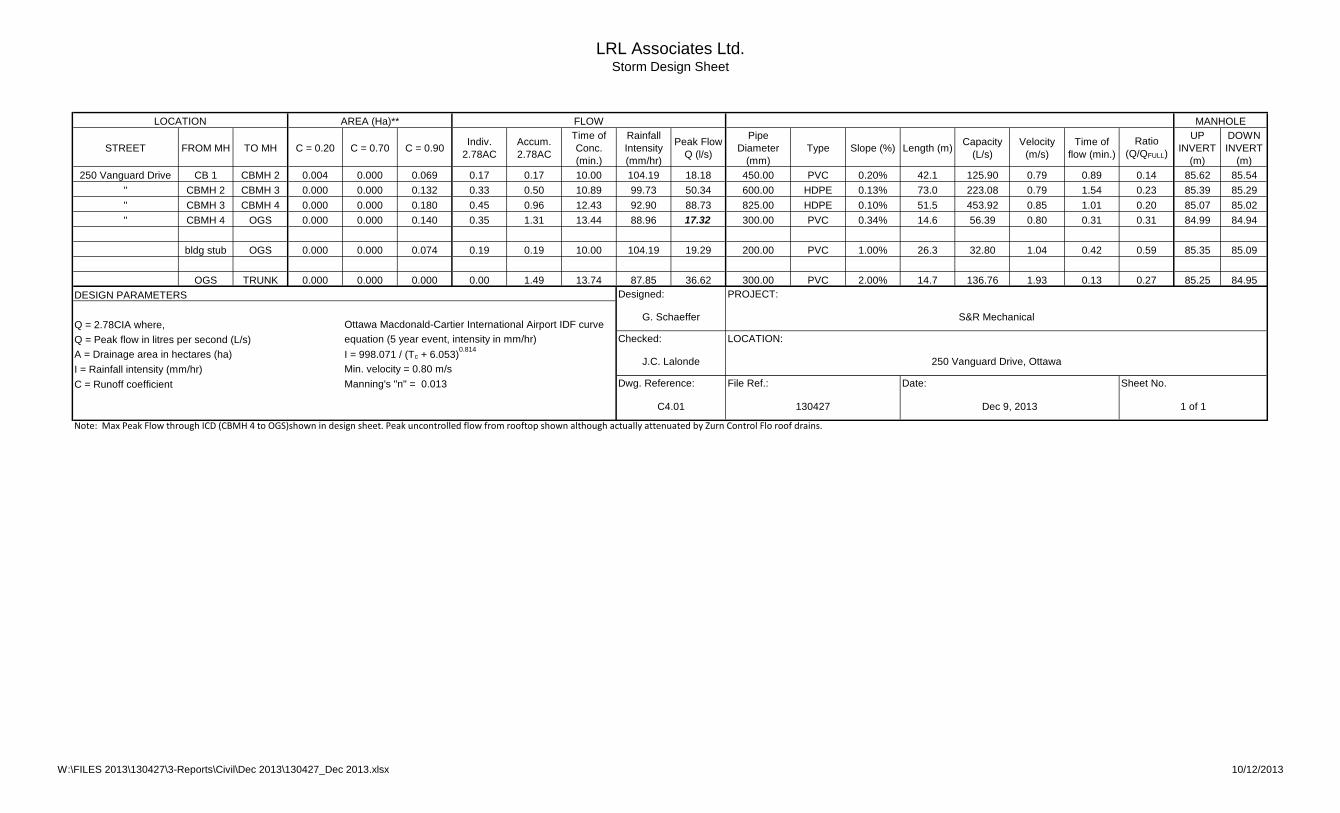
LRL Associates Ltd.Storm Design Sheet
250 Vanguard Drive CB 1 CBMH 2 0.004 0.000 0.069 0.17 0.17 10.00 104.19 18.18 450.00 PVC 0.20% 42.1 125.90 0.79 0.89 0.14 85.62 85.54" CBMH 2 CBMH 3 0.000 0.000 0.132 0.33 0.50 10.89 99.73 50.34 600.00 HDPE 0.13% 73.0 223.08 0.79 1.54 0.23 85.39 85.29" CBMH 3 CBMH 4 0.000 0.000 0.180 0.45 0.96 12.43 92.90 88.73 825.00 HDPE 0.10% 51.5 453.92 0.85 1.01 0.20 85.07 85.02" CBMH 4 OGS 0.000 0.000 0.140 0.35 1.31 13.44 88.96 17.32 300.00 PVC 0.34% 14.6 56.39 0.80 0.31 0.31 84.99 84.94
bldg stub OGS 0.000 0.000 0.074 0.19 0.19 10.00 104.19 19.29 200.00 PVC 1.00% 26.3 32.80 1.04 0.42 0.59 85.35 85.09
OGS TRUNK 0.000 0.000 0.000 0.00 1.49 13.74 87.85 36.62 300.00 PVC 2.00% 14.7 136.76 1.93 0.13 0.27 85.25 84.95DESIGN PARAMETERS
Q = 2.78CIA where,Q = Peak flow in litres per second (L/s)A = Drainage area in hectares (ha)I = Rainfall intensity (mm/hr)C = Runoff coefficient
Note: Max Peak Flow through ICD (CBMH 4 to OGS)shown in design sheet. Peak uncontrolled flow from rooftop shown although actually attenuated by Zurn Control Flo roof drains.
LOCATION AREA (Ha)** FLOW MANHOLE
G. Schaeffer S&R MechanicalOttawa Macdonald-Cartier International Airport IDF curve
Designed: PROJECT:
STREET Velocity(m/s)
Time offlow (min.)FROM MH TO MH C = 0.20 C = 0.70
PipeDiameter
(mm)Type Slope (%) Length (m) Capacity
(L/s)C = 0.90 Indiv.2.78AC
Accum.2.78AC
Time ofConc.(min.)
Manning's "n" = 0.013 Dwg. Reference: File Ref.: Date:
equation (5 year event, intensity in mm/hr) Checked: LOCATION:I = 998.071 / (Tc + 6.053)0.814
J.C. Lalonde 250 Vanguard Drive, OttawaMin. velocity = 0.80 m/s
C4.01 130427 Dec 9, 2013 1 of 1
Sheet No.
Peak FlowQ (l/s)
Ratio(Q/QFULL)
UPINVERT
(m)
DOWNINVERT
(m)
RainfallIntensity(mm/hr)
W:\FILES 2013\130427\3-Reports\Civil\Dec 2013\130427_Dec 2013.xlsx 10/12/2013
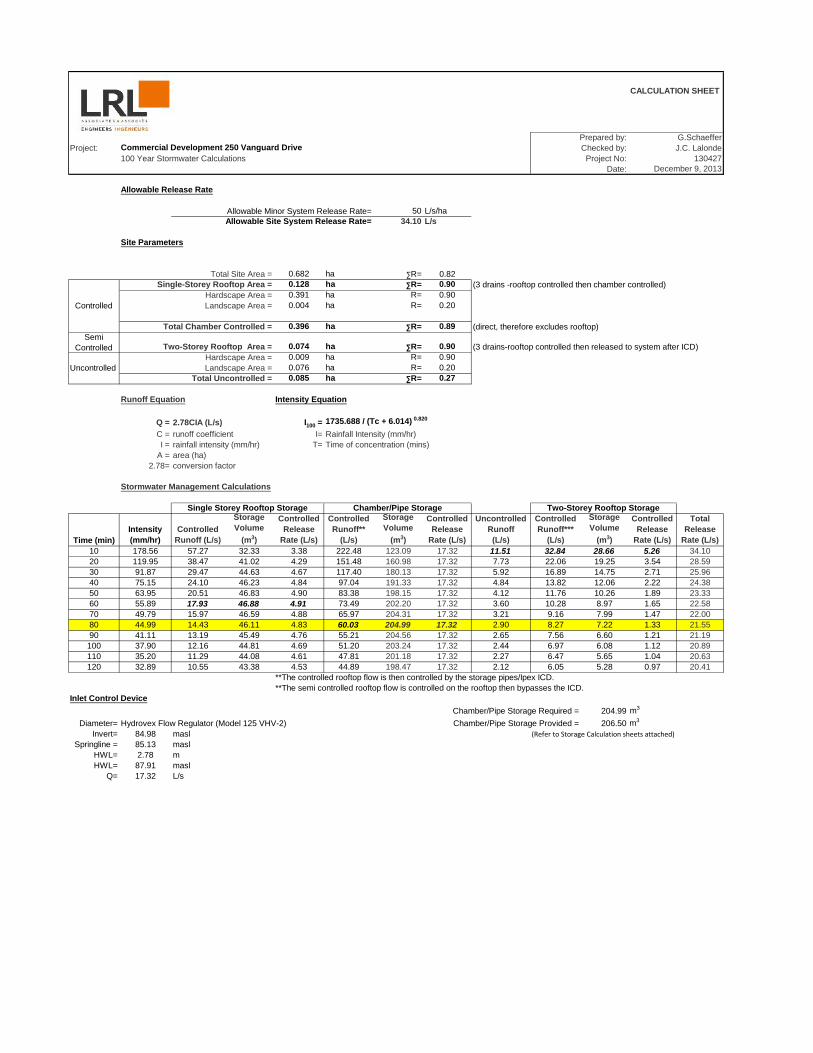
CALCULATION SHEET
Prepared by: G.SchaefferProject: Commercial Development 250 Vanguard Drive Checked by: J.C. Lalonde
100 Year Stormwater Calculations Project No: 130427 Date:
Allowable Release Rate
50 L/s/ha34.10 L/s
Site Parameters
Total Site Area = 0.682 ha ∑R= 0.82Single-Storey Rooftop Area = 0.128 ha ∑R= 0.90 (3 drains -rooftop controlled then chamber controlled)
Hardscape Area = 0.391 ha R= 0.90Landscape Area = 0.004 ha R= 0.20
Total Chamber Controlled = 0.396 ha ∑R= 0.89 (direct, therefore excludes rooftop)Semi
Controlled Two-Storey Rooftop Area = 0.074 ha ∑R= 0.90 (3 drains-rooftop controlled then released to system after ICD)Hardscape Area = 0.009 ha R= 0.90Landscape Area = 0.076 ha R= 0.20
Total Uncontrolled = 0.085 ha ∑R= 0.27
Runoff Equation Intensity Equation
Q = 2.78CIA (L/s) I100 = 1735.688 / (Tc + 6.014) 0.820
C = runoff coefficient I= Rainfall Intensity (mm/hr)I = rainfall intensity (mm/hr) T= Time of concentration (mins)
A = area (ha)2.78= conversion factor
Stormwater Management Calculations
Time (min)Intensity(mm/hr)
ControlledRunoff (L/s)
StorageVolume
(m3)
ControlledRelease
Rate (L/s)
ControlledRunoff**
(L/s)
StorageVolume
(m3)
ControlledRelease
Rate (L/s)
UncontrolledRunoff
(L/s)
ControlledRunoff***
(L/s)
StorageVolume
(m3)
ControlledRelease
Rate (L/s)
TotalRelease
Rate (L/s)10 178.56 57.27 32.33 3.38 222.48 123.09 17.32 11.51 32.84 28.66 5.26 34.1020 119.95 38.47 41.02 4.29 151.48 160.98 17.32 7.73 22.06 19.25 3.54 28.5930 91.87 29.47 44.63 4.67 117.40 180.13 17.32 5.92 16.89 14.75 2.71 25.9640 75.15 24.10 46.23 4.84 97.04 191.33 17.32 4.84 13.82 12.06 2.22 24.3850 63.95 20.51 46.83 4.90 83.38 198.15 17.32 4.12 11.76 10.26 1.89 23.3360 55.89 17.93 46.88 4.91 73.49 202.20 17.32 3.60 10.28 8.97 1.65 22.5870 49.79 15.97 46.59 4.88 65.97 204.31 17.32 3.21 9.16 7.99 1.47 22.0080 44.99 14.43 46.11 4.83 60.03 204.99 17.32 2.90 8.27 7.22 1.33 21.5590 41.11 13.19 45.49 4.76 55.21 204.56 17.32 2.65 7.56 6.60 1.21 21.19100 37.90 12.16 44.81 4.69 51.20 203.24 17.32 2.44 6.97 6.08 1.12 20.89110 35.20 11.29 44.08 4.61 47.81 201.18 17.32 2.27 6.47 5.65 1.04 20.63120 32.89 10.55 43.38 4.53 44.89 198.47 17.32 2.12 6.05 5.28 0.97 20.41
**The controlled rooftop flow is then controlled by the storage pipes/Ipex ICD.**The semi controlled rooftop flow is controlled on the rooftop then bypasses the ICD.
Chamber/Pipe Storage Required = 204.99 m3
Diameter= Hydrovex Flow Regulator (Model 125 VHV-2) Chamber/Pipe Storage Provided = 206.50 m3
Invert= 84.98 masl (Refer to Storage Calculation sheets attached)Springline = 85.13 masl
HWL= 2.78 mHWL= 87.91 masl
Q= 17.32 L/s
Chamber/Pipe StorageSingle Storey Rooftop Storage
Uncontrolled
Two-Storey Rooftop Storage
Inlet Control Device
Controlled
Allowable Minor System Release Rate=
December 9, 2013
Allowable Site System Release Rate=
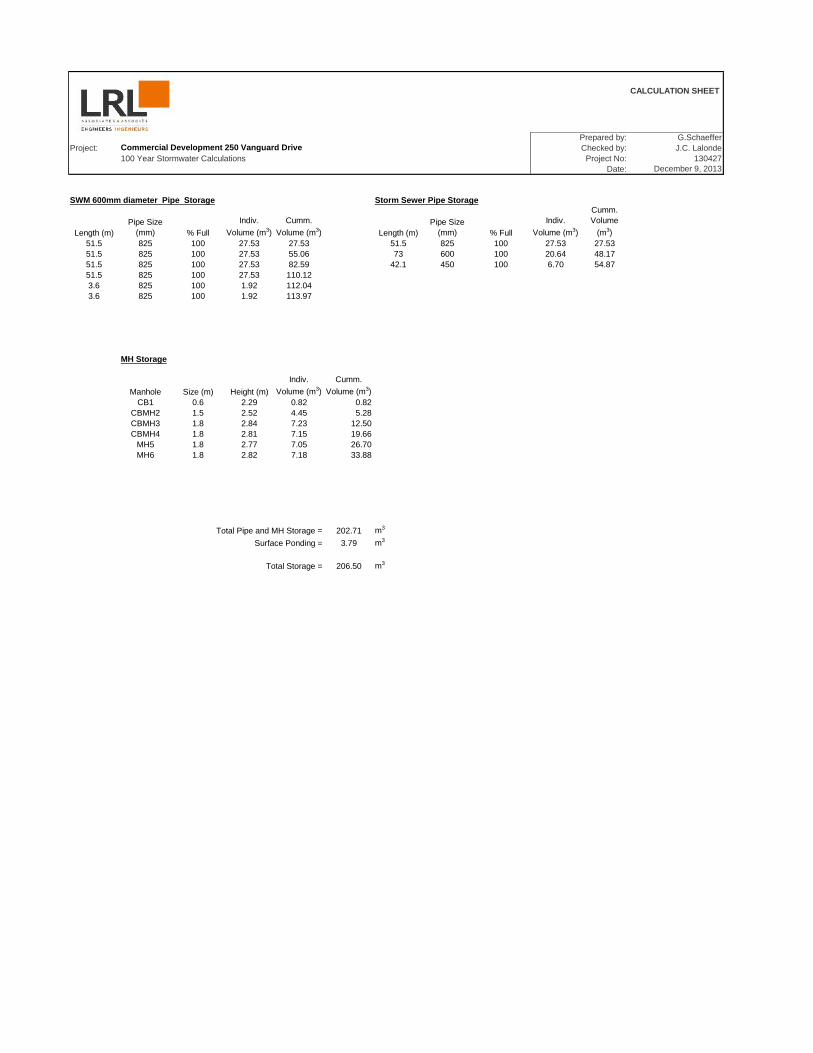
CALCULATION SHEET
Prepared by: G.SchaefferProject: Commercial Development 250 Vanguard Drive Checked by: J.C. Lalonde
100 Year Stormwater Calculations Project No: 130427 Date: December 9, 2013
Length (m)Pipe Size
(mm) % FullIndiv.
Volume (m3)Cumm.
Volume (m3) Length (m)Pipe Size
(mm) % FullIndiv.
Volume (m3)
Cumm.Volume
(m3)51.5 825 100 27.53 27.53 51.5 825 100 27.53 27.5351.5 825 100 27.53 55.06 73 600 100 20.64 48.1751.5 825 100 27.53 82.59 42.1 450 100 6.70 54.8751.5 825 100 27.53 110.123.6 825 100 1.92 112.043.6 825 100 1.92 113.97
Manhole Size (m) Height (m)Indiv.
Volume (m3)Cumm.
Volume (m3)CB1 0.6 2.29 0.82 0.82
CBMH2 1.5 2.52 4.45 5.28CBMH3 1.8 2.84 7.23 12.50CBMH4 1.8 2.81 7.15 19.66
MH5 1.8 2.77 7.05 26.70MH6 1.8 2.82 7.18 33.88
Total Pipe and MH Storage = 202.71 m3
Surface Ponding = 3.79 m3
Total Storage = 206.50 m3
Storm Sewer Pipe Storage
MH Storage
SWM 600mm diameter Pipe Storage

FIG
UR
E 3
VH
V/S
VH
V V
orte
x Fl
ow R
egul
ator
gschaeffer
Line
gschaeffer
Line
APPENDIX DDownstream Defender Oil Grit Separator
Peak Flow=22.59 L/sPipe dia. = 300mm
mm/hr in/hr cms cfs0.50 0.02 0.001 0.026 10.7% 99.9% 10.7%1.00 0.04 0.001 0.052 9.3% 99.7% 9.3%1.50 0.06 0.002 0.078 10.3% 99.6% 10.3%2.00 0.08 0.003 0.105 8.6% 99.5% 8.6%2.50 0.10 0.004 0.131 6.7% 99.3% 6.7%3.00 0.12 0.004 0.157 5.8% 99.1% 5.8%3.60 0.14 0.005 0.188 5.0% 98.9% 4.9%4.10 0.16 0.006 0.214 4.4% 98.8% 4.3%4.60 0.18 0.007 0.240 2.3% 98.6% 2.3%5.10 0.20 0.008 0.267 4.2% 98.4% 4.1%6.40 0.25 0.009 0.335 7.4% 97.9% 7.2%7.60 0.30 0.011 0.397 4.0% 97.3% 3.9%8.90 0.35 0.013 0.465 3.5% 96.7% 3.4%
10.20 0.40 0.015 0.533 1.8% 96.1% 1.7%11.40 0.45 0.017 0.596 3.8% 95.4% 3.6%12.70 0.50 0.019 0.664 1.4% 94.6% 1.3%19.10 0.75 0.028 0.998 5.2% 90.2% 4.7%25.40 1.00 0.038 1.328 2.3% 84.7% 1.9%38.10 1.50 0.056 1.992 1.8% 70.3% 1.3%
95.8%6.5%89.5%
C = 0.90A = 0.60 hectares 1.48 acres
5. Adjustment for using 60 minute data for sites with tc less than 60 min.
3. DD Removal Efficiency based on full-scale test results of 110um particle diameter4. Weighted Removal Efficiency = (DD Removal Efficiency) x (% Total Rainfall Depth)
DD Removal Efficiency3
Weighted Removal Efficiency4
Efficiency Adjustment5:Total Net Annual Removal Efficiency:
1. Rainfall data based on 10 years of rainfall data for Canadian Station 6105976, Ottawa CDA, ON2. Flows approximated using the Rational Method, Q=CIA, where:
% Total Rainfall Depth
Average Annual Volume Treatment
Project Name: City of Ottawa 1200 mm dia. Downstream Defender Sizing Hydro Ref. # 13-8568
Rainfall Intensity1 Flow Rate2
Hydro International � 94 Hutchins Drive � Portland, ME 04102 Tel: (207) 756-6200 � Fax: (207) 756-6212 www.Hydro-International.biz
0%
10%
20%
30%
40%
50%
60%
70%
80%
90%
100%
0 10 20 30 40 50 60 70 80 90
% R
em
ov
al
Flow rate (lps)
Downstream Defender Performance Test Material = OK110 (D50: Approx.=106 microns)
Model: 1.2-m Diameter
© Hydro International Performance Evaluation – Downstream Defender®
Downstream Defender®
Performance Evaluation OK-110 Test Sediment
Prepared by:
© Hydro International Performance Evaluation – Downstream Defender®
COPYRIGHT STATEMENT: The contents of this document, including but not limited to test procedures, performance data, claims, and presentation of results contained herein or annexed hereto, are intended for the use of the recipient to whom the document and all associated information are directed. Hydro International plc owns the copyright of this document (including any reports and data annexed to it), which is supplied in confidence. It must not be used for any purpose other than that for which it is supplied and must not be reproduced, in whole or in part stored in a retrieval system or transmitted in any form or by any means without prior permission in writing from Hydro International plc. DISCLAIMER: Information and data contained in this document are exclusively for the purpose of assessing the performance of Hydro International’s Downstream Defender
®, First Defense
®, and/or Up-Flo Filter
®. No warranty is given nor can liability be accepted for use of
this information for any other purpose. Hydro International plc has a policy of continuous product development and reserve the right to amend specifications.
Hydro International 94 Hutchins Drive Portland, Maine 04102 t: 207.756.6200 f: 207.756.6212 www.hydro-international.biz DD OK-110 Performance Evaluation_OP_V1.2
© Hydro International Performance Evaluation – Downstream Defender® Page 1 of 8
Downstream Defender® Performance Evaluation
OK-110 Test Sediment
Summary
Hydro International successfully completed Downstream Defender® laboratory testing to assess
removal efficiency using OK-110 test sediment. Test procedures were based on protocols used
for regulatory approval in the State of Maine. The performance evaluation included varying flow
rates and influent concentrations to determine a removal efficiency curve for OK-110 test sand.
The Downstream Defender was able to remove greater than 80% for all flow up to 1.5 cfs and
maintain greater than 65% removal efficiency up to 2.2 cfs without bypassing any flow. Testing
at 1.3 cfs was independently witnessed by the Maine Department of Environmental Protection
(MEDEP) and testing results were used to receive state-wide certification by the MEDEP.
Figure 1: Downstream Defender® Laboratory Testing
Test Objectives
The Downstream Defender was tested to evaluate TSS efficiency based on OK-110 test
sediment for varying flow rates and TSS concentrations. The primary goals of the test
program included:
Testing full-scale commercially supplied internals for a 4-ft diameter Downstream Defender.
Completing four test runs at flow rates ranging from 0.4 cfs up to 2.2 cfs.
Provide independent witnessing during testing to validate and confirm procedures described and followed in this report.
Varying inlet concentrations between 200 - 300 mg/L, using OK-110 sand as the test sediment (D50 ~ 106-micron).
Obtaining up to five influent/effluent grab samples for each test run.
Determining a TSS removal efficiency Performance Curve for OK-110 that can be used for sizing different Downstream Defender models.

© Hydro International Performance Evaluation – Downstream Defender® Page 2 of 8
Technology Description
The Downstream Defender is an advanced Hydrodynamic Vortex Separator that is specifically
designed to provide high removal efficiencies of urban runoff pollutants over a wide range of
flow rates. It is commonly used in stormwater applications as either pretreatment or as a stand-
alone treatment system, depending on the water quality objectives.
The unique flow-modifying internal components distinguish the Downstream Defender from
simple swirl-type devices and conventional oil/grit separators by minimizing turbulence and
head losses, enhancing separation, and preventing washout of previously stored pollutants.
The high removal efficiencies and inherent low head losses of the Downstream Defender allow
for a small footprint, making it a compact and economical solution for non-point source pollution.
Figure 2: Downstream Defender® - Interior View
As shown above in Figure 2, the Downstream Defender has no moving parts and no external
power requirements. It has polypropylene internal components and a stainless steel support
frame designed to fit into a cylindrical vessel. The internal components consist of two concentric
hollow cylinders (the dip plate and center shaft), an inverted cone (the center cone), a benching
skirt and a floatables lid. A tangential inlet pipe is designed for connection to typical subsurface
drainage systems. Two ports at ground level provide access for inspection and clean-out of
stored floatables and sediment.
© Hydro International Performance Evaluation – Downstream Defender® Page 3 of 8
Test Sediment
The test sediment used for performance evaluation was U.S. Silica grade OK-110 foundry sand.
The estimated mean particle size of the OK-110 used for testing is approximately 106-micron.
The distribution of the test material is shown in Figure 3. Approximately 20% of the particles are
less than 75 µm, with the remaining 80% between 75 and 150 µm.
Figure 3: Test sand particle size gradation (OK-110)
0
20
40
60
80
100
0 50 100 150 200 250
Pe
rce
nt F
ine
r Th
an (
%)
Particle Size μm
20% <75 microns
80% 75-150 microns
© Hydro International Performance Evaluation – Downstream Defender® Page 4 of 8
Performance Test Set-up
As shown in Figure 4, clean water was pumped via an 8-inch variable speed Flygt pump from a
23,000 gallon reservoir, through a pipe network to the inlet of the Downstream Defender. A
Hershey VP-820 gearbox butterfly valve was used for accurate flow control, which was
measured using an ISCO UniMag Magnetic Flowmeter located in the inlet piping. Where
possible, the flows were verified by at least three volumetric, time-to-fill calculations using 200
gallons for greater accuracy. Grab samples were collected at the inlet sampling point and
effluent pipe prior to discharging back to the reservoir for recirculation.
Figure 4: Downstream Defender Test Equipment
Dosing equipment, as shown in Figure 5, delivered a slurry of the test sediment at the target
influent concentrations. A concentrated water-sand mix was prepared in a 60-gallon slurry tank
by adding the required mass of test sediment to up to 55 gallons of clean water. The tank was
continually mixed to keep the slurry in suspension. A Watson-Marlow peristaltic pump was
used to inject the slurry at a constant rate into the inlet flow of the Downstream Defender in
order to obtain the target influent concentrations.

© Hydro International Performance Evaluation – Downstream Defender® Page 5 of 8
Test Procedures
The tested unit has a Peak Treatment Flow Rate (PTFR) of 3 cfs, which is defined as the flow
rate that positive removal can be expected without scour. For performance testing, clean water
from the reservoir was pumped to the Downstream Defender at flow rates varying from 0.4 cfs
to 2.2 cfs. When the test run’s flow rate had stabilized, the slurry tank valve was opened and
test sediment was pumped into the Influent Slurry Feed Pipe (Figure 6). When test sediment
entered the Downstream Defender, the timer was started. After four residence times had
passed, the first influent sample was collected. This allowed sedimentation in the unit to
stabilize and ensure a representative effluent. Prior to collecting the influent sample, the gate
valve was quickly flushed to remove any accumulated sediment.
Figure 5: Slurry Mixture Dosing Equipment
The effluent sample was collected one residence time following collection of the influent sample.
Four additional influent and effluent sample pairs were collected at one-minute intervals, for up
to five influent/effluent sample pairs collected for the test run. Both influent and effluent sample
volumes were a minimum of 500 mL.
Slurry Mixer
60-Gallon Slurry Tank
Peristaltic Pump
To Influent Feed Pipe
d Pipe

© Hydro International Performance Evaluation – Downstream Defender® Page 6 of 8
All influent and effluent samples were analyzed for Total Suspended Solids (TSS) by APHA
SM2540D. Background influent and effluent samples were collected to ensure clean water
supplied from the reservoir did not exceed non-detect concentrations of 4 mg/L for TSS.
Figure 6: Test Unit with Dosing and Sampling Locations
The discrete TSS results from each test run’s influent and effluent samples were averaged to
determine the test run “Event Mean Concentrations” (EMC). The EMC was used to determine
the removal efficiency for each test run using the equation below.
CInfluentEM
CEffluentEMCInfluentEMEfficiency
)(
Influent Slurry Feed Pipe
T-Pipe Influent
Sampling Location Effluent Sampling
Location
© Hydro International Performance Evaluation – Downstream Defender® Page 7 of 8
Removal Efficiency Test Results
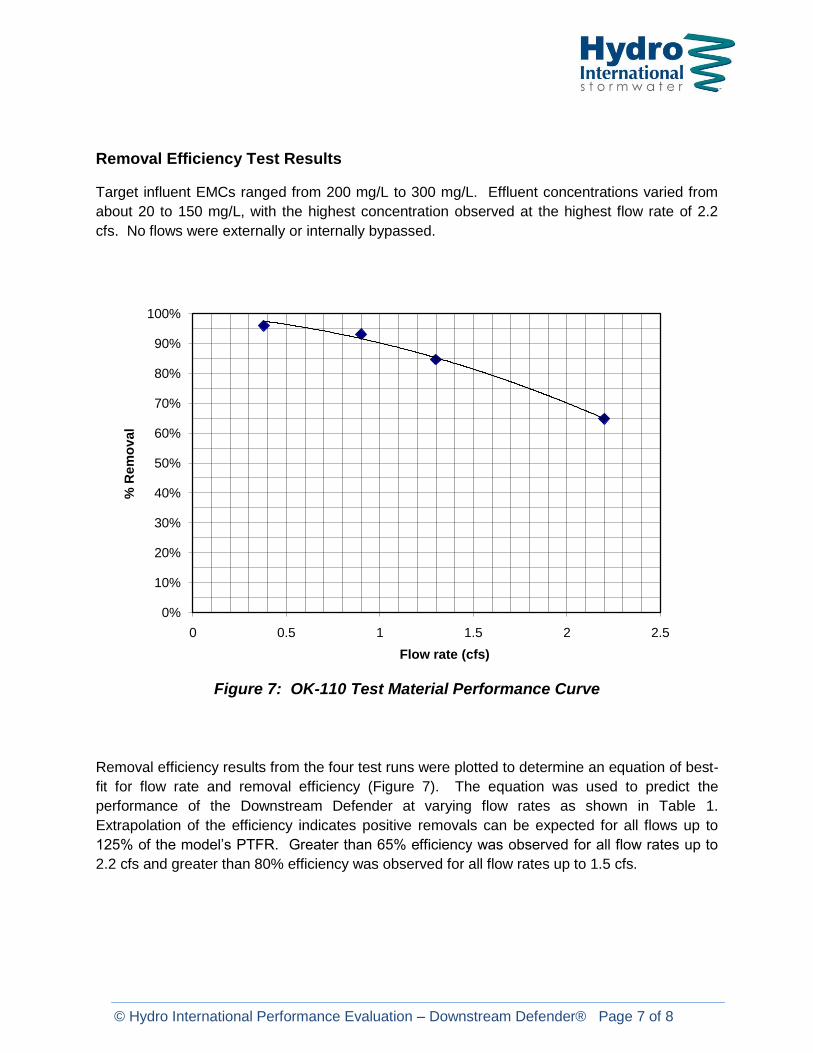
Target influent EMCs ranged from 200 mg/L to 300 mg/L. Effluent concentrations varied from
about 20 to 150 mg/L, with the highest concentration observed at the highest flow rate of 2.2
cfs. No flows were externally or internally bypassed.
Figure 7: OK-110 Test Material Performance Curve
Removal efficiency results from the four test runs were plotted to determine an equation of best-
fit for flow rate and removal efficiency (Figure 7). The equation was used to predict the
performance of the Downstream Defender at varying flow rates as shown in Table 1.
Extrapolation of the efficiency indicates positive removals can be expected for all flows up to
125% of the model’s PTFR. Greater than 65% efficiency was observed for all flow rates up to
2.2 cfs and greater than 80% efficiency was observed for all flow rates up to 1.5 cfs.
0%
10%
20%
30%
40%
50%
60%
70%
80%
90%
100%
0 0.5 1 1.5 2 2.5
% R
em
ov
al
Flow rate (cfs)
© Hydro International Performance Evaluation – Downstream Defender® Page 8 of 8
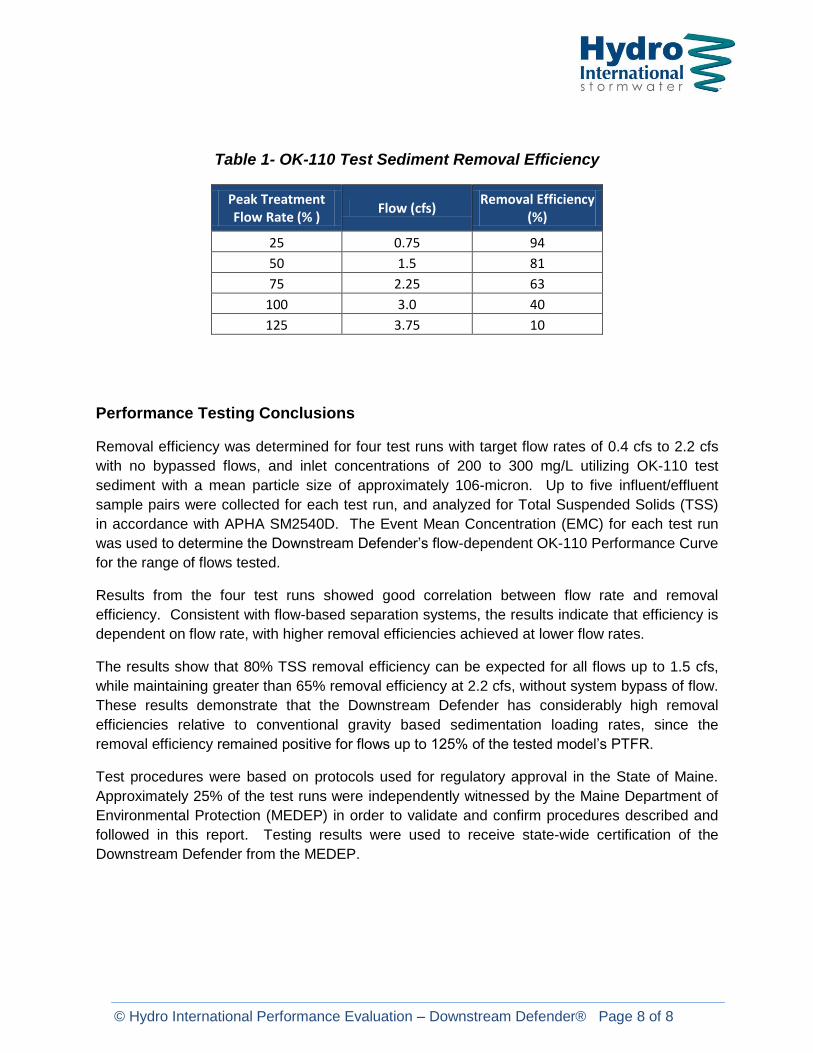
Table 1- OK-110 Test Sediment Removal Efficiency
Peak Treatment Flow Rate (% )
Flow (cfs) Removal Efficiency
(%)
25 0.75 94
50 1.5 81
75 2.25 63
100 3.0 40
125 3.75 10
Performance Testing Conclusions
Removal efficiency was determined for four test runs with target flow rates of 0.4 cfs to 2.2 cfs
with no bypassed flows, and inlet concentrations of 200 to 300 mg/L utilizing OK-110 test
sediment with a mean particle size of approximately 106-micron. Up to five influent/effluent
sample pairs were collected for each test run, and analyzed for Total Suspended Solids (TSS)
in accordance with APHA SM2540D. The Event Mean Concentration (EMC) for each test run
was used to determine the Downstream Defender’s flow-dependent OK-110 Performance Curve
for the range of flows tested.
Results from the four test runs showed good correlation between flow rate and removal
efficiency. Consistent with flow-based separation systems, the results indicate that efficiency is
dependent on flow rate, with higher removal efficiencies achieved at lower flow rates.
The results show that 80% TSS removal efficiency can be expected for all flows up to 1.5 cfs,
while maintaining greater than 65% removal efficiency at 2.2 cfs, without system bypass of flow.
These results demonstrate that the Downstream Defender has considerably high removal
efficiencies relative to conventional gravity based sedimentation loading rates, since the
removal efficiency remained positive for flows up to 125% of the tested model’s PTFR.
Test procedures were based on protocols used for regulatory approval in the State of Maine.
Approximately 25% of the test runs were independently witnessed by the Maine Department of
Environmental Protection (MEDEP) in order to validate and confirm procedures described and
followed in this report. Testing results were used to receive state-wide certification of the
Downstream Defender from the MEDEP.