Site Selection Criteria in Community Shopping Centers ...Phoenix/Research/MITCRE/MIT Thesis... ·...
61
Site Selection Criteria in Community Shopping Centers: Implications for Real Estate Developers by Benjamin T. Brubaker Bachelor of Arts French Brigham Young University, 2001 Submitted to the Department of Architecture in Partial Fulfillment of the Requirements for the Degree of MASTER OF SCIENCE IN REAL ESTATE DEVELOPMENT at the MASSACHUSETTS INSTITUTE OF TECHNOLOGY September 2004 © 2004 Benjamin T. Brubaker. All rights reserved. The author hereby grants to MIT permission to reproduce and to distribute publicly paper and electronic copies of this thesis document in whole or in part. Signature of Author: ______________________________________________________ Benjamin T. Brubaker Department of Architecture August 6, 2004 Certified by: _____________________________________________________________ Brian A. Ciochetti Professor of the Practice of Real Estate Thesis Advisor Accepted by: ____________________________________________________________ David Geltner Chairman, Interdepartmental Degree Program in Real Estate Development
Transcript of Site Selection Criteria in Community Shopping Centers ...Phoenix/Research/MITCRE/MIT Thesis... ·...

Site Selection Criteria in Community Shopping Centers: Implications
for Real Estate Developers
by
Benjamin T. Brubaker Bachelor of Arts French
Brigham Young University, 2001
Submitted to the Department of Architecture in Partial Fulfillment of the Requirements for the Degree
of
MASTER OF SCIENCE IN REAL ESTATE DEVELOPMENT
at the
MASSACHUSETTS INSTITUTE OF TECHNOLOGY
September 2004
© 2004 Benjamin T. Brubaker. All rights reserved. The author hereby grants to MIT permission to reproduce and to distribute publicly paper
and electronic copies of this thesis document in whole or in part.
Signature of Author: ______________________________________________________ Benjamin T. Brubaker
Department of Architecture August 6, 2004
Certified by: _____________________________________________________________
Brian A. Ciochetti Professor of the Practice of Real Estate
Thesis Advisor
Accepted by: ____________________________________________________________ David Geltner
Chairman, Interdepartmental Degree Program in Real Estate Development

2
Site Selection Criteria in Community Shopping Centers:
Implications for Real Estate Developers
by
Benjamin T. Brubaker
Submitted to the Department of Architecture on August 6, 2004 in Partial Fulfillment of the Requirements for the Degree
of
MASTER OF SCIENCE IN REAL ESTATE DEVELOPMENT
at the
MASSACHUSETTS INSTITUTE OF TECHNOLOGY ABSTRACT The purpose of this paper is to investigate retail site selection criteria in community centers and ascertain the implications of these criteria for the retail real estate developer. Historically, real estate developers contemplating the development of a community center will acquire a site based on hunches, experience, and a limited amount of data. Real estate academics, on the other hand, have produced numerous mathematical models and methods for retail site selection. However, to the real estate developer the retail community shopping center has remained elusive. Not only will developers oftentimes face the prospect of site selection without a complete picture of who their tenants will be, but they will be left to their own experience to understand in depth the needs and preferences of typical community center tenants. This paper will explore current methods and site selection criteria used by leading community center tenants for site selection and will investigate how that information can be implemented by the developer to improve the ir approach to retail site selection. Thesis Supervisor: Brian A. Ciochetti Title: Professor of the Practice of Real Estate

3
Acknowledgements: I express my heartfelt gratitude to the following individuals: To Jay Timon, CRE Class of 1998 for his inspiring attitude of giving back, for all his time, his unexpectedly generous level of academic and financial support he provided during the thesis process, and for making the thesis process much more of a learning, eye-opening, and fun experience than I thought was possible. To all the retailers, developers, brokers and planners who generously spent time speaking with me and made this study possible. To Tony Ciochetti for his insight and time. And especially to my wife for her patience, loving support and encouragement.

4
TABLE OF CONTENTS
CHAPTER 1: INTRODUCTION .............................................................................................................................5
CHAPTER 2: COMMUNITY CENTERS DEFINED .......................................................................................9
CHAPTER 3: EVOLUTION OF MODELS USED IN RETAIL SITE SELECTION............................16
ADVANTAGES AND DISADVANTAGES OF USING SPATIAL INTERACTION MODELS.................................... 20 OTHER METHODS USED IN RETAIL SITE SELECTION...................................................................................... 23
Regression Models..............................................................................................................................................24 Enhanced Analog Models..................................................................................................................................25
CHAPTER 4: NEED FOR MORE INFORMATION .......................................................................................26
CHAPTER 5: METHODOLO GY ..........................................................................................................................29
CHAPTER 6: FINDINGS ........................................................................................................................................31
USE OF MATHEMATICAL MODELS ...................................................................................................................... 31 SITE AND LOCATION CRITERIA............................................................................................................................... 33
Visibility................................................................................................................................................................33 Access....................................................................................................................................................................36 Traffic....................................................................................................................................................................38 Site Size and Character......................................................................................................................................39 Parking..................................................................................................................................................................40 Co-Tenancy..........................................................................................................................................................41
DEMOGRAPHICS....................................................................................................................................................... 43 Income ...................................................................................................................................................................44 Education..............................................................................................................................................................45
COMPETITION........................................................................................................................................................... 45 Consumer Search Behavior...............................................................................................................................46 New Markets ........................................................................................................................................................46
TRADE AREA DEFINITION...................................................................................................................................... 50 COMMUNITY CENTER TENANT CATEGORIZATION AND COMPARISON....................................................... 52
CHAPTER 7: CONCLUSION................................................................................................................................55
REFERENCES .............................................................................................................................................................57
APPENDIX A ..............................................................................................................................................................59
APPENDIX B ...............................................................................................................................................................61

5
CHAPTER 1: INTRODUCTION
Real estate developers make few decisions that are as crucial as selecting the site of their
next development. This decision will affect which tenants will be interested in locating
in the center, which consumers will frequent the center, and the sales volumes of all the
tenants who choose to locate in the center. In short, the decision will largely determine
the success or failure of the project and will determine whether the developer and
investors in the project will in fact realize negative, average or superior returns on their
investment of capital and time.
In past periods of time, retail site selection was relatively straight- forward. Retail nodes
coincided with major city centers and any other lesser concentrations of retail were
simply representative of smaller outlying localities. But today we find ourselves in a
much more complex period of time with respect to successful development and location
of retail development. Retail agglomerations today are located away from city centers
and sometimes in sparsely populated locations. Recent economic changes have been
accompanied by rapidly evolving retail trends which are difficult to predict, making
estimating the success of a new retail outlet equally as challenging.
In response to the increasing complexity of modern retail site selection, academics and
entrepreneurs, since the early 1930’s, have been inventing and reinventing complex
models to better predict and measure the propensity of any retail site to succeed. From

6
the early gravity model Reilly revealed in 19291 to the location allocation and spatial
interaction models of today, these methods allow the mathematical delineation of trade
areas and forecasting of sales volumes to some degree of accuracy. This being the case,
the retailer today that uses these models will still combine the ir results with the subjective
judgments and managerial experience which continue to be extremely important to the
site selection process. On paper, land and space can be treated as relatively
homogeneous; however in reality every site must be considered and analyzed
individually. Even something such as poor access or the inability of the site plan to
accommodate the necessary parking requirements can singularly cause the failure of a
shopping center investment. The subjective component of retail site selection must
certainly be taken into account as time-proven experience as a “gut feeling” will also play
a part in the site selection process.
Community shopping center developers however have been said to be the true “artists” of
site selection. Without retail sales data that typical mid size category killer tenants use
during their site selection process, and armed usually only with publicly available
demographic and competitive information, they are left to sift through the available data
with much discretion to use whatever methodology they choose to try to envision and
find the best site for their community center development.
Improvements in technology and computers are giving developers more options to their
site selection approach. GIS and mapping software is becoming easy to use and much 1 Reilly, “Methods for the Study of Retail Relationships” p. 16

7
more affordable than in the past. Software that once required a professional installation
and tens of thousands of dollars can now be purchased for a couple hundred dollars and
set up on a computer in minutes. In addition, advances in technology and the internet are
making it extremely easy to locate information on retailer outlet locations, competitive
shopping centers etc.
Despite all these new tools, it is important that developers remember that they “should
not attempt to replace their instinctive reaction to a property with research. But they can
no longer afford to depend solely upon that instinct. Effective site selection is neither a
science not an art: It’s a transcendental marriage of the factual parameters and intuitive
passion that define the two disciplines.”2
With this in mind this study will explore the methods and mathematical models that have
been derived by scholars and entrepreneurs in the past. This paper will then attempt to
take the process one step further by conducting direct interviews with retailers, and other
real estate professionals. This will be done in an effort to ascertain what it is that
community shopping center tenants want today, and how they arrive at the conclusion
that a particular location and site is in fact desirable. This study will also determine
whether spatial interaction models and other methods are applied in practice by
community center retailers.
2 Hawkins, “Quantifying the Art of Retail Site Selection” p. 87

8
With a better understanding of what retailers want, and what goes into their prediction
that a new location will be profitable, community shopping center developers will be able
to add to their knowledge base and better understand how to seek out a new community
shopping center site which will be attractive to tenants and ultimately the consumers.

9
CHAPTER 2: COMMUNITY CENTERS DEFINED
A community center has been defined by the Urban Land Institute as follows: “a
community shopping center usually has a junior department store or a discount store as
the major tenant. The community shopping center is typically about 150,000 square feet
of store area but ranges from 100,000 square feet to 450,000 square feet.” The
community shopping center, in terms of size and consumer draw, falls between
neighborhood and regional shopping center. A typical community shopping center
requires a minimum site area of 10 to 40 acres, serves a trade area of 40,000 to 250,000
people within a 10 to 40 mile radius depending on the density of the surrounding area.
Over the last few decades the community center has evolved from the store of thirty years
ago that was usually anchored by a supermarket and a junior department store, to the
larger community center of today with a “big-box” anchor tenant which is likely to be an
large-format off-price discounter, a home improvement store, a furniture warehouse or
some other specialty store that provides a strong consumer draw. (This anchor may be on
a separately owned parcel adjacent to, rather than within the actual development site plan
as developers may capitalize on vacant land surrounding these tenants.)
The community center of today often contains four or more “category killer” mid-size
anchor tenants which add to the draw of the center and encourage cross shopping
between stores. These types of community centers, described in more detail below, will

10
often have a trade area3 that draws from far beyond that of a traditional community
center, will sell an extremely wide range of shopping goods and will often appeal to a
range of income levels wider than was the case for older community centers. Community
center tenants can be divided into roughly four categories:
First, the “big box” anchor tenants previously mentioned which occupy more than
100,000 square feet of space can be grouped together. These tenants will typically either
self-develop on land that they themselves have purchased, or in rare occasions where
other sites are not available, they will build on land that had been leased from the
developer. Examples of these types of tenants are Costco, Home Depot, Kohl’s, Lowe’s,
Sam’s, Target, and of course Wal-Mart.
Secondly, mid sized “category killer” tenants will often be found in community centers.
The space that these tenants prefer to occupy is in the range of 15,000 to 45,000 square
feet. These tenants will occasionally self-develop when locating in a stand-alone
situation, or in other words where they are not integrated into a community center but are
in a single building on a single parcel of land. Especially in recent years these tenants
have a strong preference to locating within a community shopping center. In this
situation they will not own their space but will rather lease the space from the owner of
the center. Tenants such as Barnes and Noble, Bed Bath and Beyond, Best Buy,
Michaels Arts and Crafts, and Old Navy are examples of the types of retailers which fall
into this category. 3 Trade Area is defined as the area from which a strong majority of consumers originate.

11
A third category of retail tenants in community centers are “mini-anchors” which occupy
store sizes of 8,000 to 15,000 square feet. These tenants will not locate in stand-alone
situations and will nearly always lease the space they occupy. Payless Shoe Stores, Petco
and Pier 1 Imports are representative of this category.
Lastly, a community center will usually have a number of small tenants which will locate
within the center. These tenants will occupy less than 8,000 square feet of retail space
and will usually consist of small shops such as small food service, local boutiques, or
wireless phone sales stores.
New community centers continued to experienced great success through the 1990s and
the trend has continued through the first part of this decade. With changing consumer
purchasing habits, continued consolidation of retailers, and the difficulty that retailers are
experiencing in finding the adequate space required for their category killer concepts, the
modern community center has emerged as the answer to all of these trends.
Modern community shopping centers are designed to communicate its particular purpose
and distinguish it from its competitors. Some community center developers will even go
so far as to design the tenant mix to target a narrowly defined demographic or even a
gender of consumer. Community centers which target consumers in higher household
income brackets will often be designed to have the high-end finishes which will seek to

12
communicate the quality that these consumers will seek out. Discount-oriented
community centers will feature many opportunities to cross-shop and compare between
similar retail stores. A female-oriented center will include additional safety and security
features, and female-only concepts such as maternity and women’s fashion. The figure
below describes two examples of a tenant list for community centers.
Table 1: Examples of Tenant Mix within Community Centers
Carson Valley Plaza: Carson City, NV Hartford Ave Center: Bellingham, MA
Major Tenants: Bed Bath and Beyond Best Buy Borders CostPlus World Market Marshalls Old Navy Petsco Pier 1 Imports 702 Scate & Board America’s Mattress Store The Crystal Kaleidoscope Curves for Women Famous Footwear Gamestop Gizmo Wireless Hollywood Beauty Center Oreck Floor Care Sportsclips
Major Tenants: Barnes and Noble The Gap/Gap Kids/Baby Gap Linens N’ Things Payless Shoes Regal Cinema Whole Foods Chili’s Foot Locker Hallmark Cards and Gifts Home Mortgage Company Learning Express Radio Shack Wireless Phone Store
Community centers today will certainly seek to communicate the convenience that
today’s consumers are seeking. As the American economy has experienced a recent
recession and begun to embrace a steady recovery, the shopping habits of consumers
have changed, with shoppers making fewer trips, purchasing more per trip, and seeking to

13
minimize search costs inherent in the shopping experience.4 In response, community
centers have become larger over time, have become more strategic in tenant co- location,
and focused site specific characteristics such as signage and access to ensure a high level
of convenience to the consumers. Additionally, it is not uncommon for community
centers to target an increasingly segmented demographic; a practice which is becoming a
primary characteristic of the modern community center.5
Because the community shopping center is an “in-between” center, with its size falling in
between the regional center and the neighborhood center, it is difficult to categorize in
terms of its market size and drawing power. The community center is often a center
which will adapt to the consumers of the surrounding trade area, as well as adapt in size
and tenant-mix to the corresponding size of the under-served market it targets. Because
the community shopping center offer a wide array of shopping goods, and often
specialized categories of goods, the market area is often less predictable. In the case of
community centers featuring several mid to large size category killer tenants, the draw
may be nearly as large as a regional center.
While community centers feature a wide range of tenants, Table 2 below lists many of the
most popular mid to large size community center tenants today:
4 Franke l, Merrie ,“Sector Spotlight” (http://www.nareit.com) 5 Koslow, “Performance Characteristics of Community Shopping Centers in the United States” p. 3

14
Table 2: Popular Community Center Tenants
24 Hour Fitness Linens N Things Costco
Bally Total Fitness Marshalls Home Depot
Barnes and Noble Michaels Kohl's
Bed Bath and Beyond OfficeDepot Lowe's
BestBuy OfficeMax Sam's
Borders Bookstore Petco Target
Circuit City Petsmart Wal-Mart
Comp-USA Pier 1 Imports BJ’s Wholesale
Copeland Sports Ross Dress For Less
CostPlus World Market Sports Authority
Good Guys Staples
Joanns TJ Maxx
While this list is by no means comprehensive, it does list many of the popular tenants
which are aggressively seeking to expand into new community centers.
Figure 1 displays a typical site plan of a modern community center. Space is designed
for numerous mid size “category killer” tenants, some smaller mini-anchor tenants as
well as many spaces for small shops in line with the mid size tenants as well as in
separate outlying buildings.

15
Figure 1: Site Plan of a Community Center (Sparks Crossing: Sparks, NV)

16
CHAPTER 3: EVOLUTION OF MODELS USED IN RETAIL SITE SELECTION
Of all decisions that community center developers and retailers make, there is no decision
that is more permanent and long reaching than the selection of the actual site. In an effort
to make this decision more quantifiable, the academic community has for many years
sought to improve and implement mathematical models to better understand the
underlying dynamics behind consumer purchasing behavior and ultimately which
locations and sites would most fully take advantage of that behavior.
One of the earliest attempts at developing a formal method for evaluating the potential
attractiveness of retail sit es was that of William J. Reilly. His “Law of Retail
Gravitation” was based on the Newtonian law of gravitation, and predicted the retail trade
area of competing towns, cities and shopping centers using population and distance data.
By applying Newtonian physics which had previously been used to describe the
gravitational pull between two celestial bodies such as planets or moons, Reilly assigned
a degree of “gravitational pull” to each area based on the population of the town or city.
The assumption is made that the amount of retail activity and shop space was directly
proportional to the population of a city or town primarily because nearly all retail activity
in the 1920s and 1930s was located in the center of the city or town, and the amount of
existing retail space was closely related to the size of the municipality. With these
assumptions in place the model could measure the amount of gravitational pull each town
had on potential consumers in the area, and how the two agglomerations affected each

17
other. This model inherently could only be applied to the retail agglomeration trends of
the period in which it was presented. However, this model serves as the basis for
subsequent models which modified Reilly’s method. Reilly defined his model as the
following:
Under normal conditions two cities draw retail trade from a smaller,
intermediate city or town in direct proportion to some power of the
population of these two larger cities and in an inverse proportion to some
power of the distance of each of the cites from the smaller, intermediate
city. In any particular case, the exponents used in connection with
population or distance are dependent upon the particular combination of
retail circumstances involved in that case. Typically, however, two cities
draw trade from a smaller, intermediate city or town approximately in
direct proportion to the first power of the population of these two larger
cities and in an inverse proportion to the square of the distance of each of
the larger cities from the smaller intermediate city6
In mathematical form, Reilly’s law is stated as:
n
b
a
N
b
a
b
a
DD
PP
BB
=
where:
6 Reilly, “Retail Relationships” p.16

18
aB = the percentage of the area’s consumers who will travel to city a
bB = the percentage of the area’s consumers who will travel to city b
aP = the population of city a
bP = the population of city b
aD = the distance in miles form the area to city a
bD = the distance in miles from the area to city b
N = exponent showing relative attractiveness of a larger population size (N = 1 used by
Reilly)
n = exponent showing relative attractiveness of shorter distance (n = 2 used by Reilly) 7
Reilly’s model takes into account both distance and the attractiveness of other shopping
opportunities and is based primarily on the notion that agglomeration tends to increase
the attractiveness of stores, and that agglomeration is represented by high density areas.
Shopping in higher density areas is thus considered more attractive. Based on Newton’s
law of planetary attraction, Reilly’s law of retail gravitation was the first to quantify the
decision consumers must make between the cost of travel and the attractiveness of
alternate shopping opportunities. Today’s spatial interaction models are based on the
concepts introduced by O’Reilly’s gravitation model.
P. D. Converse later modified Reilly’s formula to serve the purpose of determining where
the influence of a retail center was equal to that of a competing center. In other words, 7 Reilly, “Retail Relationships” p. 48

19
Converse sought to find a “breaking point” where consumers would find two centers
equally attractive.8 Once this point had been established the trade areas of each center
could be much more easily defined.
A decade later the Reilly method was again modified to more directly apply the model to
retail shopping centers at a micro level. L. W. Ellwood redefined the model replacing
variables Reilly used with the size of a retail district and drive times to define the utility
perceived by consumers in any given area. Ellwood was the first to create a model which
allowed trade areas to be defined within, rather than between, metropolitan areas.9
The next step in the historical evolution of the gravity or spatial interaction model
resulted in David Huff’s calculation of probability in the late 1960s. Specifically Huff’s
work considered the probability that a consumer living at a particular site will shop at
retail center. Huff argued that when consumers make their shopping choices that they
will consider a number of alternate shopping opportunities and may visit several different
stores at different times rather than visit only one retail center as implied by previous
models. Huff determined that trade area needed to be refined according to calculations of
probability rather than using distinct boundaries. He based his model on the assumption
that the utility of the retail outlet is a function of the size of the retail store and the travel
times from the consumers’ place of residence. Probability that a consumer would visit a
8 P. D. Converse, “New Laws of Retail Gravitation,” pp. 379-384 9 Carn, “Real Estate Market Analysis,” p. 190

20
retail center was then based on the ratio of utility of one store to the sum of all the
utilities of the centers that the consumer considers using for his shopping trip.
Using Huff’s modifications it became possible to divide a geographical area into cells
and subsequently map out and calculate the percentage of households in any given cell of
a map that would be expected to patronize any number of retail centers within a defined
trade area.
Advantages and Disadvantages of Using Spatial Interaction Models
These gravity or spatial interaction models offer many distinct benefits to the site
selection process. Certainly it is valuable to the developer and retailer to have a
methodology for predicting consumer behavior based on the attractiveness of purchasing
at a particular outlet and the distance that the consumer must travel along with other
deterministic variables. Spatial interaction models can be extremely helpful to define
potential trade areas and in this have been empirically shown to be successful and
accurate in this application10. Beyond the definition of trade areas, interactions between
shopping centers or specific retail outlets can be predicted and the results of the
introduction of new centers or outlets can be calculated with a significant degree of
accuracy.
10 Gosh and McLafferty, “Location Strategies for Retail and Service Firms”, p. 93

21
Gravity models offer the advantage of using only a relatively limited amount of data as
they usually only require the use of demographic, population, and competitive
information. They also offer a significant degree of accuracy, and allow for the creation
of multiple “what- if” scenarios so that alternative center and store sizes can be evaluated
as well as the effects of store openings and closings.
Despite the advantages to their users, there are several limitations inherent in spatial
interaction models. In addition to the obvious possibility of analyst error, gravity models
are limited by the assumptions of the model. A gravity model, in large part, explains
store sales primarily on the basis of size and distance which assumes that shoppers will
have a much higher probability to travel to the nearest shopping outlet. However
shoppers may choose for a variety of reasons to shop at another stores including shopping
close to their workplace rather than their home, shopping at a favorite location further
away, or even just enjoying shopping in a store that is less crowded or choosing to shop
based on some other subjective variable.
Because most gravity models are based primarily on size and distance, they are best used
for explaining consumer behavior patterns in the context of convenience and ignore much
of the “consumer destination” characteristics that developers seek to create in today’s
shopping centers.

22
Architecture, for example can come into play and significantly affect sales volumes.
Mike Perry, a developer known for his use of high-quality architecture and detail in his
neighborhood and community centers stated that “It’s all about the volume! If the tenants
do the volume then the high rents you charge don’t matter.” By using timeless, albeit
expensive architecture Mike Perry and his associates have been able to drive more
volume to their shopping centers, enough to justify rent rates 20% above normal and
result in extremely low vacancy rates in their centers. This is just one example of how
factors which affect consumer purchase behavior cannot always be quantified through
mathematical methods, and how models must be taken with a proverbial grain of salt, as
least from the developers’ perspective.
Another limitation of gravity models is due to the proliferation of non-traditional stores.
These stores typically have many competitors with locations closer to their consumers.
Due to the convenience, cost-savings, successful advertising or reputation or other
characteristics of these large-format stores, consumers will often choose to shop at them
and bypass the stores offering proximity but not the other characteristics which draw
consumers to these popular retail outlets. Thus, large format stores such as Costco selling
food in bulk, or organic and natural food stores such as Whole Foods, as well as large-
format combination superstores (which commonly serve as a super anchor to a
community center) are changing the behaviors of consumers and introducing numerous
additional variables which affect the consumer shopping decision.

23
Finally, gravity models are limited to retailers whose profile facilitates the application of
the model. When moving beyond trade area projections to sales forecasting, gravity
models are limited by their need for the estimation of sales potential and relatively
precise competitor sales data. While sales data for grocery stores can be relatively
straight- forward, and can be estimated with a relative degree of accuracy and ease by
consultants, visiting competitive grocers, or by querying developers, the same cannot be
said for other retail formats. Each retail company may carry different brands, target a
completely different demographic, and guard closely their individual store sales data.11
Other Methods used in Retail Site Selection
Aside from gravity models, other methods have relied on surveys of consumer shopping
patterns through actual personal polling. These methods have now evolved with
technology and are facilitated by the strategic use of POS (point of sale) data. In 1932
while working for the Kroger Co., William Applebaum laid the foundations of this
approach called “customer spotting” and created the “analog” technique for estimating
sales at potential new sites. The work of Applebaum has been very influential in the
establishment of a system of data collection on consumer travel patterns, expenditures,
and site characteristics and has been very influential on the methods that are currently
used by researchers and major retailers today. The analog and regression models both
use POS data and represent some of the most commonly used methods today.
11 Buckner, “Site Selection: New Advancements in Methods and Technology” p.168

24
Regression Models
Regression models are commonly used in retail sales forecasting when scrutinizing one
or more sites as a potential location. A regression model uses multivariate statistical
analysis (with the help of a computer) to isolate the variables that appear to be most
significant. In the case of retail site selection these variables would be identified as the
variables having the most (positive or negative) effect on retail sales volumes. These
variables would then be assigned a coefficient in an equation such as:
CBAY 689.232.1709.3.94 −++=
Where Y could represent sales per household, A could represent the median age, B could
represent median household income, and C could represent proximity to competition.
Other variables could include: level of education, average household income, level of
home ownership and other demographic characteristics within certain radii.
Once the regression model is tested and determined to significantly and appropriately
predict sales data, the user then uses the statistically derived coefficients combined with
the equivalent variables characteristic of the potential site, within the derived regression
equation which will then predict sales at any proposed location.

25
Enhanced Analog Models
The analog model is one of the most common procedures used today for retail sales
forecasting. The enhanced analog model is similar to regression analysis in many ways.
Using POS data and other publicly available data as a basis, a correlation between weak
or strong store sales and numerous variables is derived and significant variables are
identified. The significant variables for each store are compiled into a series of analog
tables which summarize the variables and the associated sales levels by geographic unit.
Sales are typically analyzed by small geographic areas such as zip codes (see Table 3
below). These tables are used whenever a new site is considered by examining the tables
and identifying which set of current stores, and even which parts of other stores’ trade
areas (i.e. by zip code) best match parts of the trade area of the new location. The
characteristics and sales trends of these stores are then used to predict the sales of the new
store.
Table 3: Example of Analog Table Data For a Retail Store 12
12 Actual analog tables might contain many more variables including demographic variables such as type of household, and situational characteristics such as access and parking
Zip Code Driving Distance
2003 Population
Median Household
Income % College Graduate
Capture Rate Sales Per Capita
Sales 99501 1.20 28382 $37,905 8.9% 14.7% $441,000 $15.54 99502 2.00 18923 $49,042 19.6% 20.5% $615,000 $32.50 99503 2.60 31937 $45,024 6.5% 5.5% $165,000 $5.17 99504 5.00 27501 $54,350 28.1% 22.5% $675,000 $24.54 99505 6.20 19303 $51,965 14.7% 5.7% $171,000 $8.86 99506 7.50 27239 $44,234 9.2% 3.5% $105,000 $3.85 99507 9.20 19303 $47,987 7.9% 2.5% $75,000 $3.89 99508 10.40 18728 $43,002 8.2% 3.3% $250,000 $13.35 99509 12.60 33002 $55,002 31.1% 10.1% $510,000 $15.45
Trade Area Totals 224318 $428,511 14.9% 88.3% $3,007,000 $13.41

26
CHAPTER 4: NEED FOR MORE INFORMATION
As community centers are inherently a conglomeration of retail stores it might seem
intuitive that the bulk of current literature addresses the site selection process from the
retailers’ perspective. It is, after all, each individual retailer that has access to their own
proprietary sales data which is required to implement the use of an analog, regression, or
gravity model based forecast of future sales in any definitive way. These community
center tenants will also be the ones who make final decisions on where to locate, what
rent level they are willing to pay, and whether or not they are willing to build ahead of
anticipated demand in order to ensure that they can locate strategically.
However where retailers have the last word, it is the developer who has the first say and
must take the first steps in deciding where a new community center will be built. Very
little literature exists to assist the developer in his navigation through, and
implementation of technologies and models which exist today. Additionally, without the
proprietary sales and consumer data that the retail companies understandably guard
closely, the developer is left to make the site selection decision based on publicly
available data such census data. Developers can supplement this information by
compiling their own sources such as up-to-date new home construction information
available from the local planning offices or statistics derived from postal drop counts
from the local post office, or even information on new utility meters installed by the local
utility company.

27
Given the lack of practical literature on site selection methodologies from the developer
perspective it is essential that the typical community center tenants be identified and that
their individual site selection criteria are understood to the greatest extent possible
recognizing again the limitations implied by the unavailability of POS or sales data.
With a sound understanding of what tenants are each individually looking for in a new
location, and how they each evaluate what it is that makes a certain site desirable, the
retail community shopping center developer can then make much more educated
decisions regarding potential community center locations.
Literature addressing the empirical implementation of mathematical models and/or the
application to community centers and especially power or super community centers
specifically is also extremely sparse. As previously mentioned, many of the described
models work best with shopping centers who focus primarily on convenience and draw
from a more immediate vicinity. However, community centers draw from a large trade
area, do not rely on the size of the surrounding retail community for its draw as the
strategic tenant mix and other characteristics of the center will often create much of its
own gravitational pull.
Thus, community centers make for difficult “animals” upon which to overlay
mathematical models. POS and other proprietary data readily available to a retailer
through tracking their own consumers (or relatively easily obtainable data such as for

28
grocery stores) is not readily obtainable for the real estate developer seeking to develop a
new community center. As such, it is important for the developer to understand the site
selection habits of the major retail tenants typically found in today’s community centers.

29
CHAPTER 5: METHODOLOGY
As previously stated, community center site selection is a difficult and ambiguous
process for the developer. Despite the many models and site selection methods have
been some of which have been described previously, and despite all the experience
retailers have gained through the implementation these methods, the process remains
elusive. There is no one accepted process or method for retail site selection and certainly
not for today’s community shopping centers. In practice, the methodology used by
today’s retailers includes many of the traditional and more rudimentary methods of
feeling, and experience-tempered logic which have been recently combined with
advanced technologies and spatial- interaction models.
The community shopping center developer, however has fewer options. Beyond
employing consultants, and purchasing demographic data specific to the area surrounding
a potential site, the developer has fewer sources to draw on for assistance in the site
selection process. Certainly there is a lack of literature addressing the developer and
ways that he can leverage knowledge about community center tenants and use current
advances in retail site selection methodologies to his benefit.
With this in mind this study sought to better understand the practices of many of the
leading community center tenants by contacting them directly and conducting interviews
with real estate department executives, regional directors, and research staff.

30
Additionally, real estate developers, municipal planners, and brokers were also
interviewed to add additional perspective on the community center site-selection process.
The list of questions which were used during the interview process is included in
Appendix A. A specific list of the people contacted and who contributed information to
this thesis is included in Appendix B.

31
CHAPTER 6: FINDINGS
The specific criteria and methodology with which a specific site will be judged by a
retailer varies significantly. While most retailers will depend on mathematical models to
some degree, most limited their use and depend heavily on site specific variables. Each
retailer focuses on the characteristics of individual sites and settings, the demographics of
the local market, and attributes specific to the design of the development site plan.
Consideration of competition is also extremely important and will not only influence
which market tenants will be willing to enter, but will also influence the identification of
existing retail nodes and facilitate the identification of existing markets which are
underserved.
Use of Mathematical Models
As discussed previously, most of the mathematical spatial interaction models used in site
selection are difficult to apply to community centers. While these models do have their
usefulness, the strong destination characteristic of the community center, the draw
created by strategic tenant mix, and changing consumer habits have made it very difficult
for retailers to depend on these models for anything but preliminary analysis.
The actual degree to which the mathematical models were actually used by retailers
varied greatly. For example, Michael’s Arts and Crafts has an extremely small real estate

32
department compared to other retailers, consisting of only four real estate representatives
for the entire country, without any other dedicated research support staff. Companies
with such lightly staffed real estate departments are very dependent on brokers and
potentially developers for any analysis other than drawing circles around potential sites
and looking at basic demographic data. Mindful developers will go to greater lengths to
educate these types of tenants on accurate demographic data and local growth trends.
Other retailers, such as Ross and Staples have many retail representatives, with a few
people dedicated to the implementation and use of proprietary systems which combine
GIS mapping infrastructure with software which is capable of running several different
scenarios and will produce sales forecasts based on analog or spatial interaction models,
or even a combination of both. Developers approaching these retailers may need to
attempt to control numerous sites or have sought out additional data sources pertaining to
demographics critical to each particular retailer. Additional information on the number
of small businesses in an area, for example would be of key importance to an office
supply store such as Staples.
With some exceptions, very few of the retailers interviewed seemed to take full
advantage of modern technology and the available methodologies to this degree. Most of
the community center tenants do use some form of analog or regression models to
forecast sales in a new location, but are dependent on local brokers for the definition of
their trade areas. Some brokers will employ in-house mapping staff and will approach
trade area delineation with a degree of rigor. Others will use a less technology intensive

33
approach and will make trade area delineation decisions using basic maps and time
proven, albeit subjective, logic.
Seeking and monitoring up-to-date information population and other demographic
information pertaining to a local market, the integration of such data with GIS software,
and a working knowledge of how retailers forecast sales can all improve the chances of a
developer attracting these tenants.
Site and Location Criteria
Each community center tenant expressed obvious concern about the character and
desirability of a given site. While many pertinent issues will be discussed each site is
unique and will have its own unique attributes which will be of concern or interest to the
tenants. A knowledge of the individual tenants preferences will not only facilitate
negotiation and site planning for the developer, but when synthesized contribute
significantly to an understanding of critical success factors in site selection for the
community center as a whole.
Visibility
All tenants want to ensure maximum visibility of their storefront. In fact about 90% of
the typical community center tenants will want to be located at the end cap (see Figure 3)

34
of an in- line designed site plan. 13 This will obviously create some difficult negotiation
for the real estate developer to determine which tenant will be given the end locations. It
is especially desirable to tenants who sell entertainment items such as books, CDs, and
Electronics to be located in a highly visible location as their products can often be
characterized as impulse purchase items, meaning that consumers will stop at these store
in an impromptu visit more frequently than at other typical retail community center
stores. Thus, signage and in- line location are crucial to driving this type of traffic.
Figure 2: End Cap Diagram (Carson Valley Plaza: Carson City, NV)
Signage is an important concern to all community center tenants. Tenants will be
concerned with community approvals and regulations which may affect the size of their
storefront sign. Some retail tenants such as electronics retailer Best Buy, have a large 13 Interview Gary Johnson, Colliers International
End Cap Position

35
prototypical sign and will be concerned with any community or regulatory resistance to
the installation of their sign.
Often community centers will be designed with numerous pads which will be often be
sold to tenants rather than leased. The cash flow resulting from the sale of these pads will
often represent a large proportion of the anticipated developer profit. As such, the
developer will frequently design as many pads as possible which may affect the visibility
of the in- line tenants.
Large community center signage that lists the major tenants of the center, and are visible
to adjacent major throughways, may compensate for a lack of optimal visibility caused
either by inherent site characteristics or by the pads of the center. Again, the location of
signage and pads will be of primary concern to major tenants and the desires of the
tenants will very likely become part of the lease negotiation and result in language being
included in the actual lease document to ensure that agreements between tenant and
developer concerning visibility are documented and enforceable.
Community center developers will need to ensure that each site that is considered will
accommodate visibility and signage requirements to ensure that the community center
site plan accommodates these needs prior to contacting potential tenants.

36
Access
Community center retailers will all want to ensure that shoppers’ movements are
expedited to and from the center. To facilitate this, retailers will look for multiple ingress
and egress points. Two major intersections with a fully signalized traffic signals leading
into the community center is characteristic of the optimal type of ingress/egress retail
tenants will desire. Additionally, protected left-turn signals into the center will be
greatly valued by all tenants, but especially those who cater primarily to a female
demographic (such as Bed Bath and Beyond, Marshalls etc.) and who value more highly
any site characteristic which will communicate a feeling of security to the consumer.14
Ideally, the center will not only address major through ways, but will also include access
to and from any adjacent communities on lesser roads. Other concerns regarding access
include curb cuts directly into the site, turn lanes, egress acceleration lanes, and driveway
width and length within the site which affects the number of cars which can comfortably
enter and exit the site at one time. Figure 3 below shows an example of an efficient
ingress/egress design in a community center.
The overall design and flow of cars within the center will also be of concern to the
tenants. Any “creative” parking and driveway design will need to be rigorously
scrutinized by the developer as it could easily become a deterrent to the retail tenant. In
addition to the direct access concerns, surrounding traffic infrastructure should be
examined. An under-built highway off or on-ramp or other inadequate piece of 14 Interview Ralph Czitrom, Bed Bath and Beyond

37
infrastructure which causes frequent traffic build-up can drastically affect the desirability
of shopping at a particular community center.
Figure 3: Community Center Access (Carson Valley Plaza: Carson City, NV)
Pedestrian traffic is also a concern. The site plan should include wide crosswalks in safe
locations, and should include sidewalks which are wide enough to facilitate cross-
shopping between tenants. Columns and posts in these sidewalks should be examined to
ensure that they do not obstruct visibility from one store to another, as well as take into
consideration the access requirements of strollers and wheelchairs.
Lanes accommodate entering and exiting traffic during high volume hours without significantly affecting traffic within immediate proximity to retailer storefronts
Fully signalized access with a protected left turn is optimal

38
Traffic
Community centers are usually located on major arteries and as such developers are
concerned about the average daily traffic counts (ADT) of these arteries. Developers are
consistently concerned with ADTs, and look for ADTs in the range of 30,000 to 40,000
average cars or more per day in suburban areas. Traffic counts represent a significant
point of disagreement among major community center tenants. While some consider
traffic counts significant, other community center tenants concern themselves very little
with ADTs. Albeit a good measure of consumer exposure, ADTs can be elusive and
should not be taken without considering their context. From the retailers’ perspective
other measures such as demographic measures and daytime population may overshadow
ADTs. Traffic can also become a negative characteristic. Developers should beware of
congested arteries which may have a high ADT, but will nevertheless detract from the
overall consumer shopping experience at the community center.
Developers should pay attention to which side of the street the center will be located. It
is usually desirable for the community shopping center to be on the “going home” side of
the street as consumers returning from work are much more apt to engage in a shopping
experience after work as oopposed to before. In addition to current traffic counts,
projected traffic counts and the location of future infrastructure are very important to
understand from the developer’s perspective. Many centers have been constructed in the
past without full consideration of the impacts of future plans for infrastructure changes

39
and additions, and suffered severely as a result.15 The local department of transportation,
or regional transportation center will provide crucial insight into the location and timeline
for the addition to or change of existing transportation infrastructure, and will often have
a 10 or 20 year plan which will assist developers in the evaluation of future sites, and
potentially provide leverage when negotiating with retail tenants. Figure 4 demonstrates
an example of infrastructure changes advantageous to the developer.
Figure 4: Future Infrastructure Changes and the Shopping Center Site
Site Size and Character
The site size and must be large enough to create the kind of co-tenancy and draw that
retailers find so valuable in super community centers. Most “category killer” tenants
15 Interview Gary Johnson, Colliers International
Future Major Arterial Road Will Drive Traffic to Site

40
want to locate in community centers that are at least 200,000 to 300,000 square feet in
size which will allow at least five or six mid size category killer anchors to co- locate.
For most centers a relatively flat site is most desirable, although sometimes mild
topography can enhance the site visibility. A rule of thumb for the site slope is that is
should typically not exceed 5%.16
Parking
“I want to see it, get to it, and park in front of it” is the way Bill Lehman, a retail real
estate representative for TJ Maxx described their primary site-related concerns when
looking for a new location. Most retailers have a general rule of thumb that they will
require 5 spaces per 1,000 square feet of gross retail area. Zoning requirements typically
will only require 4 parking spaces per 1,000 square feet of retail space. This ratio will be
somewhat flexible for some tenants and will be strictly defended by others. Stores selling
home goods or electronics or other goods which may be bulky and heavy will be
especially concerned with parking ratios and will want to stay away from typical
community center “parking hogs” such as restaurants, movie theaters, and fitness
facilities.
Stores which target a female demographic will also want to ensure that their consumers
have enough parking available close to their store and that the parking area is well- lit,
open and makes their consumers feel secure when exiting and entering their cars. Large 16 White, “Shopping Centers and Other Retail Properties” p. 128

41
Community Center tenants who experience large spikes in sales during seasonal periods
will also be more concerned with parking and may require a higher parking space /
square feet of gross retail space ratio to accommodate the heavy seasonal demand for
parking.
Developers must carefully examine each potential site to ensure that they can meet the
parking needs of the ir future tenants, and must keep in mind the different desires of their
tenants even before a site plan has been drawn up. If only the minimum parking ratio
required by zoning can be accommodated, the developer may experience difficulty in
attracting tenants or may find themselves seeking to acquire more land or reducing the
amount of retail space available. Such mid-project changes may have significant impacts
on the project proforma, and returns to investors and the developer.
Co-Tenancy
As gravity models attempt to embody, community centers are built to create a draw or
pull by uniting and combining the attractive qualities of several retailers in an effort to
increase the overall number of consumers which frequent a shopping center. Though
gravity models have difficulty in predicting this gravity amidst modern changes in
consumer habits, “gravity” is one of the primary advantages embodied by the community
center featuring 5 or 6 mid size category killer tenants. This “gravity” can be described
in part as the attractive synergy that results from the exposure and cross-shopping that

42
occurs due to the strategic mix of tenants. While the advantages of co-tenancy are
straight- forward, the dynamics are often tricky. A developer, in an effort to please his
tenants, will have to work through each retailer’s co- location and co-tenancy concerns
while negotiating leases with tenants.
Most community center retailers are concerned with being located near other uses such as
theater, restaurant, and health clubs which will monopolize the parking needed to ensure
that their consumers will be able to park conveniently. Many mid to large size
community center retailers will often negotiate a requirement that they be at least 150 to
200 feet from these types of uses. Nevertheless, other retailers such as bookstores and
other entertainment oriented retailers will have much less reservation about being near
movie theaters and restaurants as they may be able to feed off the atmosphere of these
tenants. On the other hand, off-price fashion retailers will be much more concerned
about being adjacent to restaurants because they value the security that a convenient
parking spot close to the store implies. These stores also may be concerned about food
being brought into their stores which could result in the soiling of their product.
Sometimes a particular retailer will not want to be next to other uses which they feel
reflect negatively on their image. A retailer such as a bath and linen store targets higher
income households with more disposable income, and as a result wants to ensure that
their consumers are comfortable and are able to enjoy the look and feel their store strives
to create. Being located adjacent to a pet store, a toy store, office supply store or a dollar
43
store may be viewed as detracting from this image. However when retailers are able to
locate adjacent to other uses which target the same demographic, the synergy between
tenants and the propensity to cross-shop is increased among the adjacent tenants. Soft
goods stores such as community center arts and crafts stores prefer to be next to other soft
goods stores such as Cost Plus, Pier 1, or off price fashion stores such as Marshalls or TJ
Maxx, as all of these uses appeal primarily to women within a similar age and income
range.
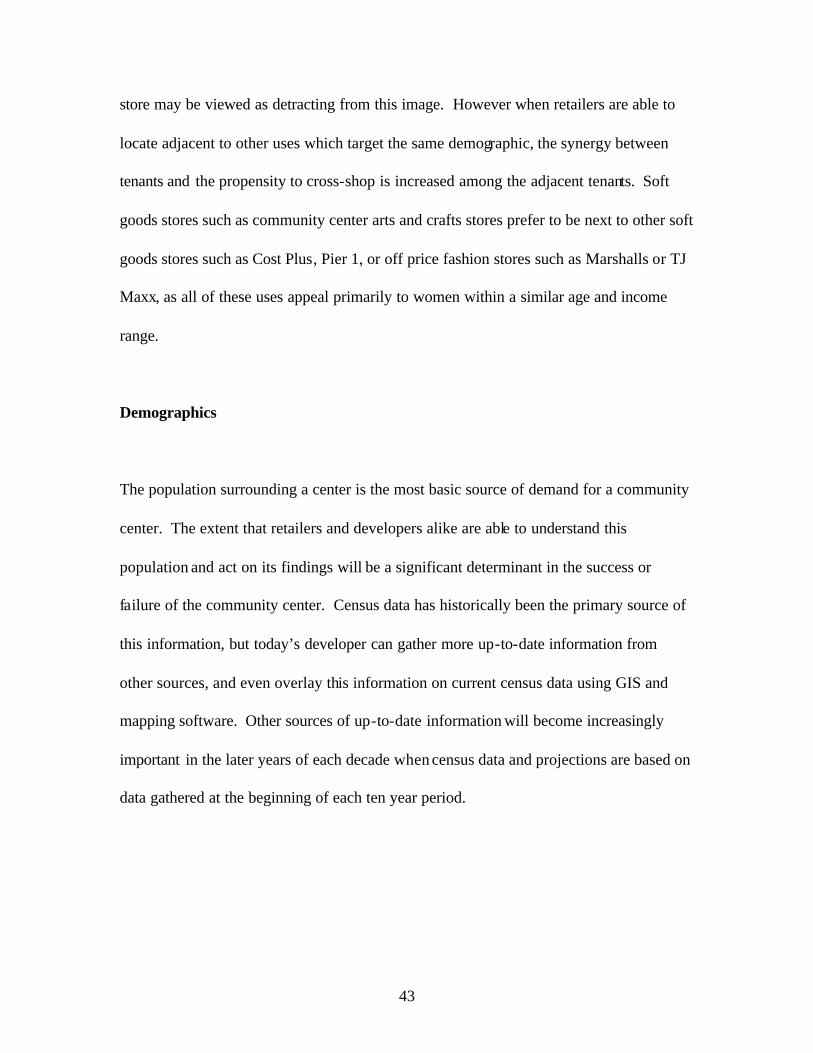
Demographics
The population surrounding a center is the most basic source of demand for a community
center. The extent that retailers and developers alike are able to understand this
population and act on its findings will be a significant determinant in the success or
failure of the community center. Census data has historically been the primary source of
this information, but today’s developer can gather more up-to-date information from
other sources, and even overlay this information on current census data using GIS and
mapping software. Other sources of up-to-date information will become increasingly
important in the later years of each decade when census data and projections are based on
data gathered at the beginning of each ten year period.

44
Income
The level of income in a surrounding area is an important variable in evaluating a market
as it is directly correlated with the amount of disposable income that the surrounding
population possesses and thus the aggregate retail sales volumes that can be anticipated.
Some retailers will be concerned with the average median income in the defined trade
area. Tenants whose products target a higher income level such as high end home, soft,
or recreation goods will seek a minimum number of households whose income is above a
certain level before being willing to locate at a particular community center. It is
important, however that household income be considered in conjunction with other
demographics. For example a high income area without many home owners may not
result in an adequate sales volume for stores such as large hardware stores, furniture
stores, and other home related goods, whereas a large electronics retailer like Best Buy
might not be as concerned about home ownership as long as disposable incomes were
high.

45
Education
Although income may be a strong indicator of education, certain retailers will want to
look at education alone. Booksellers such as Borders and Barnes and Noble will be very
interested in areas where the education levels of the trade area population are above
average. Highly educated populations will have different shopping characteristics than
populations with lower levels of education, and will purchase, for example, significantly
more books per capita.
Competition
The location of direct competitors will play a key role in the sales projections generated
by the implementation of analog, regression models. Developers will need to map out the
locations of retailers and their competitors to better understand the retail landscape.
Combined with a knowledge of tenants’ trade area requirements (see Table 4) this
practice will facilitate a better understand ing which tenants will be successful in their
center by where potential tenants will locate with respect to their competition and their
existing stores.

46
Consumer Search Behavior
Some typical community center tenants will be willing to locate even next door to
competitors as long as the trade area of the center is large enough to support both stores.
Rather than being a question of which store will outperform the other, these stores will
both benefit by drawing consumers who value the opportunity to search and compare.
This will be especially true of two stores which offer similar types of goods but whose
variety is such that the same item will rarely be found in a competitors store. For
example Cost Plus World Market will not necessarily object to being located in the same
center as a Pier 1. Similarly, a TJ Maxx will not necessarily object to being located in the
same center as a Ross Dress for Less. However Borders books falls into the category of
retailer who would almost certainly not co- locate with a competitor such as Barnes and
Noble as the overlap of identical goods would be too great and the consumer search
behavior would not be deemed significantly beneficial.
New Markets
Although many community centers are located on the suburban fringe where the
agglomeration of category killer retailers creates enough retail draw to support the new
retail node, most of these tenants will also create a strategic plan which will identify
existing markets which they will target for entry. Although this information will be
guarded, retailers often will be ready to act fast to enter a market ahead of competitors.

47
In many cases retailers will build ahead of the market, exchanging insufficient current
demographics for forecasted future sales, and a strategic location. While some
community center retailers will be willing to locate up to two or even three years ahead of
a rapid growth market, most will typically limit their advance to only 18 months to a
maximum of two years. It is common practice for mid-size community center tenants to
need to justify a new location to their corporate offices by showing proforma projections
which recoup initial location costs within three years. As a result most category killer
retailers will not be able to justify the risk associated with building more than a couple of
years ahead of even a very strong growth market.
Often retailers will have to consider the trade off between optimal location and optimal
timing. When a retailer decides to enter a market early they will have a strong chance of
locating in the “best” location, and in the better community center in terms of access,
visibility etc. By waiting to enter a market until demographics are adequate, the retailer
may not have to wait for the population to be large enough to support the sales
projections needed for the store to generate an adequate return. However, the trade-off is
often significant and the retailer may have to locate in a sub-optimal shopping center.
One example would be being left to locate in a center which is not located at the principal
intersection, but might be located adjacent or behind the “best” shopping center. With a
complete list of why a proposed shopping center will be the “best” the developer can
better attract credit community center tenants.

48
Additional negotiating power can be gained when the developer has obtained a complete
picture of a local market’s anticipated population growth. Retailers will be highly
dependent on census or other public database information, and will base many of their
projections on forecasts based on this data. As such, the data used by retailers will often
lag in accuracy from the information that can be obtained by scrutinizing a local area
more closely. A developer may obtain a much clearer picture of the local market by
creating a complete list of residential developments under construction, partially built,
and recently completed. This information is available at the local planning office. By
paying attention to the number of lots approved for each development, the number of lots
currently built and recorded, the number of units sold, and the date when each
development was approved, the developer can project more accurately residential growth
rates within his community center’s projected trade area. This information can be
extremely useful when soliciting potential community center tenants. (See Figure 5 for a
an example of how this information can be used graphically.)

49
Figure 5: Residential Activity Mapping 17
17 Source: Nevada Small Business Development Center, University of Nevada, Reno

50
This being said, this practice of anticipating future growth when making site selection
decisions is not used universally as in the case with Michael’s Arts and Crafts for
example. Having built stores based on anticipated population growth in the past, today
they will no longer locate in a community center until current demographics can justify
the new location.
Trade Area Definition
The trade areas of category killer type tenants will differ greatly from the trade area of the
entire community center. An understanding of the draw and trade area of each retail store
will enable the developer to better identify “holes” in the current market and assist them
in the site selection process. There is great variation in the ways that typical large
community center tenants will project their trade areas. The simplest of which is to
define the trade area by mapping out radii (for example 3, 5 and 8 miles) then attribute a
certain capture rate for each circle (for example 30%, 20%, and 5%) and continue with
the sales forecasting process using analog, regression or other calculations. It is common
for community center retailers with more sophisticated research departments to use point
of sale (POS) data from other stores to project the geographical draw of a store and
overlay those projections on a new location. POS data is also often used to project how
store trade areas will be cannibalized by new stores as well as by the entry of direct
competitors.

51
Regardless of the degree of sophistication, community shopping center tenants will
depend heavily on local brokers to assist in evaluating and integrating the location of
physical and psychological barriers, actual drive times in the vicinity, as well as local
access and driving habits into the definition of the actual trade area. This will often be a
collaborative process where the preferred broker and real estate representative will sit
down and graphically integrate the broker’s local expertise with a retailer’s empirical
projections. While this process is very logical and has historically been accomplished
without much assistance from computers, the process is becoming more disciplined with
the assistance of GIS database and mapping programs. A GIS mapping program will
facilitate the rapid mapping of a retailers present locations, their competitors’ current
locations, and will allow the displaying of various trade area scenarios. More
sophisticated retailers will have an integrated system which will link a GIS system to
their sales forecast models. For example, each of three potential new locations could be
mapped out within a metropolitan area. Then trade area and the resulting sales
projections would be modeled for each location including the consideration of various
scenarios such as the entry of a competitor in certain locations or the closing of a
current ly operating store, and the resulting trade area and sales forecasts could be
modeled “on the fly” allowing a much more complete evaluation and prioritization of
potential sites. Figure 6 shows an example of a trade area defined around a community
shopping center.

52
Figure 6: Community Trade Area Diagram Example
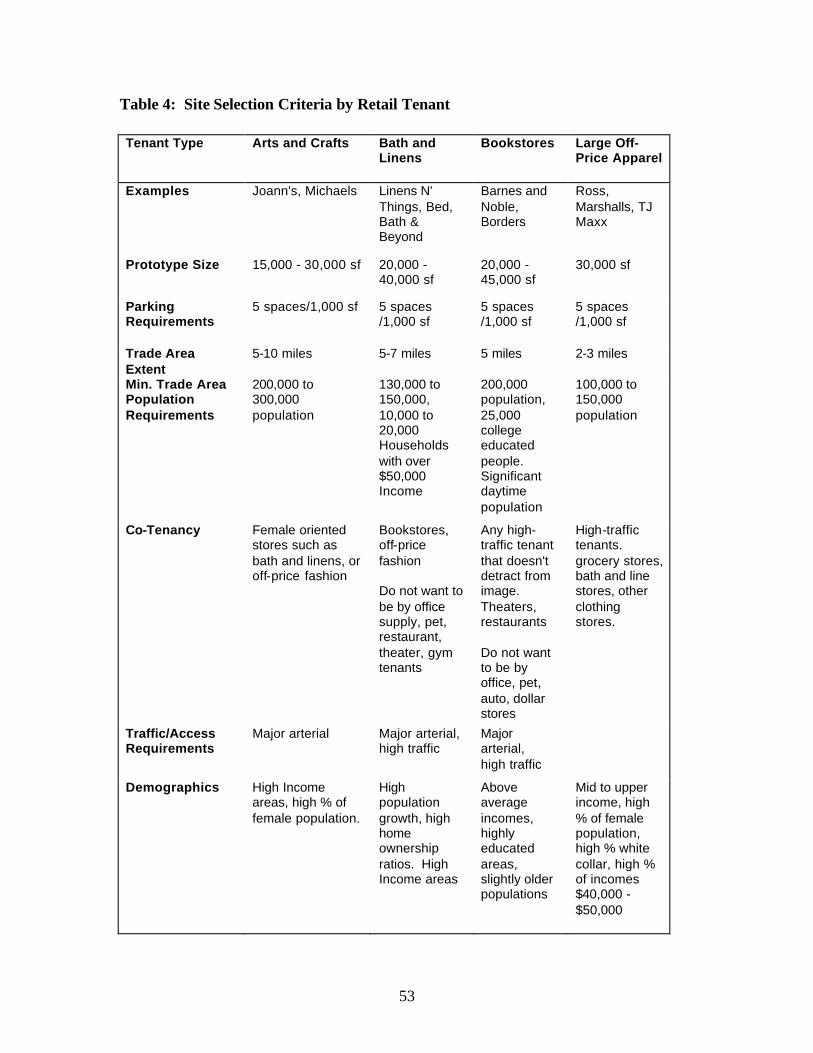
Community Center Tenant Categorization and Comparison
While many differences between tenants have been discussed, it is important to point out
that tenants can be grouped into categories with their competitors to identify similarities
in site selection criteria. The following table summarizes many of the site selection
criteria of the tenants which were interviewed as part of this study:
53
Table 4: Site Selection Criteria by Retail Tenant
Tenant Type Arts and Crafts Bath and Linens
Bookstores Large Off-Price Apparel
Examples Joann's, Michaels Linens N' Things, Bed, Bath & Beyond
Barnes and Noble, Borders
Ross, Marshalls, TJ Maxx
Prototype Size 15,000 - 30,000 sf 20,000 -40,000 sf
20,000 - 45,000 sf
30,000 sf
Parking Requirements
5 spaces/1,000 sf 5 spaces /1,000 sf
5 spaces /1,000 sf
5 spaces /1,000 sf
Trade Area Extent
5-10 miles 5-7 miles 5 miles 2-3 miles
Min. Trade Area Population Requirements
200,000 to 300,000 population
130,000 to 150,000, 10,000 to 20,000 Households with over $50,000 Income
200,000 population, 25,000 college educated people. Significant daytime population
100,000 to 150,000 population
Co-Tenancy Female oriented stores such as bath and linens, or off-price fashion
Bookstores, off-price fashion Do not want to be by office supply, pet, restaurant, theater, gym tenants
Any high-traffic tenant that doesn't detract from image. Theaters, restaurants Do not want to be by office, pet, auto, dollar stores
High-traffic tenants. grocery stores, bath and line stores, other clothing stores.
Traffic/Access Requirements
Major arterial Major arterial, high traffic
Major arterial, high traffic
Demographics High Income areas, high % of female population.
High population growth, high home ownership ratios. High Income areas
Above average incomes, highly educated areas, slightly older populations
Mid to upper income, high % of female population, high % white collar, high % of incomes $40,000 - $50,000

54
Table 4 (Continued): Site Selection Criteria by Retail Tenant Tenant Type Mainstream
Electronics Office Supply
Wholesale Clubs
Large-Format Discount Stores
Examples Best Buy, Circuit City
Staples, Office Depot
BJ's Wholesle, Sam's, Costco
Target, Wal-Mart
Prototype Size 20,000 - 45,000 sf
20,000 - 30,000 sf
100,000-175,000 sf
90,000 to 140,000 sf Super Centers: 140,000 to 200,000 sf
Parking Requirements
6 spaces/1,000 sf (accomodates seasonal shopping)
5 spaces/1,000 sf
5.5 to 6 spaces/1,000sf
4 to 6 spaces/1,000sf
Trade Area Extent
5-10 miles 5 miles Suburbs: 3 - 20 miles
Walmart: min: 3 miles Target: min 5 miles
Min. Trade Area Population Requirements
250,000 population
150,000 population plus 5,000 small businesses
75,000 population
100,000 to 250,000 population
Traffic/Access Requirements
Major arterial Major arterial, high traffic
Major arterial Major arterial (40,000+ADT)
Demographics Growth areas, high Incomes,
High income areas, large proportion of small business activi ty
Higher % of high household income, especially Target. Avoids extremely high or extremely low incomes

55
CHAPTER 7: CONCLUSION
With a better understanding of leading community center tenants, including their site
selection criteria and methodologies, the real estate developer can better understand what
attributes, and which information will best serve him in the community center site
selection process.
Although the literature and findings of this study support the argument that retailers with
similar market, demographic and site requirements do not always approach the site
selection process in similar ways, It is still important that the developer understand the
methods used. Armed with today’s technology the developer can then quickly map out
tenant locations in a given market, estimate their trade areas, and visualize underserved
markets. With an understanding of a desired tenant’s strong site preferences, the
developer can then seek out a site which meets those requirements adequately. With an
understanding of how POS and demographic data is used, the developer will be better
equipped to approach lease negotiations, and better understand which sites will be better
suited to certain tenants.
As has been previously stated, the retail site selection process is still very much a process
of feeling and instinct. However the advantages that today’s technology, a better
understanding of what retailers want, and having sought out a working knowledge of how

56
these retailers estimate sales and trade areas will be essential factors in the success of a
future community center development.
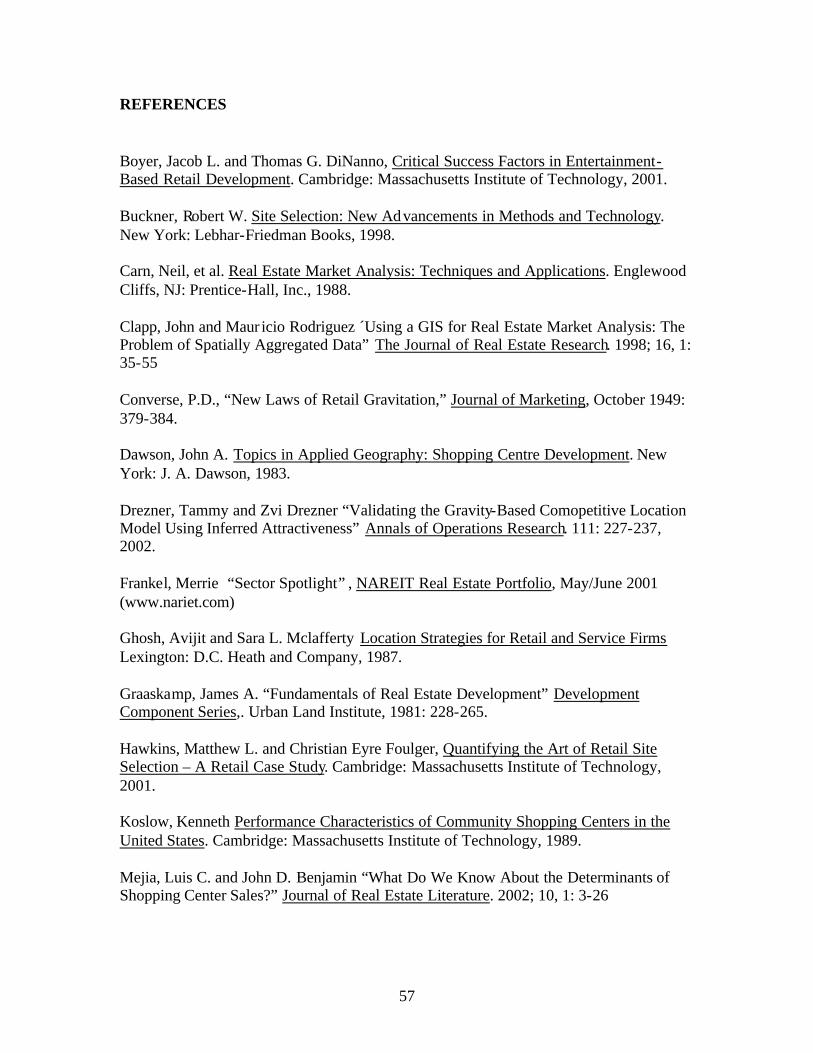
57
REFERENCES
Boyer, Jacob L. and Thomas G. DiNanno, Critical Success Factors in Entertainment-Based Retail Development. Cambridge: Massachusetts Institute of Technology, 2001. Buckner, Robert W. Site Selection: New Advancements in Methods and Technology. New York: Lebhar-Friedman Books, 1998. Carn, Neil, et al. Real Estate Market Analysis: Techniques and Applications. Englewood Cliffs, NJ: Prentice-Hall, Inc., 1988. Clapp, John and Maur icio Rodriguez ´Using a GIS for Real Estate Market Analysis: The Problem of Spatially Aggregated Data” The Journal of Real Estate Research. 1998; 16, 1: 35-55 Converse, P.D., “New Laws of Retail Gravitation,” Journal of Marketing, October 1949: 379-384. Dawson, John A. Topics in Applied Geography: Shopping Centre Development. New York: J. A. Dawson, 1983. Drezner, Tammy and Zvi Drezner “Validating the Gravity-Based Comopetitive Location Model Using Inferred Attractiveness” Annals of Operations Research. 111: 227-237, 2002. Frankel, Merrie “Sector Spotlight” , NAREIT Real Estate Portfolio, May/June 2001 (www.nariet.com) Ghosh, Avijit and Sara L. Mclafferty Location Strategies for Retail and Service Firms Lexington: D.C. Heath and Company, 1987. Graaskamp, James A. “Fundamentals of Real Estate Development” Development Component Series,. Urban Land Institute, 1981: 228-265. Hawkins, Matthew L. and Christian Eyre Foulger, Quantifying the Art of Retail Site Selection – A Retail Case Study. Cambridge: Massachusetts Institute of Technology, 2001. Koslow, Kenneth Performance Characteristics of Community Shopping Centers in the United States. Cambridge: Massachusetts Institute of Technology, 1989. Mejia, Luis C. and John D. Benjamin “What Do We Know About the Determinants of Shopping Center Sales?” Journal of Real Estate Literature. 2002; 10, 1: 3-26
58
Meyer, Terry G. “Site Selection VS. Site Evaluation: Techniques for Locating Retail Outlets” Real Estate Issues. Spring/Summer 1988; 13, 1: 25-28 O’Mara, W. Paul, et al. Developing Power Centers. Washington D.C.: ULI-The Urban Land Institute, 1996. Reilly, William J. Methods for the Study of Retail Relationships. Austin: Bureau of Business Research, University of Texas, 1929. Reilly, William J. The Law of Retail Gravitation. New York: Knikerbocker Press, 1931. Roca, Ruben A. Market Research for Shopping Centers. New York: International Council of Shopping Centers Schmitz, Adrrienne, and Deborah L. Brett. Real Estate Market Analysis: A Case Study Approach. Washington D.C.: ULI-the Urban Land Institute, 2001. Taneja, Sunil “Technology Moves In” Chain Store Age. May 1999: 136-137 Tayman, Jeff and Louis Pol “Retail Site Selection and Geographic Information Systems” Journal of Applied Business Research. Spring1995: 46-54 Urban Land Institute Dollars and Cents of Shopping Centers Special Report, Washington, D.C.: ULI-the Urban Land Institute, 1994. Valley, Matt “The Crate and Barrel Story: Unpacking the Secrets to a Successful Store or Shopping Mall” National Real Estate Investor. May 25, 2001. White, John R. and Kevin D. Gray Shopping Centers and Other Retail Properties. New York: John Wiley $ Sons, Inc., 1996.

59
APPENDIX A: RETAILER INTERVIEW QUESTIONS
General Approach
1. What steps do you go through to analyze a potential site? What are your preliminary steps before getting to the site level?
2. What is the level of collaboration with developers during the site selection process? [Do you have “preferred developers” that you work closely with? Do you just wait for developers to come to you? What is the preferred method? What is the most common method?]
3. Where do you draw the line between data and demographics and what sites are available? [No sites in the perfect target area are available, how close is close enough?]
Demographics
1. What demographics are the most important in site selection for your stores? In what order of priority?
2. What are your trade area population requirements? What are other demographic requirements you have for a new store?
3. What requirements do you have for future population growth and demographic trends?
4. What is the target demographic for your store? 5. Do you actively seek out co-tenancy with stores with similar demographics?
Trade Area
1. What methodology do you use to define and project your trade area? 2. How do define your primary and secondary market? 3. How important are drive times when defining you consumer base and trade area?
Competition
1. How does your site selection help you combat the entry of competitors into an area?
2. How does the ideal site protect you from your competition? 3. What impact does your competition have on your site selection? 4. Do you strategically and actively look for sites without nearby sites where
competitors can locate? 5. Who are your competitors? 6. To what degree do you build ahead of the market? 7. What are you willing to sacrifice to get into a market first?
60
8. What population growth rates do you look for? 9. Would you ever co- locate with competitors or would that cannibalize sales? 10. How do you decide if you’re willing to co- locate with competitors?
Site/Infrastructure
1. What are some examples of optimal / deal killer site configurations? What priority?
2. What are the optimal access requirements that you look for in a site? 3. What infrastructure requirements are unique to your store? Parking, Adjacencies,
Signage etc. Covered walks are good/bad, frontage, distance to street etc. 4. Do differences in consumer travel costs come into play in different markets?
What do you look for in terms of transportation infrastructure? 5. What is the minimum projected sales volume needed to support a store? What
population in a trade area is required for that? Typical trade area size? 6. What size of center is most desirable, what are the preferred co-tenants, are there
any non- intuitive undesirables? 7. How important is a major thoroughfare? Can traffic be a problem rather than a
positive aspect? How do you quantify the problems associated with bad left turns into the site?
8. How do traffic forecasts and forecasted changes change things? How do you forecast the impact of a major traffic change? e.g a new overpass is projected?
9. Do you build ahead of the traffic or monitor and only go in when traffic is sufficient
10. If access changes in the future how do you react? 11. Rent trends across the country. Are there substantial differences? What justifies
that difference when developers costs alone do not? 12. What economic and cost factors would definitely cause you to have to raise your
prices? What economic factors would or have justified accepting higher than expected rent agreements?
13. What factors would cause you to negotiate lower rents? How do you estimate desired rents in a new area?
14. How do you deal with increasing construction costs? Smaller formats? Fewer stores? Shorter lease agreements? Etc.

61
APPENDIX B: PROFESSIONALS INTERVIEWED:
Barton, John Staples Bonnenfant, Brian University of Nevada, Reno Boyer, Glen Ross Dress For Less Czitrom, Ralph Bed Bath and Beyond Farrel, Brandon Safeway Johnson, Gary Colliers International Lehman, Bill TJX Lent, Pam Borders Marquette, Gary Michael’s Arts and Crafts Mimi Moss Douglas County Planning Department Perry, Mike Wall Street Partners Pyzel, Rob City of Sparks Planning Department Simonsen, Tim Prime Commercial Timon, Jay AIG Baker LLC Zurmely, Dean Target Other Contributers Darus, Greg OfficeMax Tehtmeyer, Marilyn Ross Dress for Less


![A Determinant of Community Shopping Malls as Tourists ...projects for real estate developers since 2008 [4]. Community shopping malls have gained popularity due to lifestyles changes](https://static.fdocuments.us/doc/165x107/602332a330b3466eae0e4282/a-determinant-of-community-shopping-malls-as-tourists-projects-for-real-estate.jpg)


