Site Inventory and Hydropower Energy Assessment of Reclamation ...
68
U.S. Department of the Interior Bureau of Reclamation Power Resources Office Denver, Colorado March 2012 Site Inventory and Hydropower Energy Assessment of Reclamation Owned Conduits Supplement to the “Hydropower Resource Assessment at Existing Reclamation Facilities Report”
Transcript of Site Inventory and Hydropower Energy Assessment of Reclamation ...

U.S. Department of the Interior Bureau of Reclamation Power Resources Office Denver, Colorado March 2012
Site Inventory and Hydropower Energy Assessment of Reclamation Owned Conduits Supplement to the “Hydropower Resource Assessment at Existing Reclamation Facilities Report”

Mission Statements The mission of the Department of the Interior is to protect and provide access to our Nation’s natural and cultural heritage and honor our trust responsibilities to Indian Tribes and our commitments to island communities. The mission of the Bureau of Reclamation is to manage, develop, and protect water and related resources in an environmentally and economically sound manner in the interest of the American public.

U.S. Department of the Interior Bureau of Reclamation Power Resources Office Denver, Colorado March 2012
Site Inventory and Hydropower Energy Assessment of Reclamation Owned Conduits Supplement to the “Hydropower Resource Assessment at Existing Reclamation Facilities Report” Prepared by Michael Pulskamp Power Resources Office

Acknowledgments
Acknowledgments This report was sponsored by the Bureau of Reclamation’s Power Resources Office; however several individuals were instrumental in developing the data and analysis for this study. We wish to acknowledge the following Reclamation staff for their support: Robert Ross, William Cole, Tom Ryan, Don Bryce, Neil Anderson, Clark Bishop, Talmadge Oxford, and Brian Campbell. We would also like to acknowledge staff at Idaho National Laboratory (INL) who played a critical role in providing guidance, analysis, and review of the site assessments. The INL staff that contributed to this report were: Doug Hall, Todd Haynes, and Joseph Petersen.
i

Abbreviations and Acronyms
ii
Abbreviations and Acronyms AAO Albuquerque Area Office BFO Bend Field Office CCAO Central California Area Office DKAO Dakotas Area Office ECAO Eastern Colorado Area Office EFO Ephrata Filed Office GP Great Plains Region KBAO Klamath Basin Area Office LC Lower Colorado Region NKAO Nebraska-Kansas Area Office MP Mid Pacific Region MTAO Montana Area Office NKAO Nebraska-Kansas Area Office OTAO Oklahoma-Texas Area Office PAO Provo Area Office PN Pacific Northwest Region PXAO Phoenix Area Office SCCAO South-Central California Area Office SRAO Snake River Area Office USFO Upper Snake Field Office UC Upper Colorado Region WCAO Western Colorado Area Office WYAO Wyoming Area Office YAO Yuma Area Office
Contents
Contents Page
Background ............................................................................................................. 1 Purpose .................................................................................................................... 2 Considerations for Developers ................................................................................ 2 Data Collection ....................................................................................................... 3 Data Analysis .......................................................................................................... 5 Data Quality Assurance .......................................................................................... 6 Results ..................................................................................................................... 6 Results by Region ................................................................................................. 12 Great Plains Results .................................................................................. 13 Upper Colorado Results ........................................................................... 37 Lower Colorado Results .......................................................................... 43 Mid-Pacific Results .................................................................................. 49 Pacific Northwest Results ........................................................................ 55 Graphs and Tables Graph 1 - Seasonality of Sites By Region .............................................................. 5 Table 1 - Energy and Capacity Potential By Region ............................................. 7 Table 2 - Energy and Capacity Potential By State ................................................. 7 Table 3 - Top 25 Sites by Energy Potential ........................................................... 8 Table 4 - Top 25 Sites by Installed Capacity ....................................................... 10 Table 5 - Great Plains Summary Data ................................................................. 14 Table 6 - Upper Colorado Summary Data ........................................................... 38 Table 7 - Lower Colorado Summary Data ........................................................... 44 Table 8 - Mid-Pacific Summary Data .................................................................. 50 Table 9 - Pacific Northwest Summary Data ........................................................ 56 Appendices Appendix A – Sites Removed from Analysis Appendix B – Sites With Additional Data Needs Appendix C – Notes For Analyzed Sites Appendix D – Detailed Site Evaluation Results Appendix E – Site Maps
iii

Report Content
Background On March 24, 2010, the Department of the Interior, the Department of Energy, and the Department of Army entered into a Memorandum of Understanding (MOU) with the purpose of enhancing the coordination of their efforts to provide the Nation with affordable, reliable, and environmentally sustainable hydropower. This Hydropower MOU consists of numerous initiatives including an action item to conduct Federal facility energy resource assessments, and under this direction Reclamation conducted a study called the Hydropower Resource Assessment at Existing Reclamation Facilities (Resource Assessment) that gauged hydropower development potential at existing Reclamation facilities. This study was published in March 2011, and is available for download at (http://www.usbr.gov/power). The Resource Assessment updated the Reclamation portion of the “Potential Hydropower Development at Existing Federal Facilities” study completed in May 2007 under Section 1834 of the Energy Policy Act of 2005 (1834 Study). While the 1834 Study satisfied the requirements of Sec. 1834, it did not include many small and low head sites due to several screening processes. The updated Resource Assessment utilized the 530 identified sites in the 1834 Study, but analyzed the hydropower potential of all of those sites regardless of size. Additionally, the Resource Assessment incorporated updated economic and technical analyses including detailed turbine selections, green incentives, proximity to transmission, and analysis of regulatory/environmental constraints. Of the 530 identified sites, 191 were determined to have some level of hydropower potential, and 70 of those sites showed some economic potential to be developed. The Resource Assessment shows that approximately 268 MW and 1.2 million MWh of energy could be produced annually at existing Reclamation facilities if all 191 sites with the technical potential for development were developed. A total of 225MW of installed capacity and 1.0 million MWh of energy could be produced annually at existing Reclamation facilities if all sites with a benefit cost ratio greater than 0.75 were developed. The Resource Assessment, however, did not fully capture the hydropower potential of all Reclamation conduits. For example, a large portion of the canals that were listed in the 1834 Study did not identify a specific drop or drops in the canal and simply listed the head differential along the entire stretch of the canal (sometimes over tens of miles). Elevation changes in canals and tunnels can occur over short or long distances and field investigations were needed to determine net head. Additionally, not all canal drops were identified in the 1834 Study, and the scope of the Resource Assessment did not include site visits for evaluating new sites. Further study outside of the scope of the Resource Assessment was necessary to clearly identify canal sites and their hydropower
1

Report Content
potential. As a result, Reclamation embarked on a phase II study called the “Site Inventory and Hydropower Energy Assessment of Reclamation Owned Conduits, a Supplement to the Hydropower Resource Assessment at Existing Reclamation Facilities”, (“Supplemental Assessment Report”). Concurrent to Reclamation’s study of hydropower potential on conduits, Idaho National Laboratory’s Water Energy Program (INL) was tasked with identifying hydropower potential on conduits across the Nation. Under the auspices of the 2010 Hydropower MOU, Reclamation and INL worked together to produce this report.
Purpose This Supplemental Assessment Report builds off of the Resource Assessment, and identifies potential hydropower sites on Reclamation owned conduits and determines those sites’ capacity and energy potential. In addition, this study identifies proximity to distribution/transmission lines, and provides site maps for the identified sites.
Considerations for Developers
Although Reclamation reserves the right to develop hydropower at non-powered Reclamation sites, this report can aid irrigation districts, cities, municipalities, cooperatives and other nonprofit organizations financed through the Rural Electrification Act of 1936 in their decision making process to determine whether further analysis of a site’s hydropower potential may be warranted. As with any non-federal hydropower development on Reclamation facilities, existing project water deliveries must not be negatively impacted by a proposed hydropower project. Protections to ensure that water deliveries would not be negatively impacted would be addressed in either a Lease of Power Privilege or a Federal Energy Regulatory Commission (FERC) License and would at a minimum include requirements that the project be designed to ensure continued water delivery in the event of a powerplant outage. Since Reclamation owned conduits are often operated and maintained by local irrigation districts, it is highly recommended that developers involve those stakeholders in the project. Licensing jurisdiction for hydropower development at Reclamation facilities is held with either Reclamation through its Lease of Power Privilege process or FERC through its licensing and exemption procedures. Licensing jurisdiction is dependent on the authorizing legislation for the respective project, and jurisdiction for any particular project would be determined in accordance with procedures established pursuant to an existing Memorandum of Understanding between Reclamation and FERC. In some cases existing statutes, contracts or agreements grant power development rights or preference to entities at a specific project.
2
Report Content
Data Collection
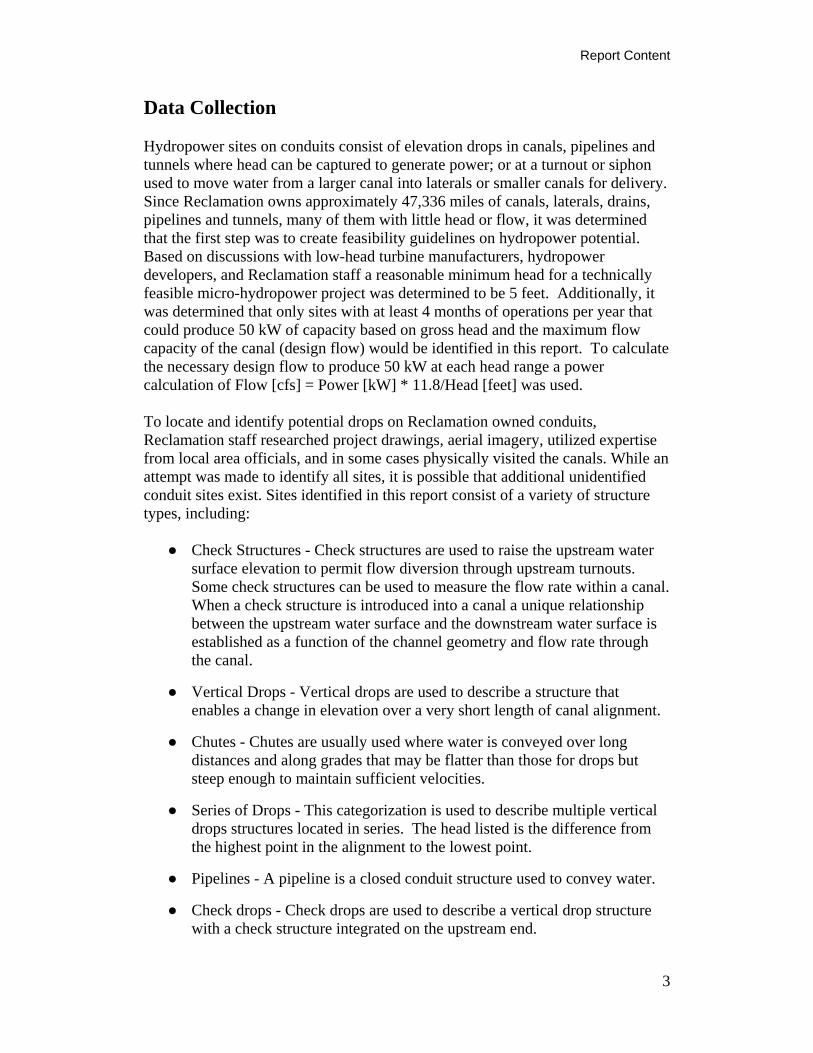
Hydropower sites on conduits consist of elevation drops in canals, pipelines and tunnels where head can be captured to generate power; or at a turnout or siphon used to move water from a larger canal into laterals or smaller canals for delivery. Since Reclamation owns approximately 47,336 miles of canals, laterals, drains, pipelines and tunnels, many of them with little head or flow, it was determined that the first step was to create feasibility guidelines on hydropower potential. Based on discussions with low-head turbine manufacturers, hydropower developers, and Reclamation staff a reasonable minimum head for a technically feasible micro-hydropower project was determined to be 5 feet. Additionally, it was determined that only sites with at least 4 months of operations per year that could produce 50 kW of capacity based on gross head and the maximum flow capacity of the canal (design flow) would be identified in this report. To calculate the necessary design flow to produce 50 kW at each head range a power calculation of Flow [cfs] = Power [kW] * 11.8/Head [feet] was used.
To locate and identify potential drops on Reclamation owned conduits, Reclamation staff researched project drawings, aerial imagery, utilized expertise from local area officials, and in some cases physically visited the canals. While an attempt was made to identify all sites, it is possible that additional unidentified conduit sites exist. Sites identified in this report consist of a variety of structure types, including:
● Check Structures - Check structures are used to raise the upstream water surface elevation to permit flow diversion through upstream turnouts. Some check structures can be used to measure the flow rate within a canal. When a check structure is introduced into a canal a unique relationship between the upstream water surface and the downstream water surface is established as a function of the channel geometry and flow rate through the canal.
● Vertical Drops - Vertical drops are used to describe a structure that enables a change in elevation over a very short length of canal alignment.
● Chutes - Chutes are usually used where water is conveyed over long distances and along grades that may be flatter than those for drops but steep enough to maintain sufficient velocities.
● Series of Drops - This categorization is used to describe multiple vertical drops structures located in series. The head listed is the difference from the highest point in the alignment to the lowest point.
● Pipelines - A pipeline is a closed conduit structure used to convey water.
● Check drops - Check drops are used to describe a vertical drop structure with a check structure integrated on the upstream end.
3

Report Content
To identify the available flows at each site, Reclamation and irrigation district personnel provided seasonal, monthly or daily flow information when available. Actual flows occurring in Reclamation conduits are variable, and while the design flow was useful in screening for possible sites, it is not very reliable when looking for the actual energy and capacity potential of a site because it may significantly overestimate a site’s potential. Flow records through canals and tunnels are often recorded and monitored by Reclamation or U.S. Geological Survey (USGS) gages, but Reclamation also contacted local irrigation districts, local authorities or irrigation districts for additional flow data. In some instances local districts had electronic or hard copy flow data, and these flow data were used for the analysis. In other cases, local officials provided monthly or seasonal estimates for average flow at these sites. Since the availability of flow data varied per site, it is important to understand the level of precision of the data used to calculate the capacity and energy potential at each site. For many sites, historical daily data were available, and in these cases there was a high level of confidence in its accuracy because the daily, seasonal and annual variability of flows were clearly captured. For sites where historic daily data were not available it was necessary to rely on local knowledge for typical flows. When monthly average flows were used there was less precision in the data, but some of the annual variability in the canal operations were still captured. For sites where local area knowledge of seasonal averages was used, the data confidence level and the corresponding confidence in the capacity and energy results are lower. The level of data utilized for each site is provided in the tables below. In many cases, site visits to the canals were conducted to confirm the site location, available head, and whether any distribution lines were in the immediate vicinity. It should be noted that while proximity to distribution lines is identified, it is outside of the scope of this report to make a determination regarding whether these distribution lines were sufficient to interconnect to a new hydropower facility. Every site that was sent forward by the Reclamation field offices was assigned an Object ID to easily track the data; however not all of the sites that were sent forward had the necessary head or design flow to be included in the final results. Additionally, some sites that were sent in as individual sites were combined into a single site after discussions with the area offices. 128 sites were removed from the report for these reasons but are catalogued in Appendix A. Additionally, flow estimates were not available for 44 of the identified sites. For these sites the capacity and energy potential were not able to be calculated. These sites, including the available information on head and the maximum canal design flow, are catalogued in Appendix B.
4

Report Content
Data Analysis When sufficient data were collected on site location, head, flow and access to distribution lines these data were processed utilizing the Hydropower Assessment Tool and site maps were created. The Hydropower Assessment Tool is designed to size a plant by utilizing a 30% flow exceedance to eliminate unusual flow events and to act as a first cut at sizing a plant economically to capture the most constant flow. Different exceedance percentages can be selected for sizing the hydropower plant, which could increase or decrease the plant capacity. Changing the plant capacity would effectively change the amount of energy the plant can generate and also change the costs to develop, operate, and maintain the plant. This 30% exceedance is appropriate as a first cut for the majority of hydropower sites, but Reclamation conduits are primarily operated for irrigation purposes and most of these conduits only have seasonal flows. Graph 1 below displays the breakdown of the identified sites and their typical number of operating months and indicates that the vast majority of sites identified in this report operate for 7 months or less. Due to this seasonality, it was determined through discussions with INL and Reclamation staff that it would be appropriate to lower the flow exceedance for this analysis to 15%. This allowed for the capture of more of the seasonal flow, and captured more of the available energy and capacity at all sites.
Graph 1: Seasonality of Sites by Region
0
20
40
60
80
100
120
140
160
180
200
4 5 6 7 8 9 10 11 12
Num
ber of Sites
Number of Operating Months
PN
MP
LC
UC
GP
5

Report Content
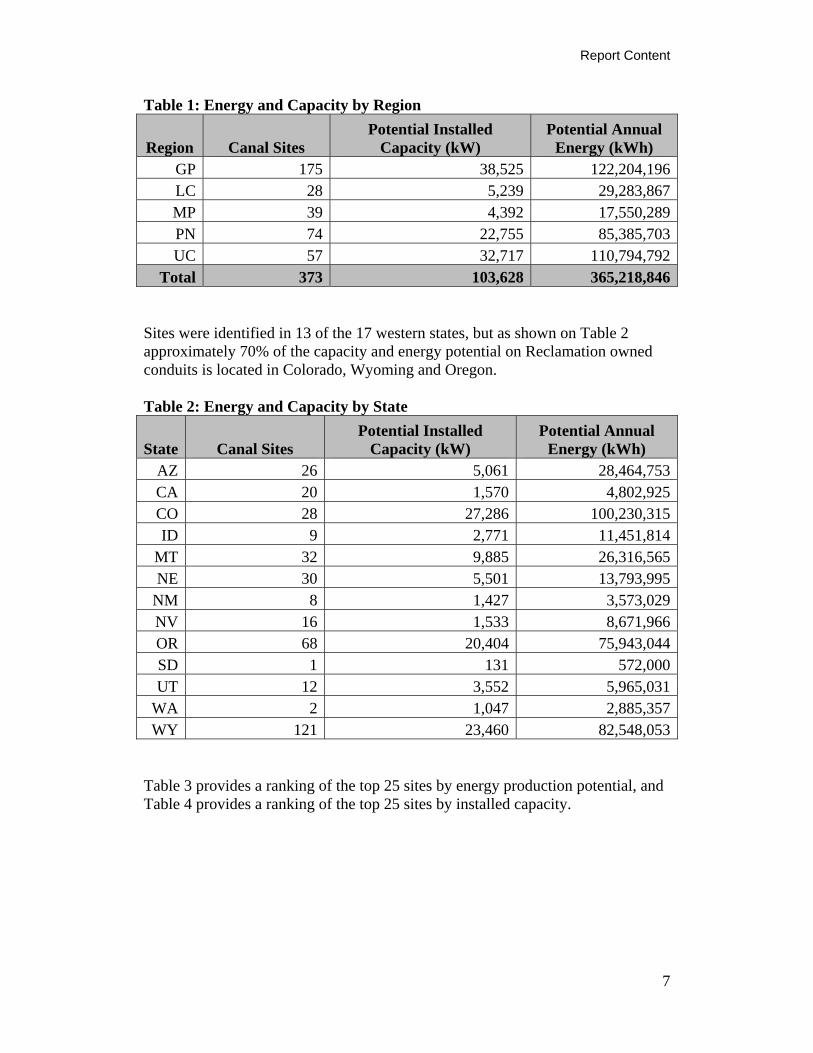
As was demonstrated in the Resource Assessment, most sites that operate seasonally do not have positive benefit cost ratios for hydropower development since the generators sit idle for large periods of time during the year. Since the Hydropower Assessment Tool was designed using broad economic assumptions associated with developing hydropower using conventional technologies it may not necessarily capture all of the site specific benefits of developing seasonal small hydropower on a conduit. For instance, in remote locations where pumping plants are needed to move water, transmission expenses can be very large and hydropower development may decrease the costs of providing power for these pumping loads. Additionally, new technologies are being developed and deployed specifically for small conduit hydropower. This could significantly decrease the costs of development, operation and maintenance at these sites and subsequently increase their economic viability. As a result of the factors listed above, the Supplemental Assessment Report focuses on identifying the technical potential of hydropower development based on each site’s available head, flow, and proximity to transmission/distribution lines, but does not provide an economic benefit cost analysis. The report identifies capacity and generation potential; as well as site maps, the number of months of potential generation for each site1, and their proximity to transmission or distribution lines. Data Quality Assurance After INL and Reclamation processed data through the Hydropower Assessment Tool, Reclamation conducted a thorough review of the data and model results, including a review of the site maps, reported head, reported flow, modeled capacity and modeled energy results of each identified site. A listing of site specific head and flow notes for each site is included in Appendix C. Results The results of this study show that 103,628 kW of potential capacity and 365,218,846 kWh of potential generation are available at 373 identified sites on Reclamation canals. As shown on Table 1, although sites were identified in every Reclamation region, the sites identified in this report with the highest energy generation potential are in the Great Plains, Upper Colorado and Pacific Northwest regions.
1 “Number of months of potential generation” counts a month if more than 2% of the potential annual generation occurs in that month.
6
Report Content
7
Table 1: Energy and Capacity by Region
Region Canal Sites Potential Installed
Capacity (kW) Potential Annual
Energy (kWh) GP 175 38,525 122,204,196LC 28 5,239 29,283,867MP 39 4,392 17,550,289PN 74 22,755 85,385,703UC 57 32,717 110,794,792
Total 373 103,628 365,218,846 Sites were identified in 13 of the 17 western states, but as shown on Table 2 approximately 70% of the capacity and energy potential on Reclamation owned conduits is located in Colorado, Wyoming and Oregon. Table 2: Energy and Capacity by State
State Canal Sites Potential Installed
Capacity (kW) Potential Annual
Energy (kWh) AZ 26 5,061 28,464,753CA 20 1,570 4,802,925CO 28 27,286 100,230,315ID 9 2,771 11,451,814
MT 32 9,885 26,316,565NE 30 5,501 13,793,995
NM 8 1,427 3,573,029NV 16 1,533 8,671,966OR 68 20,404 75,943,044SD 1 131 572,000UT 12 3,552 5,965,031
WA 2 1,047 2,885,357WY 121 23,460 82,548,053
Table 3 provides a ranking of the top 25 sites by energy production potential, and Table 4 provides a ranking of the top 25 sites by installed capacity.

Top 25 Sites by Energy Potential
Table 3: Top 25 Sites by Energy Potential
Rank Object
ID Region State Canal Site
Name Structure
Type
Potential Annual Energy (kWh)
Potential Installed Capacity
(kW) Plant
Factor
Months of Potential
Generation
1 386 UC CO Shavano
FallsVertical Drop 20,549,889 5,168 46% 7
2 387 UC CO
South Canal
Drop 4 Chute 18,653,967 4,242 51% 7
3 379 UC CO Salt Creek
Drop 2 Chute 10,578,729 3,643 34% 54 124 GP WY Pilot: 25.7 Chute 9,200,057 2,938 36% 5
5 122 GP WY
Heart Mountain
Ralston Chute upper: 0+00 Chute 8,221,222 2,425 39% 7
6 26 GP MT
Arnold Coulee
Drop, Pishkun
CanalVertical Drop 8,030,780 3,246 29% 6
7 389 UC CO
South Canal
Drop 6 Chute 7,410,479 1,685 51% 7
8 391 UC CO Pipe Chute at 1058+00 Pipeline 7,187,372 2,029 41% 7
9 378 UC CO Salt Creek
Drop 1 Chute 7,055,833 2,411 34% 5
10 27 GP MT
Pishkun Res Inlet
DropVertical Drop 6,759,974 3,174 25% 6
11 524 PN OR
North Unit Main
Canal Mile 45.02
Vertical Drop 6,266,652 1,714 43% 7
12 121 GP WY
Heart Mountain
Ralston Chute lower:
146+98 Chute 5,829,592 1,720 39% 7
13 525 PN OR
North Unit Main
Canal Mile 47
Vertical Drop 5,089,258 1,392 43% 7
14 67 GP WY Frannie
Canal Chute 4,672,272 1,084 50% 7
8

Top 25 Sites by Energy Potential
9
Rank Object
ID Region State Canal Site
Name Structure
Type
Potential Annual Energy (kWh)
Potential Installed Capacity
(kW) Plant
Factor
Months of Potential
Generation
15 480 LC AZ Santa Rosa Canal B-2
Vertical Drop 4,506,597 858 61% 12
16 199 LC AZ
Coachella (North End):
6429+24Check Drop 4,475,739 670 78% 12
17 69 GP WY
Upper Deaver
Slide Chute 4,454,226 1,034 50% 7
18 376 UC CO
Groove Creek
Drop 2 Chute 4,363,725 1,503 34% 5
19 530 PN OR
North Unit Main
Canal Mile 52.58 Chute 4,332,528 1,213 42% 7
20 62 GP NE Mirdan:
2541+00Vertical Drop 4,199,219 1,466 33% 6
21 390 UC CO South
TerminusVertical Drop 4,088,542 930 51% 7
22 123 GP WY Pilot: 5.2 Chute 3,679,503 1,162 37% 6
23 479 LC AZ Santa Rosa Canal B-1
Vertical Drop 3,605,284 686 61% 12
24 375 UC CO
Groove Creek
Drop 1 Chute 3,543,874 1,220 34% 5
25 519 PN OR
North Unit Main
Canal Mile 19.46
Vertical Drop 3,313,699 927 42% 7

Top 25 Sites by Installed Capacity
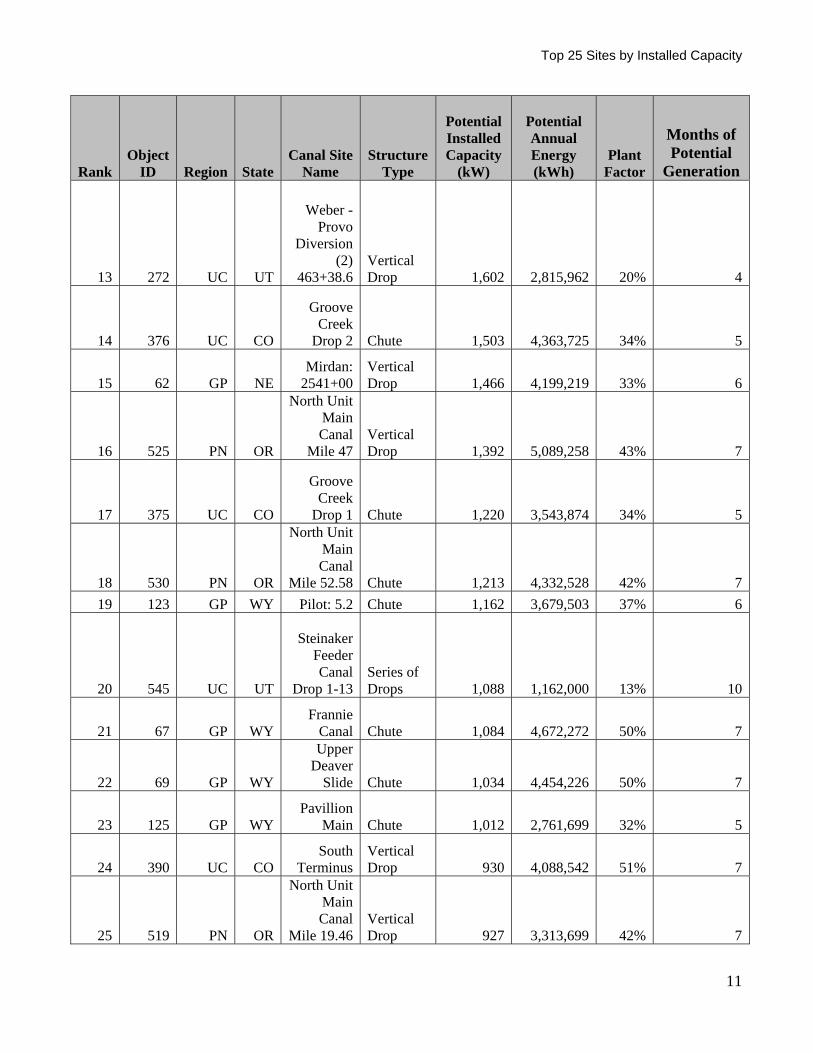
Table 4: Top 25 Sites by Installed Capacity
Rank Object
ID Region State Canal Site
Name Structure
Type
Potential Installed Capacity
(kW)
Potential Annual Energy (kWh)
Plant Factor
Months of Potential
Generation
1 386 UC CO Shavano
FallsVertical Drop 5,168 20,549,889 46% 7
2 387 UC CO
South Canal
Drop 4 Chute 4,242 18,653,967 51% 7
3 379 UC CO Salt Creek
Drop 2 Chute 3,643 10,578,729 34% 5
4 26 GP MT
Arnold Coulee
Drop, Pishkun
CanalVertical Drop 3,246 8,030,780 29% 6
5 27 GP MT
Pishkun Res Inlet
DropVertical Drop 3,174 6,759,974 25% 6
6 124 GP WY Pilot: 25.7 Chute 2,938 9,200,057 36% 5
7 122 GP WY
Heart Mountain
Ralston Chute upper: 0+00 Chute 2,425 8,221,222 39% 7
8 378 UC CO Salt Creek
Drop 1 Chute 2,411 7,055,833 34% 5
9 391 UC CO
Pipe Chute at
1058+00 Pipeline 2,029 7,187,372 41% 7
10 121 GP WY
Heart Mountain
Ralston Chute lower:
146+98 Chute 1,720 5,829,592 39% 7
11 524 PN OR
North Unit Main Canal
Mile 45.02Vertical Drop 1,714 6,266,652 43% 7
12 389 UC CO
South Canal
Drop 6 Chute 1,685 7,410,479 51% 7
10
Top 25 Sites by Installed Capacity
11
Rank Object
ID Region State Canal Site
Name Structure
Type
Potential Installed Capacity
(kW)
Potential Annual Energy (kWh)
Plant Factor
Months of Potential
Generation
13 272 UC UT
Weber - Provo
Diversion (2)
463+38.6Vertical Drop 1,602 2,815,962 20% 4
14 376 UC CO
Groove Creek
Drop 2 Chute 1,503 4,363,725 34% 5
15 62 GP NE Mirdan:
2541+00Vertical Drop 1,466 4,199,219 33% 6
16 525 PN OR
North Unit Main Canal
Mile 47Vertical Drop 1,392 5,089,258 43% 7
17 375 UC CO
Groove Creek
Drop 1 Chute 1,220 3,543,874 34% 5
18 530 PN OR
North Unit Main Canal
Mile 52.58 Chute 1,213 4,332,528 42% 719 123 GP WY Pilot: 5.2 Chute 1,162 3,679,503 37% 6
20 545 UC UT
Steinaker Feeder Canal
Drop 1-13Series of Drops 1,088 1,162,000 13% 10
21 67 GP WY Frannie
Canal Chute 1,084 4,672,272 50% 7
22 69 GP WY
Upper Deaver
Slide Chute 1,034 4,454,226 50% 7
23 125 GP WY Pavillion
Main Chute 1,012 2,761,699 32% 5
24 390 UC CO South
TerminusVertical Drop 930 4,088,542 51% 7
25 519 PN OR
North Unit Main Canal
Mile 19.46Vertical Drop 927 3,313,699 42% 7

Results By Region
Results by Region Tables 5 through 9 provide summary data by Reclamation region for each of the 393 sites analyzed. Table 5 provides summary data for the Great Plains Region. Table 6 provides summary data for the Upper Colorado Region. Table 7 provides summary data for the Lower Colorado Region. Table 8 provides summary data for the Mid Pacific Region. Table 9 provides summary data for the Pacific Northwest Region.
12

Great Plains Results
Great Plains Results
13

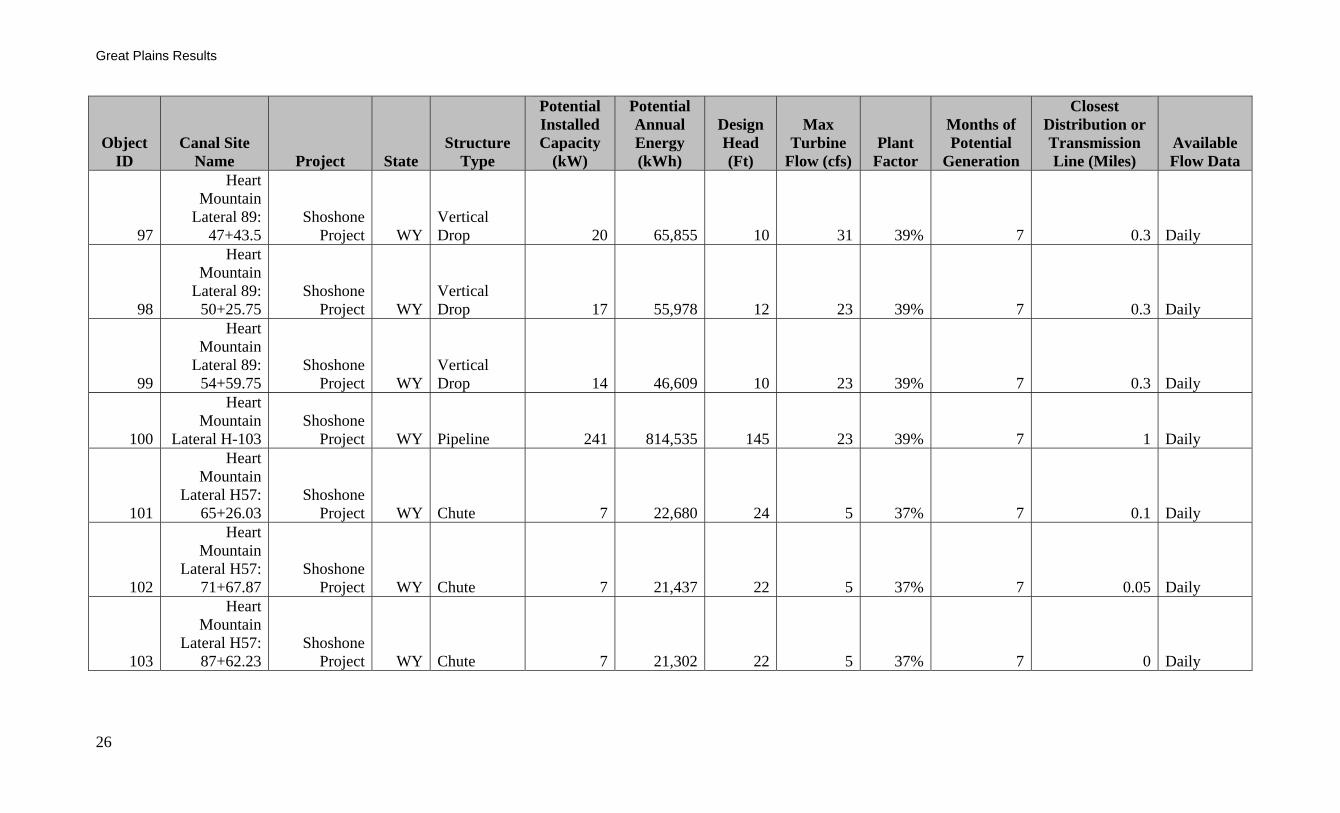
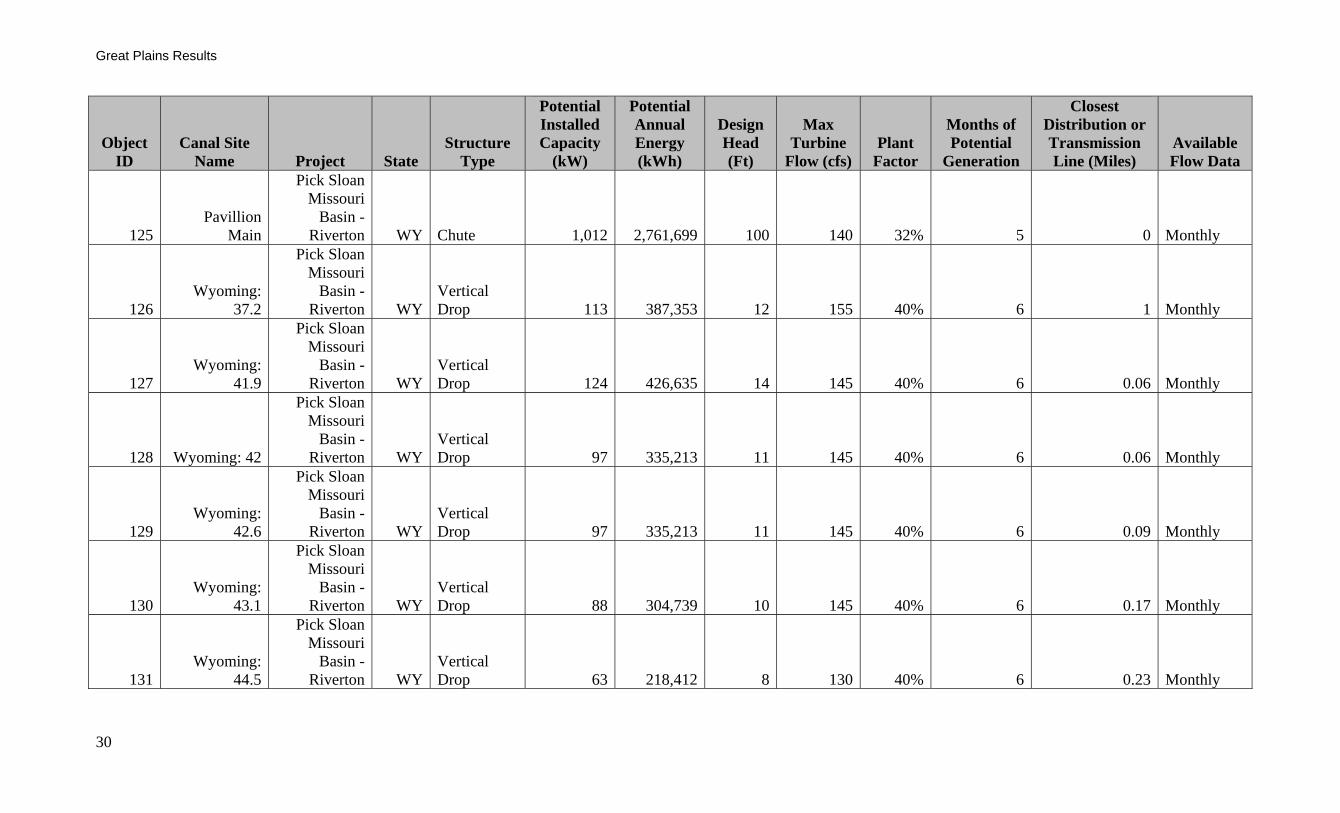
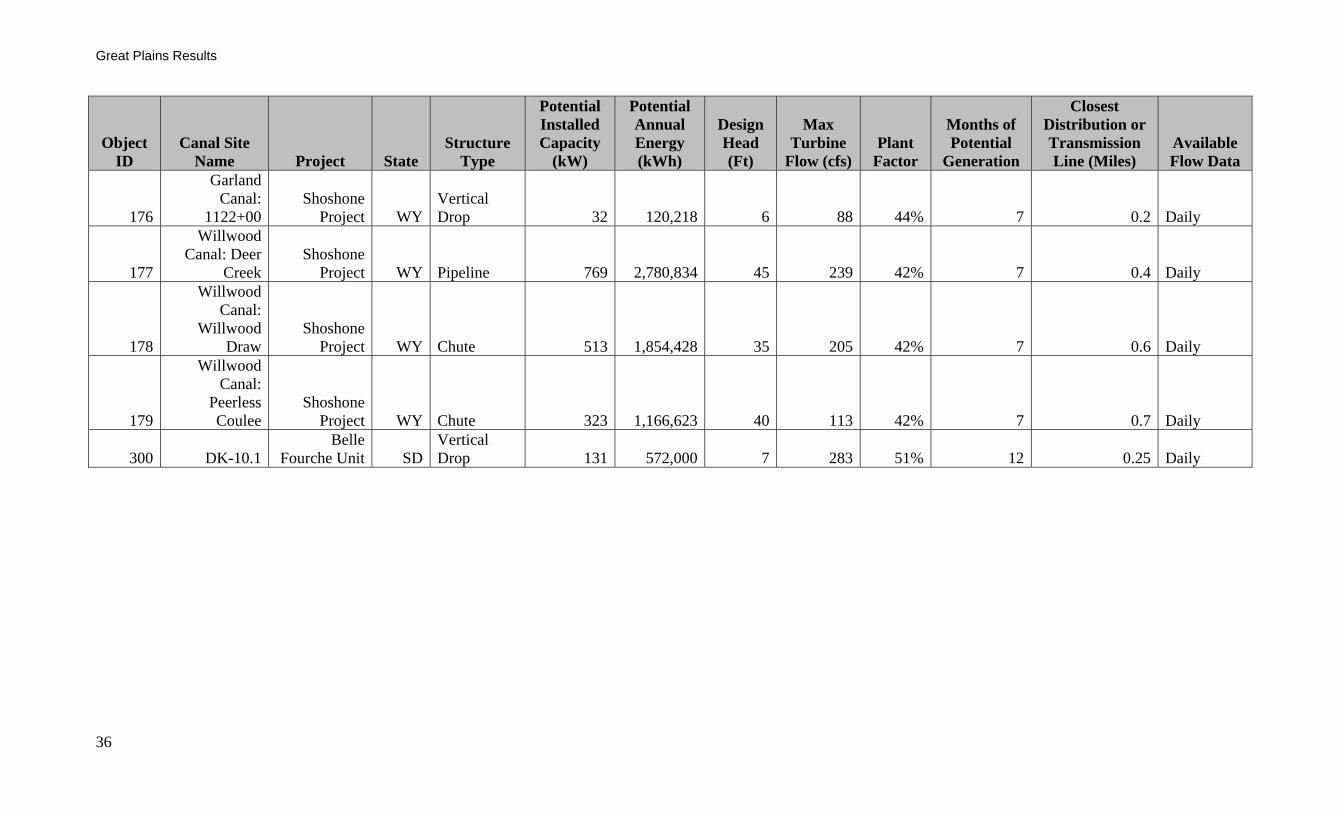
Great Plains Results
Table 5: Great Plains Results
Object ID
Canal Site Name Project State
Structure Type
Potential Installed Capacity
(kW)
Potential Annual Energy (kWh)
Design Head (Ft)
Max Turbine
Flow (cfs) Plant
Factor
Months of Potential
Generation
Closest Distribution or Transmission Line (Miles)
Available Flow Data
1 East Bench
Lateral 27.9 East Bench
Unit MTSeries of Drops 8 20,760 16 8 31% 5 1.15 Monthly
2 East Bench
Lateral 41.2 East Bench
Unit MTSeries of Drops 93 313,317 61 25 39% 6 0.2 Monthly
3
Helena Valley Drop into regulating
reservoir Helena
Valley Unit MTVertical Drop 199 645,212 10 279 38% 6 0.25 Daily
4 Helena Valley
Lateral 11.9 Helena
Valley Unit MTSeries of Drops 47 189,296 47 17 47% 6 0 Seasonal
5 Helena Valley
Lateral 14.8 Helena
Valley Unit MTSeries of Drops 91 341,714 25 60 43% 6 0 Seasonal
6
Helena Valley Unit Lateral
20.7 Helena
Valley Unit MTSeries of Drops 47 189,173 31 25 47% 6 0.5 Seasonal
7 Helena Valley
Lateral 32.6 Helena
Valley Unit MTSeries of Drops 29 101,692 47 10 41% 6 0 Seasonal
8 Couts drop Huntley Project MT
Vertical Drop 412 1,640,131 38 150 46% 6 0.001 Seasonal
9 Rod McCoy
Drop Huntley Project MT
Vertical Drop 26 70,830 17 25 32% 5 0.5 Seasonal
10
Lower Yellowstone
Lateral C4 Lower
Yellowstone MTVertical Drop 15 45,952 16 15 37% 5 0 Seasonal
11
Lower Yellowstone
Lateral D Lower
Yellowstone MTVertical Drop 18 59,208 15 20 38% 5 0 Seasonal
14

Great Plains Results
Object ID
Canal Site Name Project State
Structure Type
Potential Installed Capacity
(kW)
Potential Annual Energy (kWh)
Design Head (Ft)
Max Turbine
Flow (cfs) Plant
Factor
Closest Months of Distribution or Potential
Generation Transmission Available Line (Miles) Flow Data
12
Lower Yellowstone
Lateral D6 Lower
Yellowstone MTVertical Drop 8 27,390 16 8 41% 5 0 Seasonal
13
Lower Yellowstone
Lateral F Lower
Yellowstone MTSeries of Drops 69 235,736 25 45 40% 5 0.75 Seasonal
14
Lower Yellowstone
Lateral H Lower
Yellowstone MT Chute 38 120,615 25 25 37% 5 0 Seasonal
15
Lower Yellowstone
Lateral N Lower
Yellowstone MTSeries of Drops 62 197,799 41 25 37% 5 0.75 Seasonal
16 Lateral PP 1st
& 2nd drops Lower
Yellowstone MTSeries of Drops 55 137,977 26 35 29% 5 0 Seasonal
17
Lower Yellowstone Lateral PP5
Lower Yellowstone MT
Vertical Drop 10 29,078 13 12 36% 5 0 Seasonal
18 Nelson North Milk River
Project MTVertical Drop 140 221,743 46 50 18% 6 0.1 Daily
19 Savage Unit
Lateral 1.9 Savage Unit MT Chute 7 23,933 15 8 38% 5 0.04 Seasonal
20 Savage Unit
Lateral 5.7 1st Savage Unit MT Chute 6 20,798 13 8 38% 5 0.25 Seasonal
21
Savage Unit Lateral 5.7
2nd Savage Unit MT Chute 5 15,998 10 8 38% 5 0.25 Seasonal
22 Ft Shaw A-
drop
Sun River Project - Fort Shaw District MT
Vertical Drop 286 1,092,085 45 90 44% 7 0.5 Seasonal
15

Great Plains Results
Object ID
Canal Site Name Project State
Structure Type
Potential Installed Capacity
(kW)
Potential Annual Energy (kWh)
Design Head (Ft)
Max Turbine
Flow (cfs) Plant
Factor
Closest Months of Distribution or Potential
Generation Transmission Available Line (Miles) Flow Data
23 Ft Shaw C-
drop
Sun River Project - Fort Shaw District MT Chute 72 286,808 59 20 46% 7 0.1 Seasonal
24
Sequest Check to A-
drop
Sun River Project - Fort Shaw District MT Pipeline 314 1,359,128 62 70 50% 7 0.25 Seasonal
25 9-ft Drop,
Spring Valley Sun River
Greenfields MTVertical Drop 418 1,035,221 9 900 29% 4 0.75 Monthly
26
Arnold Coulee Drop,
Pishkun Canal Sun River
Greenfields MTVertical Drop 3,246 8,030,780 36 1,251 29% 6 3.5 Daily
27 Pishkun Res
Inlet Drop Sun River
Greenfields MTVertical Drop 3,174 6,759,974 36 1,251 25% 6 2 Daily
28 GM 47 Drop Sun River
Greenfields MTSeries of Drops 25 68,681 81 5 32% 4 0.29 Monthly
29 Lower Ashlot
Drop Sun River
Greenfields MT Chute 110 346,043 22 70 37% 5 0.25 Monthly
30 Middle Ashlot
Drop Sun River
Greenfields MT Chute 213 666,118 42 70 36% 5 0.25 Monthly
31 Old SRS Drop Sun River
Greenfields MT Pipeline 61 199,483 125 8 38% 5 0.5 Monthly
32 Upper Ashlot
Drop Sun River
Greenfields MT Chute 582 1,823,893 115 70 36% 5 0.25 Monthly
35 Ainsworth:
1375+00
Pick Sloan Missouri
Basin - Ainsworth
Unit NEVertical Drop 119 238,884 8 241 23% 5 2 Daily
16

Great Plains Results
Object ID
Canal Site Name Project State
Structure Type
Potential Installed Capacity
(kW)
Potential Annual Energy (kWh)
Design Head (Ft)
Max Turbine
Flow (cfs) Plant
Factor
Closest Months of Distribution or Potential
Generation Transmission Available Line (Miles) Flow Data
36 Ainsworth:
1437+08
Pick Sloan Missouri
Basin - Ainsworth NE
Vertical Drop 72 145,100 5 241 23% 5 3 Daily
38 Ainsworth:
1590+50
Pick Sloan Missouri
Basin - Ainsworth NE
Vertical Drop 74 149,524 5 241 23% 5 6 Daily
39 Ainsworth:
1633+50
Pick Sloan Missouri
Basin - Ainsworth NE
Vertical Drop 75 149,819 5 241 23% 5 6.5 Daily
41 Ainsworth:
1722+00
Pick Sloan Missouri
Basin - Ainsworth NE
Vertical Drop 89 179,606 6 241 23% 5 4 Daily
42 Ainsworth:
1846+00
Pick Sloan Missouri
Basin - Ainsworth NE
Vertical Drop 141 282,827 10 241 23% 5 3.5 Daily
43 Ainsworth:
1858+57
Pick Sloan Missouri
Basin - Ainsworth NE
Vertical Drop 82 164,565 6 241 23% 5 3.5 Daily
44 Ainsworth:
1913+47
Pick Sloan Missouri
Basin - Ainsworth NE
Vertical Drop 89 179,016 6 241 23% 5 3.5 Daily
17

Great Plains Results
Object ID
Canal Site Name Project State
Structure Type
Potential Installed Capacity
(kW)
Potential Annual Energy (kWh)
Design Head (Ft)
Max Turbine
Flow (cfs) Plant
Factor
Closest Months of Distribution or Potential
Generation Transmission Available Line (Miles) Flow Data
45 Ainsworth:
2023+00
Pick Sloan Missouri
Basin - Ainsworth NE
Vertical Drop 137 274,570 9 241 23% 5 3 Daily
46 Ainsworth:
2231+00
Pick Sloan Missouri
Basin - Ainsworth NE
Vertical Drop 178 358,326 12 241 23% 5 2.5 Daily
47 Ainsworth:
2358+00
Pick Sloan Missouri
Basin - Ainsworth NE
Vertical Drop 156 314,089 11 241 23% 5 2.5 Daily
48 Ainsworth:
2414+00
Pick Sloan Missouri
Basin - Ainsworth NE
Vertical Drop 192 386,344 13 241 23% 5 3 Daily
49 Ainsworth:
2466+00
Pick Sloan Missouri
Basin - Ainsworth NE
Vertical Drop 196 393,717 13 241 23% 5 2.5 Daily
50 Ainsworth:
2540+32
Pick Sloan Missouri
Basin - Ainsworth NE
Vertical Drop 91 182,850 6 241 23% 5 1.5 Daily
18

Great Plains Results
Object ID
Canal Site Name Project State
Structure Type
Potential Installed Capacity
(kW)
Potential Annual Energy (kWh)
Design Head (Ft)
Max Turbine
Flow (cfs) Plant
Factor
Closest Months of Distribution or Potential
Generation Transmission Available Line (Miles) Flow Data
51 Cambridge:
798+21.7
Pick Sloan Missouri
Basin - Frenchman-Cambridge
Division NEVertical Drop 84 180,455 15 211 25% 5 0 Daily
52 Cambridge:
897+38
Pick Sloan Missouri
Basin - Frenchman-Cambridge
Division NEVertical Drop 44 94,587 8 211 25% 5 1.09 Daily
53 Cambridge:
954+41.5
Pick Sloan Missouri
Basin - Frenchman-Cambridge
Division NEVertical Drop 44 94,708 8 211 25% 5 0.5 Daily
54 Cambridge:
1143.91
Pick Sloan Missouri
Basin - Frenchman-Cambridge
Division NEVertical Drop 35 75,452 6 211 25% 5 0.5 Daily
19

Great Plains Results
Object ID
Canal Site Name Project State
Structure Type
Potential Installed Capacity
(kW)
Potential Annual Energy (kWh)
Design Head (Ft)
Max Turbine
Flow (cfs) Plant
Factor
Closest Months of Distribution or Potential
Generation Transmission Available Line (Miles) Flow Data
55 Cambridge:
1348+20
Pick Sloan Missouri
Basin - Frenchman-Cambridge
Division NEVertical Drop 34 72,303 6 211 25% 5 0.25 Daily
56 Cambridge:
1404+00
Pick Sloan Missouri
Basin - Frenchman-Cambridge
Division NEVertical Drop 35 73,877 6 211 25% 5 1 Daily
57 Cambridge:
1408+50
Pick Sloan Missouri
Basin - Frenchman-Cambridge
Division NEVertical Drop 35 73,877 6 211 25% 5 1 Daily
59 Mirdan:
2083+00
Pick Sloan Missouri
Basin - North Loup NE
Vertical Drop 654 1,872,607 27 333 33% 6 2 Daily
60 Mirdan:
2310+60
Pick Sloan Missouri
Basin - North Loup NE
Vertical Drop 590 1,689,231 25 333 33% 6 2 Daily
20

Great Plains Results
Object ID
Canal Site Name Project State
Structure Type
Potential Installed Capacity
(kW)
Potential Annual Energy (kWh)
Design Head (Ft)
Max Turbine
Flow (cfs) Plant
Factor
Closest Months of Distribution or Potential
Generation Transmission Available Line (Miles) Flow Data
61 Mirdan:
2509+50
Pick Sloan Missouri
Basin - North Loup NE
Vertical Drop 282 806,441 12 333 33% 6 2.5 Daily
62 Mirdan:
2541+00
Pick Sloan Missouri
Basin - North Loup NE
Vertical Drop 1,466 4,199,219 62 333 33% 6 2.5 Daily
63
Johnson/256 Lateral: 177+00
Kendrick Project WY
Vertical Drop 72 184,440 13 91 30% 5 0.5 Daily
64
Johnson/256 Lateral: 218+50
Kendrick Project WY
Vertical Drop 75 191,977 14 91 30% 5 0.02 Daily
65
Johnson/256 Lateral: 227+00
Kendrick Project WY
Vertical Drop 76 194,821 14 91 30% 5 0.02 Daily
66 Deaver Flume Shoshone
Project WY Chute 434 1,868,908 100 60 50% 7 NA Seasonal
67 Frannie Canal Shoshone
Project WY Chute 1,084 4,672,272 125 120 50% 7 NA Seasonal
68 Lower Deaver
Slide Shoshone
Project WY Chute 651 2,803,362 90 100 50% 7 NA Seasonal
69 Upper Deaver
Slide Shoshone
Project WY Chute 1,034 4,454,226 130 110 50% 7 NA Seasonal
21

Great Plains Results
Object ID
Canal Site Name Project State
Structure Type
Potential Installed Capacity
(kW)
Potential Annual Energy (kWh)
Design Head (Ft)
Max Turbine
Flow (cfs) Plant
Factor
Closest Months of Distribution or Potential
Generation Transmission Available Line (Miles) Flow Data
70
Heart Mountain Lateral 79 after 79-5: 203+15.27
Shoshone Project WY Chute 19 62,986 40 8 38% 7 0 Daily
71
Heart Mountain
Lateral 79-5: 124+08.08
Shoshone Project WY Chute 2 8,153 18 2 42% 7 0 Daily
72
Heart Mountain
Lateral 79-5: 127.+86.58
Shoshone Project WY Chute 3 9,388 21 2 42% 7 0 Daily
73
Heart Mountain
Lateral 79: 19+60
Shoshone Project WY
Vertical Drop 31 103,576 11 46 39% 7 0 Daily
74
Heart Mountain
Lateral 79: 23+33
Shoshone Project WY
Vertical Drop 31 103,576 11 46 39% 7 0.1 Daily
75
Heart Mountain
Lateral 79: 26+88
Shoshone Project WY
Vertical Drop 31 103,576 11 46 39% 7 0.25 Daily
76
Heart Mountain
Lateral 79: 30+43
Shoshone Project WY
Vertical Drop 31 104,517 11 46 39% 7 0.2 Daily
22

Great Plains Results
Object ID
Canal Site Name Project State
Structure Type
Potential Installed Capacity
(kW)
Potential Annual Energy (kWh)
Design Head (Ft)
Max Turbine
Flow (cfs) Plant
Factor
Closest Months of Distribution or Potential
Generation Transmission Available Line (Miles) Flow Data
77
Heart Mountain
Lateral 79: 33+48
Shoshone Project WY
Vertical Drop 31 103,576 11 46 39% 7 0.15 Daily
78
Heart Mountain
Lateral 79: 36+43
Shoshone Project WY
Vertical Drop 31 103,576 11 46 39% 7 0.1 Daily
79
Heart Mountain
Lateral 79: 39+93
Shoshone Project WY
Vertical Drop 25 86,031 11 38 39% 7 0 Daily
80
Heart Mountain
Lateral 79: 42+90
Shoshone Project WY
Vertical Drop 25 86,031 11 38 39% 7 0 Daily
81
Heart Mountain
Lateral 79: 45+63
Shoshone Project WY
Vertical Drop 25 86,031 11 38 39% 7 0 Daily
82
Heart Mountain
Lateral 79: 48+31
Shoshone Project WY
Vertical Drop 23 79,383 10 38 39% 7 0 Daily
83
Heart Mountain
Lateral 79: 50+85
Shoshone Project WY
Vertical Drop 23 79,148 10 38 39% 7 0 Daily
23

Great Plains Results
Object ID
Canal Site Name Project State
Structure Type
Potential Installed Capacity
(kW)
Potential Annual Energy (kWh)
Design Head (Ft)
Max Turbine
Flow (cfs) Plant
Factor
Closest Months of Distribution or Potential
Generation Transmission Available Line (Miles) Flow Data
84
Heart Mountain
Lateral 79: 53+37
Shoshone Project WY
Vertical Drop 23 79,148 10 38 39% 7 0 Daily
85
Heart Mountain
Lateral 79: 55+36
Shoshone Project WY
Vertical Drop 23 79,148 10 38 39% 7 0 Daily
86
Heart Mountain Lateral 89
after 89-10: 141+06.14
Shoshone Project WY Chute 22 76,383 25 15 40% 7 0.3 Daily
87
Heart Mountain Lateral 89
after 89-10: 154+83.16
Shoshone Project WY Chute 19 64,452 21 15 40% 7 0.25 Daily
88
Heart Mountain
Lateral 89: 2+77
Shoshone Project WY
Vertical Drop 35 117,393 15 38 39% 7 1 Daily
89
Heart Mountain
Lateral 89: 9+64.25
Shoshone Project WY
Vertical Drop 34 115,750 15 38 39% 7 0.9 Daily
24

Great Plains Results
Object ID
Canal Site Name Project State
Structure Type
Potential Installed Capacity
(kW)
Potential Annual Energy (kWh)
Design Head (Ft)
Max Turbine
Flow (cfs) Plant
Factor
Closest Months of Distribution or Potential
Generation Transmission Available Line (Miles) Flow Data
90
Heart Mountain
Lateral 89: 17+60
Shoshone Project WY Chute 87 292,426 37 38 39% 7 0.8 Daily
91
Heart Mountain
Lateral 89: 21+34.25
Shoshone Project WY
Vertical Drop 34 115,907 15 38 39% 7 0.5 Daily
92
Heart Mountain
Lateral 89: 33+91
Shoshone Project WY
Vertical Drop 22 74,993 12 31 39% 7 0.3 Daily
93
Heart Mountain
Lateral 89: 37+36
Shoshone Project WY
Vertical Drop 23 75,434 12 31 39% 7 0.3 Daily
94
Heart Mountain
Lateral 89: 40+26
Shoshone Project WY
Vertical Drop 22 74,993 12 31 39% 7 0.3 Daily
95
Heart Mountain
Lateral 89: 43+16
Shoshone Project WY
Vertical Drop 22 75,056 12 31 39% 7 0.3 Daily
96
Heart Mountain
Lateral 89: 45+20
Shoshone Project WY
Vertical Drop 22 74,678 12 31 39% 7 0.3 Daily
25
Great Plains Results
Object ID
Canal Site Name Project State
Structure Type
Potential Installed Capacity
(kW)
Potential Annual Energy (kWh)
Design Head (Ft)
Max Turbine
Flow (cfs) Plant
Factor
Closest Months of Distribution or Potential
Generation Transmission Available Line (Miles) Flow Data
97
Heart Mountain
Lateral 89: 47+43.5
Shoshone Project WY
Vertical Drop 20 65,855 10 31 39% 7 0.3 Daily
98
Heart Mountain
Lateral 89: 50+25.75
Shoshone Project WY
Vertical Drop 17 55,978 12 23 39% 7 0.3 Daily
99
Heart Mountain
Lateral 89: 54+59.75
Shoshone Project WY
Vertical Drop 14 46,609 10 23 39% 7 0.3 Daily
100
Heart Mountain
Lateral H-103 Shoshone
Project WY Pipeline 241 814,535 145 23 39% 7 1 Daily
101
Heart Mountain
Lateral H57: 65+26.03
Shoshone Project WY Chute 7 22,680 24 5 37% 7 0.1 Daily
102
Heart Mountain
Lateral H57: 71+67.87
Shoshone Project WY Chute 7 21,437 22 5 37% 7 0.05 Daily
103
Heart Mountain
Lateral H57: 87+62.23
Shoshone Project WY Chute 7 21,302 22 5 37% 7 0 Daily
26

Great Plains Results
Object ID
Canal Site Name Project State
Structure Type
Potential Installed Capacity
(kW)
Potential Annual Energy (kWh)
Design Head (Ft)
Max Turbine
Flow (cfs) Plant
Factor
Closest Months of Distribution or Potential
Generation Transmission Available Line (Miles) Flow Data
104
Heart Mountain
Lateral H57: 95+33.79
Shoshone Project WY Chute 6 17,678 18 5 37% 7 0.05 Daily
105
Heart Mountain
Lateral H57: 103+50.35
Shoshone Project WY Chute 8 23,904 25 5 37% 7 0.1 Daily
106
Heart Mountain
Lateral H57: 139+22.50
Shoshone Project WY Chute 20 63,019 65 5 37% 7 0.1 Daily
107
Heart Mountain
Lateral H65: 4+09
Shoshone Project WY Chute 86 290,080 37 38 39% 7 0.2 Daily
108
Heart Mountain
Lateral H65: 10+50.92
Shoshone Project WY Chute 94 318,705 41 38 39% 7 0.1 Daily
109
Heart Mountain
Lateral H65: 22+75.25
Shoshone Project WY
Vertical Drop 34 115,672 15 38 39% 7 0.1 Daily
110
Heart Mountain
Lateral H65: 28+28
Shoshone Project WY
Vertical Drop 35 118,801 15 38 39% 7 0.2 Daily
27

Great Plains Results
Object ID
Canal Site Name Project State
Structure Type
Potential Installed Capacity
(kW)
Potential Annual Energy (kWh)
Design Head (Ft)
Max Turbine
Flow (cfs) Plant
Factor
Months of Potential
Generation
Closest Distribution or Transmission Line (Miles)
Available Flow Data
111
Heart Mountain
Lateral H65: 37+58.13
Shoshone Project WY Chute 84 284,136 36 38 39% 7 0.4 Daily
112
Heart Mountain
Lateral H65: 48+29.09
Shoshone Project WY Chute 53 180,195 23 38 39% 7 0.6 Daily
113
Heart Mountain
Lateral H65: 59+92
Shoshone Project WY Chute 49 162,023 26 31 39% 7 0.9 Daily
114
Heart Mountain
Lateral H65: 69+53.42
Shoshone Project WY Chute 56 185,718 29 31 39% 7 0.9 Daily
115
Heart Mountain
Lateral H65: 79+22.42
Shoshone Project WY Chute 54 181,118 29 31 39% 7 0.7 Daily
116
Heart Mountain
Lateral H65: 111+19.36
Shoshone Project WY Chute 109 364,127 58 31 39% 7 0.25 Daily
117
Heart Mountain
Lateral H71: 6+45.64
Shoshone Project WY Chute 18 59,088 37 8 38% 7 0.5 Daily
28

Great Plains Results
Object ID
Canal Site Name Project State
Structure Type
Potential Installed Capacity
(kW)
Potential Annual Energy (kWh)
Design Head (Ft)
Max Turbine
Flow (cfs) Plant
Factor
Closest Months of Distribution or Potential
Generation Transmission Available
Flow Data Line (Miles)
118
Heart Mountain
Lateral R45 Site 1
Shoshone Project WY
Vertical Drop 45 150,351 12 61 39% 7 0.12 Daily
119
Heart Mountain
Lateral R45 Site 2
Shoshone Project WY Chute 230 783,260 60 53 40% 7 0.25 Daily
120
Heart Mountain
Lateral R45 Site 3
Shoshone Project WY Chute 183 617,923 110 23 39% 7 0.5 Daily
121
Heart Mountain
Ralston Chute lower: 146+98
Shoshone Project WY Chute 1,720 5,829,592 130 183 39% 7 0.25 Daily
122
Heart Mountain
Ralston Chute upper: 0+00
Shoshone Project WY Chute 2,425 8,221,222 110 305 39% 7 0 Daily
123 Pilot: 5.2
Pick Sloan Missouri
Basin - Riverton WY Chute 1,162 3,679,503 30 542 37% 6 0.04 Daily
124 Pilot: 25.7
Pick Sloan Missouri
Basin - Riverton WY Chute 2,938 9,200,057 150 271 36% 5 0 Daily
29
Great Plains Results
Object ID
Canal Site Name Project State
Structure Type
Potential Installed Capacity
(kW)
Potential Annual Energy (kWh)
Design Head (Ft)
Max Turbine
Flow (cfs) Plant
Factor
Closest Months of Distribution or Potential
Generation Transmission Available
Flow Data Line (Miles)
125 Pavillion
Main
Pick Sloan Missouri
Basin - Riverton WY Chute 1,012 2,761,699 100 140 32% 5 0 Monthly
126 Wyoming:
37.2
Pick Sloan Missouri
Basin - Riverton WY
Vertical Drop 113 387,353 12 155 40% 6 1 Monthly
127 Wyoming:
41.9
Pick Sloan Missouri
Basin - Riverton WY
Vertical Drop 124 426,635 14 145 40% 6 0.06 Monthly
128 Wyoming: 42
Pick Sloan Missouri
Basin - Riverton WY
Vertical Drop 97 335,213 11 145 40% 6 0.06 Monthly
129 Wyoming:
42.6
Pick Sloan Missouri
Basin - Riverton WY
Vertical Drop 97 335,213 11 145 40% 6 0.09 Monthly
130 Wyoming:
43.1
Pick Sloan Missouri
Basin - Riverton WY
Vertical Drop 88 304,739 10 145 40% 6 0.17 Monthly
131 Wyoming:
44.5
Pick Sloan Missouri
Basin - Riverton WY
Vertical Drop 63 218,412 8 130 40% 6 0.23 Monthly
30

Great Plains Results
Object ID
Canal Site Name Project State
Structure Type
Potential Installed Capacity
(kW)
Potential Annual Energy (kWh)
Design Head (Ft)
Max Turbine
Flow (cfs) Plant
Factor
Closest Months of Distribution or Potential
Generation Transmission Available
Flow Data Line (Miles)
132 Wyoming:
44.8
Pick Sloan Missouri
Basin - Riverton WY
Vertical Drop 73 254,961 10 120 41% 6 0.09 Monthly
133 Wyoming:
45.5
Pick Sloan Missouri
Basin - Riverton WY
Vertical Drop 56 195,197 8 115 41% 6 0.2 Monthly
134 Wyoming:
45.6
Pick Sloan Missouri
Basin - Riverton WY
Vertical Drop 70 243,996 10 115 41% 6 0.28 Monthly
135 Wyoming:
45.9
Pick Sloan Missouri
Basin - Riverton WY
Vertical Drop 45 155,089 7 105 40% 6 0.26 Monthly
136 Wyoming:
46.2
Pick Sloan Missouri
Basin - Riverton WY
Vertical Drop 67 231,087 11 100 40% 6 0.26 Monthly
137 Wyoming:
46.6
Pick Sloan Missouri
Basin - Riverton WY
Vertical Drop 61 210,079 10 100 40% 6 0.11 Monthly
138 Wyoming:
46.8
Pick Sloan Missouri
Basin - Riverton WY
Vertical Drop 55 189,831 10 90 40% 6 0.14 Monthly
31

Great Plains Results
Object ID
Canal Site Name Project State
Structure Type
Potential Installed Capacity
(kW)
Potential Annual Energy (kWh)
Design Head (Ft)
Max Turbine
Flow (cfs) Plant
Factor
Closest Months of Distribution or Potential
Generation Transmission Available
Flow Data Line (Miles)
139 Wyoming:
47.1
Pick Sloan Missouri
Basin - Riverton WY
Vertical Drop 55 189,831 10 90 40% 6 0.17 Monthly
140 Wyoming:
47.4
Pick Sloan Missouri
Basin - Riverton WY
Vertical Drop 44 151,865 8 90 40% 6 2 Monthly
141 Northport:
19.75 North Platte
Project NEVertical Drop 46 116,556 10 76 29% 6 0.7 Daily
142 Northport:
19.79 North Platte
Project NEVertical Drop 46 116,556 10 76 29% 6 0.7 Daily
143 #1 Lateral
M.P. 1.6 North Platte
Project WYVertical Drop 60 130,375 14 70 25% 4 1 Seasonal
144 #18 Lateral
M.P. 1.8 North Platte
Project NEVertical Drop 24 53,081 21 19 25% 4 0.35 Seasonal
145 #21 Lateral
M.P. 4.8 North Platte
Project NEVertical Drop 46 100,575 7 108 25% 4 0.02 Seasonal
146
Lake Alice Inlet Check:
M.C. 94.6 North Platte
Project NEVertical Drop 344 775,234 17 283 26% 6 0.4 Daily
147
Garland Canal:
679+00 Shoshone
Project WYVertical Drop 353 1,339,922 6 796 44% 7 0.05 Daily
148
Garland Canal:
693+00 Shoshone
Project WYVertical Drop 398 1,511,884 7 796 44% 7 0.05 Daily
32

Great Plains Results
Object ID
Canal Site Name Project State
Structure Type
Potential Installed Capacity
(kW)
Potential Annual Energy (kWh)
Design Head (Ft)
Max Turbine
Flow (cfs) Plant
Factor
Closest Months of Distribution or Potential
Generation Transmission Available
Flow Data Line (Miles)
149
Garland Canal:
711+00 Shoshone
Project WYVertical Drop 341 1,295,901 6 796 44% 7 0.25 Daily
150
Garland Canal:
722+00 Shoshone
Project WYVertical Drop 333 1,265,663 6 796 44% 7 0.45 Daily
151
Garland Canal:
733+00 Shoshone
Project WYVertical Drop 332 1,261,343 6 796 44% 7 0.65 Daily
152
Garland Canal:
754+33 Shoshone
Project WYVertical Drop 265 1,004,332 9 394 44% 7 0.3 Daily
153
Garland Canal:
758+00 Shoshone
Project WYVertical Drop 225 854,751 8 394 44% 7 0.01 Daily
154
Garland Canal:
772+00 Shoshone
Project WYVertical Drop 225 854,751 8 394 44% 7 0.2 Daily
155
Garland Canal:
783+00 Shoshone
Project WYVertical Drop 282 1,068,439 10 394 44% 7 0.4 Daily
156
Garland Canal:
799+00 Shoshone
Project WYVertical Drop 282 1,068,439 10 394 44% 7 0.3 Daily
157
Garland Canal:
818+00 Shoshone
Project WYVertical Drop 200 759,618 8 350 44% 7 0.01 Daily
33

Great Plains Results
Object ID
Canal Site Name Project State
Structure Type
Potential Installed Capacity
(kW)
Potential Annual Energy (kWh)
Design Head (Ft)
Max Turbine
Flow (cfs) Plant
Factor
Closest Months of Distribution or Potential
Generation Transmission Available
Flow Data Line (Miles)
158
Garland Canal:
831+00 Shoshone
Project WYVertical Drop 200 759,618 8 350 44% 7 0.02 Daily
159
Garland Canal:
843+00 Shoshone
Project WYVertical Drop 250 949,522 10 350 44% 7 0.01 Daily
160
Garland Canal:
864+63 Shoshone
Project WYVertical Drop 177 670,399 8 298 44% 7 0.08 Daily
161
Garland Canal:
875+00 Shoshone
Project WYVertical Drop 170 646,651 8 298 44% 7 0.01 Daily
162
Garland Canal:
892+00 Shoshone
Project WYVertical Drop 128 484,923 6 298 44% 7 0.1 Daily
163
Garland Canal:
905+00 Shoshone
Project WYVertical Drop 175 665,075 10 245 44% 7 0.08 Daily
164
Garland Canal:
926+00 Shoshone
Project WYVertical Drop 175 665,075 10 245 44% 7 0.01 Daily
165
Garland Canal:
945+00 Shoshone
Project WYVertical Drop 140 532,060 8 245 44% 7 0.005 Daily
166
Garland Canal:
960+00 Shoshone
Project WYVertical Drop 140 532,060 8 245 44% 7 0.1 Daily
34

Great Plains Results
Object ID
Canal Site Name Project State
Structure Type
Potential Installed Capacity
(kW)
Potential Annual Energy (kWh)
Design Head (Ft)
Max Turbine
Flow (cfs) Plant
Factor
Closest Months of Distribution or Potential
Generation Transmission Available
Flow Data Line (Miles)
167
Garland Canal:
977+80 Shoshone
Project WYVertical Drop 86 322,969 10 149 44% 7 0.1 Daily
168
Garland Canal:
990+00 Shoshone
Project WYVertical Drop 73 271,974 8 149 44% 7 0.1 Daily
169
Garland Canal:
1006+00 Shoshone
Project WYVertical Drop 54 203,980 6 149 44% 7 0.25 Daily
170
Garland Canal:
1021+00 Shoshone
Project WYVertical Drop 54 203,980 6 149 44% 7 0.4 Daily
171
Garland Canal:
1044+00 Shoshone
Project WYVertical Drop 73 271,974 8 149 44% 7 0.001 Daily
172
Garland Canal:
1061+00 Shoshone
Project WYVertical Drop 73 271,974 8 149 44% 7 0.3 Daily
173
Garland Canal:
1074+00 Shoshone
Project WYVertical Drop 43 160,291 8 88 44% 7 0.5 Daily
174
Garland Canal:
1090+00 Shoshone
Project WYVertical Drop 43 160,291 8 88 44% 7 0.4 Daily
175
Garland Canal:
1111+00 Shoshone
Project WYVertical Drop 32 120,218 6 88 44% 7 0.2 Daily
35
Great Plains Results
36
Object ID
Canal Site Name Project State
Structure Type
Potential Installed Capacity
(kW)
Potential Annual Energy (kWh)
Design Head (Ft)
Max Turbine
Flow (cfs) Plant
Factor
Months of Potential
Generation
Closest Distribution or Transmission Line (Miles)
Available Flow Data
176
Garland Canal:
1122+00 Shoshone
Project WYVertical Drop 32 120,218 6 88 44% 7 0.2 Daily
177
Willwood Canal: Deer
Creek Shoshone
Project WY Pipeline 769 2,780,834 45 239 42% 7 0.4 Daily
178
Willwood Canal:
Willwood Draw
Shoshone Project WY Chute 513 1,854,428 35 205 42% 7 0.6 Daily
179
Willwood Canal:
Peerless Coulee
Shoshone Project WY Chute 323 1,166,623 40 113 42% 7 0.7 Daily
300 DK-10.1 Belle
Fourche Unit SDVertical Drop 131 572,000 7 283 51% 12 0.25 Daily

Upper Colorado Results
Upper Colorado Results
37

Upper Colorado Results
Table 6: Upper Colorado Results
Object ID
Canal Site Name Project State
Structure Type
Potential Installed Capacity
(kW)
Potential Annual Energy (kWh)
Design Head (Ft)
Max Turbine
Flow (cfs)
Plant Factor
Closest Months of Distribution or Potential
Generation Transmission Available Line (Miles) Flow Data
236 Chute 1 Loutz Uncompahgre CO Chute 217 926,639 30 101 50% 7 0.1 Monthly 237 Chute 2 Loutz Uncompahgre CO Chute 416 1,763,491 57 101 49% 7 0.32 Monthly 238 Chute 3 Loutz Uncompahgre CO Chute 202 864,863 28 101 50% 7 0.84 Monthly
239 Double E
Chute Uncompahgre CO Chute 687 2,839,532 42 229 48% 7 0.39 Seasonal
241 Fire Mountain
"The Drop" Paonia COVertical Drop 81 348,013 12 115 50% 6 0.27 Seasonal
246 S.F. Drop To
Reservior Smith Fork COVertical Drop 32 102,191 58 9 37% 12 0.03 Monthly
247 S.F. Feeder
Drop Smith Fork COVertical Drop 7 21,143 12 9 37% 12 0.54 Monthly
260 Eden Canal (1)
726+00 Eden WYVertical Drop 66 153,617 9 127 27% 5 12.57 Daily
261 Eden Canal (2)
804+00 Eden WYVertical Drop 58 135,545 8 127 27% 5 12.71 Daily
262 Eden Canal (3)
871+50 Eden WYVertical Drop 58 135,545 8 127 27% 5 12.94 Daily
263
West Side Lateral (1)
232+30 Eden WYVertical Drop 28 62,779 8 57 26% 5 19.19 Daily
264
West Side Lateral (2)
366+50 Eden WYVertical Drop 36 78,857 10 57 26% 5 18.26 Daily
38

Upper Colorado Results
Object ID
Canal Site Name Project State
Structure Type
Potential Installed Capacity
(kW)
Potential Annual Energy (kWh)
Design Head (Ft)
Max Turbine
Flow (cfs)
Plant Factor
Closest Months of Distribution or Potential
Generation Transmission Available Line (Miles) Flow Data
265
West Side Lateral (3) 499+68.5 Eden WY
Vertical Drop 53 116,371 15 57 26% 5 17.82 Daily
266 Farson Lateral
(1) Eden WYVertical Drop 44 95,043 15 47 25% 5 16.32 Daily
267 Farson Lateral
(2) Eden WYVertical Drop 44 95,043 15 47 25% 5 16.06 Daily
268 CC&H(1) Emery County UTVertical Drop 76 174,063 25 51 26% 5 1.69 Monthly
269
Ogden- Brigham Canal
(1) 466+43 Ogden River UTVertical Drop 53 142,152 25 35 31% 7 0.31 Monthly
270
Ogden- Brigham Canal
(2) 522+84 Ogden River UTVertical Drop 48 129,592 23 35 31% 7 0.52 Monthly
271 Weber - Provo
Diversion (1) Provo River UTVertical Drop 117 207,204 11 174 21% 4 1.03 Daily
272
Weber - Provo Diversion (2)
463+38.6 Provo River UTVertical Drop 1,602 2,815,962 127 174 20% 4 1.74 Daily
273
Strawberry Highline Canal
1: 1040+11 Strawberry
Valley UT Chute 99 221,475 60 27 26% 6 0.07 Daily
274
Strawberry Highline Canal
2: 1062+00 Strawberry
Valley UT Chute 33 73,825 20 27 26% 6 0.1 Daily
275 Ogden Valley
Canal (1) Weber Basin UTVertical Drop 56 149,574 26 35 31% 7 0.55 Monthly
39

Upper Colorado Results
Object ID
Canal Site Name Project State
Structure Type
Potential Installed Capacity
(kW)
Potential Annual Energy (kWh)
Design Head (Ft)
Max Turbine
Flow (cfs)
Plant Factor
Closest Months of Distribution or Potential
Generation Transmission Available Line (Miles) Flow Data
276 Ogden Valley
Canal (2) Weber Basin UTVertical Drop 23 62,798 11 35 31% 7 0.61 Monthly
277 Willard Canal
(1) 49+42.5 Weber Basin UT Pipeline 152 352,112 10 254 27% 6 0.13 Daily
278 Willard Canal
(2) Weber Basin UTVertical Drop 204 474,273 13 254 27% 6 0.09 Daily
279 1st Bridge San Juan
Chama NMVertical Drop 219 513,222 12 300 27% 4 4.4 Seasonal
280
1st Drop Structure sta.
1565 San Juan
Chama NMVertical Drop 329 769,832 18 300 27% 4 4.35 Seasonal
281
2nd Drop Structure sta.
1702 San Juan
Chama NMVertical Drop 219 513,222 12 300 27% 4 4.01 Seasonal
282
3rd Drop Structure sta.
1831 San Juan
Chama NMVertical Drop 329 769,832 18 300 27% 4 3.69 Seasonal
283 Azotea Drop San Juan
Chama NMVertical Drop 238 555,990 13 300 27% 4 4.01 Seasonal
358 Eden Canal (4) Eden WYVertical Drop 66 153,617 9 127 27% 5 13.12 Daily
359 Angostura
Diversion Dam Middle Rio
Grande NMVertical Drop 56 282,444 5 184 59% 7 0.6 Seasonal
371 Sile Canal
Drop E Middle Rio
Grande NMVertical Drop 15 68,447 13 19 53% 8 2.57 Daily
374 Bull Basin
Drop Colbran CO Pipeline 459 1,342,626 51 126 34% 5 0.37 Daily
40

Upper Colorado Results
Object ID
Canal Site Name Project State
Structure Type
Potential Installed Capacity
(kW)
Potential Annual Energy (kWh)
Design Head (Ft)
Max Turbine
Flow (cfs)
Plant Factor
Closest Months of Distribution or Potential
Generation Transmission Available Line (Miles) Flow Data
375 Groove Creek
Drop 1 Colbran CO Chute 1,220 3,543,874 134 126 34% 5 0.75 Daily
376 Groove Creek
Drop 2 Colbran CO Chute 1,503 4,363,725 165 126 34% 5 0.45 Daily
377 Parker Basin
Drop Colbran CO Chute 610 1,771,937 67 126 34% 5 0.99 Daily
378 Salt Creek
Drop 1 Colbran CO Chute 2,411 7,055,833 269 124 34% 5 0.62 Daily
379 Salt Creek
Drop 2 Colbran CO Chute 3,643 10,578,729 400 126 34% 5 0.2 Daily
380 CP Check Uncompahgre COCheck Drop 327 1,363,160 8 572 49% 7 1.54 Daily
381 Holly Rd
Check Uncompahgre COCheck Drop 98 391,768 6 229 46% 7 0.58 Monthly
382 Loutzenhizer
Drop Uncompahgre COVertical Drop 98 391,768 6 229 46% 7 0.18 Monthly
383 East Canal
Pipeline Uncompahgre COVertical Drop 74 276,190 6 172 44% 7 0.04 Monthly
384 GH Lateral Uncompahgre COVertical Drop 52 243,557 34 25 55% 7 0.17 Seasonal
385
Junction Ironstone &
M&D Uncompahgre COVertical Drop 22 102,627 18 20 54% 7 0.32 Seasonal
386 Shavano Falls Uncompahgre COVertical Drop 5,168 20,549,889 125 572 46% 7 0.1 Monthly
387 South Canal
Drop 4 Uncompahgre CO Chute 4,242 18,653,967 73 813 51% 7 1.17 Daily
388 South Canal
Drop 5 Uncompahgre CO Chute 291 1,277,669 5 813 51% 7 0.5 Daily
41

Upper Colorado Results
42
Object ID
Canal Site Name Project State
Structure Type
Potential Installed Capacity
(kW)
Potential Annual Energy (kWh)
Design Head (Ft)
Max Turbine
Flow (cfs)
Plant Factor
Months of Potential
Generation
Closest Distribution or Transmission Line (Miles)
Available Flow Data
389 South Canal
Drop 6 Uncompahgre CO Chute 1,685 7,410,479 29 813 51% 7 0.33 Daily
390 South
Terminus Uncompahgre COVertical Drop 930 4,088,542 16 813 51% 7 0.09 Daily
391 Pipe Chute at
1058+00 Dolores CO Pipeline 2,029 7,187,372 326 86 41% 7 0.47 Daily
392 Drop at 725+45 Dolores CO
Vertical Drop 275 973,290 44 86 41% 7 0.51 Daily
393 Drop at
1041+50 Dolores COVertical Drop 275 971,686 44 86 41% 7 0.54 Daily
394 Drop at
1058+00 Dolores COVertical Drop 233 825,756 38 86 41% 7 0.33 Daily
474 Sile Canal
Drop F Middle Rio
Grande NMVertical Drop 22 100,039 19 19 53% 8 3.1 Daily
545
Steinaker Feeder Canal
Drop 1-13 Central Utah -
Vernal Unit UTSeries of Drops 1,088 1,162,000 72 209 13% 10 .30 Daily

Lower Colorado Results
Lower Colorado Results
43

Lower Colorado Results
Table 7: Lower Colorado Results
Object ID
Canal Site Name Project State
Structure Type
Potential Installed Capacity
(kW)
Potential Annual Energy (kWh)
Design Head (Ft)
Max Turbine
Flow (cfs) Plant
Factor
Months of Potential
Generation
Closest Distribution or Transmission Line (Miles)
Available Flow Data
199
Coachella (North End):
6429+24
Colorado River Basin
Salinity Control Project AZ Check Drop 670 4,475,739 17 558 78% 12 NA Monthly
215
Yuma Mesa Conduit: 0436+25
Yuma Project AZ
Series of Drops 244 1,849,332 50 68 88% 12 0 Monthly
216
Yuma Mesa Conduit: 0433+39
Yuma Project AZ
Series of Drops 36 271,297 9 68 87% 12 0 Monthly
217
Yuma Mesa Conduit: 0433+21
Yuma Project AZ
Series of Drops 38 279,929 9 68 87% 12 0 Monthly
303 Palo Verde: 242 Lateral
Colorado River Basin
Salinity Control Project AZ
Vertical Drop 345 1,813,542 50 96 61% 12 0.199 Daily
304 North Gila Turnout 1
Gila Valley Project AZ
Vertical Drop 92 499,661 20 76 64% 12 2.775 Daily
305
Reservation Main Canal
Turnout
Boulder Canyon Project CA
Vertical Drop 148 705,130 19 111 56% 12 0.104 Daily
44

Lower Colorado Results
Object ID
Canal Site Name Project State
Structure Type
Potential Installed Capacity
(kW)
Potential Annual Energy (kWh)
Design Head (Ft)
Max Turbine
Flow (cfs) Plant
Factor
Closest Months of Distribution or Potential
Generation Transmission Available Line (Miles) Flow Data
306 South Gila Terminus
Gila Project AZ Check Drop 8 38,437 20 7 54% 12 0.007 Daily
307 South Gila
Turnout Gila
Project AZVertical Drop 46 237,113 8 96 61% 12 0.014 Daily
308 Yaqui
Turnout
Boulder Canyon Project CA
Vertical Drop 30 113,984 20 24 44% 12 0.08 Daily
478 Santa Rosa Canal A-10
Central Arizona Project AZ
Vertical Drop 600 3,154,623 14 600 61% 12 0.03 Seasonal
479 Santa Rosa Canal B-1
Central Arizona Project AZ
Vertical Drop 686 3,605,284 16 600 61% 12 NA Seasonal
480 Santa Rosa Canal B-2
Central Arizona Project AZ
Vertical Drop 858 4,506,597 20 600 61% 12 NA Seasonal
481
East Main Canal TO &
Drop
Central Arizona Project AZ
Vertical Drop 154 795,159 12 180 60% 12 NA Seasonal
482
Santa Rosa Canal Gate B-
5
Central Arizona Project AZ
Vertical Drop 35 248,879 19 30 83% 12 NA Seasonal
483
Santa Rosa Canal Gate B-
7
Central Arizona Project AZ
Vertical Drop 95 526,465 19 70 64% 12 NA Seasonal
484
Santa Rosa Canal Gate B-
8
Central Arizona Project AZ
Vertical Drop 27 196,483 15 30 83% 12 NA Seasonal
45

Lower Colorado Results
Potential Potential Closest
Object ID
Canal Site Name Project State
Structure Type
Installed Capacity
(kW)
Annual Energy (kWh)
Design Head (Ft)
Max Turbine
Flow (cfs) Plant
Factor
Months of Potential
Generation
Distribution or Transmission Line (Miles)
Available Flow Data
Santa Rosa Central Canal Gate B- Arizona Vertical
485 9 Project AZ Drop 386 2,345,547 27 200 71% 12 NA Seasonal East Main Central
486 Canal Gate E
-1 Arizona Project AZ
Vertical Drop 182 787,337 15 170 50% 6 2 NA Seasonal
East Main Central
487 Canal Gate E-
2 Arizona Project AZ
Vertical Drop 109 472,402 9 170 50% 6 3 NA Seasonal
East Main Central Canal Gate E- Arizona Vertical
488 4 Project AZ Drop 51 345,951 12 70 79% 12 NA Seasonal East Main Central
Canal Gate E- Arizona Vertical 489 5 Project AZ Drop 128 669,710 15 140 61% 12 NA Seasonal
East Main Central
490 Canal Gate E-
6 Arizona Project AZ
Vertical Drop 80 347,355 11 120 50% 6 4 NA Seasonal
East Main Central Canal Gate E- Arizona Vertical
491 7 Project AZ Drop 39 210,050 8 80 63% 12 NA Seasonal East Main Central
Canal Gate E- Arizona Vertical 492 8 Project AZ Drop 34 188,998 8 70 64% 12 NA Seasonal
operates 12 months, but for 6 months flows are below the minimum operates 12 months, but for 6 months flows are below the minimum operates 12 months, but for 6 months flows are below the minimum
turbine flow requirements for the selected turbine flow requirements for the selected turbine flow requirements for the selected
turbine. turbine. turbine.
2 Canal 3 Canal 4 Canal
46

Lower Colorado Results
Object ID
Canal Site Name Project State
Structure Type
Potential Installed Capacity
(kW)
Potential Annual Energy (kWh)
Design Head (Ft)
Max Turbine
Flow (cfs) Plant
Factor
Closest Months of Distribution or Potential
Generation Transmission Available Line (Miles) Flow Data
493
East Main Canal Gate E-
10
Central Arizona Project AZ
Vertical Drop 24 126,077 8 50 60% 12 NA Seasonal
494
East Main Canal Gate E-
11
Central Arizona Project AZ
Vertical Drop 49 252,153 16 50 60% 12 NA Seasonal
495
East Main Canal Gate E-
12
Central Arizona Project AZ
Vertical Drop 43 220,634 14 50 60% 12 NA Seasonal
47

Lower Colorado Results
48
Page Left Intentionally Blank

Mid Pacific Results
Mid Pacific Results
49

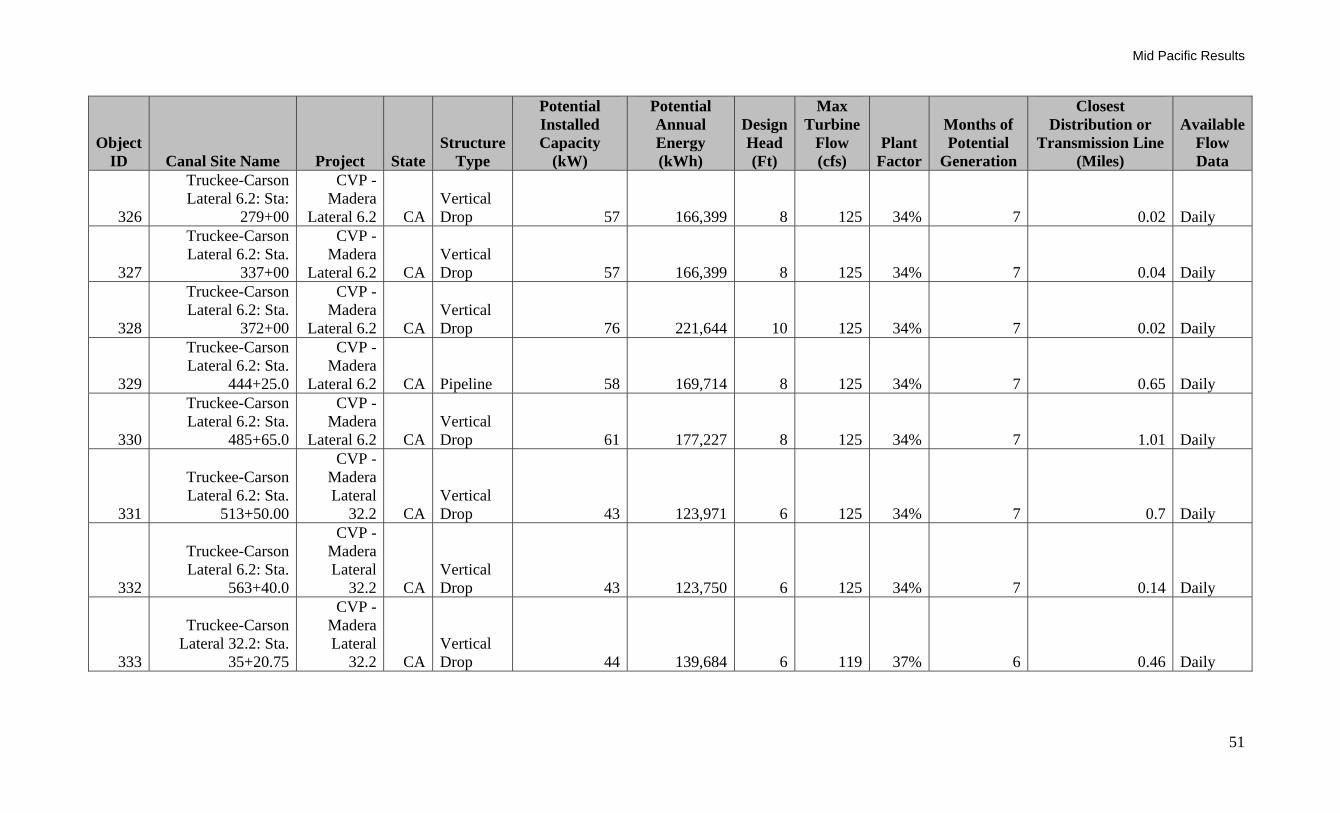
Mid Pacific Results
Table 8: Mid Pacific Results
Object ID Canal Site Name Project State
Structure Type
Potential Installed Capacity
(kW)
Potential Annual Energy (kWh)
Design Head (Ft)
Max Turbine
Flow (cfs)
Plant Factor
Months of Potential
Generation
Closest Distribution or
Transmission Line (Miles)
Available Flow Data
312 Klamath Station 48 Klamath
Project ORVertical Drop 329 845,138 18 250 30% 7 0.5 Daily
313 Klamath G Canal
Drop Klamath
Project ORVertical Drop 266 911,343 12 310 40% 7 0.5 Daily
314 Klamath D Canal
Drop Klamath
Project ORVertical Drop 118 401,799 7 255 39% 7 0.1 Daily
315 Klamath A-canal
headworks Klamath
Project ORVertical Drop 709 2,582,779 12 827 42% 7 0 Daily
316 Klamath C Canal
Spill Klamath
Project ORVertical Drop 44 153,453 40 18 41% 7 0.1 Daily
320 Truckee-Carson Station 1631+70
CVP - Madera
Lateral 6.2 CA Pipeline 361 923,498 8 610 30% 8 0.11 Daily
321
Truckee-Carson Lateral 6.2: Sta.
61+26.44
CVP - Madera
Lateral 6.2 CAVertical Drop 76 220,981 10 125 34% 7 0.83 Daily
322
Truckee-Carson Lateral 6.2: Sta.
104+00.00
CVP - Madera
Lateral 6.2 CAVertical Drop 76 221,644 10 125 34% 7 0.34 Daily
323
Truckee-Carson Lateral 6.2: Sta.
162+00
CVP - Madera
Lateral 6.2 CAVertical Drop 76 221,644 10 125 34% 7 0.11 Daily
324 Truckee-Carson
Lateral 6.2: 201+00
CVP - Madera
Lateral 6.2 CAVertical Drop 57 166,399 8 125 34% 7 0.04 Daily
325 Truckee-Carson
Lateral 6.2: 231+00
CVP - Madera
Lateral 6.2 CAVertical Drop 134 395,091 15 125 34% 7 0.04 Daily
50
Mid Pacific Results
Object ID Canal Site Name Project State
Structure Type
Potential Installed Capacity
(kW)
Potential Annual Energy (kWh)
Design Head (Ft)
Max Turbine
Flow (cfs)
Plant Factor
Closest Months of Potential
Generation
Distribution or Available Transmission Line Flow
(Miles) Data
326
Truckee-Carson Lateral 6.2: Sta:
279+00
CVP - Madera
Lateral 6.2 CAVertical Drop 57 166,399 8 125 34% 7 0.02 Daily
327
Truckee-Carson Lateral 6.2: Sta.
337+00
CVP - Madera
Lateral 6.2 CAVertical Drop 57 166,399 8 125 34% 7 0.04 Daily
328
Truckee-Carson Lateral 6.2: Sta.
372+00
CVP - Madera
Lateral 6.2 CAVertical Drop 76 221,644 10 125 34% 7 0.02 Daily
329
Truckee-Carson Lateral 6.2: Sta.
444+25.0
CVP - Madera
Lateral 6.2 CA Pipeline 58 169,714 8 125 34% 7 0.65 Daily
330
Truckee-Carson Lateral 6.2: Sta.
485+65.0
CVP - Madera
Lateral 6.2 CAVertical Drop 61 177,227 8 125 34% 7 1.01 Daily
331
Truckee-Carson Lateral 6.2: Sta.
513+50.00
CVP - Madera Lateral
32.2 CAVertical Drop 43 123,971 6 125 34% 7 0.7 Daily
332
Truckee-Carson Lateral 6.2: Sta.
563+40.0
CVP - Madera Lateral
32.2 CAVertical Drop 43 123,750 6 125 34% 7 0.14 Daily
333
Truckee-Carson Lateral 32.2: Sta.
35+20.75
CVP - Madera Lateral
32.2 CAVertical Drop 44 139,684 6 119 37% 6 0.46 Daily
51

Mid Pacific Results
Object ID Canal Site Name Project State
Structure Type
Potential Installed Capacity
(kW)
Potential Annual Energy (kWh)
Design Head (Ft)
Max Turbine
Flow (cfs)
Plant Factor
Closest Months of Potential
Generation
Distribution or Available Transmission Line Flow
(Miles) Data
334
Truckee-Carson Lateral 32.2: Sta.
84+00.00
CVP - Madera Lateral
32.2 CAVertical Drop 44 139,684 6 119 37% 6 0.78 Daily
335
Truckee-Carson Lateral 32.2: Sta.
132+00.00
CVP - Madera Lateral
32.2 CAVertical Drop 40 127,407 6 119 37% 6 0.52 Daily
336
Truckee-Carson Lateral 32.2: Sta.
173+00
CVP - Madera Lateral
32.2 CAVertical Drop 44 139,684 6 119 37% 6 0.54 Daily
337
Truckee-Carson Lateral 32.2: Sta.
402+00.00
CVP - Madera Lateral
32.2 CAVertical Drop 43 138,990 6 119 37% 6 0.5 Daily
338 Truckee-Carson A-
Head Newlands NVCheck Drop 69 443,274 6 175 75% 9 8.62 Seasonal
339 Truckee-Carson
AC1 8.52 Newlands NVCheck Drop 78 500,716 9 150 75% 9 8.61 Seasonal
340 Truckee-Carson
AC2 9.07 Newlands NVCheck Drop 69 444,200 9 125 75% 9 9.66 Seasonal
341 Truckee-Carson
AC3 11.33 Newlands NVCheck Drop 86 554,882 11 125 75% 9 10.79 Seasonal
342 Truckee-Carson
AC6 5.36 Newlands NVCheck Drop 29 183,753 5 88 75% 9 11.14 Seasonal
343 Truckee-Carson L-
Head 5.11 Newlands NVCheck Drop 59 381,730 5 163 75% 9 10.41 Seasonal
52

Mid Pacific Results
Object ID Canal Site Name Project State
Structure Type
Potential Installed Capacity
(kW)
Potential Annual Energy (kWh)
Design Head (Ft)
Max Turbine
Flow (cfs)
Plant Factor
Closest Months of Potential
Generation
Distribution or Available Transmission Line Flow
(Miles) Data
344 Truckee-Carson
LC1 7.63 Newlands NVCheck Drop 52 336,309 8 113 75% 9 11.17 Seasonal
345 Truckee-Carson
LC2 8.1 Newlands NVCheck Drop 43 277,686 8 88 75% 9 11.17 Seasonal
347 Truckee-Carson
VC3 5.19 Newlands NVCheck Drop 139 894,708 5 375 75% 9 8.63 Seasonal
349 Truckee-Carson
VC6 6.01 Newlands NVCheck Drop 150 966,997 6 350 75% 9 10.41 Seasonal
350 Truckee-Carson
VC7 6.39 Newlands NVCheck Drop 29 187,769 6 75 75% 9 11.44 Seasonal
351 Truckee-Carson
VC8 7.34 Newlands NVCheck Drop 34 215,684 7 75 75% 9 12.55 Seasonal
352 Truckee-Carson
SC2 8.24 Newlands NVCheck Drop 103 662,899 8 175 75% 9 14.93 Seasonal
353 Truckee-Carson
TC2 7.54 Newlands NVCheck Drop 108 693,240 8 200 75% 9 5.37 Seasonal
354 Truckee-Carson
TC10 9.54 Newlands NVCheck Drop 44 139,684 6 119 37% 6 10.36 Seasonal
356 Derby 10.48 Newlands NVCheck Drop 441 1,788,435 10 589 48% 12 0.49 Daily
53

Mid Pacific Results
54
Page Left Intentionally Blank

Pacific Northwest Results
Pacific Northwest Results
55
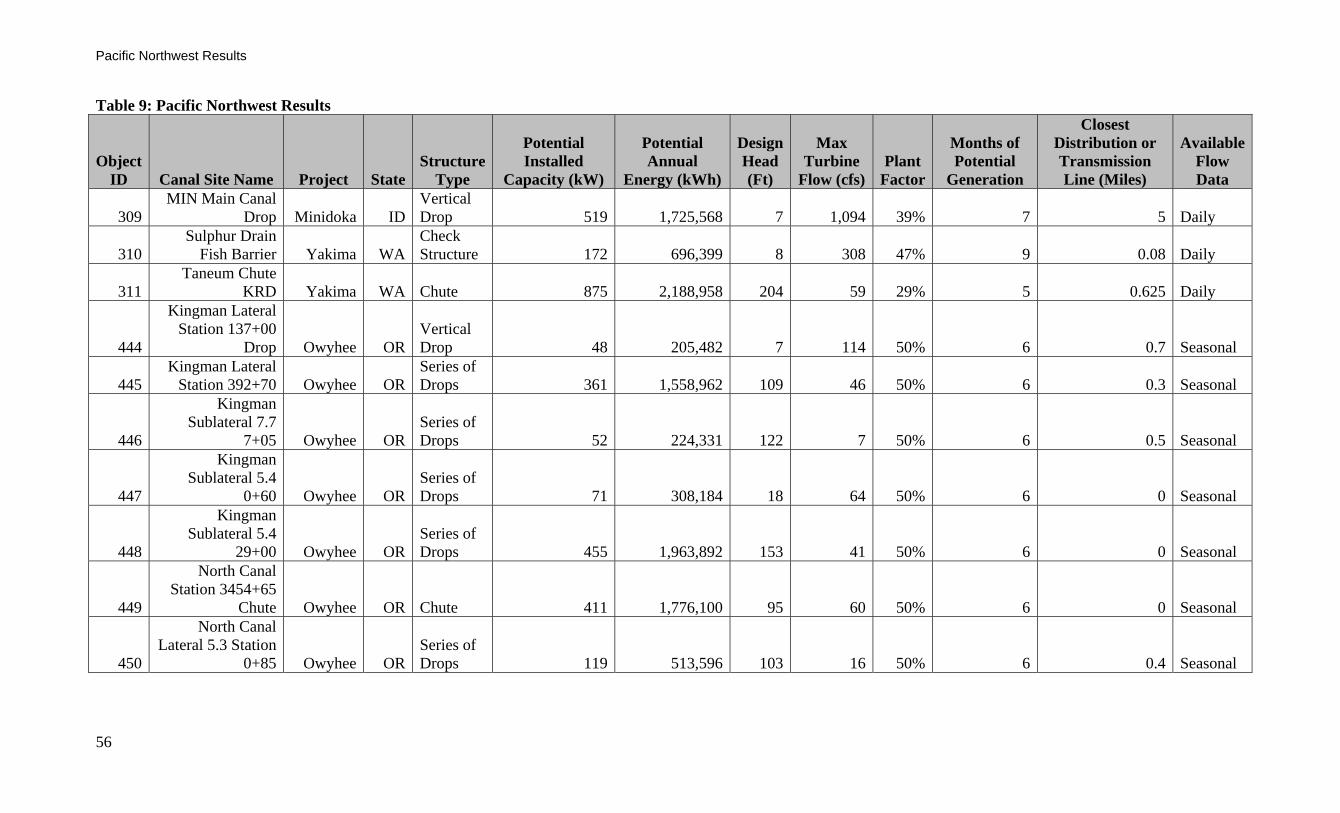
Pacific Northwest Results
Table 9: Pacific Northwest Results
Object ID Canal Site Name Project State
Structure Type
Potential Installed
Capacity (kW)
Potential Annual
Energy (kWh)
Design Head (Ft)
Max Turbine
Flow (cfs)Plant
Factor
Months of Potential
Generation
Closest Distribution or Transmission Line (Miles)
Available Flow Data
309 MIN Main Canal
Drop Minidoka IDVertical Drop 519 1,725,568 7 1,094 39% 7 5 Daily
310 Sulphur Drain
Fish Barrier Yakima WACheck Structure 172 696,399 8 308 47% 9 0.08 Daily
311 Taneum Chute
KRD Yakima WA Chute 875 2,188,958 204 59 29% 5 0.625 Daily
444
Kingman Lateral Station 137+00
Drop Owyhee ORVertical Drop 48 205,482 7 114 50% 6 0.7 Seasonal
445 Kingman Lateral
Station 392+70 Owyhee ORSeries of Drops 361 1,558,962 109 46 50% 6 0.3 Seasonal
446
Kingman Sublateral 7.7
7+05 Owyhee ORSeries of Drops 52 224,331 122 7 50% 6 0.5 Seasonal
447
Kingman Sublateral 5.4
0+60 Owyhee ORSeries of Drops 71 308,184 18 64 50% 6 0 Seasonal
448
Kingman Sublateral 5.4
29+00 Owyhee ORSeries of Drops 455 1,963,892 153 41 50% 6 0 Seasonal
449
North Canal Station 3454+65
Chute Owyhee OR Chute 411 1,776,100 95 60 50% 6 0 Seasonal
450
North Canal Lateral 5.3 Station
0+85 Owyhee ORSeries of Drops 119 513,596 103 16 50% 6 0.4 Seasonal
56

Pacific Northwest Results
Object ID Canal Site Name Project State
Structure Type
Potential Installed
Capacity (kW)
Potential Annual
Energy (kWh)
Design Head (Ft)
Max Turbine
Flow (cfs)Plant
Factor
Closest Months of Potential
Generation
Distribution or Available Transmission Flow Line (Miles) Data
451
North Canal Lateral 12.4
Station 1+00 Owyhee ORSeries of Drops 285 1,229,531 151 26 50% 6 0 Seasonal
452
North Canal Lateral 13.6
Station 7+60 Owyhee ORSeries of Drops 282 1,218,259 176 22 50% 6 0 Seasonal
453
North Canal Lateral 14.5
Station 52+30 Owyhee OR Chute 47 200,983 20 38 50% 6 0.1 Seasonal
454
North Canal Lateral 14.5
Station 153+60 Owyhee OR Chute 47 202,746 34 23 50% 6 0 Seasonal
455
North Canal Lateral 25.4
Station 1+30 Owyhee ORSeries of Drops 193 835,809 38 71 50% 6 0.7 Seasonal
456
North Canal Lateral 25.4
Station 31+25 Owyhee ORSeries of Drops 93 401,431 20 66 50% 6 0.3 Seasonal
457
North Canal Lateral 26.4
Station 3+00 Owyhee ORSeries of Drops 312 1,347,095 165 26 50% 6 0.3 Seasonal
458
North Canal Lateral 28.7
Station 11+75 Owyhee ORSeries of Drops 93 400,185 27 48 50% 6 0.04 Seasonal
459
North Canal Lateral 28.7
Station 36+20 Owyhee ORSeries of Drops 64 275,108 70 15 50% 6 0 Seasonal
57

Pacific Northwest Results
Object ID Canal Site Name Project State
Structure Type
Potential Installed
Capacity (kW)
Potential Annual
Energy (kWh)
Design Head (Ft)
Max Turbine
Flow (cfs)Plant
Factor
Closest Months of Potential
Generation
Distribution or Available Transmission Flow Line (Miles) Data
460
North Canal Lateral 31.0
Station 18+00 Owyhee ORSeries of Drops 63 273,135 52 20 50% 6 0.1 Seasonal
461
North Canal Lateral 37.6
Station 1+10 Owyhee ORSeries of Drops 135 583,372 148 15 50% 6 0.1 Seasonal
462
North Canal Lateral 38.7
Station 1+00 Owyhee ORSeries of Drops 282 1,218,041 122 32 50% 6 0 Seasonal
463
North Canal Lateral 38.7
Station 42+80 Owyhee ORSeries of Drops 99 427,725 76 18 50% 6 0.06 Seasonal
464
North Canal Lateral 60.0
Station 1+60 Owyhee ORSeries of Drops 182 784,914 66 38 50% 6 0.25 Seasonal
465
South Canal Lateral 5.7 Station
26+50 Owyhee ID Chute 356 1,539,352 40 126 50% 6 0.19 Seasonal
466
South Canal Lateral 5.7 Station
291+00 Owyhee IDSeries of Drops 157 679,466 54 40 50% 6 0 Seasonal
467
South Canal Lateral 17.1
Station 25+00 Owyhee IDSeries of Drops 177 763,149 94 26 50% 6 0.1 Seasonal
468
South Canal Lateral 17.7
Station 0+00 Owyhee IDSeries of Drops 655 2,828,551 137 66 50% 6 0.6 Seasonal
58
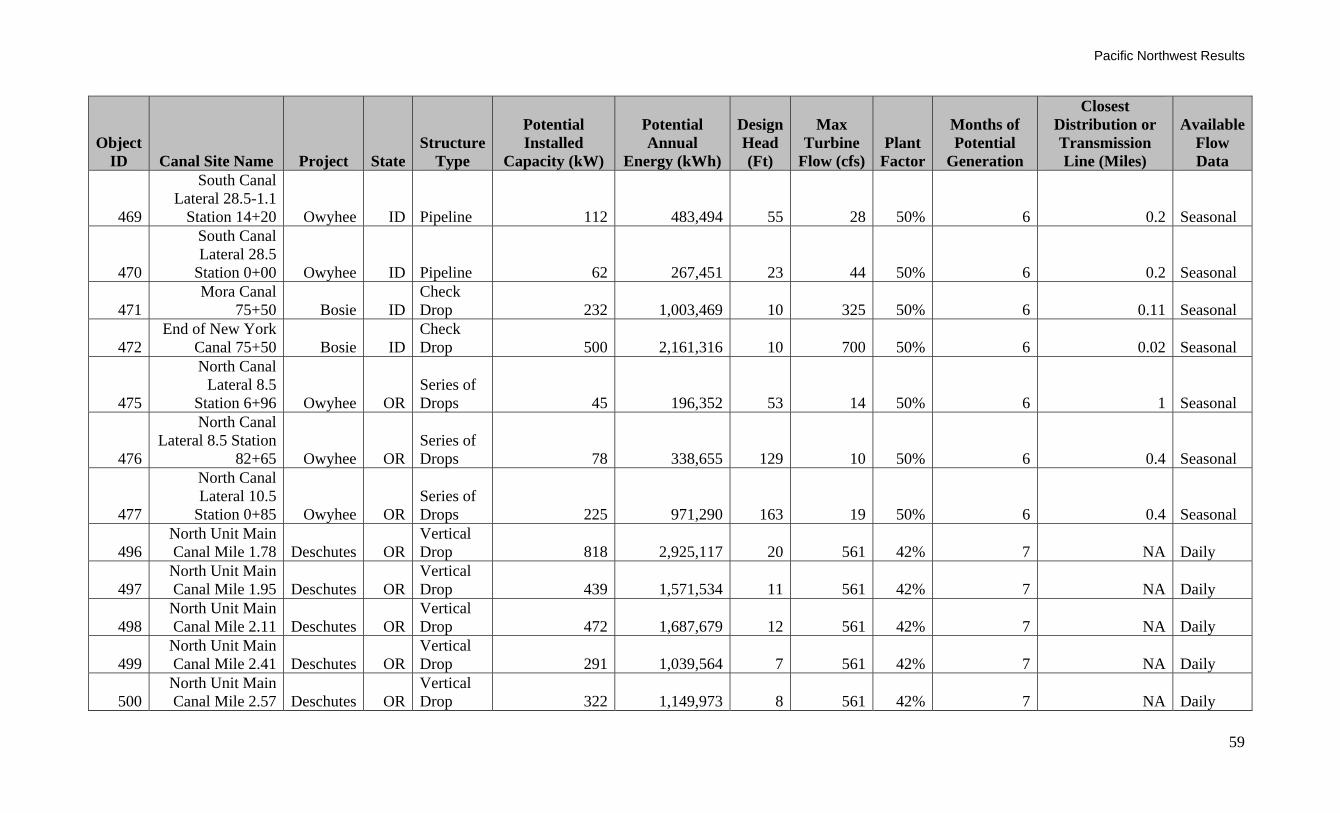
Pacific Northwest Results
Object ID Canal Site Name Project State
Structure Type
Potential Installed
Capacity (kW)
Potential Annual
Energy (kWh)
Design Head (Ft)
Max Turbine
Flow (cfs)Plant
Factor
Closest Months of Potential
Generation
Distribution or Available Transmission Flow Line (Miles) Data
469
South Canal Lateral 28.5-1.1
Station 14+20 Owyhee ID Pipeline 112 483,494 55 28 50% 6 0.2 Seasonal
470
South Canal Lateral 28.5
Station 0+00 Owyhee ID Pipeline 62 267,451 23 44 50% 6 0.2 Seasonal
471 Mora Canal
75+50 Bosie IDCheck Drop 232 1,003,469 10 325 50% 6 0.11 Seasonal
472 End of New York
Canal 75+50 Bosie IDCheck Drop 500 2,161,316 10 700 50% 6 0.02 Seasonal
475
North Canal Lateral 8.5
Station 6+96 Owyhee ORSeries of Drops 45 196,352 53 14 50% 6 1 Seasonal
476
North Canal Lateral 8.5 Station
82+65 Owyhee ORSeries of Drops 78 338,655 129 10 50% 6 0.4 Seasonal
477
North Canal Lateral 10.5
Station 0+85 Owyhee ORSeries of Drops 225 971,290 163 19 50% 6 0.4 Seasonal
496 North Unit Main Canal Mile 1.78 Deschutes OR
Vertical Drop 818 2,925,117 20 561 42% 7 NA Daily
497 North Unit Main Canal Mile 1.95 Deschutes OR
Vertical Drop 439 1,571,534 11 561 42% 7 NA Daily
498 North Unit Main Canal Mile 2.11 Deschutes OR
Vertical Drop 472 1,687,679 12 561 42% 7 NA Daily
499 North Unit Main Canal Mile 2.41 Deschutes OR
Vertical Drop 291 1,039,564 7 561 42% 7 NA Daily
500 North Unit Main Canal Mile 2.57 Deschutes OR
Vertical Drop 322 1,149,973 8 561 42% 7 NA Daily
59

Pacific Northwest Results
Object ID Canal Site Name Project State
Structure Type
Potential Installed
Capacity (kW)
Potential Annual
Energy (kWh)
Design Head (Ft)
Max Turbine
Flow (cfs)Plant
Factor
Closest Months of Potential
Generation
Distribution or Available Transmission Flow Line (Miles) Data
503 North Unit Main Canal Mile 3.52 Deschutes OR
Vertical Drop 265 947,795 7 561 42% 7 NA Daily
505 North Unit Main Canal Mile 3.67 Deschutes OR
Vertical Drop 465 1,661,869 12 561 42% 7 NA Daily
507 North Unit Main Canal Mile 6.44 Deschutes OR Chute 212 757,089 5 561 42% 7 NA Daily
508 North Unit Main Canal Mile 11.13 Deschutes OR Chute 524 1,875,516 13 561 42% 7 NA Daily
509 North Unit Main Canal Mile 11.15 Deschutes OR Chute 203 725,544 5 561 42% 7 NA Daily
510 North Unit Main Canal Mile 11.34 Deschutes OR Chute 222 792,937 6 561 42% 7 NA Daily
511 North Unit Main Canal Mile 13.05 Deschutes OR Chute 341 1,220,233 9 561 42% 7 NA Daily
517 North Unit Main Canal Mile 15.92 Deschutes OR
Vertical Drop 252 901,911 6 561 42% 7 NA Daily
518 North Unit Main Canal Mile 18.34 Deschutes OR
Vertical Drop 303 1,082,580 8 561 42% 7 NA Daily
519 North Unit Main Canal Mile 19.46 Deschutes OR
Vertical Drop 927 3,313,699 23 561 42% 7 NA Daily
520 North Unit Main Canal Mile 20.91 Deschutes OR
Vertical Drop 679 2,428,994 17 561 42% 7 NA Daily
521 North Unit Main Canal Mile 22.62 Deschutes OR
Vertical Drop 374 1,336,377 9 561 42% 7 NA Daily
522 North Unit Main Canal Mile 26.12 Deschutes OR
Vertical Drop 543 1,942,909 14 561 42% 7 NA Daily
523
North Unit Main Canal Monroe
Drop Deschutes OR Vertical Drop 526 1,733,511 15 491 40% 7 NA Daily
60

Pacific Northwest Results
Object ID Canal Site Name Project State
Structure Type
Potential Installed
Capacity (kW)
Potential Annual
Energy (kWh)
Design Head (Ft)
Max Turbine
Flow (cfs)Plant
Factor
Closest Months of Potential
Generation
Distribution or Available Transmission Flow Line (Miles) Data
524 North Unit Main Canal Mile 45.02 Deschutes OR
Vertical Drop 1,714 6,266,652 85 279 43% 7 NA Daily
525 North Unit Main
Canal Mile 47 Deschutes OR Vertical Drop 1,392 5,089,258 69 279 43% 7 NA Daily
526 North Unit Main Canal Mile 47.47 Deschutes OR
Vertical Drop 740 2,727,320 37 279 43% 7 NA Daily
527 North Unit Main Canal Mile 47.98 Deschutes OR
Vertical Drop 200 737,530 10 279 43% 7 NA Daily
528 North Unit Main Canal Mile 48.49 Deschutes OR
Vertical Drop 180 664,733 9 279 43% 7 NA Daily
529 North Unit Main Canal 50 Check Deschutes OR
Vertical Drop 199 735,325 10 279 43% 7 NA Daily
530 North Unit Main Canal Mile 52.58 Deschutes OR Chute 1,213 4,332,528 68 245 42% 7 NA Daily
531 North Unit Main Canal Mile 52.75 Deschutes OR
Vertical Drop 167 602,841 10 245 42% 7 NA Daily
532 North Unit Main Canal Mile 52.89 Deschutes OR
Vertical Drop 167 602,841 10 245 42% 7 NA Daily
533 North Unit Main Canal Mile 52.94 Deschutes OR
Vertical Drop 167 604,739 10 245 42% 7 NA Daily
534 North Unit Main Canal Mile 53.69 Deschutes OR
Vertical Drop 121 449,823 7 228 43% 7 NA Daily
535 North Unit Main Canal Mile 53.84 Deschutes OR
Vertical Drop 114 423,825 7 228 43% 7 NA Daily
536 North Unit Main Canal Mile 54.17 Deschutes OR
Vertical Drop 90 336,233 6 220 43% 7 NA Daily
538 North Unit Main Canal Mile 56.45 Deschutes OR
Vertical Drop 108 401,481 7 220 43% 7 NA Daily
61

Pacific Northwest Results
62
Object ID Canal Site Name Project State
Structure Type
Potential Installed
Capacity (kW)
Potential Annual
Energy (kWh)
Design Head (Ft)
Max Turbine
Flow (cfs)Plant
Factor
Months of Potential
Generation
Closest Distribution or Transmission Line (Miles)
Available Flow Data
539 North Unit Main Canal Mile 62.32 Deschutes OR
Vertical Drop 33 116,493 6 88 41% 7 NA Daily
540 North Unit Main Canal Mile 62.49 Deschutes OR
Vertical Drop 29 103,528 5 88 41% 7 NA Daily
541 North Unit Main Canal Mile 62.62 Deschutes OR
Vertical Drop 29 103,718 5 88 41% 7 NA Daily
542 North Unit Main Canal Mile 62.73 Deschutes OR
Vertical Drop 29 103,718 5 88 41% 7 NA Daily
543 North Unit Main Canal Mile 63.28 Deschutes OR
Vertical Drop 14 47,968 5 41 41% 7 NA Daily
544 North Unit Main Canal Mile 63.52 Deschutes OR
Vertical Drop 14 47,968 5 41 41% 7 NA Daily

![Workshop Hydropower and Fish.pptx [Schreibgeschützt] - Workshop Hydropower and Fish... · Workshop Hydropower and Fish Existing hydropower facilities: ... spawning grounds and shelter](https://static.fdocuments.us/doc/165x107/5a8733247f8b9afc5d8da3c5/workshop-hydropower-and-fishpptx-schreibgeschtzt-workshop-hydropower-and-fishworkshop.jpg)