site-amplification maps for three quadrangles in the st louis area ...
www.elsevier.com/locate/tecto
Tectonophysics 391 (
Site amplification at AvcVlar, Istanbul
M. Ergina,*, S. Ozalaybeya, M. Aktara,b, M.N. Yalcinc
aTUBITAK Marmara Research Center, Earth and Marine Sciences Research Institute, P.O. Box 21, 41470 Gebze, TurkeybBogazici University, Kandilli Observatory and Earthquake Research Institute, 81220 Cengelkoy, Turkey
cIstanbul University, Faculty of Engineering, Department of Geological Engineering, 34850 AvcV lar, Turkey
Accepted 3 June 2004
Availalbe online 27 September 2004
Abstract
AvcVlar is the suburb of Istanbul that was most heavily damaged during the August 17, 1999 Mw 7.4 Izmit earthquake.
Strong ground motion caused fatalities and damage in AvcVlar despite being ~90 km from the epicenter. We deployed five
portable seismograph stations equipped with Reftek 24-bit recorders and L4C-3D seismometers for 2 months, in order to
understand why the local site response was different from elsewhere in Istanbul. A reference station was placed on a hard rock
site, and the remaining four stations were placed on other geological units, in areas that had experienced varying levels of
damage. We calculated frequency-dependent ground amplification curves by taking the ratios of the spectra at soft and hard
rock sites. We obtained similar site response curves for most earthquakes at each site in the frequency range of 0.3–1.6 Hz, and
observed no significant site amplification beyond 2.0 Hz at any site. The overall characteristics of the recorded S-waveforms
and our modeling of the calculated site amplification curves are consistent with amplification as a result of trapping of seismic
energy within a 100–150 m thick, low-velocity subsurface layer. We also review the applicability of microtremor measurements
to estimate local site effects at AvcVlar. For these data, we used ratios of spectra of horizontal to vertical components to obtain
each site response. These results are compared with standard spectral ratios. These microtremor measurements provide
consistent estimates of the amplification at most sites at the higher end of the frequency band, namely above 1 Hz. The results
from both methods indeed agree well in this part of the frequency band. However, the microtremor method fails to detect
amplification at lower frequencies, namely b1.0 Hz.
D 2004 Elsevier B.V. All rights reserved.
Keywords: Site effect; Ground amplification; Microtremor; H/V ratios; Frequency of resonance
1. Introduction
During the 17 August 1999 Mw 7.4 Izmit earth-
quake AvcVlar, a suburb of Istanbul (Fig. 1a), suffered
0040-1951/$ - see front matter D 2004 Elsevier B.V. All rights reserved.
doi:10.1016/j.tecto.2004.07.021
* Corresponding author.
E-mail address: [email protected] (M. Ergin).
much greater damage than neighboring districts
located at similar distances and azimuths from the
epicenter. Although situated more than 90 km from
the fault rupture, strong ground motion killed about
1000 residents and caused severe building damage. A
critical question, which prompted this study, is why
this severe building damage was concentrated in
2004) 335–346
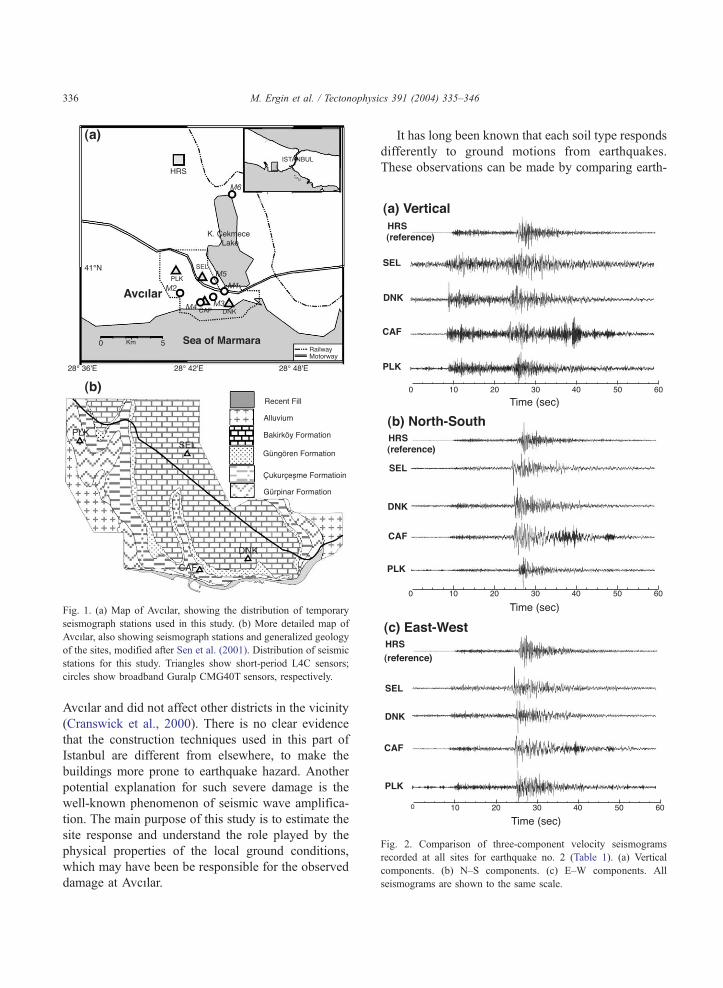
Fig. 1. (a) Map of AvcVlar, showing the distribution of temporary
seismograph stations used in this study. (b) More detailed map of
AvcVlar, also showing seismograph stations and generalized geology
of the sites, modified after Sen et al. (2001). Distribution of seismic
stations for this study. Triangles show short-period L4C sensors;
circles show broadband Guralp CMG40T sensors, respectively.
Fig. 2. Comparison of three-component velocity seismograms
recorded at all sites for earthquake no. 2 (Table 1). (a) Vertica
components. (b) N–S components. (c) E–W components. Al
seismograms are shown to the same scale.
M. Ergin et al. / Tectonophysics 391 (2004) 335–346336
AvcVlar and did not affect other districts in the vicinity
(Cranswick et al., 2000). There is no clear evidence
that the construction techniques used in this part of
Istanbul are different from elsewhere, to make the
buildings more prone to earthquake hazard. Another
potential explanation for such severe damage is the
well-known phenomenon of seismic wave amplifica-
tion. The main purpose of this study is to estimate the
site response and understand the role played by the
physical properties of the local ground conditions,
which may have been be responsible for the observed
damage at AvcVlar.
It has long been known that each soil type responds
differently to ground motions from earthquakes.
These observations can be made by comparing earth-
l
l

Table 1
List of earthquakes used
No. Region Date Origin time Lat. (8N) Long. (8E) Depth (km) Magnitude
1 Sapanca 2 April 2000 18:57:38.1 40.79 30.23 11.4 5.7
2 Sapanca 2 April 2000 23:37:18 40.88 30.18 8.5 3.3
3 Gflcqk 3 April 2000 10:17:17.8 40.77 29.74 12.8 3.2
4 Romania 6 April 2000 00:10:38.7 45.74 26.58 133.0 5.4
5 Dqzce 9 April 2000 02:32:34.1 40.79 31.15 8.7 3.2
6 BandVrma 15 April 2000 11:03:29.5 40.53 28.23 9.1 3.6
7 Honaz, Denizli 21 April 2000 12:23:08.8 37.85 29.27 14.7 5.2
8 Gemlik 28 April 2000 00:07:24.5 40.45 29.06 7.9 3.3
9 Sea of Marmara 30 April 2000 00:51:32.3 40.79 28.10 8.0 3.1
10 Karamqrsel 13 May 2000 23:46:51.6 40.75 29.65 11.1 3.0
These earthquake source parameters are taken from Kandilli Observatory and International Seismological Centre catalogues.
Fig. 3. Map of epicenters of earthquake used from within Turkey.
M. Ergin et al. / Tectonophysics 391 (2004) 335–346 337
quake records taken from sites with different under-
lying soil types. Aki (1993) summarized the results
obtained both in Japan and in the United States,
showing that site amplification depends on the
frequency of the ground motion and that younger
softer soils generally amplify ground motion more
than older and more competent soil. Some observa-
tions with moderate-sized earthquakes have also
shown that local topography can significantly affect
ground motion (e.g. Spudich et al., 1996; Celebi et al.,
1987; Seed et al., 1988; Borcherdt and Glassmoyer,
1992).
Several studies have documented that near-surface
unconsolidated sedimentary deposits can signifi-
cantly amplify seismic waves and thereby increase
the damage experienced during an earthquake (Singh
et al., 1988; Borcherdt, 1970). It is therefore
desirable to develop methods for identifying and
characterizing regions prone to this type of site
amplification. Ground motion generated by an earth-
quake is controlled by several factors, such as source
characteristics, propagation path, surface geology,
and local topography. Boatwright et al. (1991) found
a correlation between site amplification estimated
from the weak motion records of the 1989 Loma
Prieta aftershocks and the observed damage from the
mainshock in the Marina District of San Francisco.
The calculation of spectral ratios from weak
motion records is one of the most frequently
applied techniques for the estimation of site
response (Borcherdt, 1970; Borcherdt and Gibbs,
1976). In practice, this method consists of taking
the spectral ratio between the site of interest and a
nearby hard-rock side, these ratios being known as
ESRR ratios (Earthquake-based Spectra Ratio
relative to Reference site). This method assumes
that the hard-rock site is effectively transparent,
with no site complexity of its own, so it thus
provides a reference site to which ground motion
spectra at the other site can be compared. In some
cases, a suitable hard-rock reference site may not
be found in the vicinity of the site of interest. In
this situation, the vertical component is assumed to
provide the reference point and the site amplifica-
tion is regarded as obtainable using the receiver
function approach, introduced by Lengston (1979),
to obtain crustal shear wave velocity structures, by

M. Ergin et al. / Tectonophysics 391 (2004) 335–346338
dividing the spectra of the horizontal component
by the vertical one. This is known as the EHV
method (from Earthquake-based spectral ratio of
Horizontal to Vertical component). Use of this
method has been extended to evaluate S-wave
amplification using earthquake records (Lermo and
Chavez-Garcia, 1993; Field and Jacob, 1995;
Castro et al., 1996).
Both these methods require the recording of real
events with adequate energy, which can only be
captured by long observations campaigns. An
economically more attractive method, first intro-
duced by Kanai (1957), involves using ambient
seismic noise to evaluate sediment-amplification
potential. Several studies (e.g. Ohta et al., 1978;
Celebi et al., 1987; Lermo et al., 1988) have shown
that ambient seismic noise observations can reveal
the fundamental resonant frequency of surface
sediments. Nogoshi and Igarashi (1970) and Naka-
mura (1989) initially proposed a method of infer-
ring site amplification factors to incident seismic
shear waves using ratio of Horizontal to Vertical
Noise (NHV) recordings at a single site. This
method is easily applied and used to provide direct
estimates of the site amplification without requiring
a reference site. Much research has been done to
investigate the validity of this method (e.g.,
Borcherdt, 1970; Singh et al., 1988).
Following the 17 August 1999 Izmit earthquake,
detailed studies have been carried out on the ground
motion in urban Istanbul and its suburbs. By utilizing
the data from the post-mainshock instrument deploy-
ment, site effect studies have used various methods
Table 2
Distances and azimuths of earthquakes from each site
Event Region HRS SEL
D (km) A (8) D (km) A (8)
1 Sapanca 133 103 130 99
2 Sapanca 127 99 124 95
3 Gflcqk 95 111 90 106
4 Romania 546 342 555 342
5 Dqzce 210 98 206 95
6 BandVrma 72 212 66 249
7 Honaz, Denizli 362 171 352 172
8 Gemlik 76 156 67 154
9 Sea of Marmara 60 237 56 246
10 Karamqrsel 89 114 83 108
These data were calculated from the site coordinates and the source param
(Ergin et al., 2000; Meremonte et al., 2000; Ozel et al.,
2002; Kudo et al., 2002). In this article, we investigate
the site response at localities in AvcVlar district by
applying both the event-based (ESRR) and the
microtremor (NHV) methods, respectively, described
below. For this purpose, we deployed temporary
seismograph stations and recorded weak ground
motions from aftershocks of the Izmit and Dqzceearthquakes as well as other regional earthquakes. We
explored the common characteristics of the various
amplification features observed at different sites from
different events. We have tried to isolate the individ-
ual effects of local topography, soil type variation and
azimuthal dependency. We have also made a system-
atic comparison of the ESRR and NHV methods and
tested if, in the case of AvcVlar, the more economic
microtremor approach may provide an adequate
alternative.
2. Geology
In the study area, the so-called cover units of the
Istanbul region are present. They are Cenozoic in
age and rest on the Carboniferous Trakya Forma-
tion, which can be considered as basement for these
cover beds but does not itself crop out in the
AvcVlar area (Sen et al., 2001). Its nearest outcrop is
23 km outside the northern boundary of the study
area (Fig. 1b). This unit is overlain uncomfortably
by white and beige limestone, clayey limestone,
marl and siltstone of the KVrklareli and SazlVdere
Formations of Eocene age. The nearest hard rock
PLK CAF DNK
D (km) A (8) D (km) A (8) D (km) A (8)
132 99 129 99 128 99
126 95 124 94 122 95
92 106 89 104 88 105
555 343 557 342 558 342
209 96 206 95 205 95
65 217 64 220 66 221
353 172 351 172 350 172
68 153 65 153 64 155
55 245 56 249 58 249
86 107 83 107 81 108
eters listed in Table 1.

Fig. 4. Comparison of S-wave spectral ratios relative to the reference site, using the ESSR method, for events from the east and south (events 1–3
and 5–10).
M. Ergin et al. / Tectonophysics 391 (2004) 335–346 339

M. Ergin et al. / Tectonophysics 391 (2004) 335–346340
site to AvcVlar is found on the SazlVdere formation,
where the reference station HRS was installed (Fig.
1a). The GqrpVnar formation (Fig. 1b), which
consists of greenish-gray, over-consolidated clay
and siltstone, overlies the SazlVdere formation. This
Upper Oligocene unit is ~200–220 m thick and is
often highly disturbed by landsliding. Seismograph
station PLK was located on this unit (Fig. 1b). The
CukurceYme Formation, a thin (~20–40 m thick) but
widespread unit, consists of weakly consolidated or
unconsolidated sand and gravel with localised clay
or silt lenses, of Miocene age. Seismograph station
CAF was located at the contact of this unit with the
underlying GqrpVnar Formation. The BakVrkfy For-
mation, which is also Miocene but younger than the
CukurceYme Formation, consists of an alternation of
green claystone and white clayey limestone in its
lower parts, passing upward into white fossiliferous
limestone. Its thickness in the study area ranges
between 0 and 30 m, as it has been locally eroded,
being the uppermost unit of the sedimentary
sequence. Seismograph stations SEL and DNK were
located on this unit.
No active faults are reported in the study area.
These Cenozoic units are either horizontal or very
gently folded. From the soil mechanical point of view,
almost all of the cover units, except the Eocene
Sazlidere Formation, can be considered as weak to
very weak rocks. The Sazlidere Formation can be
classified as moderately strong to strong rock There-
fore, seismograph station HRS on this unit has been
taken as the reference station.
Fig. 5. Comparison of S-wave spectral ratios relative to the
reference site, using the ESSR method, for the events from the
north (event 4).
3. ESRR method: data acquisition and analysis
A network of five seismographs was deployed to
record Izmit/Dqzce aftershocks and regional earth-
quakes, within a circular area of 10 km diameter,
surrounding the AvcVlar region. Each of these
observation sites (CAF, DNK, PLK and SEL),
denoted by triangles in Fig. 1, is located on a
different sedimentary unit, as explained in Section 2;
the reference rock site (HRS) is indicated by the solid
square. Observation was carried out for two months,
starting on April 1, 2000. All stations were equipped
with three-component Mark Product L4-C velocity
seismometers, with 1 Hz natural frequency, and
Reftek digital recorders. Continuous recording at
100 samples per second was used, the length of the
each seismogram being fixed to 600 s.
The success of the standard spectral ratio techni-
que relies on the availability of a good reference
station. Site effect may affect ground motion even on
hard rock, as Tucker et al. (1984) discussed in detail.
As already noted, the HRS reference site chosen in
this study was located on hard Eocene limestone
outcrop. Fig. 2 shows examples of velocity seismo-
grams for earthquake no. 2 (Table 1), which was
observed at all sites. Amplitudes are much higher and
durations longer at other sites compared to the
reference station, as was also typically observed for
other earthquakes.
During the observation period, earthquakes
occurred in different regions of Turkey. Gflcqk and
Dqzce aftershocks, which constitute the majority, were
located ~100–150 km east of AvcVlar. Although, the
number of events recorded at the hard rock site was

M. Ergin et al. / Tectonophysics 391 (2004) 335–346 341
much higher, the signal-to-noise ratio of these events
was often too low. We have used 10 regional
earthquakes, selected on the basis of good recording
at all sites and wide azimuthal coverage. Their
epicenters are shown in Fig. 3 and source parameters
are listed in Table 1. The distances and azimuths of
these earthquakes from each station are given in Table
2. These epicentral distances range from 15 to 450 km.
These earthquakes have been partitioned into three
groups according to their azimuth: east (events 1, 2, 3,
5 and 10), south (events 6, 7, 8 and 9) and north (event
4). The eastern group consists only of aftershocks, and
event 1 in this group provided the best records in terms
of signal-to-noise ratio, magnitude and distance.
Events in the southern group are particularly useful
for testing the azimuthal dependence of site amplifi-
cation. The Honaz (Denizli) earthquake (event 7) was
the largest event to be recorded from this direction.
Only one event occurred north of the network (event 7,
Fig. 6. Stacked spectral ratios for all sites, for events groupe
in Romania; M=5.4) and was clearly recorded by all
stations. We recorded no earthquakes from the western
direction.
We have used spectral analysis of the S-wave to
estimate relative site responses at the four stations.
Seismograms of the selected events were first
corrected for the system response. Spectral ampli-
tudes were then computed for all available events and
stations. We used a constant time window to calculate
all spectral ratios, of 40 s length, starting 5 s before
and ending 35 s after the S arrival. This ensured that
only S-wave and its coda were included, and not
surface waves. This duration also ensured that the
major part of the S-wave energy was taken into
account. A cosine taper was applied over the 5% of
each record at each end, before taking the Fourier
transform. The resulting spectra were then smoothed
using an averaging filter with a bandwidth of 1/3
octave. We derived spectral ratios by dividing the
d by east or south azimuth, using the ESSR method.
M. Ergin et al. / Tectonophysics 391 (2004) 335–346342
spectrum observed at each site by that at the
reference site located on bedrock. Only the frequency
band from 0.1 to 5 Hz was included in this study.
These operations were repeated for every horizontal
component at each station, and for each recorded
earthquake.
Fig. 4 illustrates the spectral ratios obtained at four
sites relative to HRS, for each earthquake. Inspection
reveals that the peaks for each station are generally
consistent and show no significant variation between
events. All spectra have significant peaks between 0.3
and 1.2 Hz. Several sites have another significant
secondary peak at 1.5 Hz. A maximum spectral
amplification of 10 or more is typically observed at
all sites. The largest amplification is observed at CAF,
reaching ~15 at 1.0 Hz.
The Romanian earthquake (event 4) was a strong
event that occurred at a distance of ~450 km NNW of
the study area. Considering the uniqueness of its
azimuth and its size, spectral ratios for this event have
been investigated separately (Fig. 5). Like for the other
events, amplification by a factor of ~6–8 was observed
at all stations between 0.6 and 1.0 Hz.
Integrated amplification curves have been obtained
for each station, by separately stacking all spectra
from eastern and southern events (Fig. 6). A common
spectral peak at 0.3–1.2 Hz is observed for both
azimuths, although the eastern events seem to cause
slightly higher amplification. The peaks are clustered
around 0.7 Hz, with amplification reaching a factor of
8. This factor is higher at CAF, reaching 10.
Significant but smaller amplification can be observed,
especially for the southern events, at a secondary peak
at 1.5 Hz.
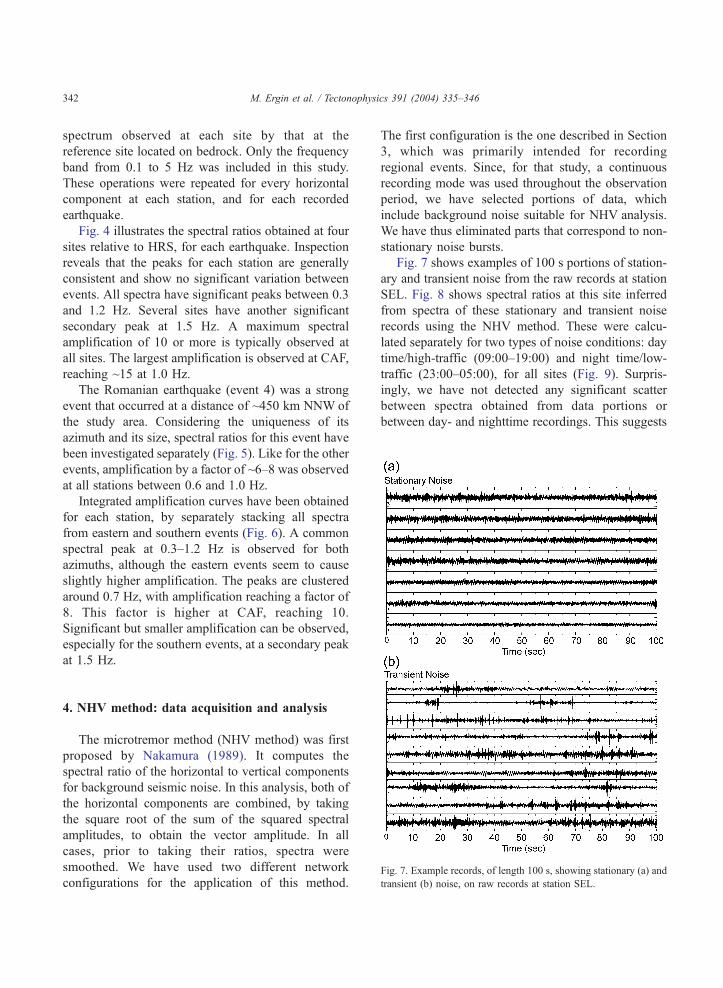
Fig. 7. Example records, of length 100 s, showing stationary (a) and
transient (b) noise, on raw records at station SEL.
4. NHV method: data acquisition and analysis
The microtremor method (NHV method) was first
proposed by Nakamura (1989). It computes the
spectral ratio of the horizontal to vertical components
for background seismic noise. In this analysis, both of
the horizontal components are combined, by taking
the square root of the sum of the squared spectral
amplitudes, to obtain the vector amplitude. In all
cases, prior to taking their ratios, spectra were
smoothed. We have used two different network
configurations for the application of this method.
The first configuration is the one described in Section
3, which was primarily intended for recording
regional events. Since, for that study, a continuous
recording mode was used throughout the observation
period, we have selected portions of data, which
include background noise suitable for NHV analysis.
We have thus eliminated parts that correspond to non-
stationary noise bursts.
Fig. 7 shows examples of 100 s portions of station-
ary and transient noise from the raw records at station
SEL. Fig. 8 shows spectral ratios at this site inferred
from spectra of these stationary and transient noise
records using the NHV method. These were calcu-
lated separately for two types of noise conditions: day
time/high-traffic (09:00–19:00) and night time/low-
traffic (23:00–05:00), for all sites (Fig. 9). Surpris-
ingly, we have not detected any significant scatter
between spectra obtained from data portions or
between day- and nighttime recordings. This suggests

Fig. 9. Spectral ratios at all L4C-type stations inferred from noise
(microtremor) spectra (using the NHV method) for daytime (08:00–
19:00) and nighttime (23:00–05:00) noise records.
Fig. 10. Spectral ratios at all broadband stations inferred from noise
(microtremor) spectra (using the NHV method).
Fig. 8. Spectral ratios at station SEL inferred from noise (micro-
tremor) spectra (using the NHV method), for stationary and
transient noise records.
M. Ergin et al. / Tectonophysics 391 (2004) 335–346 343
that the background seismic noise at AvcVlar is mostly
non-anthropogenic. We also note that microseisms do
not include much energy at low frequencies (b1.0 Hz)
as seen in the mean spectral ratios (Fig. 8). This NHV
analysis revealed small amplification factors, gener-
ally less than 3.5. More importantly, it completely
missed the peaks between 0.3 and 0.9 Hz, previously
observed using the ESRR method. However, the
secondary spectral peaks near 1.5 Hz are clearly
detected at all sites.
Our second configuration of the NHV study has
used a different observation system, including six
stations with sensors of wider frequency coverage. We
used Guralp CMG40T broadband velocity transducers
paired with Reftek recorders, which allowed a more
appropriate observation of the 0.2–1.0 Hz frequency
band. In this new configuration, the location of the
stations was slightly different from before, as shown
in Fig. 1a, except for station CAF. In order to
guarantee that human generated noise is kept to a
minimum we took only 1-h recordings very early on
Sunday mornings. In all cases, prior to taking their
ratios, spectra were smoothed.
We present the results of this second NHV experi-
ment in Fig. 10. The NHV spectrum has a similar
shape to the previous NHV results, with generally
similar peaks around 1.5 Hz with a low amplification
factor of 3–4. Station M6 has the largest amplification
factor of 6 in a wide frequency range, of 0.8–3.0 Hz.

M. Ergin et al. / Tectonophysics 391 (2004) 335–346344
This site is located on the shores of the nearby KqcqkCekmece Lake and is thus expected to reflect the
effect of thick layers of soft sediments.
Figs. 9 and 10 thus show clear similarities between
the spectra obtained by different applications of the
NHV method.
Fig. 11. Schematic diagram of trapping of seismic energy, leading to
a resonant effect.
5. Results and discussions
The systematic survey of the site response at the
district of AvcVlar, using both the ESRR and NHV
methods, has shown that significant ground amplifi-
cation exists. The ESRR method provided more
elaborate details about the nature of this ground
amplification. In particular, spectral ratios at four
different sedimentary sites with respect to a hard rock
site, computed from earthquake records using this
method, have shown that amplification occurs in the
frequency range of 0.3–1.6 Hz, more or less equally at
all sites. In addition to its frequency characteristics,
we investigated the dependence of amplification on
epicentral distance, azimuth and magnitude of the
earthquakes that were recorded.
Generally speaking, the frequency dependence of
the site amplification has shown common properties at
all sites for all events. The analysis has shown clearly
that effective amplification by a factor above 5–10
occurs in the low frequency band (0.5–0.9 Hz). A
secondary amplification is observed around the
frequency of 1.5 Hz, especially at the southern sites,
where it reaches a factor of 4–5. However, no
significant amplification is observed in the higher
frequency band (N3 Hz). Similar results were obtained
by Ozel et al. (2002), who showed that the amplifi-
cation factor at AvcVlar is ~5–10 and located in the
frequency band below 4 Hz.
It is clear that the amplification does not depend on
the azimuth of the seismic source. In other words,
waves coming from any direction cause similar
amplification at all sites, which contradicts the
focusing effects suggested by Ozel et al. (2002).
We did not observe any significant variation of
amplification with the magnitude and distance of each
seismic source. As typical example to illustrate this
point concerns the two events (1 and 2), of different
magnitudes (5.7 and 3.3; Table 1), which occurred in
the same epicentral area, caused very similar ampli-
fication at all sites (Fig. 4). The same arguments are
supported by the Romania (no. 4) and Denizli (no. 7)
earthquakes, which had similar magnitudes but differ-
ent epicentral distances, that show similar amplifica-
tion at the same frequency range (Fig. 4). We thus
conclude that site amplification at AvcVlar shows
linear behavior in the dynamic range that we have
studied.
Although the observational sites were located on
different sedimentary units, we have not detected any
significant variation in the amplification character-
istics. The resonant frequency f observed at all sites
was ~0.7 Hz. A first-order estimate of the thickness H
of the resonating layer can be calculated as
H ¼ b= 4fð Þ
(Igor et al., 1998) where b is the S-wave velocity.
Taking b as within the range 291–434 m/s (Kudo et
al., 2002), the thickness for the resonating layer can
thus be estimated as 100–150 m. We thus conclude
that thick layers of unconsolidated low-velocity sedi-
ment overlying rock basement play the primary role in
the local site response. The localized large amplifica-
tion factors and the resulting heavy damage at AvcVlar
from the Izmit mainshock are thus attributed to a
deep-seated velocity contrast. Reverberations are
clearly seen following the arrival of the S-wave train,
on all seismograms (Fig. 2). Therefore, we suggest
that trapping of body waves and subsequent resonance
was the primary cause of the observed amplification
(Fig. 11).
Comparing the results obtained by the NHV
method with the ESRR method, we found that the
M. Ergin et al. / Tectonophysics 391 (2004) 335–346 345
microtremor-based approaches revealed only a limited
amount of useful information regarding the site
response. We observed that the NHV method pro-
vided consistent estimates of the amplification at most
sites at the higher end of the frequency band, above 1
Hz. In fact, the results from both the NHV and ESRR
methods agree well in this part of the frequency band.
However, the NHV method fails to detect amplifica-
tion at lower frequencies, below 1.0 Hz. This failure
of the NHV method at low frequencies suggests that,
in this frequency band, the energy of the microtremors
is insufficient to induce any oscillatory modes at the
local site. The microtremor (NHV) method is thus
suitable for revealing peak frequencies related to
shallow structures, but is incapable of describing the
site effects of deeper structures, as illustrated by the
case of AvcVlar. We also note that, even constrained to
the high frequency band, the amplification factors
inferred from the NHV method often do not coincide
with those from the ESRR method. We thus suggest
that NHV method should only be used as part of a
preliminary survey, and its results should be assumed
to provide only a partial description of the complete
site response. Additional methods from other geo-
physical techniques need to be applied to determine
this.
Acknowledgements
We thank Cengiz TapVrdamaz and Faruk Bicmen
(TUBITAK-Earth and Marine Sciences Research
Institute) and Xqkrq Ersoy (YVldVz Technical Univer-
sity) for their help during the field study and deploy-
ment and operations of stations. This research was
supported by the AvcVlar municipality.
References
Aki, K., 1993. Local site effects on weak and strong ground motion.
Tectonophysics 218, 93–111.
Boatwright, J.I., Sekins, C., Fumal, T.E., Liu, H.P., Mueller, C.S.,
1991. Ground motion amplification in the Marina District. Bull.
Seismol. Soc. Am. 81, 1980–1997.
Borcherdt, R.D., 1970. Effects of local geology on ground motion
near San-Francisco Bay. Bull. Seismol. Soc. Am. 60 29-61-2213.
Borcherdt, R.D., Gibbs, J.F., 1976. Effects of local geological
conditions in the San Francisco Bay region on ground motions
and the intensities of the 1906 earthquake. Bull. Seismol. Soc.
Am. 66, 467–500.
Borcherdt, R.D., Glassmoyer, G., 1992. On the characteristics of
local geology and their influence on ground motions generated
by the Loma Prieta earthquake in the San Francisco Bay Region,
California. Bull. Seismol. Soc. Am. 82, 603–641.
Castro, R.R., Pacor, F., Sala, A., Petrungaro, C., 1996. S-wave
attenuation and site effects in the region of Friuli, Italy. J.
Geophys. Res. 101, 22355–22369.
Celebi, M., Dietel, C., Prince, J., Onate, M., Chavez, G., 1987. Site
amplification in Mexico city (determined from 19 September
1985 strong-motion records and from recording of weak
motions). In: Cakmak, A.S. (Ed.), Ground Motion and
Engineering Seismology. Elsevier, Amsterdam, pp. 141–152.
Cranswick, E., Ozel, O., Meremonte, M., Erdik, M., Xafak, E.,
Mueller, C., Overturr, D., Frankel, A., 2000. Earthquake
damage, site response and building response in AvcVlar, west
of Istanbul, Turkey. J. Hous. Sci. Appl. 24, 85–96.
Ergin, M., Aktar, M.T., YalcVn, N., Ozalaybey, S., 2000. AvcVlar
yfresinde yer bqyqtme etkisinin sismolojik yfntemle ara-
YtVrVlmasV. TUBlTAK Raporu, Proje no. 5007101, Gebze,
Turkey.
Field, E.H., Jacob, K.H., 1995. A comparison and test of various
site response estimation techniques, including three that are
not reference site dependent. Bull. Seismol. Soc. Am. 85,
1127–1143.
Igor, A.B., Edward, H.F., Koen, V.D.A., Paul, A.J., 1998.
Magnitude of nonlinear sediment response in Los Angeles
basin during the Northridge 1994 California earthquake. Bull.
Seismol. Soc. Am. 88, 1079–1084.
Kanai, K., 1957. The requisite conditions for predominant vibration
of ground. Bull. Earthq. Res. Inst. Univ. Tokyo 31, 457.
Kudo, K., Kanno, T., Okada, H., Ozel, O., Erdik, M., Sasatani, T.,
Higashi, S., Takahashi, M., Yoshida, K., 2002. Site-effect issues
for strong motions during the Kocaeli, Turkey, Earthquake
of 17 August 1999, as inferred from array observations of
microtremors and aftershocks. Bull. Seismol. Soc. Am. 92.1,
448–465.
Lengston, C.A., 1979. Structure under Mount Rainer, Washington,
inferred from teleseismic body waves. J. Geophys. Res. 84,
4749–4762.
Lermo, J., Chavez-Garcia, F.J., 1993. Site effect evaluation using
spectral ratios with only one station. Bull. Seismol. Soc. Am. 83,
1574–1594.
Lermo, J., Rodriquerez, M., Singh, S.K., 1988. The Mexico
earthquake of Sept. 19, 1985—natural period of sites in the
valley of Mexico from microtremor measurements and from
strong motion data. Earthq. Spectra 4, 1805–1814.
Meremonte, M., Ozel, O., Cranswick, E., Erdik, M., Xafak, E.,
Overturf, D., Frankel, A., Holzer, T., 2000. Strong-motion, site
effects and hazard issues in Republic Turkey: in light of the 17
August, 1999 earthquake and its aftershocks. The 1999 Izmit
and Dqzce Earthquakes; Preliminary Results. ITU Press,
Istanbul.
Nakamura, Y., 1989. A method for dynamic characteristics of
estimation of subsurface using microtremor on the ground.
Q. Rep. RTRI 30, 1.
M. Ergin et al. / Tectonophysics 391 (2004) 335–346346
Nogoshi, M., Igarashi, T., 1970. On the propagation characteristics
of microtremor. J. Seismol. Soc. Jpn. 23, 264–280.
Ohta, Y., Kagami, H., Goto, N., Kudo, K., 1978. Observation of 1 to
5 sec. microtremors and their application to earthquake
engineering. Bull. Earthq. Res. Inst. Univ. Tokyo 68, 767–779.
Ozel, O., Cranswick, E., Meremonte, M., Erdik, M., Xafak, E., 2002.
Site effect in AvcVlar, west of Istanbul, Turkey from strong and
weak motion data. Bull. Seismol. Soc. Am. 92, 499–508.
Seed, H.B., Romo, M.P., Dun, J.I., Jaime, A., Lysmer, J., 1988. The
Mexico earthquake of September 19, 1985—relationship
between soil condition and earthquake ground motions. Earthq.
Spectra 4, 687–729.
Sen, S., Koral, H., Onalan, M., 2001. Sedimentary and
tectonic evidence for the relationship between the Stranjha
Massif, the Paleozoic of Istanbul and the overlying
tertiary sequence. Proceedings of the 2nd International Sym-
posium on the Petroleum Geology and Hydrocarbon Potential of
the Black Sea Area, 22–24 September 1996, Sile-Istanbul,
Turkey, pp. 237–244.
Singh, S.K., Lerno, J., Dominguez, T., Ordaz, M., Espinosa, J.M.,
Mena, E., Quaas, R., 1988. The Mexico earthquake of
September 19, 1985—a study of amplification of seismic waves
in the Valley of Mexico with respect to a hill zone site. Earthq.
Spectra 4, 653–673.
Spudich, P.A., Hellweg, W., Lee, W.H.K., 1996. Directional
topographic site response at Tarzana observed in aftershocks
of the 1994 Northridge, California, earthquake, implications for
mainshock motions. Bull. Seismol. Soc. Am. 86, 193–208.
Tucker, B.E., King, L., Hatzfeld, D., Nersesov, I.L., 1984.
Observation of hard rock site effects. Bull. Seismol. Soc. Am.
74, 121–136.