SIP Revision for the Spokane County, Washington Year ... · Second 10-Year Limited Maintenance Plan...
85
i SIP Revision for the Spokane County, Washington Second 10-Year Limited Maintenance Plan for Carbon Monoxide Spokane Regional Clean Air Agency Spokane, Washington In conjunction with Air Quality Programs Washington State Department of Ecology Olympia, Washington April 2016
Transcript of SIP Revision for the Spokane County, Washington Year ... · Second 10-Year Limited Maintenance Plan...
i
SIP Revision for the
Spokane County, Washington Second 10-Year Limited Maintenance Plan
for Carbon Monoxide
Spokane Regional Clean Air Agency
Spokane, Washington
In conjunction with
Air Quality Programs Washington State Department of Ecology
Olympia, Washington
April 2016
ii April 2016
Publication and Contact Information This report is available on Spokane Regional Clean Air Agency’s website, www.SpokaneCleanAir.org. Contact: Spokane Regional Clean Air Agency Attn: Margee Chambers 3104 E. Augusta Avenue Spokane, WA 99207 Phone: (509) 477-4727 ext. #114 Fax: (509) 477-6828 Email: [email protected]
iii April 2016
Table of Contents
Publication and Contact Information ............................................................................................................ ii
Table of Contents ......................................................................................................................................... iii
List of Figures and Tables .............................................................................................................................. v
Figures ....................................................................................................................................................... v
Tables ........................................................................................................................................................ v
Acronyms and Abbreviations ....................................................................................................................... vi
Acknowledgements .................................................................................................................................... viii
Abstract/Executive Summary....................................................................................................................... ix
1.0 Introduction ............................................................................................................................................ 1
2.0 Background ............................................................................................................................................. 1
2.1 General and Historical Information .................................................................................................... 1
2.2 Planning Direction ............................................................................................................................... 3
2.3 Spokane CO Maintenance Plan Area .................................................................................................. 3
2.4 CO Monitoring Network ...................................................................................................................... 3
3.0 Air Quality Status .................................................................................................................................... 4
3.1 Exceedances ........................................................................................................................................ 4
3.2 Second Highest 8-hour Averages ........................................................................................................ 5
3.3 Design Value ........................................................................................................................................ 5
4.0 Existing CO Control Strategies ................................................................................................................ 6
4.1 Federal Motor Vehicle Emissions Control Program ............................................................................ 6
4.2 Washington State I/M Program .......................................................................................................... 6
4.3 Oxygenated Fuels ................................................................................................................................ 6
4.4 Administrative Orders ......................................................................................................................... 7
4.5 Solid Fuel Burning Device Standards................................................................................................... 7
5.0 State Measures Not In State Implementation Plan ................................................................................ 7
6.0 State Implementation Plan Requirements ............................................................................................. 8
7.0 CO Limited Maintenance Plan................................................................................................................. 8
7.1 Attainment Inventory ......................................................................................................................... 8
7.1.1 Onroad Mobile Sources ............................................................................................................. 10
7.1.2 Area Sources .............................................................................................................................. 11
7.1.3 Nonroad Mobile Sources ........................................................................................................... 11
7.1.4 Point Sources ............................................................................................................................. 12
7.1.5 Changes in Source Category Contributions ............................................................................... 12
iv April 2016
7.2 Maintenance Demonstration ............................................................................................................ 12
7.3 Verification of Continued Attainment .............................................................................................. 13
7.3.1 Alternate Method for Verification of Continued Attainment .................................................... 13
7.4 Contingency Plan............................................................................................................................... 14
7.5 Conformity Determinations .............................................................................................................. 15
7.6 Risk of a Future Violation .................................................................................................................. 15
7.7 Summary of Maintenance Plan Commitments ................................................................................. 16
Appendix A. Emission Inventory Details ..................................................................................................... 17
1 Introduction ......................................................................................................................................... 17
1.1 Purpose and Background .............................................................................................................. 17
1.2 Pollutants and Sources .................................................................................................................. 17
1.3 Spatial Resolution ......................................................................................................................... 17
1.4 Temporal Resolution ..................................................................................................................... 17
2 Statistics Used Throughout the Inventory ........................................................................................... 17
2.1 County Demographics ................................................................................................................... 17
2.2 Meteorological Parameters .......................................................................................................... 18
3 Base Year 2011 Emissions Estimates ................................................................................................... 18
3.1 Point Sources ................................................................................................................................ 18
3.2 Onroad Mobile Sources ................................................................................................................ 19
3.3 NONROAD Mobile Sources, Excluding Locomotives and Aircraft ................................................. 20
3.4 Locomotives .................................................................................................................................. 21
3.5 Silvicultural Burning (Prescribed Burning) .................................................................................... 22
3.6 Agricultural Burning ...................................................................................................................... 23
3.7 Residential Yard Waste Burning Leaf and Brush ........................................................................... 24
3.8 Municipal Solid Waste Burning ..................................................................................................... 25
3.9 Residential Fuel Use, excluding Wood .......................................................................................... 25
3.10 Residential Wood Combustion ................................................................................................... 26
Appendix B. Washington State and SRCAA Rules ....................................................................................... 28
Appendix C. EPA AirData Carbon Monoxide Data Printouts....................................................................... 29
Appendix D. Kaiser Closure Letters ............................................................................................................. 70
Appendix E. SRCAA Resolution 05-19 Repeal of Motor Fuel Specifications for Oxygenated Gasoline ...... 72
v April 2016
List of Figures and Tables
Figures Figure 1 Spokane County CO Maintenance Area .......................................................................................... 2 Figure 2 Second Highest 8-Hour CO History for Spokane ............................................................................. 5 Figure 3 Spokane CO Area Design Values, 2003-2014 .................................................................................. 6 Figure 4. Spokane CO Emission Categories and Percentages ..................................................................... 10
Tables Table 1. Spokane Monitored 8-hour CO Values and Exceedances ............................................................... 4 Table 2. Source Categories Inventoried for CO Emissions ............................................................................ 9 Table 3. Spokane CO Emissions, (SRTC, adjusted to 2014) ......................................................................... 10 Table 4. On-road CO Emissions, SRTC ......................................................................................................... 13 Table 5. Spokane Area 2010-2040 Air Quality Conformity Analysis ........................................................... 15
vi April 2016
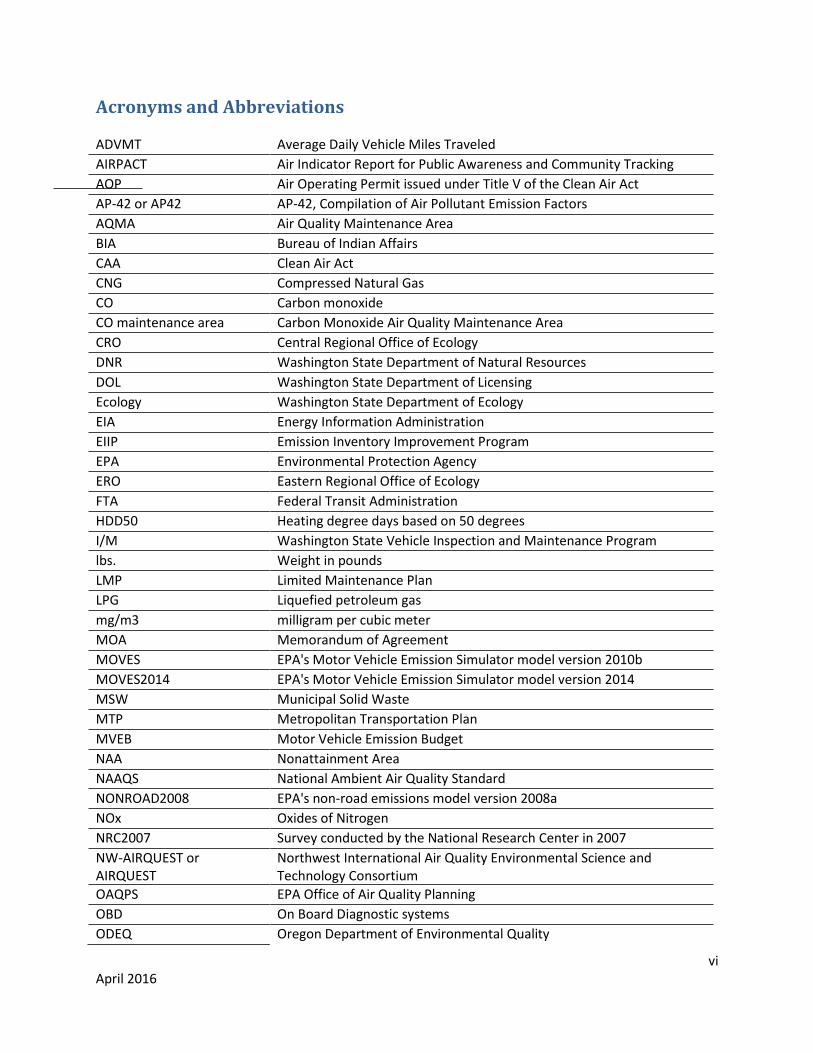
Acronyms and Abbreviations ADVMT Average Daily Vehicle Miles Traveled
AIRPACT Air Indicator Report for Public Awareness and Community Tracking
AOP Air Operating Permit issued under Title V of the Clean Air Act
AP-42 or AP42 AP-42, Compilation of Air Pollutant Emission Factors
AQMA Air Quality Maintenance Area
BIA Bureau of Indian Affairs
CAA Clean Air Act
CNG Compressed Natural Gas
CO Carbon monoxide
CO maintenance area Carbon Monoxide Air Quality Maintenance Area
CRO Central Regional Office of Ecology
DNR Washington State Department of Natural Resources
DOL Washington State Department of Licensing
Ecology Washington State Department of Ecology
EIA Energy Information Administration
EIIP Emission Inventory Improvement Program
EPA Environmental Protection Agency
ERO Eastern Regional Office of Ecology
FTA Federal Transit Administration
HDD50 Heating degree days based on 50 degrees
I/M Washington State Vehicle Inspection and Maintenance Program
lbs. Weight in pounds
LMP Limited Maintenance Plan
LPG Liquefied petroleum gas
mg/m3 milligram per cubic meter
MOA Memorandum of Agreement
MOVES EPA's Motor Vehicle Emission Simulator model version 2010b
MOVES2014 EPA's Motor Vehicle Emission Simulator model version 2014
MSW Municipal Solid Waste
MTP Metropolitan Transportation Plan
MVEB Motor Vehicle Emission Budget
NAA Nonattainment Area
NAAQS National Ambient Air Quality Standard
NONROAD2008 EPA's non-road emissions model version 2008a
NOx Oxides of Nitrogen
NRC2007 Survey conducted by the National Research Center in 2007
NW-AIRQUEST or AIRQUEST
Northwest International Air Quality Environmental Science and Technology Consortium
OAQPS EPA Office of Air Quality Planning
OBD On Board Diagnostic systems
ODEQ Oregon Department of Environmental Quality
vii April 2016
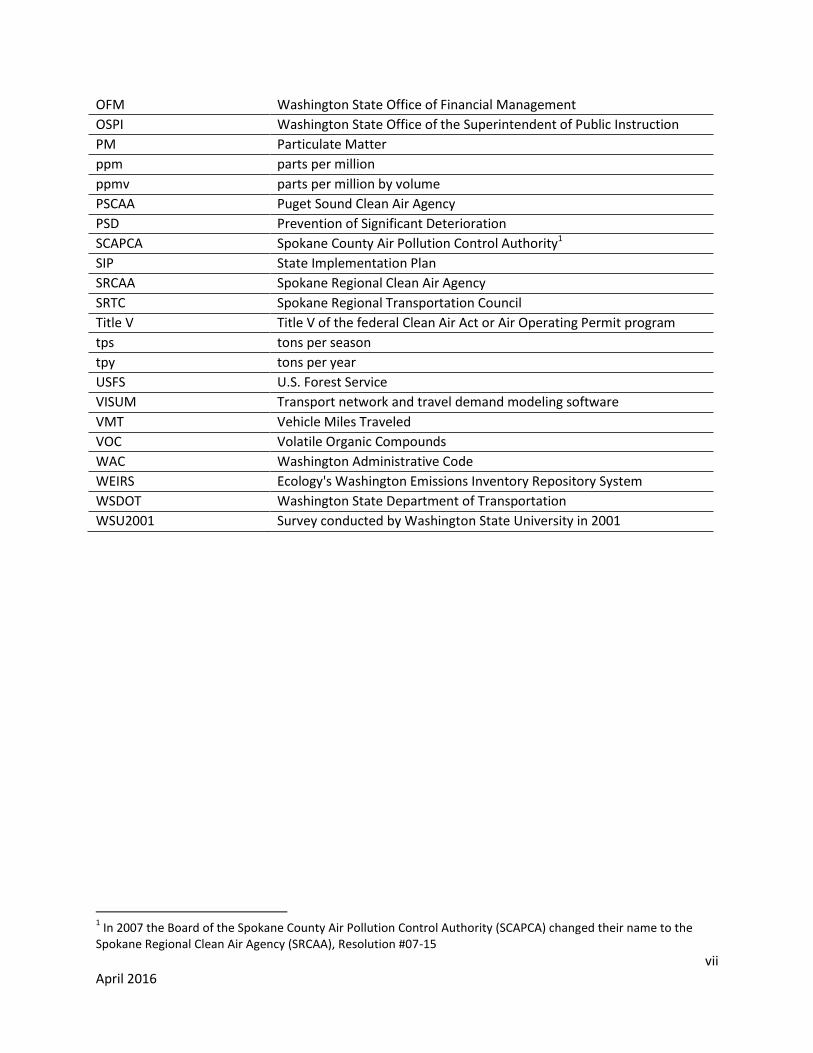
OFM Washington State Office of Financial Management
OSPI Washington State Office of the Superintendent of Public Instruction
PM Particulate Matter
ppm parts per million
ppmv parts per million by volume
PSCAA Puget Sound Clean Air Agency
PSD Prevention of Significant Deterioration
SCAPCA Spokane County Air Pollution Control Authority1
SIP State Implementation Plan
SRCAA Spokane Regional Clean Air Agency
SRTC Spokane Regional Transportation Council
Title V Title V of the federal Clean Air Act or Air Operating Permit program
tps tons per season
tpy tons per year
USFS U.S. Forest Service
VISUM Transport network and travel demand modeling software
VMT Vehicle Miles Traveled
VOC Volatile Organic Compounds
WAC Washington Administrative Code
WEIRS Ecology's Washington Emissions Inventory Repository System
WSDOT Washington State Department of Transportation
WSU2001 Survey conducted by Washington State University in 2001
1 In 2007 the Board of the Spokane County Air Pollution Control Authority (SCAPCA) changed their name to the
Spokane Regional Clean Air Agency (SRCAA), Resolution #07-15
viii April 2016
Acknowledgements The authors of this report would like to thank the following people for their contribution to this study: Spokane Regional Clean Air Agency Margee Chambers Ron Edgar Carl Gross Julie Oliver Mark Rowe April Westby Washington State Department of Ecology Laurie Hulse-Moyer Sean Lundblad Sally Otterson Mike Ragan Spokane Regional Transportation Council Anna Ragaza-Bourassa

ix April 2016
Abstract/Executive Summary The Spokane County Carbon Monoxide Maintenance Area (CO SCMA), which includes the cities of Spokane, Spokane Valley and Millwood and surrounding unincorporated areas, has been in compliance with the 8-hour carbon monoxide (CO) National Ambient Air Quality Standard (NAAQS) since 1997. The U.S. Environmental Protection Agency (EPA) originally classified Spokane as a “moderate plus” nonattainment area (NAA) based on monitoring data for 1988 and 1989. Spokane was reclassified to “serious” nonattainment due to violations of the standard in 1995. The area has been monitored in attainment of the CO 8-hour standard [9 parts per million, by volume (ppmv)] since 1997. With the completion and approval of an attainment State Implementation Plan (SIP) and maintenance plan, the Spokane County NAA was re-designated to attainment in 2005. The Clean Air Act (CAA) requires that an area re-designated from nonattainment to maintenance submit two consecutive 10-year plans for maintaining compliance with the NAAQS. This Spokane CO Plan is submitted by the Spokane Regional Clean Air Agency (SRCAA) for inclusion into the Washington SIP and will serve as the second 10-year CO maintenance plan for the CO SCMA. This document demonstrates that the Spokane area will be in compliance with the NAAQS for CO through 2025 and meets EPA requirements for a Limited Maintenance Plan (LMP). The current NAAQS for CO is 9 ppm for an 8-hour average and 35 ppm for a 1-hour average, not to be exceeded more than once per year. The current 8-hour CO design value for the Spokane CO area is 2.3 ppm based on 2013-2014 data. The Spokane area had a fairly rapid drop in ambient CO levels during the first four years of the first maintenance plan, 2005-2008, and consistently low levels through 2014. Spokane’s design value of 2.3 ppm qualifies for use of the LMP approach in preparing this CO maintenance plan. EPA detailed the LMP approach in a memorandum entitled “Limited Maintenance Plan Options for Nonclassifiable CO Nonattainment Areas” from Joseph Paisie, Group Leader, Integrated Policy and Strategies Group, Office of Air Quality Planning and Standards (OAQPS), dated October 6, 1995. (LMP Guidance) According to LMP Guidance, EPA will consider the maintenance demonstration satisfied if the monitoring data show the design value is at or below 7.65 parts per million (ppm), or 85 percent of the levels of the 8-hour CO NAAQS. The design value must be based on eight consecutive quarters of data. Another of the requirements for an area to be eligible to use the LMP option is that the control measures from the previous maintenance plan remain in the Federally-approved SIP. This plan relies on control strategies focused on the Federal Motor Vehicle Emission Control Program, an approved basic vehicle Inspection and Maintenance program, and transportation control measures. The control measures from the first 10-year CO maintenance plan include:
Federal Motor Vehicle Emission Control Program – 40 CFR Part 86
WAC 173-422-031, Vehicle Emission Inspection Schedule
WAC 173-422-170, Exemptions
WAC 173-492, Motor Fuel Specifications for Oxygenated Gasoline
Kaiser Aluminum and Chemical Corporation Administrative Order No. DE 01 AQIS-3285
Kaiser Aluminum and Chemical Corporation Administrative Order No. DE 01 AQIS-3285, Amendment # 1
x April 2016
The oxygenated fuel program was changed from a control measure to a contingency measure, WAC 173-492 and SRCAA Regulation section 6.16, in the first 10-year maintenance plan. In the first 10-year CO maintenance plan it was noted that Kaiser was shut down but there was still a possibility that it would reopen in some form. In this 2nd 10-year LMP SRCAA requests that the Kaiser Aluminum and Chemical Corporation orders be removed as the facility has permanently shut down. New Mill Capital (NMC) Mead, LLC the company that purchased the former Kaiser Aluminum and Chemical Corporation Mead Works facility in Spokane County had notified SRCAA that the facility has been permanently shut down and is be dismantled2. See Appendix D. Onroad mobile sources represent 74%3 of the total CO emission in Spokane County according to the 2011 triennial emission inventory. The Spokane Regional Transportation Council (SRTC) Metropolitan Transportation Plan (MTP) “Horizon 2040” predicts decreasing CO emission estimates4. This decrease is, in part, due to federal automobile emission standards and fleet turnover. Other efforts identified in the MTP to improve traffic flow have contributed and continue to contribute to the reductions in pollutants from cars and trucks. EPA will consider the maintenance demonstration satisfied if the monitoring data show the design value is at or below 7.65 ppm or 85% of the level of the NAAQS. In addition, when EPA approves a limited maintenance plan, the motor vehicle emission budget (MVEB) is considered not constraining for the length of the maintenance period. Since the area is in compliance with the standard, no new control strategies or new regulations will be necessary. The Spokane area meets the CO standard with existing control measures. Spokane currently has one remaining CO monitor in place to verify compliance with the standard. As part of this LMP submission, SRCAA and Ecology request discontinuing the remaining CO monitor and replacing it with an alternate strategy to ensure continued compliance with the 8-hour CO NAAQS. The proposed approach, described in Section 6.3.1, is similar to those found in the Vancouver, WA and Grants Pass, OR, LMPs. This request is being made under 40 CFR 58.14(c) which allows approval of requests to discontinue ambient monitors on a case-by-case basis if discontinuance does not compromise attainment of the 8-hour CO NAAQS. Pending EPA’s review of the proposed alternate strategy, Ecology will continue to maintain the CO monitor.
2 Letter dated April 11, 2013 to April Westby, P.E., Air Quality Engineer, Spokane Regional Clean Air Agency from
Thomas C. Messmer, Vice President – Special Projects, NMC Mead, LLC 3 Originally determined with MOVES 2010a this percentage drops to 69% with the MOVES2014 modeling
4 HORIZON 2040: The Metropolitan Transportation Plan for the Spokane Metropolitan Planning Area, Table 4.16,
Spokane Regional Transportation Council, December 12, 2013
1 April 2016
1.0 Introduction Carbon monoxide (CO) is a colorless, odorless gas emitted from combustion processes. Nationally, and particularly in urban areas, the majority of CO emissions to ambient air come from mobile sources. CO can cause harmful health effects by reducing oxygen delivery to the body's vital organs and tissues. At extremely high levels, CO can cause death. To protect public health EPA first set air quality standards for CO in 1971; an 8-hour primary standard at 9 parts per million (ppm) and a 1-hour primary standard at 35 ppm. In a review of the standards completed in 1985, EPA revoked the secondary standards (for public welfare) due to a lack of evidence of adverse effects on public welfare at or near ambient concentrations. The last review of the CO NAAQS was completed in 2011 and the EPA chose not to revise the standards at that time. Areas that have CO levels that are above the standard must develop and carry out plans to reduce CO emissions. Areas that previously violated these standards but are now in compliance, must submit plans to assure continued compliance.
2.0 Background
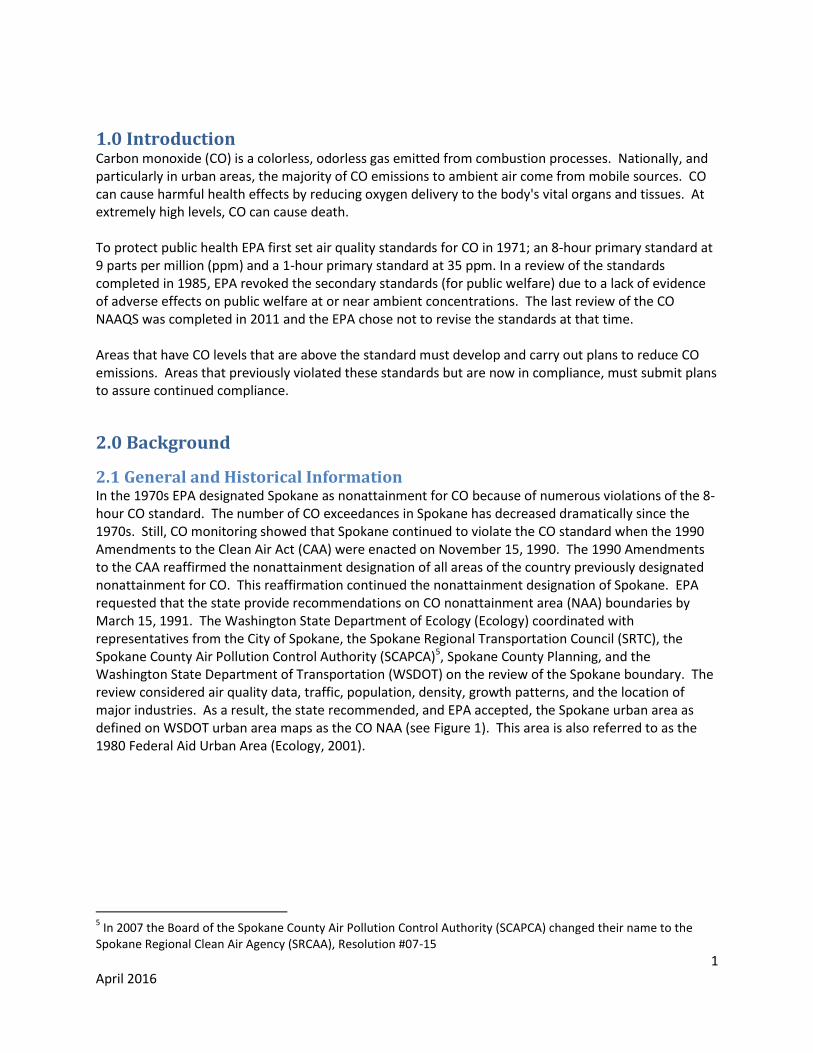
2.1 General and Historical Information In the 1970s EPA designated Spokane as nonattainment for CO because of numerous violations of the 8-hour CO standard. The number of CO exceedances in Spokane has decreased dramatically since the 1970s. Still, CO monitoring showed that Spokane continued to violate the CO standard when the 1990 Amendments to the Clean Air Act (CAA) were enacted on November 15, 1990. The 1990 Amendments to the CAA reaffirmed the nonattainment designation of all areas of the country previously designated nonattainment for CO. This reaffirmation continued the nonattainment designation of Spokane. EPA requested that the state provide recommendations on CO nonattainment area (NAA) boundaries by March 15, 1991. The Washington State Department of Ecology (Ecology) coordinated with representatives from the City of Spokane, the Spokane Regional Transportation Council (SRTC), the Spokane County Air Pollution Control Authority (SCAPCA)5, Spokane County Planning, and the Washington State Department of Transportation (WSDOT) on the review of the Spokane boundary. The review considered air quality data, traffic, population, density, growth patterns, and the location of major industries. As a result, the state recommended, and EPA accepted, the Spokane urban area as defined on WSDOT urban area maps as the CO NAA (see Figure 1). This area is also referred to as the 1980 Federal Aid Urban Area (Ecology, 2001).
5 In 2007 the Board of the Spokane County Air Pollution Control Authority (SCAPCA) changed their name to the
Spokane Regional Clean Air Agency (SRCAA), Resolution #07-15

2 April 2016
Figure 1 Spokane County CO Maintenance Area
In addition, the CO SCMA shown in Figure 1 also shows locations of the currently operating CO monitor (3rd & Washington), the previous background monitor at Gonzaga University, and the previous monitoring sites at the Spokane Club and Hamilton Street. The figure shows the location of the central business district, the locations of major roadways, and other features in the SCMA. The 1990 CAA Amendments required EPA to classify all CO nonattainment areas according to the severity of pollution. EPA based a "moderate plus" classification on 1988-89 monitoring data. The classification required the state to develop, submit, and implement a plan to attain the CO standard by December 31, 1995. In the 1995 attainment year, the 8-hour CO standard was exceeded four times at the monitor located at the intersection of Third & Washington in Spokane. The CO standard allows only one exceedance per year at a monitor. The 1990 CAA Amendments require EPA to reclassify moderate CO areas to serious if they have not attained the CO standard by the attainment date. An April 24, 1996 letter from EPA Region 10 in Seattle informed Ecology that a review of monitoring data confirmed that Spokane had not met the CO standard. EPA stated its intention to proceed with rulemaking action in the Federal Register to reclassify Spokane from "moderate plus" to "serious" nonattainment (Ecology, 2001). As a result of EPA's letter, SCAPCA implemented the contingency measure specified in the moderate plus attainment plan. The measure required the maximum allowable oxygenate in wintertime gasoline beginning with the 1996-97 CO season. This requirement increased the oxygenate requirement to 3.5 percent by weight. On July 1, 1996, EPA formally proposed reclassification of the Spokane CO NAA to
90 E
90 W
290
27
291
195
395
2
290 S
PU
R
2
291
Airports
Spokane Club
Hamilton Street
Gonzaga University
3rd & Washington
Central Business District
Spokane County Boundary
CO Non-attainment Area
Railroads
Major Roads0 0.8 1.6 2.4 3.20.4
MilesDate: Sept, 2004 Prepared by: M. Ma
E.H. Pechan & Associates Inc.
3 April 2016
serious with publication of a proposed rule in the Federal Register (61 FR 33879). Even prior to EPA's proposed reclassification, stakeholders in Spokane had raised issues about the location of the CO monitor. Recognizing the importance of an informed decision and the need to protect public health from unhealthful levels of CO, Ecology, SCAPCA, SRTC and EPA entered into a memorandum of agreement (MOA) in January 1997 with a three-fold purpose. The MOA was implemented to: 1) provide an opportunity to develop information relevant to the proposed reclassification; 2) to take proactive steps directed toward attainment and maintenance of the CO standard; and 3) to prevent future exceedances of the standard. The MOA concluded in July 1997 with an interagency review of information and control measures developed under the agreement. On April 13, 1998, EPA reclassified Spokane to serious nonattainment for CO. In September 2001, Ecology prepared an attainment plan for the Spokane serious NAA. On November 22, 2004 Ecology submitted an additional revision to the attainment plan SIP. EPA announced its proposed approval of the Spokane CO attainment plan on March 8, 2005. On May 12, 2005, EPA approved the Spokane attainment plan which became effective June 13, 2005. Ecology submitted to EPA on November 29, 2004 a maintenance plan and request for redesignation of the Spokane CO nonattainment area to attainment. June 29, 2005, EPA approved the Spokane CO Maintenance Plan effective August 29, 2005. The first 10-year CO maintenance plan ended on August 29, 2015. CO concentrations continued to drop during the first five years of the maintenance plan, and have leveled off at a point significantly below the NAAQS. Section 175A(b) of the CAA requires SRCAA prepare a second 10-year CO maintenance plan to ensure that the area will continue to meet the CO NAAQS through 2025. This Spokane CO LMP is submitted for inclusion in the Washington SIP and will serve as the second 10-year CO maintenance plan for the CO SCMA.
2.2 Planning Direction Spokane qualifies for the LMP option for the second 10-year maintenance plan. EPA’s LMP approach is detailed in the EPA guidance Memorandum “Limited Maintenance Plan Option for Nonclassifiable CO Nonattainment Areas” from Joseph Paisie of EPA OAQPS dated October 6, 1995. SRCAA and Ecology are submitting a LMP to meet the federal requirements for a second 10-year period. A base year inventory is required as part of a complete LMP submittal. The base year chosen for this work is 2011. SRCAA compiled the base year CO Emissions inventory with assistance from both Ecology and SRTC.
2.3 Spokane CO Maintenance Plan Area The geographic area of the CO SCMA includes the cities of Spokane, Spokane Valley, Millwood and surrounding urban areas as defined by the 1980 Federal Urban Aid Area. See Figure 1.
2.4 CO Monitoring Network Currently there is one CO monitor operating in Spokane County (3rd & Washington). Monitoring data has been gathered for CO in Spokane since the 1970’s at multiple locations. Figure 1 is from the first 10-year CO maintenance plan and shows the location of four monitors that were in place prior to the development of the first 10-year maintenance plan. The Spokane Club monitor was discontinued in 2003, Hamilton Street monitor was discontinued the end of June 2006 and the Gonzaga special purpose monitor ran 1988 t0 2001. Only the 3rd & Washington monitoring location operated from 2005 to present.
4 April 2016
Historically, the highest CO concentrations have been monitored in Spokane’s commercial areas (e.g. the central business district and nearby areas shown in Figure 1). In particular, these high concentrations have occurred in areas near major intersections. The 3rd & Washington site has been determined to experience some of the highest CO concentrations within the NAA. This is based on saturation studies carried out in the mid-1990's and subsequent statistical analysis of the monitoring data (Dames & Moore, 1996; Edgar, 1997, 1998; Ecology, 1997; Guttorp, 1997). From these studies, the 3rd & Washington site was shown to be a representative location for high CO concentrations in the downtown Spokane area. Monitoring site information is in Appendix C.
3.0 Air Quality Status The current NAAQS for CO is 9 ppm for an 8-hour average and 35 ppm for a 1-hour average, not to be exceeded more than once per year over at least two consecutive years. The CO SCMA is currently a maintenance area for the 8-hour CO NAAQS. The CO SCMA attained the CO NAAQS based on air quality monitoring data from 1997-1998 and has not had an exceedance since.
3.1 Exceedances EPA AirData6 data shows no exceedances of the 8-hour CO standard since 1997. Table 1 below shows the highest 8-hour values for all published AirData data for the years 1995 through 2014 for the Spokane area. Table 1. Spokane Monitored 8-hour CO Values and Exceedances
1st Max 2nd Max # Exceed Year
13.1 11.2 18 1995
10 9 2 1996
7.3 6.5 0 1997
7.7 6.8 0 1998
7.3 5.7 0 1999
6.9 5.6 0 2000
5.3 5.2 0 2001
5.9 5.2 0 2002
5 4.6 0 2003
4.5 4 0 2004
5.2 5.1 0 2005
4.6 4.1 0 2006
3.1 2.9 0 2007
2.7 2.4 0 2008
3 2.8 0 2009
2.3 1.9 0 2010
2.4 2.3 0 2011
2.1 1.9 0 2012
2.4 2.3 0 2013
2.2 1.8 0 2014
6 AirData, Access to monitored air quality data from EPA’s Air Quality System (AQS) Data Mart,
http://www.epa.gov/airdata/index.html
5 April 2016
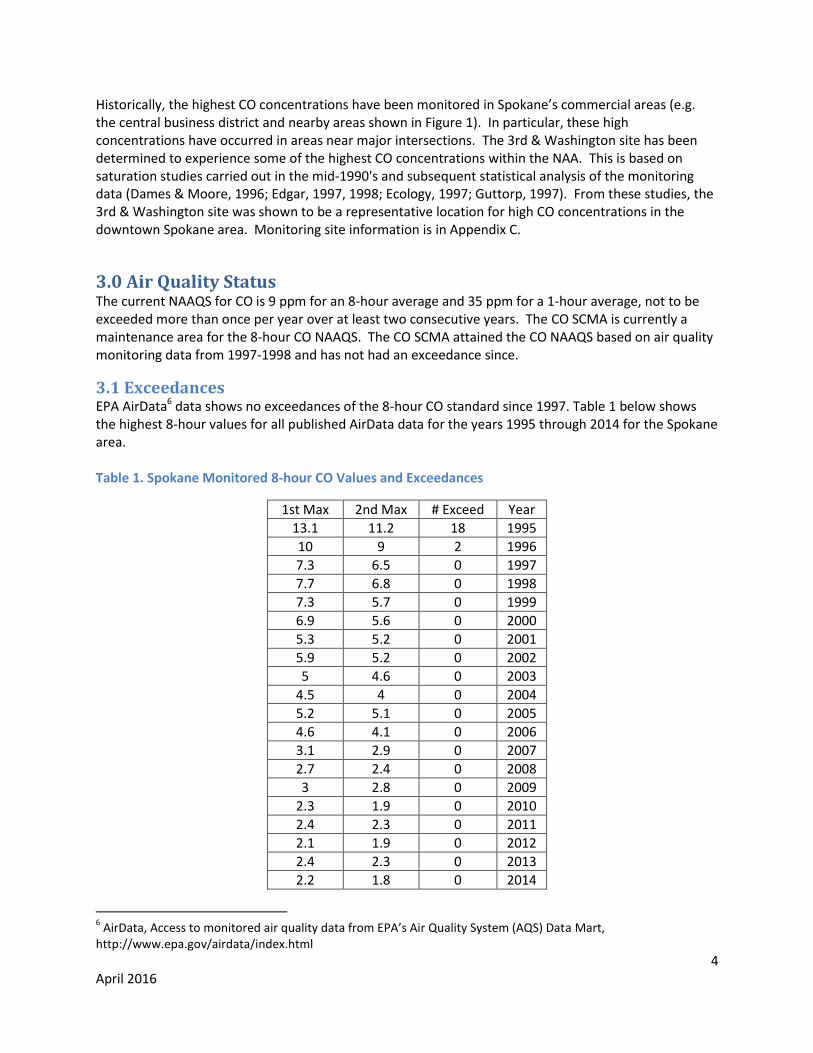
3.2 Second Highest 8-hour Averages The CO standard cannot be exceeded more than once per year. The second highest values are used to determine compliance. The second highest highs from 1995 through 2014 are shown in Figure 2 below. The figure shows that CO values have decreased significantly since the mid 90’s. Figure 2 Second Highest 8-Hour CO History for Spokane
Monitored attainment has not been due to unusual or extreme occurrences in Spokane‘s weather patterns. Conditions that can lead to CO exceedances historically occur in the winter, November through February. A prolonged period of high pressure with little mixing usually results in air stagnation that can contribute to increased CO concentrations. It has been 18 years since the last exceedance of the CO NAAQS. There has been enough variability and stagnant weather conditions during that time that could have led to higher CO levels, but CO values continue to decrease.
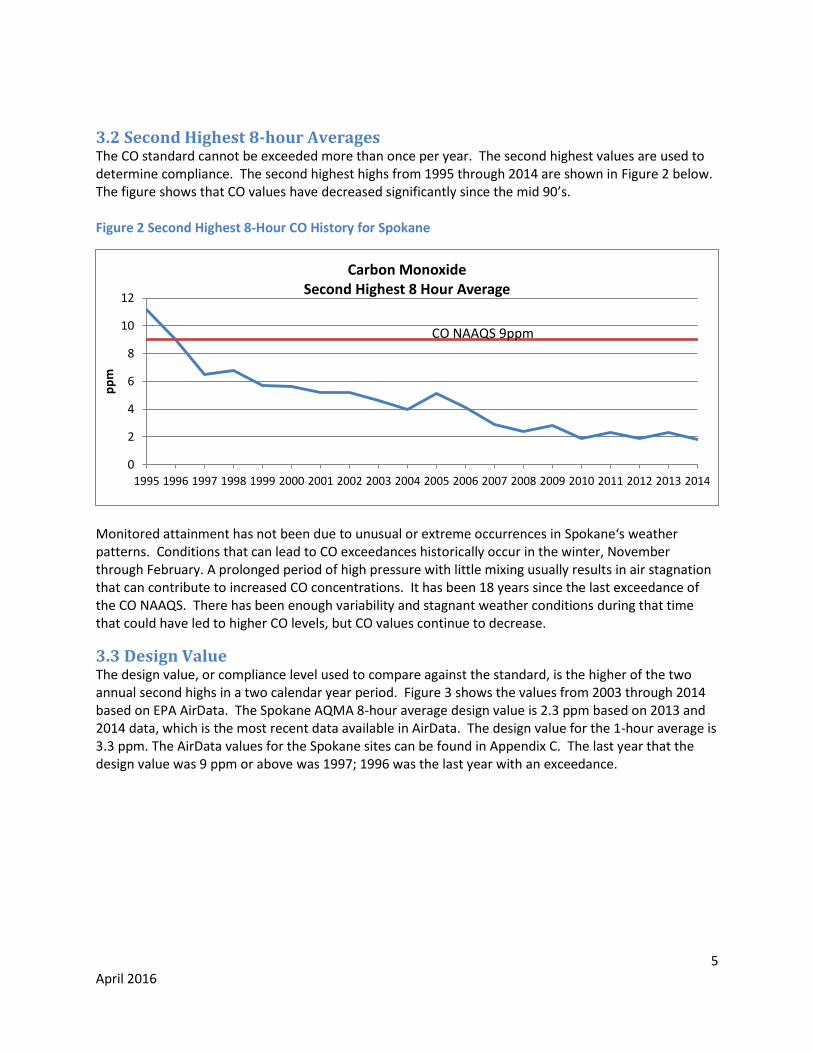
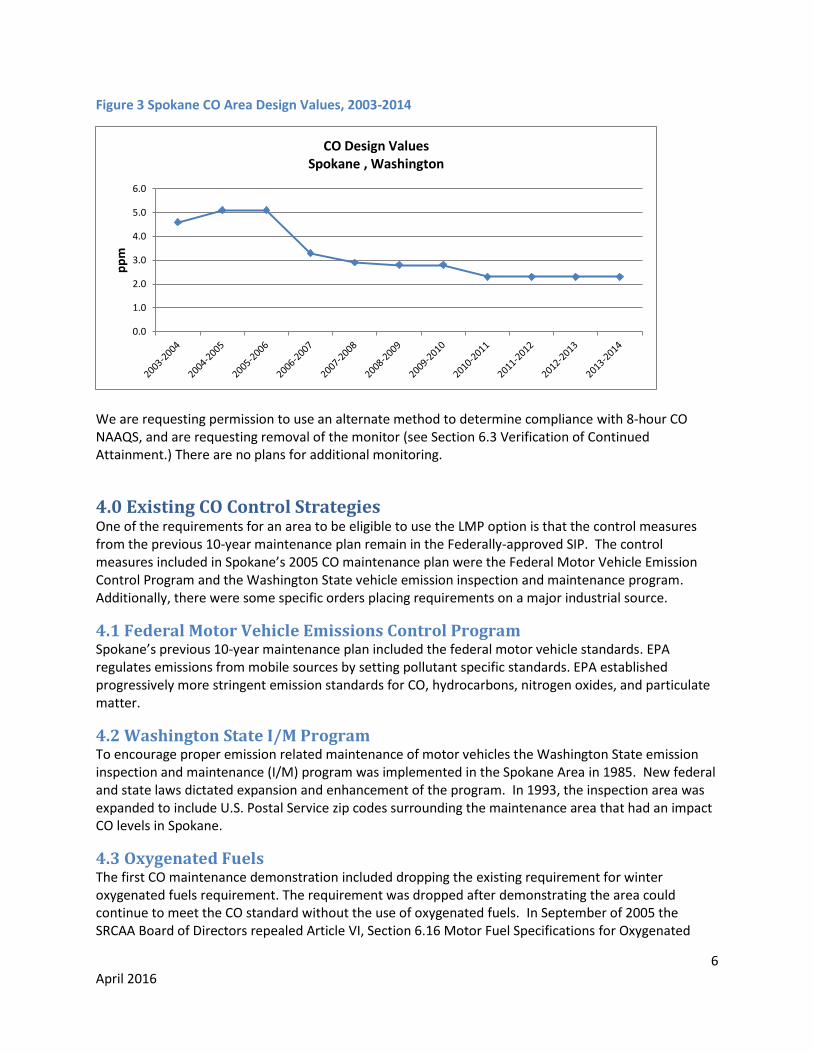
3.3 Design Value The design value, or compliance level used to compare against the standard, is the higher of the two annual second highs in a two calendar year period. Figure 3 shows the values from 2003 through 2014 based on EPA AirData. The Spokane AQMA 8-hour average design value is 2.3 ppm based on 2013 and 2014 data, which is the most recent data available in AirData. The design value for the 1-hour average is 3.3 ppm. The AirData values for the Spokane sites can be found in Appendix C. The last year that the design value was 9 ppm or above was 1997; 1996 was the last year with an exceedance.
0
2
4
6
8
10
12
1995 1996 1997 1998 1999 2000 2001 2002 2003 2004 2005 2006 2007 2008 2009 2010 2011 2012 2013 2014
pp
m
Carbon Monoxide Second Highest 8 Hour Average
CO NAAQS 9ppm
6 April 2016
Figure 3 Spokane CO Area Design Values, 2003-2014
We are requesting permission to use an alternate method to determine compliance with 8-hour CO NAAQS, and are requesting removal of the monitor (see Section 6.3 Verification of Continued Attainment.) There are no plans for additional monitoring.
4.0 Existing CO Control Strategies One of the requirements for an area to be eligible to use the LMP option is that the control measures from the previous 10-year maintenance plan remain in the Federally-approved SIP. The control measures included in Spokane’s 2005 CO maintenance plan were the Federal Motor Vehicle Emission Control Program and the Washington State vehicle emission inspection and maintenance program. Additionally, there were some specific orders placing requirements on a major industrial source.
4.1 Federal Motor Vehicle Emissions Control Program Spokane’s previous 10-year maintenance plan included the federal motor vehicle standards. EPA regulates emissions from mobile sources by setting pollutant specific standards. EPA established progressively more stringent emission standards for CO, hydrocarbons, nitrogen oxides, and particulate matter.
4.2 Washington State I/M Program To encourage proper emission related maintenance of motor vehicles the Washington State emission inspection and maintenance (I/M) program was implemented in the Spokane Area in 1985. New federal and state laws dictated expansion and enhancement of the program. In 1993, the inspection area was expanded to include U.S. Postal Service zip codes surrounding the maintenance area that had an impact CO levels in Spokane.
4.3 Oxygenated Fuels The first CO maintenance demonstration included dropping the existing requirement for winter oxygenated fuels requirement. The requirement was dropped after demonstrating the area could continue to meet the CO standard without the use of oxygenated fuels. In September of 2005 the SRCAA Board of Directors repealed Article VI, Section 6.16 Motor Fuel Specifications for Oxygenated
0.0
1.0
2.0
3.0
4.0
5.0
6.0
pp
m
CO Design Values Spokane , Washington
7 April 2016
Gasoline. This control measure was changed to a contingency measure in the first 10-year maintenance plan. This will not change and oxygenated fuels will remain in consideration as a contingency measure. This rule is still in the SIP, if needed as a contingency measure. Additionally, ethanol has become a regular component of gasoline in Washington State, because the state legislature passed a biofuels bill (Engrossed Substitute Senate Bill 6508, March 2006). Much of the gasoline sold in Spokane County has 10% ethanol, equivalent to 3.5% oxygen content.
4.4 Administrative Orders The first CO maintenance plan included considerable analysis on the impact the former Kaiser Aluminum and Chemical Corporation’s aluminum reduction plant located in Mead, Washington, north of the City of Spokane. At that time it was not known whether the closed facility would remain shut down, or some portion of it would reopen. An administrative order and a subsequent amendment to that order were issued by the Industrial Section of the Washington State Department of Ecology. Order numbers DE 01 AQIS-3285 and DE 01 AQIS-3285, Amendment #1 were issued to ensure that the facility did not contribute to an exceedance of the CO NAAQS. With the shutdown of the aluminum reduction line at the facility, administration of the Air Operating Permit (AOP) was turned over to SRCAA. In 2013, SRCAA received a letter from the new owners of the facility, NMC Mead, LLC, stating that they had permanently shut down the facility and were in the process of dismantling all equipment permitted under Air Operating Permit AOP-19 Renewal Permit #1. They would not be renewing the permit and requesting that the permit be revoked. Per their request SRCAA voided AOP-19 Renewal #1, Issued 7/6/09, SRCAA Consolidated Order 09-01, Issued 7/6/09 and all Ecology orders issued for emissions units at the facility. A new permit would be required if any facility were to open at that location in the future. Most, if not all equipment has been removed and the buildings are demolished. See Appendix D. SRCAA is requesting that Kaiser Aluminum and Chemical Corporation Administrative Orders No. DE 01 AQIS-3285 and No. DE 01 AQIS-3285, Amendment #1 be removed from the Spokane, Washington portion of the Washington State SIP.
4.5 Solid Fuel Burning Device Standards The Spokane CO attainment plan lists Chapter 173-433 WAC Solid Fuel Burning Device Standards and SRCAA Article VIII Solid Fuel Burning Device Standards as control measures. However, no reduction in CO emissions from the wood stove control program was used in the attainment demonstration. Wood stove emission were included in the background concentration, but held constant. All CO reductions were from transportation related control measures. Neither Ecology’s Chapter 173-433 WAC or SRCAA Article VIII is mentioned in the first maintenance plan for the CO SCMA. When the Chapter 173-433 WAC rule was updated, Ecology removed the CO triggers for solid fuel burning devices curtailment arguing that the burn ban program had no significant impact on attainment and maintenance of the CO NAAQS. SRCAA’s rule has also been updated to conform to the WAC and does not contain a CO trigger value for a burning ban. There was no reduction credit taken for the control of solid fuel burning devices in the CO attainment demonstration. Not having these triggers in the regulations does not affect the attainment demonstration from the first CO maintenance plan.
5.0 State Measures Not In State Implementation Plan Washington State Clean Car Law - In 2005 the Washington State Legislature passed a law (RCW 70.120A.010) directing Ecology to adopt rules to implement California motor vehicle emission standards.

8 April 2016
This resulted in following rules: “WAC 173-423-070 Emission standards, warranty, recall and other California provisions adopted by reference” and changes to, “WAC 173-423-110 (4) Warranty requirements” and “WAC 173-423-120 Recalls”. These rules became effective December 31, 2005, on all 2009 and newer model year vehicles. This rule was not part of the first 10-year maintenance plan. These additional reductions in CO were not needed to show compliance with the NAAQS but were included in the latest CO onroad emissions inventory. The SIP-approved I/M program with fleet turnover and federal Tier 1, 2, and 3 vehicles are sufficient to maintain CO levels consistent with meeting the standard such that no additional control measures are necessary.
6.0 State Implementation Plan Requirements Section 175A(b) of the CAA requires that a nonattainment area that is redesignated as a maintenance area submit two consecutive 10-year maintenance plans. EPA approved the first 10-year Spokane CO maintenance plan as part of the redesignation request in 2005. The SIP submittal developed under this second 10-year LMP will satisfy the Federal Clean Air Act requirements for the Spokane CO maintenance area.
7.0 CO Limited Maintenance Plan The Spokane area is eligible for the LMP approach. This approach simplifies the plan preparation process. EPA has allowed areas whose monitored air quality values are at or less than 85% of the CO NAAQS to submit a simpler maintenance plan than those areas where CO levels are not as low. On October 6, 1995, a guidance memorandum was issued on the Limited Maintenance Plan Option for Nonclassifiable CO Nonattainment Areas by Joseph W. Paisie of EPA. This guidance states that an area must have a design value less than 85% of the of the 8-hour CO standard (7.65 ppm) to qualify for the LMP approach. The CO SCMA currently has an 8-hour CO design value of 2.3 ppm based on 2013-2014 data. Since the design value of the Spokane area is less than 7.65 ppm, the SCMA is eligible for the LMP option. The LMP approach does not require future year emission projections or a maintenance demonstration. The LMP must include an attainment inventory, provision for verification of continued attainment, a contingency plan and a statement regarding conformity determinations. Due to the low measured CO values in Spokane over the past 18 years, SRCAA does not anticipate that CO levels will approach levels that would violate or exceed the 8-hour CO NAAQS.
7.1 Attainment Inventory SRCAA, Ecology and SRTC updated the attainment emission inventory for the second 10-year Spokane LMP. This inventory is consistent with EPA’s most recent guidance on maintenance plan emission inventories and is in a “typical winter day” format. The base year for this inventory and the maintenance plan starts with a 2011 emissions inventory. For this base year inventory, an area-specific total will be given for each source category.
Onroad mobile data is for 2015 and was done using MOVES2014 and VISUM for the travel demand modeling. This was done to meet the requirement to use the latest mobile emissions model.
9 April 2016
Point Source emissions are from SRCAA 2014 registration data which has 2013 emissions, the latest data available.
The remaining source categories are based on the Ecology 2011 Triennial Emission Inventory, projected to 2014 based on population growth.
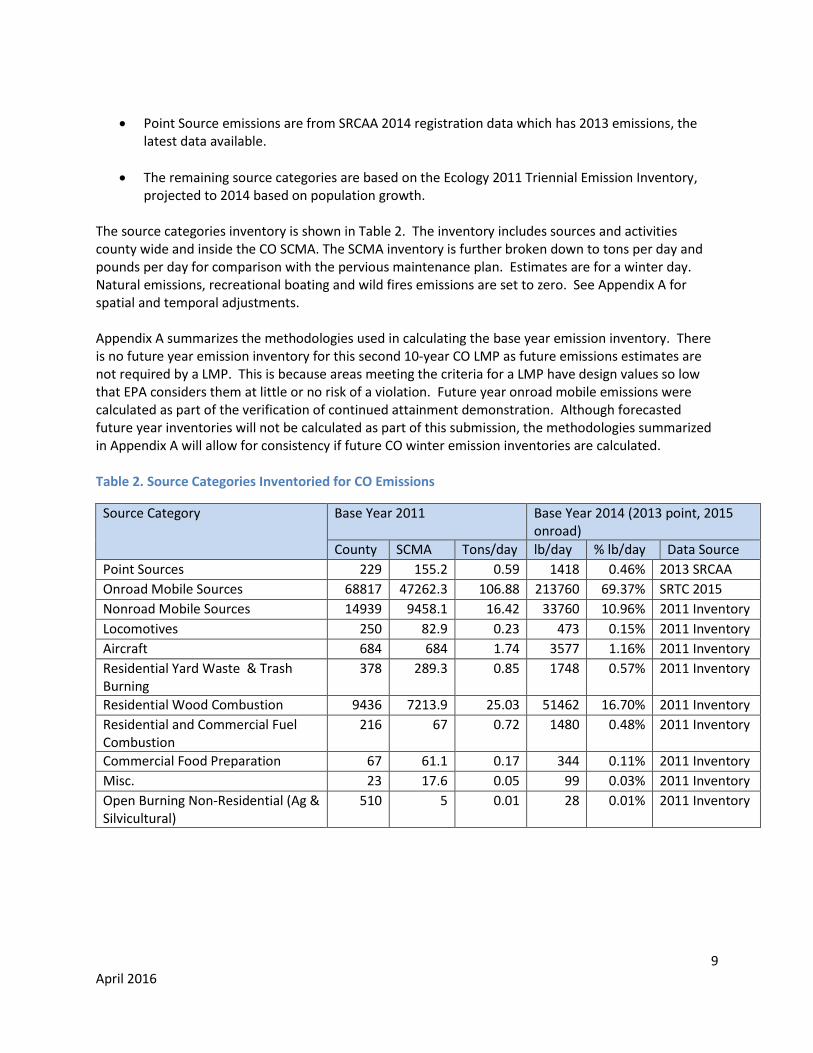
The source categories inventory is shown in Table 2. The inventory includes sources and activities county wide and inside the CO SCMA. The SCMA inventory is further broken down to tons per day and pounds per day for comparison with the pervious maintenance plan. Estimates are for a winter day. Natural emissions, recreational boating and wild fires emissions are set to zero. See Appendix A for spatial and temporal adjustments. Appendix A summarizes the methodologies used in calculating the base year emission inventory. There is no future year emission inventory for this second 10-year CO LMP as future emissions estimates are not required by a LMP. This is because areas meeting the criteria for a LMP have design values so low that EPA considers them at little or no risk of a violation. Future year onroad mobile emissions were calculated as part of the verification of continued attainment demonstration. Although forecasted future year inventories will not be calculated as part of this submission, the methodologies summarized in Appendix A will allow for consistency if future CO winter emission inventories are calculated. Table 2. Source Categories Inventoried for CO Emissions
Source Category Base Year 2011 Base Year 2014 (2013 point, 2015 onroad)
County SCMA Tons/day lb/day % lb/day Data Source
Point Sources 229 155.2 0.59 1418 0.46% 2013 SRCAA
Onroad Mobile Sources 68817 47262.3 106.88 213760 69.37% SRTC 2015
Nonroad Mobile Sources 14939 9458.1 16.42 33760 10.96% 2011 Inventory
Locomotives 250 82.9 0.23 473 0.15% 2011 Inventory
Aircraft 684 684 1.74 3577 1.16% 2011 Inventory
Residential Yard Waste & Trash Burning
378 289.3 0.85 1748 0.57% 2011 Inventory
Residential Wood Combustion 9436 7213.9 25.03 51462 16.70% 2011 Inventory
Residential and Commercial Fuel Combustion
216 67 0.72 1480 0.48% 2011 Inventory
Commercial Food Preparation 67 61.1 0.17 344 0.11% 2011 Inventory
Misc. 23 17.6 0.05 99 0.03% 2011 Inventory
Open Burning Non-Residential (Ag & Silvicultural)
510 5 0.01 28 0.01% 2011 Inventory
10 April 2016
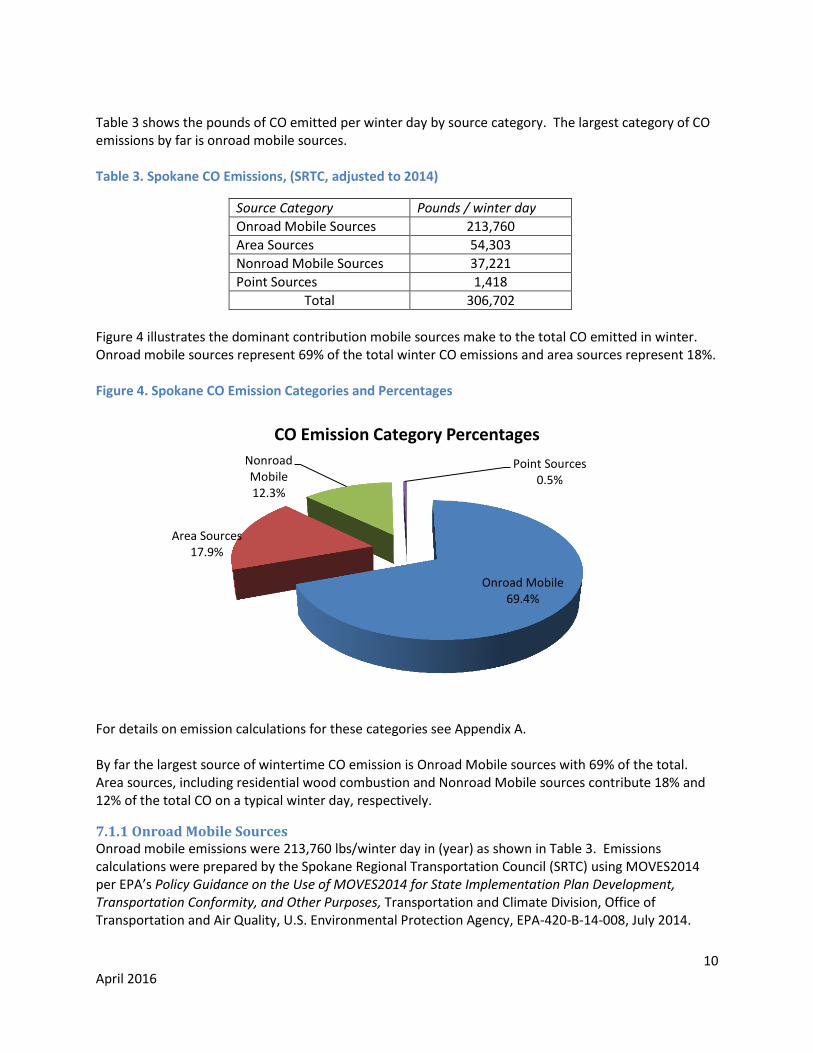
Table 3 shows the pounds of CO emitted per winter day by source category. The largest category of CO emissions by far is onroad mobile sources. Table 3. Spokane CO Emissions, (SRTC, adjusted to 2014)
Source Category Pounds / winter day
Onroad Mobile Sources 213,760
Area Sources 54,303
Nonroad Mobile Sources 37,221
Point Sources 1,418
Total 306,702
Figure 4 illustrates the dominant contribution mobile sources make to the total CO emitted in winter. Onroad mobile sources represent 69% of the total winter CO emissions and area sources represent 18%. Figure 4. Spokane CO Emission Categories and Percentages
For details on emission calculations for these categories see Appendix A. By far the largest source of wintertime CO emission is Onroad Mobile sources with 69% of the total. Area sources, including residential wood combustion and Nonroad Mobile sources contribute 18% and 12% of the total CO on a typical winter day, respectively.
7.1.1 Onroad Mobile Sources Onroad mobile emissions were 213,760 lbs/winter day in (year) as shown in Table 3. Emissions calculations were prepared by the Spokane Regional Transportation Council (SRTC) using MOVES2014 per EPA’s Policy Guidance on the Use of MOVES2014 for State Implementation Plan Development, Transportation Conformity, and Other Purposes, Transportation and Climate Division, Office of Transportation and Air Quality, U.S. Environmental Protection Agency, EPA-420-B-14-008, July 2014.
Onroad Mobile 69.4%
Area Sources 17.9%
Nonroad Mobile 12.3%
Point Sources 0.5%
CO Emission Category Percentages

11 April 2016
Average Daily Vehicle Miles Traveled (ADVMT) for the Spokane Area is calculated by SRTC using VISUM their regional travel demand model. Emission rates were generated by MOVES2014. Local data was used for the following input parameters: evaluation month, vehicle registration distribution, VMT, vehicle population, inspection and maintenance (I/M) program, California vehicle standards, and road type distribution. The parameters are described in Appendix A.
7.1.2 Area Sources Area sources represent 18% of the total CO emissions. The largest contributor to area source emissions is residential wood combustion. EPA describes area sources as “facilities or activities whose individual emissions do not qualify them as point sources”. Area sources represent numerous facilities or activities that individually release small amounts of a given pollutant, but collectively they can release significant amounts of a pollutant. SRCAA only reports major sources to Ecology for inclusion in the triennial emissions inventory. Major sources emit 100 tons per year or greater of any criteria pollutant or 10 tons per year of any one toxic air pollutant or 25 tons of any combination of toxic air pollutants and are required to have an Air Operating Permit (AOP). CO emissions from smaller sources are mostly from fuel usage. Commercial fuel usage is one of the categories in Ecology’s emissions inventory reported as an area source. In addition to commercial fuel combustion, residential fuel combustion, residential wood combustion, trash burning and residential yard waste burning are included in the area source category. Trash burning is illegal and yard waste burning is not allowed in the CO SCMA. Prescribed burning is not generally allowed in the CO SCMA with some minor exceptions for fire dependent ecosystems. These type of emissions are typically estimated by multiplying the activity level by an emission factor in mass per activity or other methodologies consistent with EPA’s guidance. Population or numbers of households are used as surrogates. 2011 area source emissions were increased by 2.8% based on the population increase between 2010 and 20147.
7.1.3 Nonroad Mobile Sources Emissions from Class I line-haul and switch yard locomotives were estimated using EPA guidance and information supplied to Ecology by the railroads. Burlington Northern Santa Fe Railway (BNSF), Union Pacific Railroad (UP) and Amtrak were included in the inventory. Class II and III railroads locomotive emissions were not inventoried. Class III railroads in Spokane County owned by Washington State Department of Transportation (WSDOT) and Spokane County do not operate within the CO SCMA. A Class II railroad, Montana Rail Link, operates over BNSF track in Spokane County and in the CO SCMA, and most of that activity would be included in BNSF’s reporting. All other emissions from nonroad mobile emission sources within the CO SCMA were calculated based on the latest version of EPA’s nonroad model (NONROAD2008). This includes recreational vehicles, recreational boats, agricultural, construction and industrial equipment and lawn and garden equipment. There are two airports in the CO SCMA, Spokane International Airport and Felts Field. Spokane International is a commercial service airport served by six airlines and two air cargo carriers. It handles
7 U.S. Census Bureau QuickFacts, Population, percent change – April 1, 2010 to July 1, 2014
12 April 2016
the majority of commercial aircraft traffic for the region and is located on the western edge of the CO SCMA. Felts Field is a general aviation airport with private aircraft and small charter companies, located on the eastern edge of the City of Spokane. The military air base, Fairchild Air Force Base, is outside of the CO SCMA to the west of Spokane and is the home of the 92nd Air Refueling Wing of the Air Mobility Command Eighteenth Air Force and the 141st Air Refueling Wing of the Washington Air National Guard. During the winter there are little or no emissions from boating, agricultural, logging or mining in the CO SCMA. Nonroad emissions contributed 12% to the total CO emissions on a typical winter day. Nonroad emissions were adjusted from the 2011 to 2014 by 2.8% based on population increase between 2010 and 20148.
7.1.4 Point Sources Under EPA’s definition point sources are defined as any stationary source with CO emissions greater than or equal to 100 tons per year (tpy). For the inventory, SRCAA included any facility listed as an AOP Title V source and are shown in the table as “major” sources. While their emissions were reported to Ecology and were reported in the 2011 triennial emission inventory SRCAA’s 2014 registration data, 2013 emissions, was used for this LMP inventory. SRCAA also listed “synthetic minor” sources as point sources. This will lead to some double counting of emissions as much of their CO emissions are included in the commercial fuel combustion category. While SRCAA has data on smaller sources their emissions are again mostly from fuel combustion, boilers, heating and generators. With the permanent closure of the Kaiser Mead facility point sources make up less than 1% of the CO emissions in the CO SCMA.
7.1.5 Changes in Source Category Contributions In the 2002 emission inventory and in the 2005 10-year maintenance plan there was considerable discussion of the Kaiser Aluminum and Chemical Corporation Mead facility. At the time it was not known if the facility would ever operate again. In the attainment demonstration inventory Kaiser was the largest point source of CO emissions. The facility is now permanently closed and any potential emissions are not included in the 2011 EI or considered in out years.
7.2 Maintenance Demonstration As explained in the EPA 1995 LMP guidance memorandum, the maintenance demonstration requirement is considered to be satisfied if the monitoring data show that the area is meeting the air quality criteria for limited maintenance area (i.e., the area CO design level is 85% of exceedance level or less than or equal to 7.65 ppm) and the area continues to meet this level through the effective date of plan approval. The Spokane area has a design value of 2.3 ppm, which is less than 7.65 ppm, the air quality criteria value for a limited maintenance area. The LMP guidance memorandum also states, “EPA believes if the area begins the maintenance period at or below 85 percent of the exceedance levels, the air quality along with the continued applicability of PSD requirements, any control measures already in the SIP, and Federal measures9, should provide adequate assurance of maintenance over the 10-year maintenance period.” Since the CO SCMA meets these criteria, the maintenance demonstration requirement is satisfied.
8 U.S. Census Bureau QuickFacts, Population, percent change – April 1, 2010 to July 1, 2014
9 e.g., 40 CFR Part 86 Federal Motor Vehicle Emission Control Program
13 April 2016
7.3 Verification of Continued Attainment The CO SCMA has been in compliance with the 8-hr CO NAAQS every year since 1997, and was redesignated to attainment in 2005 (70 FR 37269). The CO NAAQS has not been exceeded since 1996. Design values have been declining over the last ten years as shown in Section 3. SRTC’s Metropolitan Transportation Plan Air Quality Conformity Analysis for Spokane County predicts CO emissions well below the SIP budget of 558,000 lbs/day. See Table 4 below. Therefore, direct monitoring for CO concentrations is no longer necessary. Table 4. On-road CO Emissions, SRTC
CO Second 10-year Limited Maintenance Plan VMT and
Emissions Modeling 2015 2025 2035
Vehicle Miles Traveled (daily) 5,290,060 6,680,072 7,425,315
inside SCMA Boundary
CO Emissions (lbs/day) 213,760 109,085 68,004
The EPA’s LMP guidance contains provisions for continued operation of an appropriate EPA approved air quality monitoring network to verify continuing attainment with the 8-hour CO NAAQS. To meet this provision, for the past two decades, Ecology has been monitoring the SCMA in accordance with 40 CFR Part 58. As part of this LMP submission, SRCAA and Ecology request discontinuing the remaining CO monitor and replacing it with an alternate strategy to ensure continued compliance with the 8-hour CO NAAQS. The proposed approach, described in Section 6.3.1 below, is similar to those found in the Vancouver, WA and Grants Pass, OR LMPs. This request is being made under 40 CFR 58.14(c) which allows approval of requests to discontinue ambient monitors on a case-by-case basis if discontinuance does not compromise attainment of the 8-hour CO NAAQS. Pending EPA’s review of the proposed alternate strategy, Ecology will continue to maintain the CO monitor.
7.3.1 Alternate Method for Verification of Continued Attainment Using the national Triennial Emission Inventory evaluation years and beginning with year 2017, SRCAA and Ecology will compare the Spokane County total of the three major categories of CO emissions (onroad, nonroad and woodstove combustion) with the 2002 emissions. The 2002 emissions were used in the Spokane County attainment plan and first 10-year maintenance plan. The 2002 emissions from the first 10-year maintenance plan correspond to a design value for CO of 5.2 ppm. The 2002 emissions will be:
Used as the baseline for the alternate method of verification of attainment of the CO NAAQS (9.0 ppm) and verification that the area continues to meet the LMP qualification threshold (7.65 ppm).
Recalculated using current emissions estimation models for each comparison. Onroad and nonroad estimates will be prepared using model defaults, as discussed below.
If the inventory (2017, 2020 and 2023) totals are less than or equal to the 2002 CO emissions, then continued attainment and qualification under the LMP option threshold is verified. If future triennial inventories exceed the 2002 CO emissions, then Ecology will reestablish CO monitoring meeting the
14 April 2016
requirements of 40 C.F.R. Part 58 to enable EPA to determine if the area continues meet the LMP option, to ascertain continued attainment of the CO NAAQS, and to trigger contingency measures if a CO NAAQS violation were to occur. In order to maintain consistency in comparing 2002 onroad and nonroad emissions inventories to future year emission inventories, Ecology will run the models using the national default setting of a current version of the accepted model. The use of the national default settings will simplify the process and eliminate any bias due to changes in the method of gathering local input data. While the values obtained will differ from those in the Triennial Emission Inventory, their trend will be the same and proportional. A general requirement for LMP areas is that the State determine that the criteria used to qualify for the LMP option will continue to be met. As discussed above, SRCAA and Ecology will compare future year 2017, 2020 and 2023 triennial emissions analysis results to the baseline 2002 CO emissions as part of the alternate method for verification of continued attainment and continued eligibility for the LMP option. Ecology will submit this information to EPA as part of the monitoring network report submitted to the EPA annually pursuant to 40 CFR part 58. The annual network monitoring report will also be available to the public for the duration of the 10 year period at: https://fortress.wa.gov/ecy/publications/UIPages/Home.aspx
7.4 Contingency Plan Section 175A(d) of the CAA requires that a maintenance plan include contingency provisions if the NAAQS is exceeded during the maintenance period. For this 2015 CO LMP, SRCAA is retaining the contingency measure provisions approved as part of the first 10-year plan. This first 10-year plan included a winter oxygenated fuels requirement as a potential contingency measure and established a process to identify and evaluate potential contingency measures other than or in addition to the oxygenated fuels requirement. Aside from noting the minor name change from Spokane County Air Pollution Control Authority to Spokane Regional Clean Air Agency, SRCAA is making no changes to the contingency plan provisions at this time.
If triennial emissions exceed 2002 CO emissions, using the method described in the Verification of Continued Attainment section 6.3, Ecology will reinstall a CO monitor.
If a violation is confirmed at the reinstalled monitor, SRCAA will initiate a subcommittee process in coordination with SRTC, Ecology and EPA, to identify and evaluate potential contingency measures other than or in addition to the winter oxygenated fuel requirements.
SRCAA will initiate a subcommittee process no more than 60 days after being notified by Ecology that a violation is confirmed. The subcommittee will develop recommended contingency measures no more than 120 days after notification of the violation.
Within 180 days of notification, the subcommittee will present the contingency measures to the SRCAA Board of Directors or other governmental entity with jurisdiction.
A public hearing will then be held to consider the recommended contingency measures.
The necessary contingency measures will be implemented within one year of the date of the CO standard violation.
15 April 2016
7.5 Conformity Determinations One way of demonstrating conformity of federal actions is to ensure transportation projects are consistent with emissions budgets for the maintenance area. The LMP guidance states that the motor vehicle emission budget in limited maintenance plan areas may be treated as essentially not constraining for the length of the maintenance period, because it is unreasonable to expect the area will experience so much growth that a violation of the CO NAAQS will result. Therefore, the regional emissions analyses, (i.e., motor vehicle emissions budgets), is not needed. Project conformity requirements (i.e., CO hotspot analysis) and consultation will still be in effect for the CO SCMA. SRTC will continue to review project conformity and conduct project conformity analysis for the Spokane area. Current regional conformity requirements under the 2005 Spokane CO Maintenance Plan will be in effect until EPA determines that the conformity demonstration provisions in the second 10-year Spokane CO LMP are adequate or until the CO LMP is approved and adopted. SRTC’s Metropolitan Transportation Plan, Horizon 2040, demonstrates that the CO SCMA is in compliance with its regional conformity budget requirements. The CO emissions from the 2010, 2030, and 2040 future project conditions are all well below the CO Motor Vehicle Emissions Budget (MVEB) of 558,000 lbs/day as required by the approved first 10-year CO Maintenance Plan. The projected emissions decreased by 32% from 2010 to 2020 and remained fairly constant between 2020, 2030, and 2040 with emissions fluctuating less than 6% between these three points. The decrease in emissions in 2020 is primarily due to technological advances in vehicles since VMT increased 10% from 2010 to 2020. VMT also increased by 14% from 2020 to 2030 and again by 8% from 2030 to 2040. These modest increases in VMT should be mitigated by vehicle technology allowing the modeled emissions to stay below the MVEB. See Table 5. Table 5. Spokane Area 2010-2040 Air Quality Conformity Analysis10
2010 2020 2030 2040
Vehicle Trips 1,388,341 1,565,771 1,757,588 1,906,403
Daily VMT11 5,605,587 6,234,532 7,125,611 7,725,018
CO Emissions (pounds)12
509,667 348,396 367,579 354,843
7.6 Risk of a Future Violation The Spokane area is at little risk of future violations. Spokane has not exceeded the CO NAAQS since 1996. The 2013-2014 design value is 2.3 ppm, well below the 8-hour standard of 9 ppm. CO levels have been consistently below the 8-hour CO NAAQS for more than ten years. Also, the SRTC Metropolitan Transportation Plan for Spokane County concludes that the CO emissions estimates will remain well below the original budget in the first 10-year maintenance plan. Onroad mobile sources have historically been the largest contributor to CO emissions and represent the majority of the CO emissions in the 2011 triennial emissions inventory. Reductions in this source category are predicted for this next 10-year plan.
10
Data from Table 4.16 of the SRTC Horizon 2040 MTP, Horizon 2040 modeling was done with MOVES 2010a. 11
VMT inside the CO Maintenance Area 12
MOVES was used for this analysis

16 April 2016
Because of the efforts of cities and county transportation departments and SRTC to optimize traffic flow and federal automobile standards as well as other pollution prevention efforts, it is unlikely that CO levels will be problematic for the Spokane area in the future. CO levels have been well below the standard for many years, and the design value for the area is also well below the standard. There is very little risk that CO levels will increase and threaten air quality in the Spokane Area.
7.7 Summary of Maintenance Plan Commitments
Commitment Responsible Agency
Comparison of future year 2017, 2020 and 2023 CO emissions to the baseline 2002 CO emissions
SRCAA (in cooperation with Ecology)
Annual reporting to EPA on continued qualification for the LMP option in the annual monitoring network report
Ecology
Reporting to EPA on continued CO attainment in the annual monitoring network report
Ecology
Reestablishment of CO monitoring if future year 2017, 2020 and 2023 CO emissions exceed the baseline 2002 CO emissions
Ecology (in cooperation with SRCAA)
Implementation of the contingency measure provisions if the Spokane maintenance area violates the CO NAAQS
SRCAA
17 April 2016
Appendix A. Emission Inventory Details
1 Introduction The following describes the methods and procedures used to develop the Washington State triennial inventory as spelled out in the Washington State 2011 County Emissions Inventory. There was some variation from the 2011 inventory as related to onroad and point source emission. Area and nonroad source emissions based on population were adjusted for population growth between 2010 and 2014 as found in the U.S. Census Bureau QuickFacts, Population, percent change. These changes are noted in the main LMP document and this Appendix A.
1.1 Purpose and Background An emissions inventory is part of an overall air quality management program. Emissions inventories are used in SIP attainment/maintenance planning, air quality forecasting, other air quality planning and rule efforts, public information, point source fee generation, and to meet federal air quality reporting requirements. A complete emissions inventory contains emissions from point, area, mobile and biogenic sources of air pollution. This document describes the methods and data sources employed to estimate emissions for base year 2011. Emissions were estimated for criteria pollutants. Discretion should be used when comparing results between different inventory years. What appear to be emissions changes may instead reflect: (1) changes in emissions estimation models, methodologies, and /or emission rates, (2) sources and/or pollutants included in the inventory, and (3) correction of errors in prior inventories.
1.2 Pollutants and Sources The inventory includes estimates of the criteria pollutant carbon monoxide (CO).
1.3 Spatial Resolution The inventory was developed at the county level by Ecology. It was then further refined by SRCAA and SRTC. SRCAA used many of the same break downs developed by Pechan13 for the first 10-year maintenance plan.
1.4 Temporal Resolution The inventory was developed for each of the four seasons, and the annual total. Generally, Dec-Feb was classified as winter, Mar-May as spring, Jun-Aug as summer and Sep-Nov as fall. Abbreviations used are tpy (tons per year) and tps (tons per season).
2 Statistics Used Throughout the Inventory
2.1 County Demographics Emissions estimation methods for many source categories rely on surrogate parameters as indicators of activity. Population and housing units are two of the most common. Population for 2011 was available through the State Office of Financial Management (OFM). Occupied housing units for 2011 were requested from OFM and were provided.
13
E.H. Pechan and Associates, Inc., Base and Projection Year CO Emission Inventories for the Spokane Nonattainment Area, September 2004, Pechan Report No. 04.08.001/9443.003
18 April 2016
2.2 Meteorological Parameters Similar to demographics, meteorological parameters are used to estimate emissions for several source categories. Temperature, heating degree days, and rainfall are described here. Daily minimum and maximum temperatures and precipitation were obtained from several airports with meteorological stations. Monthly averages were calculated from the daily data.
3 Base Year 2011 Emissions Estimates To estimate emissions, four basic tasks were completed for each source category. The four tasks were: 1) estimate the activity level, 2) adjust/allocate the activity level (or emissions) temporally and spatially, 3) determine emission rates per the activity, and 4) estimate emissions. The tasks are described below for each source category. Emissions estimates may be found in Section 6 of the maintenance plan.
3.1 Point Sources Industrial, commercial, or institutional stationary sources which emit criteria and/or hazardous air pollutants are called point sources. Major point sources are those with the potential to emit 100 tons per year or more of any one criteria pollutant or a combination of criteria pollutants, and/or point sources with the potential to emit 10 tons per year or more of any single Hazardous Air Pollutant, or 25 tons per year or more of a combination of Hazardous Air Pollutants (Section 112, CAA). Point sources with a potential-to-emit more than those thresholds are included in the Title V Air Operating Permit (AOP) program unless a facility voluntarily adopts federally enforceable permit limits that reduce their potential-to-emit below the criteria and HAPs thresholds. Facilities that adopt these limits are called Synthetic Minor sources. Local air agencies, Ecology regional offices, and Ecology’s Industrial Section and Nuclear Waste Program (regulating authorities) collect emissions data for facilities in their jurisdictions according to state and local regulations and air operating permit programs. After data collection, regulating authorities make any necessary calculations and perform quality assurance. When the inventories are complete, they enter the data into Ecology's Washington Emissions Inventory Repository System (WEIRS). All Title V sources (major) are included in the point source inventory. Synthetic Minor sources are included at the discretion of the regulating authority. SRCAA does not submit Synthetic Minor source data at this time. The inventories provided by the local air agencies are considered the official record for Washington State point sources. Ecology submits the data to EPA in accordance with federal reporting requirements without significant change. For use in this 2nd 10 year LMP, the data was enhanced in the following ways: (1) 2013 emissions estimates were used, (2) annual emissions were seasonally allocated (Section 3.1.2), and (3) missing geographic coordinates were added.
3.1.1 Activity Level Individual facility throughputs and production rates determine the activity level for each facility.
3.1.2 Spatial and Temporal Allocation Point sources are located by county, address, and coordinates. Point sources are requested to provide quarterly throughput percentages. When provided, these schedules were used to allocate emissions to the seasons. When not provided, throughput and resulting emissions were assumed uniform throughout the year and 25% of the annual total was assigned to each season.

19 April 2016
3.1.3 Emission Rates and Estimates Emissions estimates for each facility are calculated using a variety of emissions estimation methods: continuous emissions monitors, stack test data, mass balance, best professional judgment, manufacturer’s specifications, speciation profiles, EPA emission factors (e.g., AP-42), and/or other state, manufacturer, or research group emission factors. Methods were selected considering permit conditions, data availability, and resource constraints.
3.2 Onroad Mobile Sources Onroad mobile source emissions are those generated by operating vehicles on public roadways. Emissions from fuel combustion and evaporation, and brake and tire wear were estimated. EPA's Motor Vehicle Emission Simulator14 (MOVES2014) was used to calculate emissions. MOVES combines basic vehicle activity information with information about vehicle and fuel characteristics, emissions control programs, meteorological information, and other parameters to estimate emissions. The basic activity data are vehicle miles traveled (VMT) and vehicle population. Inventory mode at the County-level was used for this 2nd 10 year LMP. VMT, vehicle population, and a brief description of the MOVES input parameters used to generate the emission rates are described below. The MOVES Technical Guidance for SIP inventories and the MOVES User’s Guide were used in developing many of the inputs to MOVES. For use in this 2nd 10 year LMP, the data was enhanced by updating to 2014 input parameters projected to 2015.
3.2.1 Vehicle Miles Traveled (VMT) VMT are used in MOVES to calculate either emissions or emission rates while the vehicle is in motion or during short periods of idling. The source of county VMT data used in the Triennial Emissions Inventory is the Washington State Department of Transportation (WSDOT) under the national Department of Transportation’s Highway Performance Monitoring System (HPMS). HPMS is a system of traffic counts collected over several urban and rural sampling areas. WSDOT makes estimates of county VMT by roadway (functional) classification using the HPMS data. The WSDOT VMT was used to generate emissions for Ecology’s triennial inventory, but it was used to generate emission rates on a per mile bases for the LMP inventory. The emission rates were combined with VMT from SRTC’s travel demand modeling to estimate emissions for the LMP.
3.2.2 Vehicle Population Vehicle population is used to calculate either emissions or emission rates while a vehicle is stationary. The emissions come from engine starts, extended idling, and some fuel evaporation processes. Vehicles are classified by age and type. There are thirteen vehicle types in MOVES within six broader categories: cars, motorcycles, light-duty trucks, heavy-duty single unit trucks, heavy-duty combination unit trucks, and buses. Three sources were used to calculate vehicle population. The first was the Washington State Department of Licensing (DOL) for 2014. DOL registers non-governmental vehicles annually. Because DOL does not register public transit and school buses each year, alternate sources of information were obtained. Transit and Intercity bus data came from the Federal Transit Administration (FTA) Annual
14
MOVES2010b was used in the 2011 Triennial Emission Inventory; MOVES2014 was used for this LMP inventory.
20 April 2016
Report data for 2013 (most recent available). School bus information for 2014 was obtained from the Washington State Office of the Superintendent of Public Instruction (OSPI).
3.2.3 MOVES Input Parameters MOVES includes a default database that summarizes emission relevant information for all counties in the United States. Default data may be replaced by local data to improve the estimates. Ecology developed local data for many of the parameters in MOVES. Input parameters were developed that were characteristic of local conditions for each county and month. Some of the parameters presented here required local data. For others, EPA guidance recommended that local data be used.
3.3 NONROAD Mobile Sources, Excluding Locomotives and Aircraft The Nonroad Mobile category includes emissions estimates from gasoline, diesel, compressed natural gas (CNG), and liquefied petroleum gas (LPG) fueled equipment. Emissions were estimated using EPA's NONROAD2008a model. Equipment types are compiled into 11 categories:
Agricultural Equipment Lawn and Garden Equipment Airport Service Equipment Logging Equipment Recreational Marine Vessels Oil Field Equipment Construction and Mining Equipment Recreational Equipment Commercial Equipment Railroad Maintenance Equipment Industrial Equipment
3.3.1 Activity Level and Spatial Allocation The NONROAD model contains data on statewide equipment types and usage. NONROAD utilizes spatial surrogates appropriate for each equipment type to disaggregate state activity levels to individual counties. The default surrogates were used for all equipment types except recreational marine vessels. The default spatial surrogate for recreational marine vessels is water surface area. This method can overestimate recreational boat usage in certain counties due to the large areas of open water in a county’s jurisdiction. A new allocation based on county boat registrations was substituted for the default. Registrations for 2011 were provided by the Washington Department of Licensing.
3.3.2 Temporal Allocation and Emission Rates Emissions were generated for the four seasons using the seasonal temporal option in the NONROAD2008a model. NONROAD2008a requires user input of seasonal meteorological and fuel parameters. The required fuel parameters are gasoline Reid Vapor Pressure (RVP) and oxygen content; sulfur contents of different fuels such as gasoline, diesel (land and marine), compressed natural gas (CNG) and liquefied petroleum gas (LPG); and if stage II vapor recovery is required. Each is described briefly below. Fuel Sulfur Content: EPA provided diesel sulfur contents with NONROAD2008a (file sulfur.txt). The values were 32 ppm and 236 ppm for land and marine diesel, respectively. Gasoline sulfur content was assumed to be the same as onroad sulfur content (30 ppm). CNG/LPG was assumed to contain 30 ppm sulfur (model template default).
21 April 2016
Gasoline Oxygen Content: Most gasoline in Washington contains 10% ethanol. The corresponding oxygen content is 3.5%. Gasoline Reid Vapor Pressure: RVP values for January, April, July, and October were used to model each of the four seasons. The values were the same as those for onroad. Stage II Gasoline Vapor Recovery: Stage II refueling benefits were not modeled in NONROAD. There are stage II requirements on some gasoline stations, but there is no reliable method to estimate the fraction of equipment fueled via stage II stations. Furthermore, stage II benefits are small compared to the total nonroad inventory. For these reasons, no stage II requirements were modeled in NONROAD. Meteorological Parameters: NONROAD requires minimum, maximum, and average temperature inputs in °F (Section 2.2). Temperatures for January, April, July, and October were used to model each of the four seasons. Onroad mobile guidance was used to calculate average temperatures:
minT + [2/3 * (maxT – minT)] This equation may result in a temperature that is close to the average daytime temperature when most equipment is used.
3.3.3 Emissions Estimates Total seasonal emissions (tons per season) were generated with the NONROAD2008a model.
3.4 Locomotives Emissions from Class I line-haul and switch yard locomotives were estimated using EPA guidance and other information. U.S. Class I railroads are line-haul freight railroads with operating revenue in excess of $250 million or more after adjusting for inflation using the Railroad Freight Price Index ($433.2 million in 2011). Two Class I railroads operate in Washington: Burlington Northern Santa Fe Railway (BNSF) and Union Pacific Railroad (UP). Amtrak was also included in this inventory. Class II and III railroad locomotive emissions were not inventoried. A special Northwest International Air Quality Environmental Science and Technology Consortium (NW-AIRQUEST; formerly Northwest Regional Technical Center) project conducted by the Oregon Department of Environmental Quality (ODEQ) found that emissions from Class 2 and 3 railroad locomotives were a small percentage of total locomotive emissions. BNSF and UP provided 2011 activity and emissions information. Amtrak provided only activity information for 2011.
3.4.1 Activity Level Activity level is measured in gallons of diesel consumed by locomotives. All of the railroads provided 2011 fuel use for line haul and switch yard locomotives by county.
3.4.2 Temporal and Spatial Adjustments Most of the locomotive activity information was obtained by county; therefore, no spatial adjustments were necessary. Locomotives were assumed to operate uniformly year-round per EPA guidance.

22 April 2016
3.4.3 Emission Rates All railroad companies provided criteria pollutant emissions estimates by county, based on their locomotive fleet.
3.5 Silvicultural Burning (Prescribed Burning) Silvicultural burning includes logging debris burns and forest health burns. It does not include land clearing. Silvicultural burning is conducted by the Department of Natural Resources (DNR), U.S. Forest Service (USFS), Bureau of Indian Affairs (BIA), and private industry. DNR permits and tracks all burns, except those done by the BIA. Using models developed by the USFS, DNR estimates the tons burned and resulting air emissions. The results from prescribed burning that DNR produced and those that EPA produced were very different. Therefore, the Washington emissions inventory data may look very different from the EPA data in this category. The BlueSky modeling framework was used to create the EPA data. This framework can lead to overestimates of prescribed burn emissions, especially in heavily forested regions (e.g. Clallam, Grays Harbor, Lewis, Pacific, and Skamania counties). Prescribed burns in Washington state are managed so that only a fraction of the fuels are burned; however, the BlueSky model does not take this fully into account and is configured to burn most available fuels within the simulations. There are also known over-estimates of duff consumption in prescribed burn simulation software.
3.5.1 Activity Level and Emission Rates DNR enters information on each permitted burn into the USFS models. The required information includes: location, date, ownership, elevation, moisture, species, duff depth, tons of material and/or acres, burn type (broadcast, pile, natural). The USFS models calculate fuel consumption and emissions for each burn. The emission factors used in the model were developed for the Pacific Northwest by the USFS. DNR provided the entire 2011 burn permit database, which was queried for activity level (in tons consumed) and emissions by county and season. The database included PM, PM10, and PM2.5 estimates. Broadcast and natural burn particulate emission factors were calculated specifically for each fire. Pile burn particulate emissions were estimated using static emission factors. DNR estimated CO and non-methane hydrocarbons (used as VOC) for most broadcast and natural burns. NOx emissions were estimated by Ecology using AP42. VOC and CO emissions were estimated for pile burns by Ecology using information from the USFS.
3.5.2 Temporal Adjustments The date of each burn was included in the DNR burn permit database. Monthly emissions were calculated by summing the emissions for all burns occurring in each month.
3.5.3 Spatial Adjustments No spatial adjustments were necessary. All burns were identified both by county and section-township-range.
3.5.4 Emissions Estimates As stated in Section 3.5.1, emissions were calculated for each burn by date. Seasonal emissions were calculated by summing all the burns occurring in the given season.

23 April 2016
3.6 Agricultural Burning Agricultural burning in Washington is defined as "the burning of vegetative debris from an agricultural operation necessary for disease or pest control, necessary for crop propagation and/or crop rotation, or where identified as a best management practice by the agricultural burning practices and research task force established in RCW [Revised Code of Washington] 70.94.6528 or other authoritative source on agricultural practices." All agricultural burning in Washington requires a permit.
3.6.1 Activity Level The activity level for agricultural burning is the amount of residue burned (consumed). The general equation and sources of each parameter are described below.
tons burned = acres burned x fuel loading x fuel consumption factor Acres or Tons Burned Department of Ecology Central and Eastern Regional Offices (CRO, ERO) The Department of Ecology maintains an agricultural burn permit database. The permits are tracked by location and date and include other information such as crop type, acreage, and fuel loading estimates, or tons burned. Permits issued in 2011 were selected for this inventory. Local Air Authority Permits There is very little agricultural burning in western Washington and Spokane County. There were five permits issued in Spokane County in 2011, a total of 142 acres were burned none within the CO SCMA. Fuel Loading Department of Ecology Central and Eastern Regional Offices (CRO, ERO) The agricultural burn permit database included a loading factor for each burn. The overall average loading factor for cereal grain stubble burns was 4.3 tons/acre. This is comparable to the 4 tons/acre average found in a special study performed by Air Sciences Incorporated. Air Sciences Incorporated performed a field study funded by Ecology, the Washington Association of Wheat Growers, and the US EPA-Region 10 to measure emissions and develop emission rates for wheat stubble field burning. The loading factor was 0.8 tons/acre higher than the wheat field loading factor of 3.2 tons/acre in AP42 (adjusted for fuel consumption). Local Air Authority Permits Fuel loading factors for burns reported in acres for apple and other orchard trees, Christmas trees, daffodils, nursery stock, and limbs/weeds/blackberries were estimated from the Ecology burn permit database records (1-2-2009 through 3-26-2012) by calculating the average loading for these crop types. The unspecified weed loading in AP4254 was used to estimate loading for potatoes and berries. Fuel Consumption Factors The fuel consumption factors developed by Air Sciences Incorporated were used for cereal grains. The consumption factor was 0.59 during spring and 0.60 during fall. The consumption factor for all other crop types was assumed to be 1.00 due to a lack of any specific information. This assumption will tend to overestimate emissions, and may be revisited in the future.
3.6.2 Emission Rates Emission rates were taken from EPA's AP42 (PM, VOC, CO, NOX).
24 April 2016
3.6.3 Spatial and Temporal Adjustments All burn data was available by county and date, so neither spatial nor temporal adjustments were necessary.
3.6.4 Emissions Estimates Emissions estimates were calculated with the equations below.
tons per year (tpy) = (tons consumed) x (pollutant lb/T) x (1 T/2000 lb) tons per season (tps) = (tons consumed) x (pollutant lb/T) x (1 T/2000 lb) where the tons consumed is the amount burned in the given season
3.7 Residential Yard Waste Burning Leaf and Brush Residential yard waste burning is outdoor burning of vegetative material.
3.7.1 Activity Level and Spatial Allocation The measure of activity for residential yard waste burning is the amount of material burned. For the 2011 National Emissions Inventory, leaf and brush are separated into different reporting categories and have different criteria pollutant emission factors. In 2001, Washington State University under contract to the Idaho Department of Environmental Quality conducted a telephone survey of wood heating and outdoor burning habits in Idaho, Oregon and Washington. The survey included questions to estimate the fraction of households that burned yard waste and the number of legal size piles (4')15 burned per household per year. In Washington, the survey defined four geographic groups in Washington: 1) incorporated cities, 2) unincorporated western WA, 3) unincorporated eastern WA with forest lands, and 4) unincorporated eastern WA without forest lands. Each county's incorporated areas were assigned to the first group. Unincorporated areas were assigned to one of the last three groups. It was estimated that the weight of a legal size pile was approximately 125 lb. The tons of material burned were estimated using the following equation:
HH x (fraction burning waste) x (piles/HH) x (lb burned/pile) x (1 T/2000 lb), where HH = the number of households
3.7.2 Emission Rates Criteria and toxic pollutant emission rates for brush and leaf residential yard waste burning were taken from the EPA’s Emission Inventory documentation repository for 2011 for the Open Burning Yard Waste Leaf and Brush category. Emission rates are given in pounds of pollutant per ton of material burned.
3.7.3 Temporal Allocation The survey included questions about seasonal burning habits.
3.7.4 Emissions Estimates Emissions estimates were calculated with the equations below.
tpy = (tons burned) x (pollutant lb/ton) x (ton/2000 lb) tps = (tpy) x (seasonal fraction) where: tpy = tons per year, tps = tons per season
15
Four (4’) feet was used in the state wide survey SRCAA specifies a maximum 4’ wide by 3’ high.
25 April 2016
3.8 Municipal Solid Waste Burning Municipal Solid Waste Burning is outdoor burning of household waste.
3.8.1 Activity Level and Spatial Allocation The measure of activity for residential trash burning is the amount of material burned. The Washington State University telephone survey of wood heating and outdoor burning habits in Idaho, Oregon, and Washington described in Section 3.7 above included questions to estimate the fraction of households that burned trash. The geographic subgroups, county assignments, and number of households in each subgroup were the same as in Section 3.7. The amount of trash burned per household was taken from an Emission Inventory Improvement Program (EIIP) recommendation. The EIIP reported that 6.75 lb of total refuse were generated per household per day. Eighty percent (5.37 lb) of the total is combustible and 50% (3.38 lb) is actually consumed when burned. The tons of material actually consumed were estimated using the following equation:
HH x (fraction of HH burning trash) x (3.38 lb/HH-day) x (365 days) x (1 T/2000 lb), where: HH = the number of households (Table 2-1)
3.8.2 Emission Rates Criteria pollutant emission rates for brush and leaf residential yard waste burning were taken from the EPA’s Emission Inventory documentation repository for 2011 for the Open Burning MSW category. Emission rates are given in pounds of pollutant per ton of material consumed.
3.8.3 Temporal Allocation Trash burning is assumed to be uniform year-round.
3.8.4 Emissions Estimates Emissions estimates were calculated with the equations below.
tpy = (tons consumed) x (pollutant lb/T) x (1 T/2000 lb) tps = (tpy) / 4
where: tpy = tons per year, tps = tons per season
3.9 Residential Fuel Use, excluding Wood Residential fuel use was estimated using EPA’s Residential Fuel consumption tool, modified with 2010 county level data for WA. The residential non-wood fuels included in this report are distillate oil, natural gas, and liquefied petroleum gas (LPG). Residential wood combustion is treated separately in Section 3.10. Residential coal combustion is not included in the inventory since less than 500 housing units in the state use coal as their heating source.
3.9.1 Activity Level Washington state fuel use for 2010 was obtained from the Energy Information. The state-level volume of distillate oil consumed by residential combustion in the U.S. was used to estimate emissions. Energy consumption by energy use sector is presented in State Energy Data 2010 Consumption tables published by the Energy Information Administration (EIA). Year 2010 consumption data were used as a surrogate for 2011 emissions because year 2010 data were the most recent data available when this portion of the inventory was prepared.

26 April 2016
3.9.2 Spatial Allocation State-level consumption was allocated to each county using the Census 2006-2010 American Community Survey 5-year Estimates - 2006-2010 Census Detailed Housing Information. These data include the number of housing units using a specific type of fuel for residential heating. State energy consumption was allocated to each county using the ratio of the number of houses primarily using a specific energy source (LPG, distillate oil, Natural gas) in each county to the total number of houses using the same source in the state.
3.9.3 Temporal Allocation Seasonal profiles for this category were taken from temporal files developed for AIRPACT.
3.9.4 Emission Rates Criteria pollutant emission rates for residential fuel use, excluding wood were taken from the EPA’s 2011 Emission Inventory documentation and file repository for the residential fuel use category.
3.9.5 Emissions Estimates Annual and seasonal emissions for each pollutant were calculated as:
tpy = FC x E x (1 T/2000 lb) tps = tpy x seasonal fraction from temporal profiles
where FC is the amount of fuel used in the given county E is the pollutant emission rate in the same units as FC
3.10 Residential Wood Combustion Residential wood combustion consists of home heating and recreational use of woodstoves, fireplaces, fireplace inserts, and pellet stoves. Other residential wood burning devices were not inventoried.
3.10.1 Activity Level The measure of activity for residential wood combustion is the amount of wood burned. Residential wood combustion activity for each county was estimated using data from one of two residential wood combustion surveys. The first survey was conducted by Washington State University in 2001 (WSU2001). It divided the state into regions and compiled results for each region. The WSU survey had 749 completed surveys for WA. The second survey was conducted by the National Research Center in 2007 (NRC2007). It covered seven geographic areas in the central Puget Sound region and consisted of 1,015 completed surveys. Both surveys solicited complete information to conduct an inventory. The surveys were compared. For all but the eastern WA rangeland counties, the two surveys were generally comparable. The NRC2007 survey was newer and included a higher concentration of survey responses, so it was used to characterize all counties except those classified as eastern WA rangeland. The WSU survey was used for the eastern WA rangeland counties. The surveys were used to determine the percentage of households using wood burning devices, the fraction of certified stoves and inserts, and the annual amount of wood burned per device for fireplaces, woodstoves, inserts, and pellet stoves. Industry data was used to break out certified stoves and inserts into catalytic (25%) and non-catalytic (75%). The usage rates are used in activity level calculations and the fraction of combined inserts and woodstoves that were in use. The surveys gathered information on the amount of pellets, firelogs, bundles of wood, pickup loads, and cord wood burned. To calculate emissions using emission factors in
27 April 2016
lb/ton burned, the weight of the wood burned was estimated. Pellets are sold in 40-lb sacks, and fire logs were estimated at 8 lb per log. The weight of a cord of wood varies with moisture content and species type. The most common species reported in the survey were fir, alder, and maple. PSCAA estimated the bone dry (zero percent moisture) weight of a cord to be 2189 lb. This weight was used for all counties where the NRC2007 survey was used in order to keep the amount of wood burned consistent with the wood weight. For the areas using the WSU2001 survey, the dry weight was estimated at 2230 lb/cord. This was based on recommendations from staff at Ecology, the Department of Natural Resources (DNR), and the US Forest Service (USFS). Bundles of wood and the average of small and large pickup loads were assumed to be approximately 0.01563 cords and 0.3494 cords, respectively.
3.10.2 Emission Rates Criteria pollutant emission factors in pounds of pollutant per ton of wood burned were taken from version 1 of EPA's 2011 Residential Wood Combustion tool. The emission rates are based on dry (0% moisture) wood. The weight of wood burned was expressed as 0% moisture so no adjustments were made prior to calculating emissions.
3.10.3 Spatial and Temporal Allocation Spatial allocation was not necessary since occupied housing units were available by county. Temporal allocation was based on a relationship between temperature and ambient fine particulate concentrations. Analysis of several PM2.5 and meteorological monitoring sites showed a strong linear relationship between ambient temperature and ambient fine particulate concentrations at temperatures below 50 degrees Fahrenheit. Heating degree days (based on 50 degrees = HDD50) were calculated for each day during the NRC2007 survey period (Sept. 2006 - Aug. 2007). The total seasonal HDD50 were divided by the annual HDD50 to estimate seasonal fractions. It is recognized that temperatures vary across the state and seasonal patterns may not be the same everywhere. More precise seasonal breakouts may be calculated as needed for specific projects.
3.10.4 Emissions Estimates Annual and seasonal emissions for each wood burning device were calculated according to the following equations:
tpy = (HH) x (usage fraction) x (seasoned tons burned/device-yr) x (0.8 T dry weight/1 T seasoned weight) x (pollutant lb /T dry weight) x (T/2000 lb) tps = (tpy) x (seasonal fraction)
Annual emissions for each wood burning device were calculated according to the following equation:
tpy = (OHU) x (usage fraction) x (T burned/device-yr) x (pollutant lb/T) x (T/2000 lb) where OHU= number of occupied housing units in the geographic area tps = tpy x (seasonal fraction)

28 April 2016
Appendix B. Washington State and SRCAA Rules SRCAA Regulations None (Regulation I, Article VI, Section 6.16 Motor Fuel Specifications for Oxygenated Gasoline was repealed 9/1/2005 SRCAA Resolution 05-19) Washington State Regulations Chapter 173-422-031 WAC – Motor Vehicle Emission Inspection Schedule Chapter 173-422-170 WAC – Exemptions Chapter 173-423-070 WAC – Emissions standards, warranty, recall and other California provisions adopted by reference Chapter 173-492 WAC – Motor Fuel Specifications for Oxygenated Gasoline Federal Regulations 40 CFR Part 86 - Federal Motor Vehicle Emission Control Program Remove the following Administrative Orders:
Kaiser Aluminum and Chemical Corporation Administrative Order No. DE 01 AQIS-3285
Kaiser Aluminum and Chemical Corporation Administrative Order No. DE 01 AQIS-3285, Amendment # 1
29 April 2016
Appendix C. EPA AirData Carbon Monoxide Data Printouts

30 April 2016
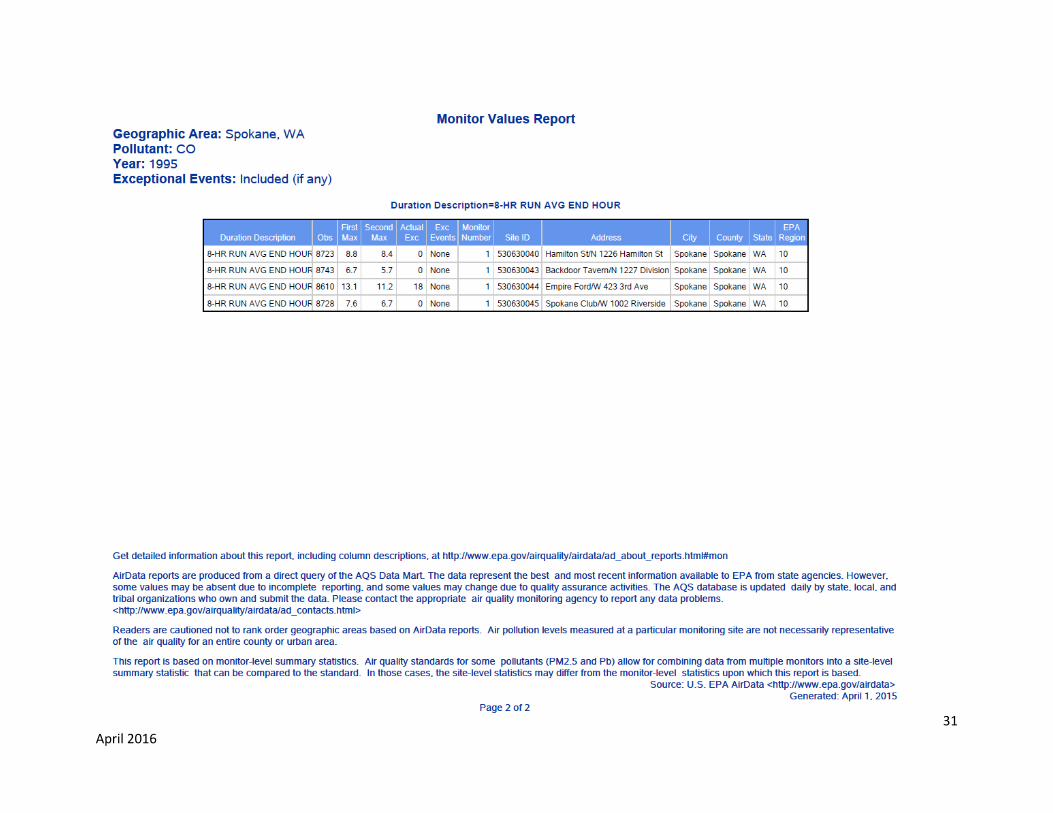
31 April 2016
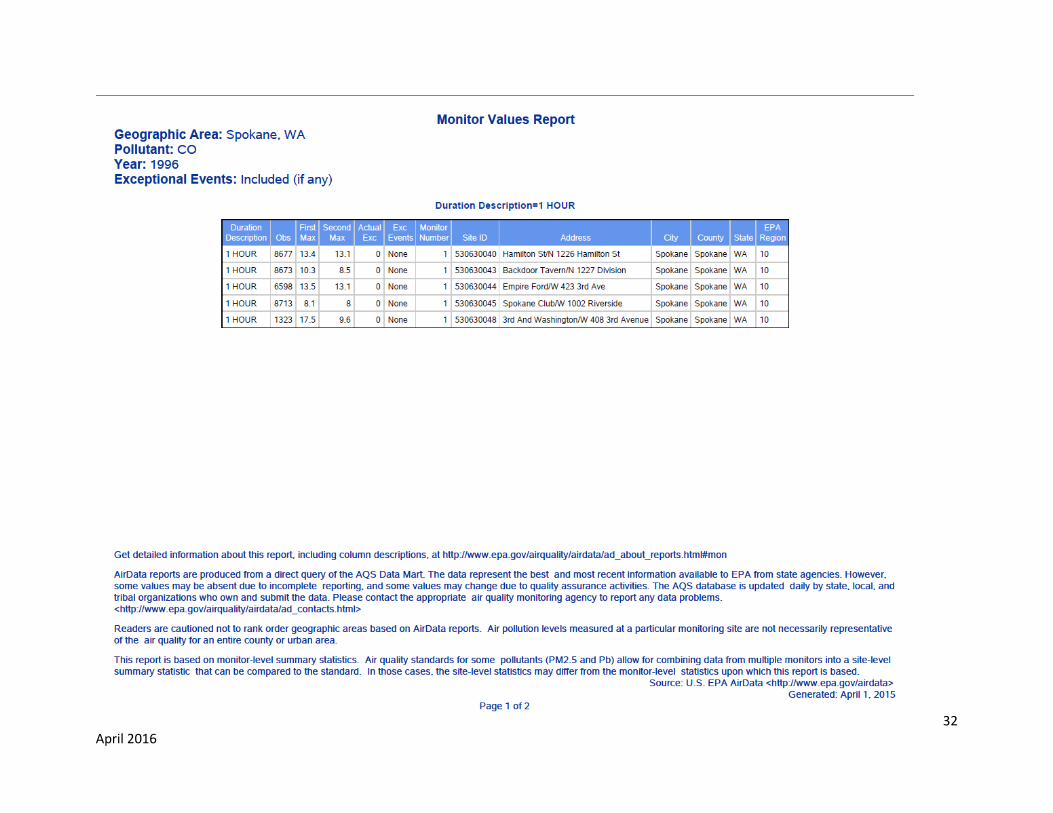
32 April 2016
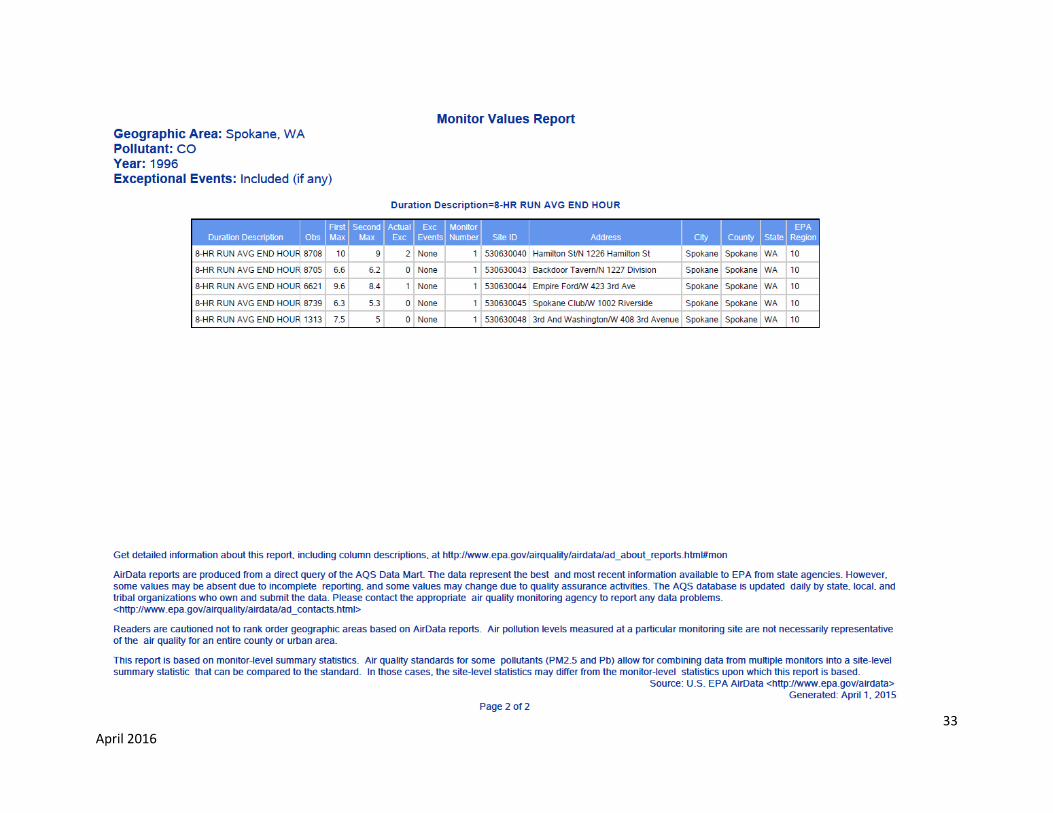
33 April 2016

34 April 2016
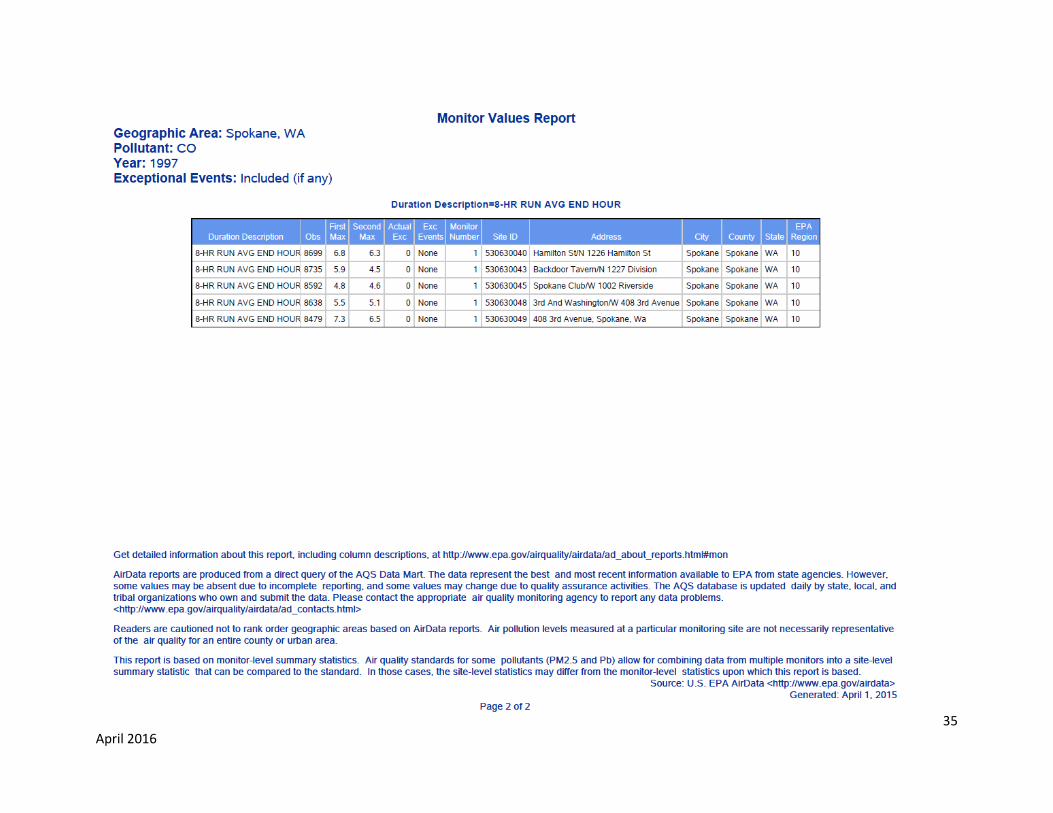
35 April 2016

36 April 2016
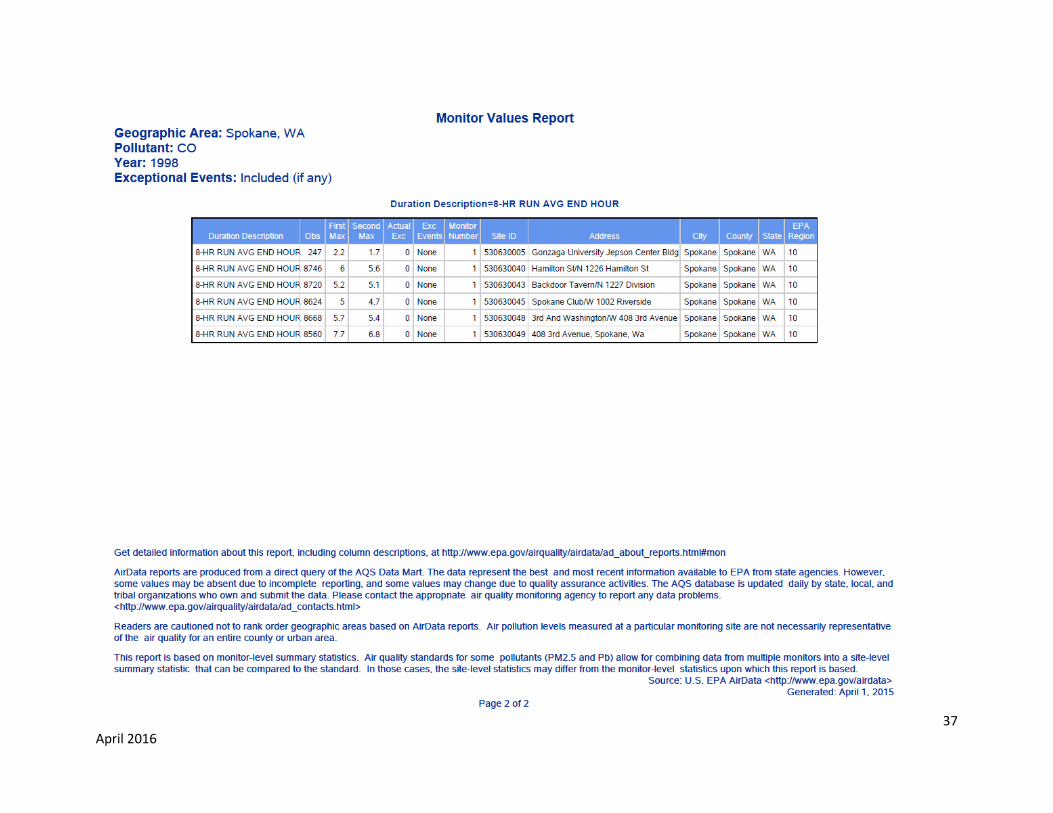
37 April 2016
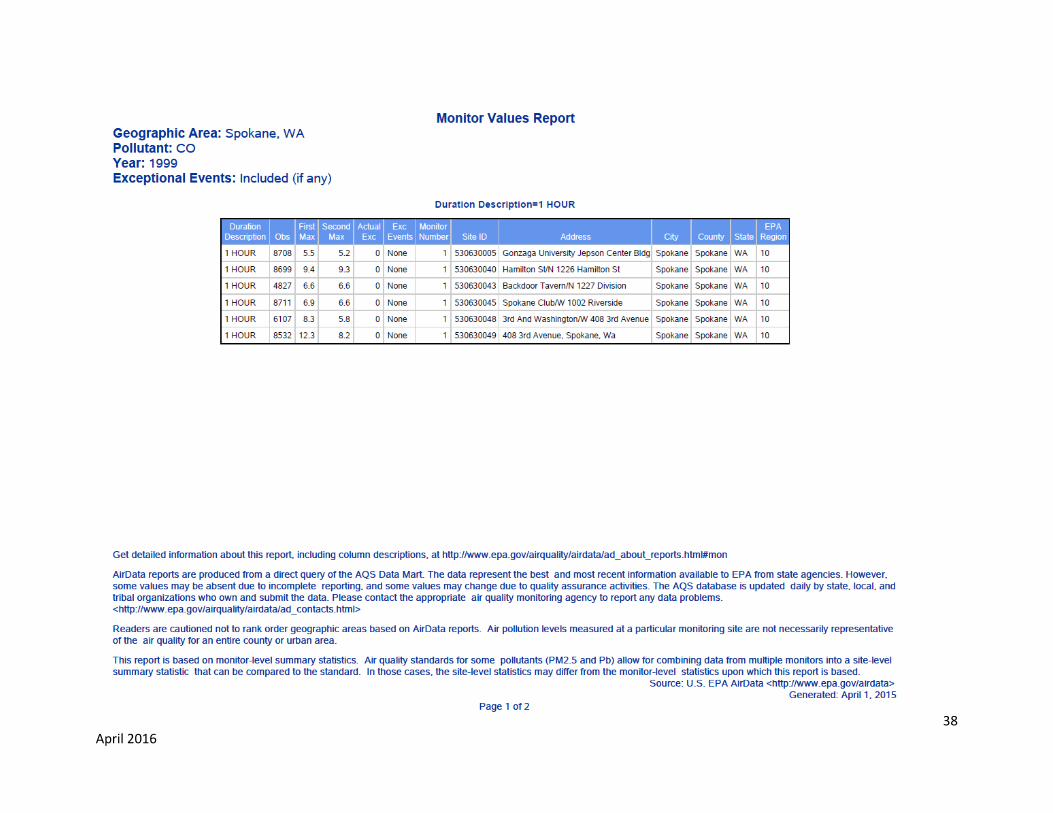
38 April 2016
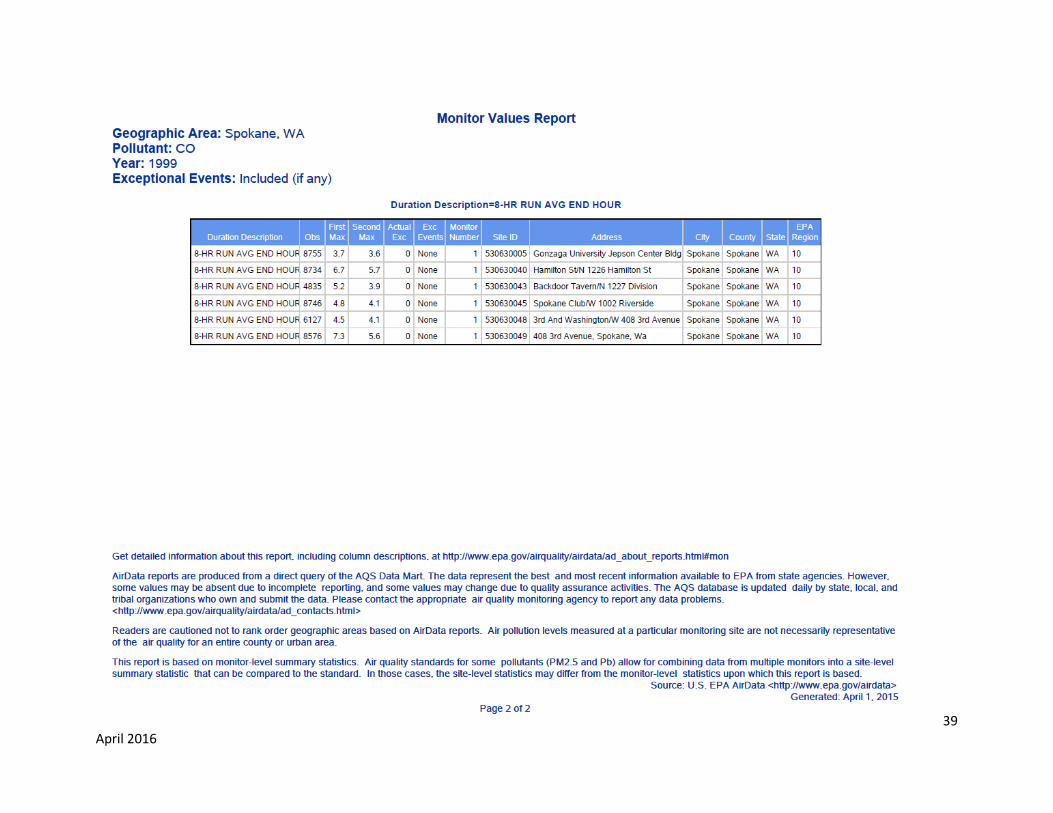
39 April 2016

40 April 2016
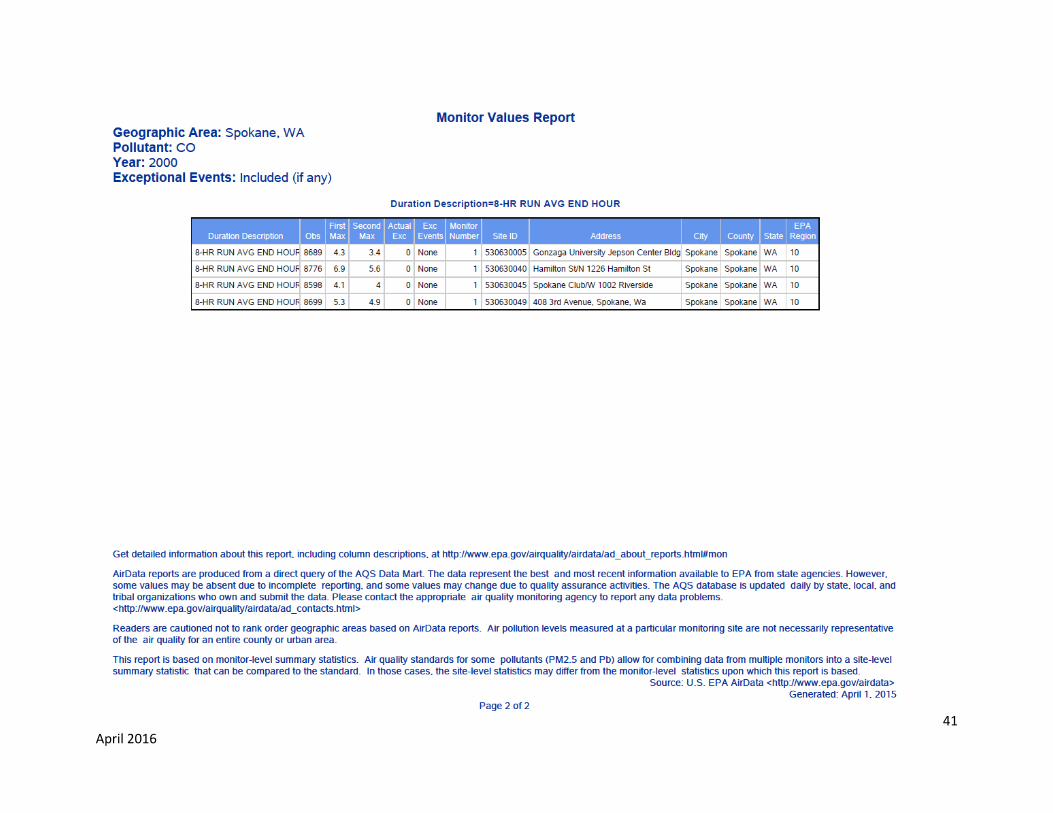
41 April 2016
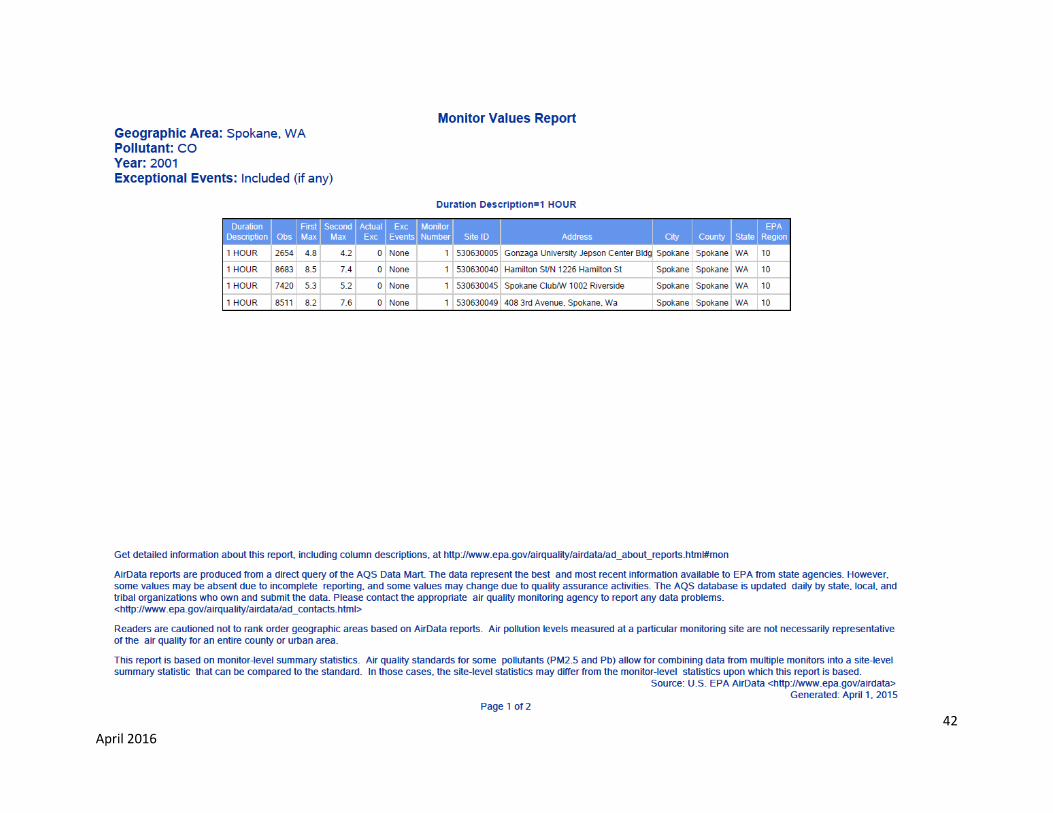
42 April 2016
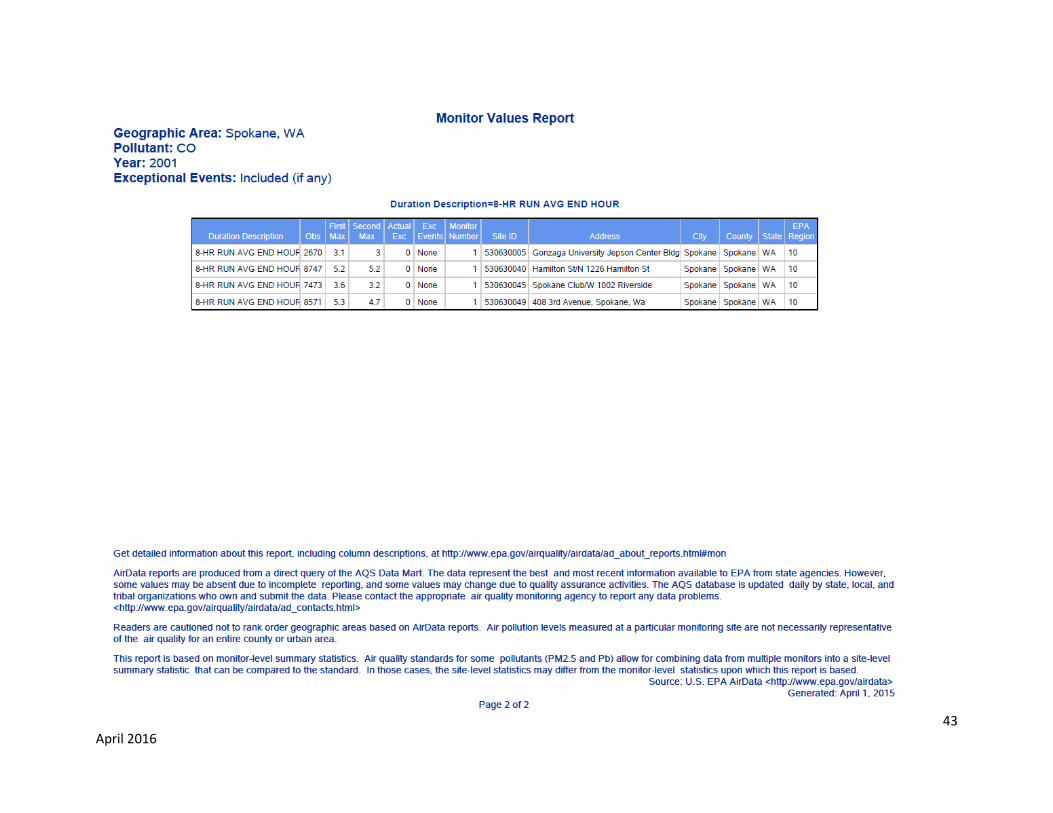
43 April 2016

44 April 2016
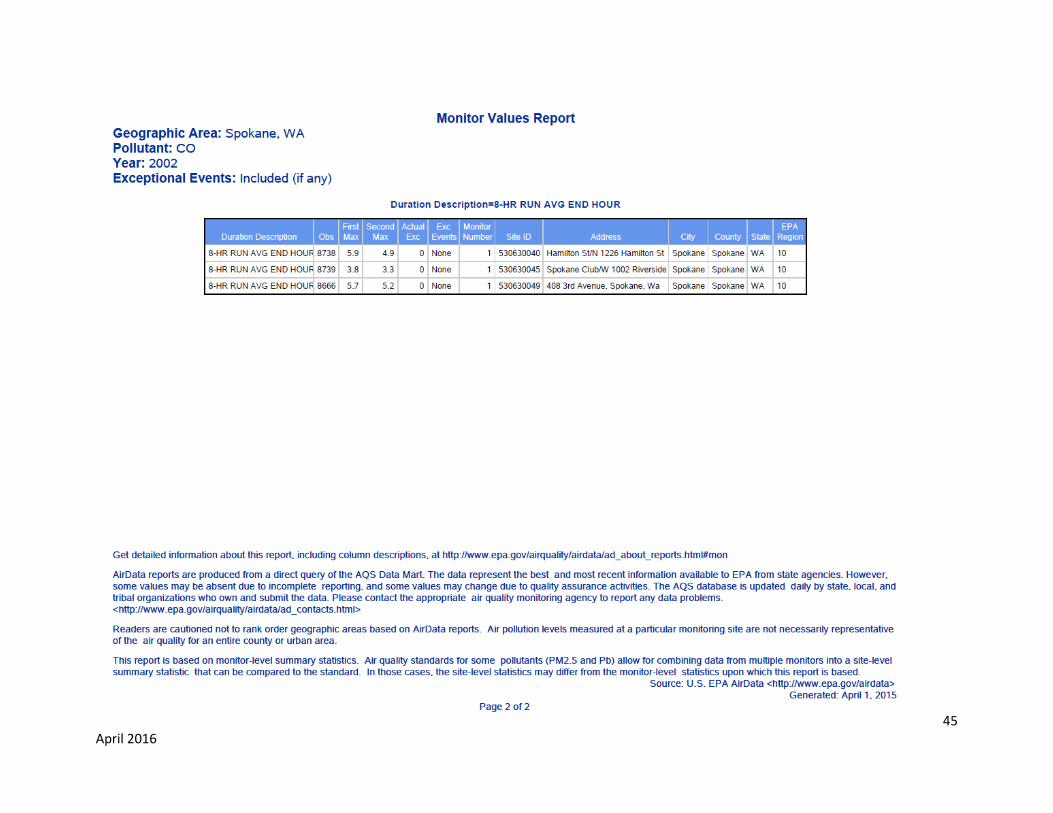
45 April 2016
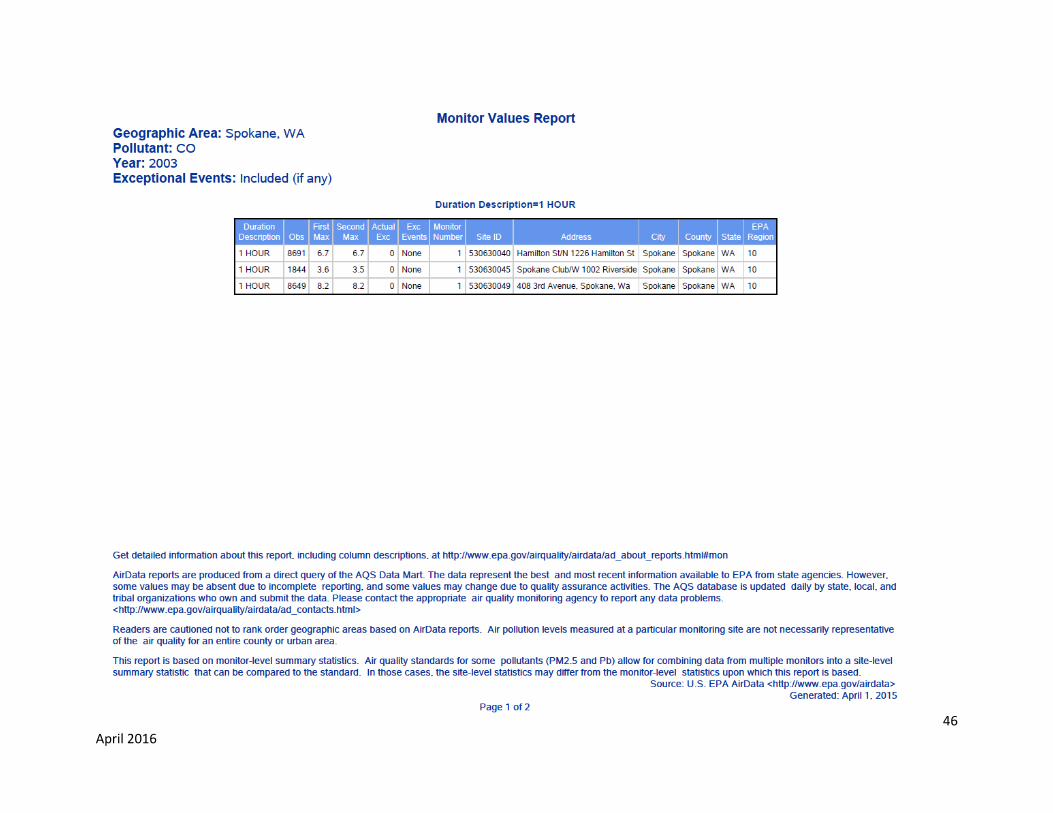
46 April 2016

47 April 2016
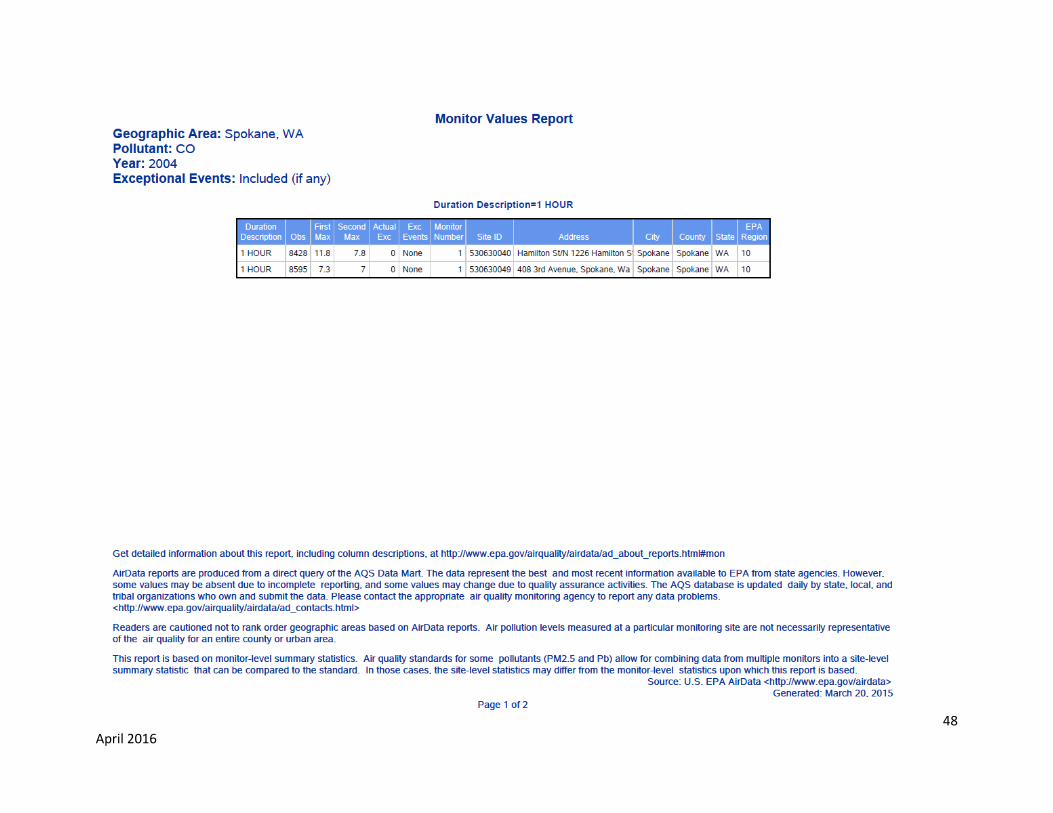
48 April 2016
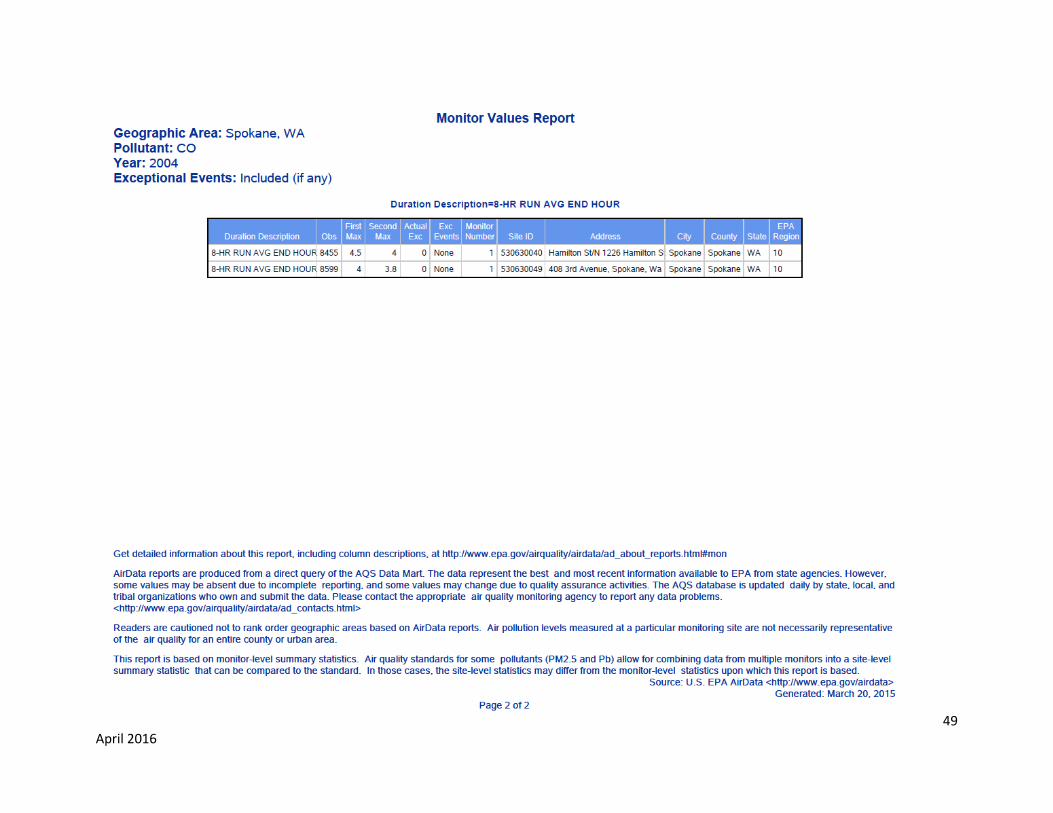
49 April 2016

50 April 2016
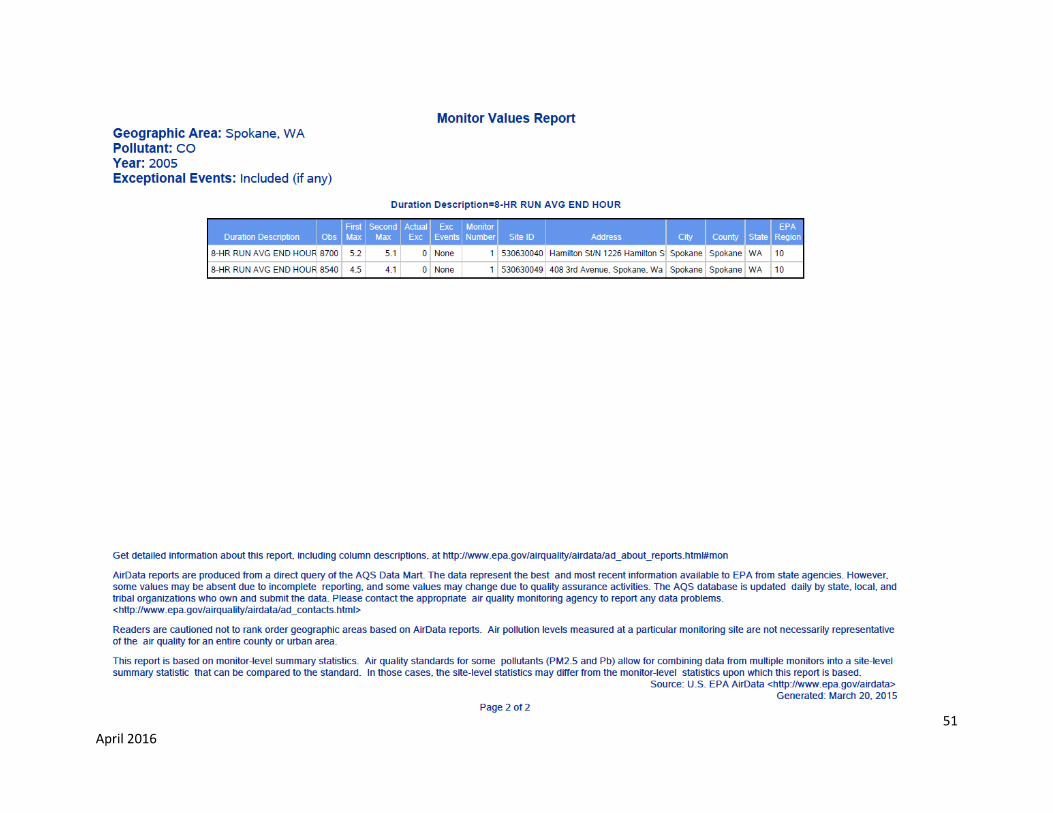
51 April 2016
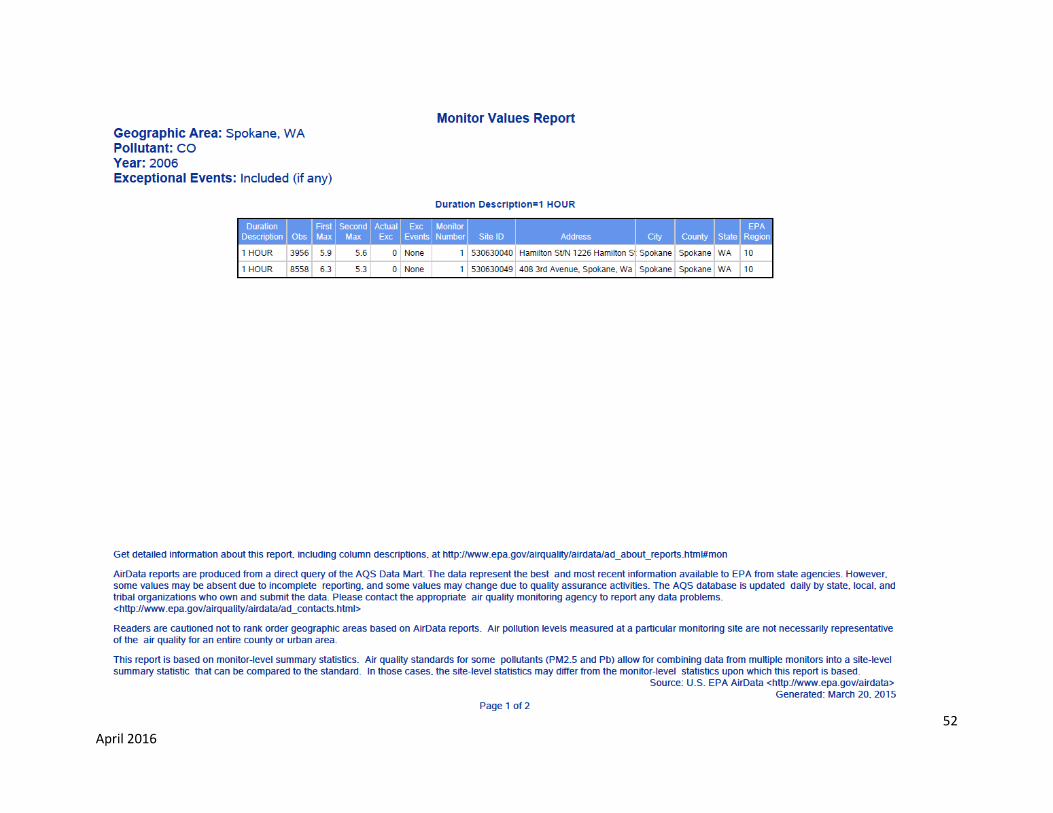
52 April 2016

53 April 2016
54 April 2016

55 April 2016

56 April 2016
57 April 2016
58 April 2016
59 April 2016

60 April 2016

61 April 2016
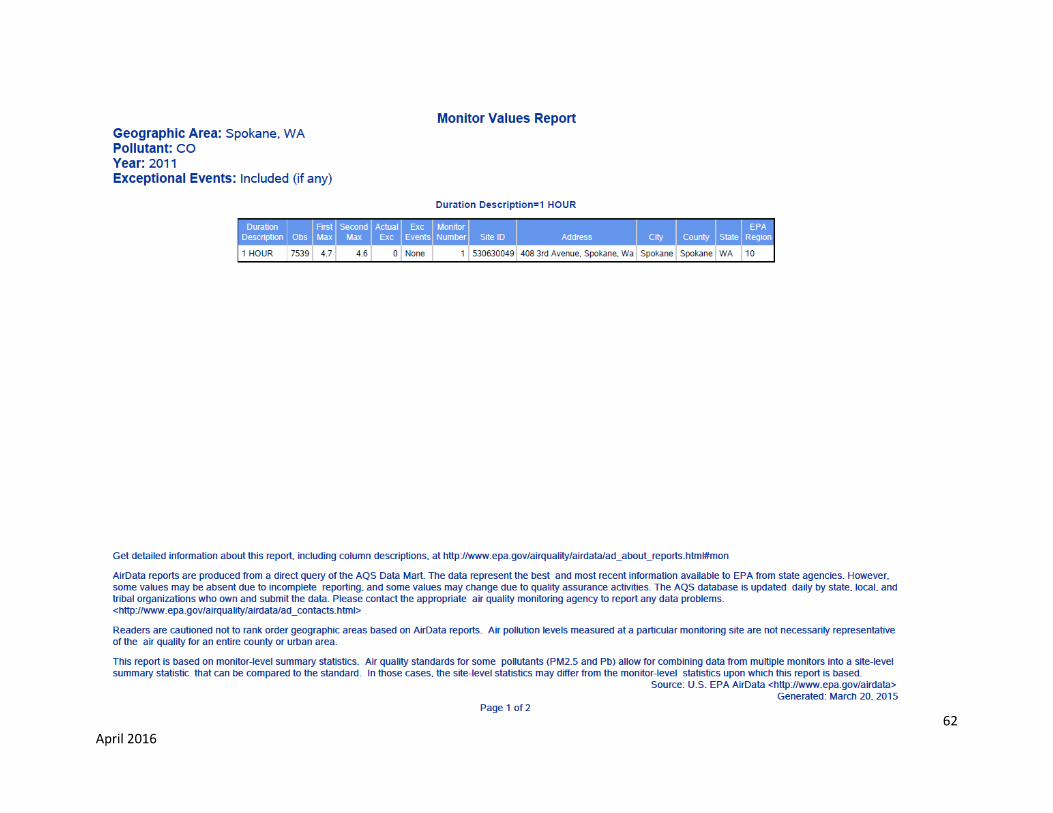
62 April 2016

63 April 2016

64 April 2016

65 April 2016

66 April 2016

67 April 2016
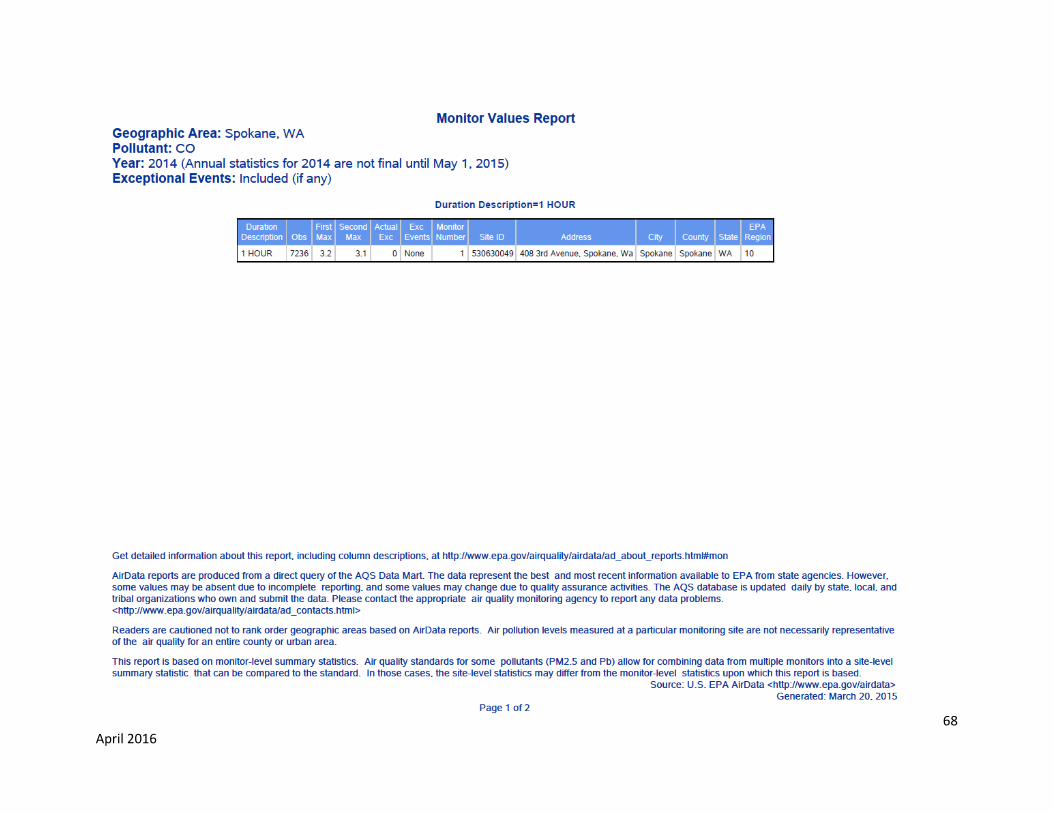
68 April 2016
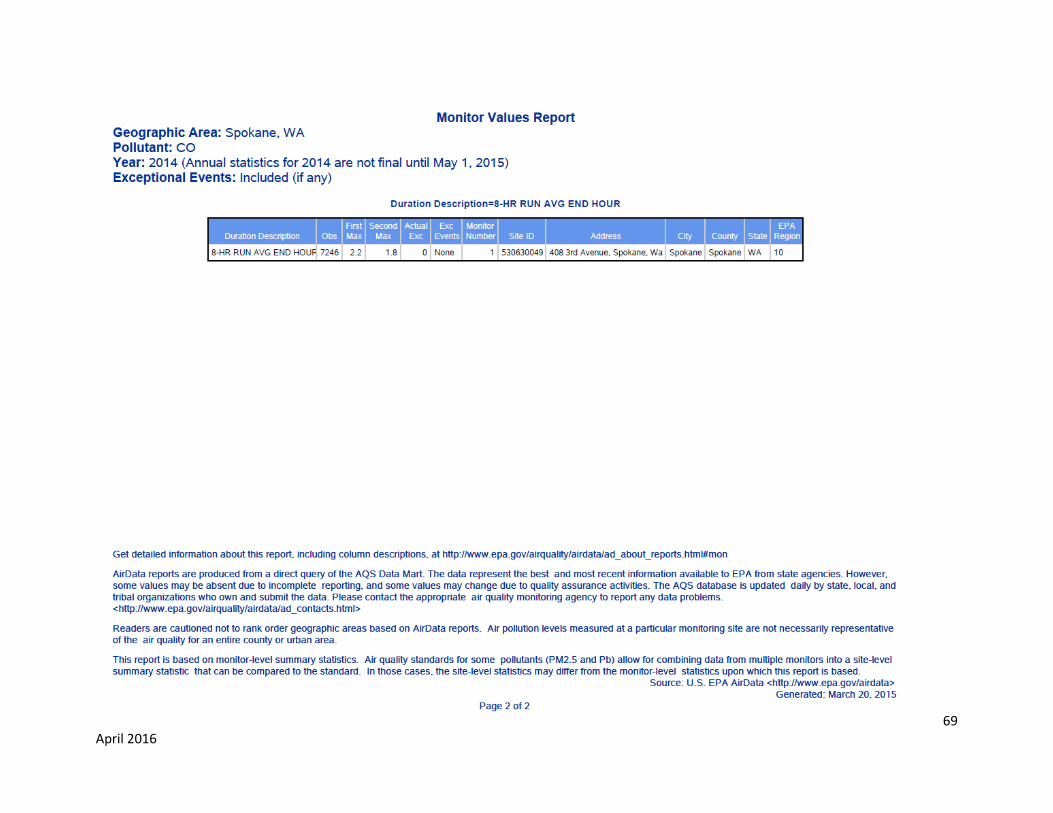
69 April 2016
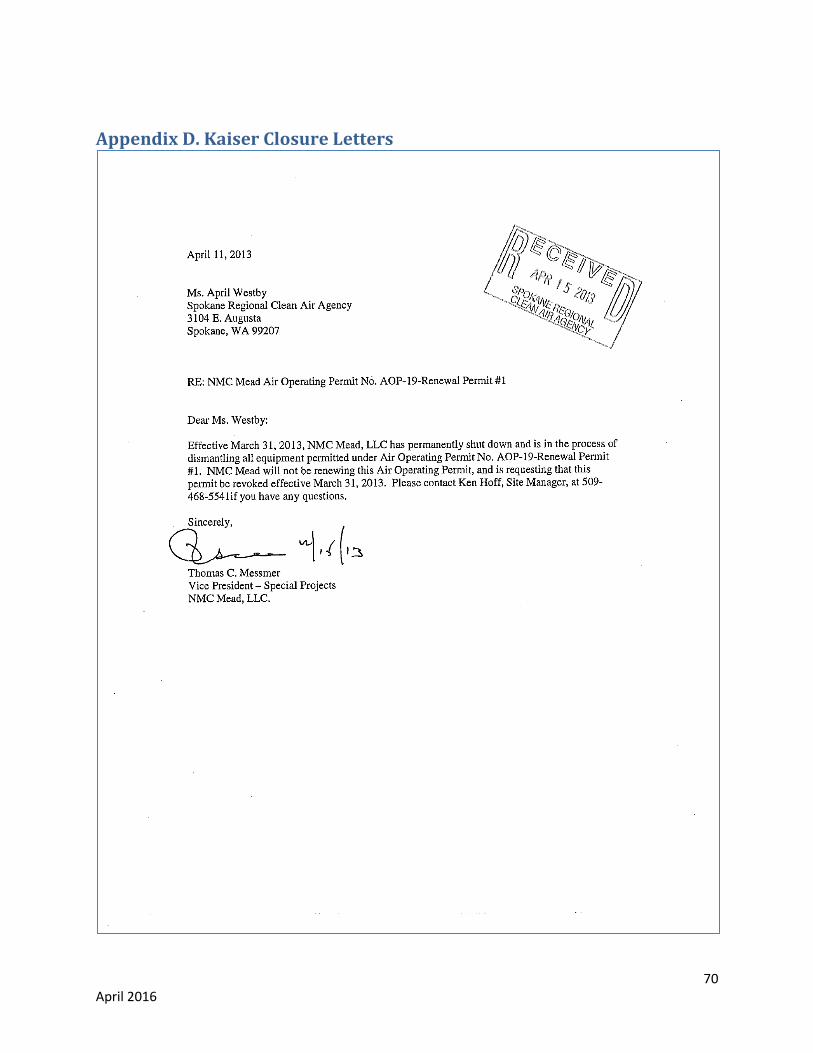
70 April 2016
Appendix D. Kaiser Closure Letters
71 April 2016
72 April 2016
Appendix E. SRCAA Resolution 05-19 Repeal of Motor Fuel Specifications for Oxygenated Gasoline
73 April 2016
74 April 2016
75 April 2016