Sintex Industries - Motilal Oswal · improve FCF and balance sheet, to (1) enable USD290m FCCB...
24
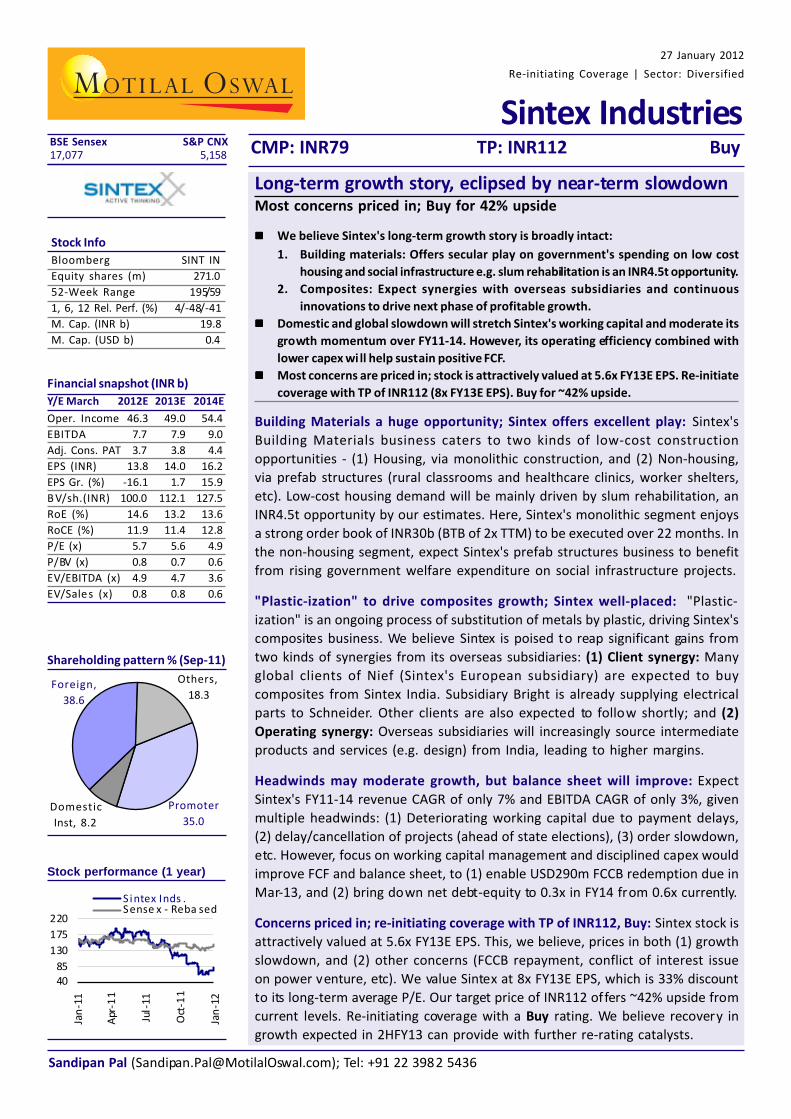
Sintex Industries CMP: INR79 TP: INR112 Buy Stock performance (1 year) Shareholding pattern % (Sep-11) Y/E March 2012E 2013E 2014E Oper. Income 46.3 49.0 54.4 EBITDA 7.7 7.9 9.0 Adj. Cons. PAT 3.7 3.8 4.4 EPS (INR) 13.8 14.0 16.2 EPS Gr. (%) -16.1 1.7 15.9 BV/sh.(INR) 100.0 112.1 127.5 RoE (%) 14.6 13.2 13.6 RoCE (%) 11.9 11.4 12.8 P/E (x) 5.7 5.6 4.9 P/BV (x) 0.8 0.7 0.6 EV/EBITDA (x) 4.9 4.7 3.6 EV/Sales (x) 0.8 0.8 0.6 Domestic Inst, 8.2 Others, 18.3 Foreign, 38.6 Promoter 35.0 Long-term growth story, eclipsed by near-term slowdown Most concerns priced in; Buy for 42% upside We believe Sintex's long-term growth story is broadly intact: 1. Building materials: Offers secular play on government's spending on low cost housing and social infrastructure e.g. slum rehabilitation is an INR4.5t opportunity. 2. Composites: Expect synergies with overseas subsidiaries and continuous innovations to drive next phase of profitable growth. Domestic and global slowdown will stretch Sintex's working capital and moderate its growth momentum over FY11-14. However, its operating efficiency combined with lower capex will help sustain positive FCF. Most concerns are priced in; stock is attractively valued at 5.6x FY13E EPS. Re-initiate coverage with TP of INR112 (8x FY13E EPS). Buy for ~42% upside. Building Materials a huge opportunity; Sintex offers excellent play: Sintex's Building Materials business caters to two kinds of low-cost construction opportunities - (1) Housing, via monolithic construction, and (2) Non-housing, via prefab structures (rural classrooms and healthcare clinics, worker shelters, etc). Low-cost housing demand will be mainly driven by slum rehabilitation, an INR4.5t opportunity by our estimates. Here, Sintex's monolithic segment enjoys a strong order book of INR30b (BTB of 2x TTM) to be executed over 22 months. In the non-housing segment, expect Sintex's prefab structures business to benefit from rising government welfare expenditure on social infrastructure projects. "Plastic-ization" to drive composites growth; Sintex well-placed: "Plastic- ization" is an ongoing process of substitution of metals by plastic, driving Sintex's composites business. We believe Sintex is poised to reap significant gains from two kinds of synergies from its overseas subsidiaries: (1) Client synergy: Many global clients of Nief (Sintex's European subsidiary) are expected to buy composites from Sintex India. Subsidiary Bright is already supplying electrical parts to Schneider. Other clients are also expected to follow shortly; and (2) Operating synergy: Overseas subsidiaries will increasingly source intermediate products and services (e.g. design) from India, leading to higher margins. Headwinds may moderate growth, but balance sheet will improve: Expect Sintex's FY11-14 revenue CAGR of only 7% and EBITDA CAGR of only 3%, given multiple headwinds: (1) Deteriorating working capital due to payment delays, (2) delay/cancellation of projects (ahead of state elections), (3) order slowdown, etc. However, focus on working capital management and disciplined capex would improve FCF and balance sheet, to (1) enable USD290m FCCB redemption due in Mar-13, and (2) bring down net debt-equity to 0.3x in FY14 from 0.6x currently. Concerns priced in; re-initiating coverage with TP of INR112, Buy: Sintex stock is attractively valued at 5.6x FY13E EPS. This, we believe, prices in both (1) growth slowdown, and (2) other concerns (FCCB repayment, conflict of interest issue on power venture, etc). We value Sintex at 8x FY13E EPS, which is 33% discount to its long-term average P/E. Our target price of INR112 offers ~42% upside from current levels. Re-initiating coverage with a Buy rating. We believe recovery in growth expected in 2HFY13 can provide with further re-rating catalysts. Stock Info Bloomberg SINT IN Equity shares (m) 271.0 52-Week Range 195/59 1, 6, 12 Rel. Perf. (%) 4/-48/-41 M. Cap. (INR b) 19.8 M. Cap. (USD b) 0.4 27 January 2012 Re-initiating Coverage | Sector: Diversified BSE Sensex S&P CNX 17,077 5,158 Financial snapshot (INR b) Sandipan Pal ([email protected]); Tel: +91 22 3982 5436 40 85 130 175 220 Jan-11 Apr-11 Jul -11 Oct-11 Jan-12 Sintex Inds. Sensex - Reba sed
Transcript of Sintex Industries - Motilal Oswal · improve FCF and balance sheet, to (1) enable USD290m FCCB...
Sintex IndustriesCMP: INR79 TP: INR112 Buy
Stock performance (1 year)
Shareholding pattern % (Sep-11)
Y/E March 2012E 2013E 2014E
Oper. Income 46.3 49.0 54.4
EBITDA 7.7 7.9 9.0
Adj. Cons. PAT 3.7 3.8 4.4
EPS (INR) 13.8 14.0 16.2
EPS Gr. (%) -16.1 1.7 15.9
B V/sh.(INR) 100.0 112.1 127.5
RoE (%) 14.6 13.2 13.6
RoCE (%) 11.9 11.4 12.8
P/E (x) 5.7 5.6 4.9
P/BV (x) 0.8 0.7 0.6
EV/EBITDA (x) 4.9 4.7 3.6
EV/Sales (x) 0.8 0.8 0.6
Domestic
Inst, 8.2
Others,
18.3Foreign,
38.6
Promoter
35.0
Long-term growth story, eclipsed by near-term slowdownMost concerns priced in; Buy for 42% upside
We believe Sintex's long-term growth story is broadly intact:
1. Building materials: Offers secular play on government's spending on low cost
housing and social infrastructure e.g. slum rehabilitation is an INR4.5t opportunity.
2. Composites: Expect synergies with overseas subsidiaries and continuous
innovations to drive next phase of profitable growth.
Domestic and global slowdown will stretch Sintex's working capital and moderate its
growth momentum over FY11-14. However, its operating efficiency combined with
lower capex wi ll help sustain positive FCF.
Most concerns are priced in; stock is attractively valued at 5.6x FY13E EPS. Re-initiate
coverage with TP of INR112 (8x FY13E EPS). Buy for ~42% upside.
Building Materials a huge opportunity; Sintex offers excellent play: Sintex's
Building Materials business caters to two kinds of low-cost construction
opportunities - (1) Housing, via monolithic construction, and (2) Non-housing,
via prefab structures (rural classrooms and healthcare clinics, worker shelters,
etc). Low-cost housing demand will be mainly driven by slum rehabilitation, an
INR4.5t opportunity by our estimates. Here, Sintex's monolithic segment enjoys
a strong order book of INR30b (BTB of 2x TTM) to be executed over 22 months. In
the non-housing segment, expect Sintex's prefab structures business to benefit
from rising government welfare expenditure on social infrastructure projects.
"Plastic-ization" to drive composites growth; Sintex well-placed: "Plastic-
ization" is an ongoing process of substitution of metals by plastic, driving Sintex's
composites business. We believe Sintex is poised to reap significant gains from
two kinds of synergies from its overseas subsidiaries: (1) Client synergy: Many
global clients of Nief (Sintex's European subsidiary) are expected to buy
composites from Sintex India. Subsidiary Bright is already supplying electrical
parts to Schneider. Other clients are also expected to follow shortly; and (2)
Operating synergy: Overseas subsidiaries will increasingly source intermediate
products and services (e.g. design) from India, leading to higher margins.
Headwinds may moderate growth, but balance sheet will improve: Expect
Sintex's FY11-14 revenue CAGR of only 7% and EBITDA CAGR of only 3%, given
multiple headwinds: (1) Deteriorating working capital due to payment delays,
(2) delay/cancellation of projects (ahead of state elections), (3) order slowdown,
etc. However, focus on working capital management and disciplined capex would
improve FCF and balance sheet, to (1) enable USD290m FCCB redemption due in
Mar-13, and (2) bring down net debt-equity to 0.3x in FY14 from 0.6x currently.
Concerns priced in; re-initiating coverage with TP of INR112, Buy: Sintex stock is
attractively valued at 5.6x FY13E EPS. This, we believe, prices in both (1) growth
slowdown, and (2) other concerns (FCCB repayment, conflict of interest issue
on power venture, etc). We value Sintex at 8x FY13E EPS, which is 33% discount
to its long-term average P/E. Our target price of INR112 offers ~42% upside from
current levels. Re-initiating coverage with a Buy rating. We believe recovery in
growth expected in 2HFY13 can provide with further re-rating catalysts.
Stock Info
Bloomberg SINT IN
Equity shares (m) 271.0
52-Week Range 195/59
1, 6, 12 Rel. Perf. (%) 4/-48/-41
M. Cap. (INR b) 19.8
M. Cap. (USD b) 0.4
27 January 2012
Re-initiating Coverage | Sector: Diversified
BSE Sensex S&P CNX17,077 5,158
Financial snapshot (INR b)
Sandipan Pal ([email protected]); Tel: +91 22 3982 5436
4085
130
175
220
Jan
-11
Apr
-11
Jul-
11
Oct
-11
Jan
-12
S intex Inds .Sense x - Reba sed

Sintex Industries
27 January 2012 2
Sintex Industries: Re-initiating Coverage
Page No.
Building Materials a huge opportunity; Sintex offers excellent play ...................... 3-8
Plasticization to drive composites growth; Sintex well-placed ............................. 9-14
Headwinds to moderate growth, balance sheet to improve ............................... 15-17
Concerns priced in; Buy with TP of INR112, 42% upside ....................................... 18-19
Key risks and mitigants ............................................................................................... 20
Financials and valuation ........................................................................................ 21-22
Note: All exhibits sourced from Company and MOSL, unless otherwise stated;
Stock prices and indices as of 25 January 2012

Sintex Industries
27 January 2012 3
Building Materials a huge opportunity;Sintex offers excellent play Sintex's Building Materials business caters to two kinds of low-cost construction
opportunities - (1) Housing, via monolithic construction, and (2) Non-housing, via prefab
structures (rural classrooms and healthcare clinics, sanitation, army barracks, worker
shelters, etc).
Low-cost housing demand will continue to be mainly driven by slum rehabilitation, an
INR4.5t opportunity by our estimates. Here, Sintex's monolithic segment enjoys a
comfortable order book of INR30b (BTB of 2x TTM) to be executed over 22 months.
However, delay in payments by state governments, policy inaction, state elections, etc,
could stretch working capital and dent pace of execution.
In the non-housing segment, we expect Sintex's prefab structures business to benefit
from rising government welfare expenditure on social infrastructure projects through
various programs, viz, JNNURM, SSA, NRHM, etc.
Excellent play on low cost construction technologiesSintex's Building Materials business caters to two kinds of low-cost construction
opportunities -
1. Housing, via monolithic construction: A relatively new construction technology,
which involves pouring concrete into a hollow plastic framework to build the
entire floor plan. This is well-suited for low-cost, massing housing - both in terms
of lower cost of construction and faster project completion.
2. Non-housing, via prefab structures: This involves assembling of concrete-
reinforced plastic panels, to create simple structures such as rural classrooms and
healthcare clinics, army barracks, worker shelters, sanitation blocks, etc.
Sintex offers excellent play on low cost construction technologies
Concept
Advantages
Faster execution
Cost advantage
Other advantages
Key usages
Key clients
Cost structure
Monolithic
An unconventional construction methodology by
pouring fluid concrete into light weight plastic
framework to construct wall/slab, with metallic bars
for strengthening. 5-8 storey structures can be built,
which have lifespan of ~25 years.
60-70% faster than conventional brick and mortar
system, especially for large repetitive structures.
Monolithic is 8-10% cheaper than conventional
process. All inclusive cost of INR900-1,100/sf (INR600/
sf for structure only).
No maintenance cost, eco-friendliness (use of fly ash
in mix), low labor intensity.
Low-mid cost housing, slum rehabilitation, housing
for police/army, student hostels etc
Majorly governments - various housing boards,
railways, defense, etc
RM 30-40%; Framework 5-7%; Labor 7-9%; Site
management 20-30% (smaller sites) and 12-13%
(bigger sites); Margin 18-19%
Prefabs
Simple structures built by assembling panels made of
concrete-reinforced plastic. Sintex offers end-to-end
solution in prefabs - manufacturing, logistics, and
installation at site.
Takes 10-12 days' time for setting up a simple school
structure under prefab.
Prefab is 15-25% cheaper than conventional process.
All inclusive cost of INR530-580/sf for a fully built
prefab structure is strongly competitive in Indian
scenario.
Typicality, reusability, low labor dependency
Public schools, healthcare clinics, site offices, Base
Transfusion (BT) shelter for telecom tower, agri sheds
70-75% government, rest private
RM 25-30% (incl purchased products, viz, asbestos,
paints, etc, and manufactured products); Kit-making
cost 18-20%; Logistics incl labor: 20-25%; Margin 20%
Extremely low
penetration of housing,
classrooms and
healthcare in India, offers
huge opportunity and
revenue visibility for
Sintex

Sintex Industries
27 January 2012 4
Monolithic: Key growth driver; Sintex well-placed with INR30b order bookMonolithic business has been the key growth driver for Sintex over FY08-11, with 85%
revenue CAGR and 87% EBITDA CAGR. Its share in revenue and EBITDA mix has
increased from 9/10% in FY08 to 30/32% in FY11. Further, order book has growth from
INR14b in FY09 to INR30b (flat for the past few quarters), 2x TTM sales.
In monolithic, Sintex enjoys superior margin compared to other construction
companies. Rising entry of other players could moderate margins, going forward.
However, we believe Sintex will continue to have an edge over others due to
(1) in-house production of plastic framework, (2) early mover advantage and long
track record, providing (3) scale advantage and a strong client network.
Sintex's Building Materials - 5-force analysis
2. Suppliers' Power LOW
3. Risk of Substitutes MODERATE
1. Customer Power HIGH
R/ms (cement,
asbestos, paints, PVC
etc) are typical
commodities, vendors
have limited
bargaining power
High, given a) Government
organization renders high
ticket projects with tighter
credit days, and b)
presence of large number
of players in the
conventional space
Monolithic and prefab offer comparatively faster and cheaper
solution, albeit it works better only for repetitive and standardized
large structures.
5. Competition MODERATE
Several players in the conventional space. Some global and local
companies offer similar technology based solutions, viz, L&T,
Ahluwalia, Maninfra, Billimoria, etc
4. Entry barrier HIGH
Execution is the key to competitive costing and faster delivery - which
requires: (a) High speculative upfront capacity investment with wider
reach within the country, (b) Optimization of material utilization.
Prefab is viable only for <1000km radius from manufacturing
locations. 2-3 day delay in logistics and erection process can eat
away viability in Prefab business.
Both the above segments put together offer a huge business opportunity in India e.g.
low-cost housing demand will continue to be driven by slum rehabilitation, an INR4.5t
opportunity by our estimates. We have tabled below key points of the two construction
technologies. We also apply Porter's 5-force framework to these businesses, and
assess Sintex's positioning in the same.
Housing boards together
make up 40% of
monolithic order book,
INR7.5b under SRA,
JNNURM, Rajiv Awas
Yojna etc. INR2-3b under
railways, while defence
and private players make
up the rest
Sintex's positioning: Sintex
has established execution
credibility with
government bodies in
Gujarat, Rajasthan, UP.
Sintex's positioning: Sintex's prefab plants are situated in 6
locations across the country to maximize coverage and logistics
advantage.
Sintex's positioning: Together, L&T and Sintex enjoy equal share
amounting to a total of 70% of the monolithic low cost housing
done in India.

Sintex Industries
27 January 2012 5
Current slowdown could stretch receivable cycle, dent capex and growthSintex's excellent track record notwithstanding, the ongoing slowdown presents
several near-term challenges for this vertical. Key issues are:
1) Rising delay in government processes: Various government bodies including
housing boards, railways, police, etc, are the major customers in monolithic
segment. Thus, under current challenging economic and political conditions,
monolithic business is adversely affected by pressure points like (1) delay in
government payments, (2) postponement of orders or re-tendering, (3) delay in
site clearance/handover (due to growing agitation), and (4) delay in technical
clearances. About 45% of Sintex's INR30b order book - slum rehab (INR7.5b),
railways (INR2.5b), defense (INR2.5b) - is facing execution slowdown or stoppage.
2) Stretched working capital cycle also affects execution: Monolithic business is
working capital intensive with average net working capital days over 140 days.
Dealing with several government bodies keeps the receivable cycle naturally high.
While the company's increasing focus on collection management process is
positive, we expect no major improvement in working capital cycle over FY12-13,
given the economic slowdown. The upcoming state elections in UP (Sintex has
INR4.5b of order book from the state) could also lead to some collection delays.
Stretched working capital also affects execution.
We expect the segment to de-grow 15% in FY12 and grow 10%/15% in FY13/14. EBITDA
margin is expected to decline to 19%/17.5%/18% in FY12/13/14 v/s 19.5% in FY11.
Order book comfortable at 2x TTM sales Meaningful rise in average order size/site (INR m)
Source: Company/MOSL
150
350
480
700800
FY08 FY09 FY10 FY11 FY12E
18 14 17 22 30 25 26 29 30 30 30
2.22.02.12.22.3
2.7
3.73.1
2.1
1.31.4
1Q
FY10
2Q
FY10
3Q
FY10
4Q
FY10
1Q
FY11
2Q
FY11
3Q
FY11
4Q
FY11
1Q
FY12
2Q
FY12
3Q
FY12
Order Bo ok (INR b) Boo k to Bi l l (x)
Monolithic has been key growth driver for Sintex (%) Enjoys superior margin than construction peers
13.2
9.6 9.1 9.6
19.5
HCC NCC IVRCL Simplex Sin tex
FY11 margin (%)
915
22
3025 25 26
10
16
25
32
28 28 29
FY08
FY09
FY10
FY11
FY1
2E
FY1
3E
FY1
4E
Sales contribu tion EBITDA contributio n
Management has also
adopted a strategy to
prioritize working capital
management over
growth by not deploying
cash in execution of a
monolithic project with
lower receivable
visibility

Sintex Industries
27 January 2012 6
New order growth witnessed moderation (INR b) Growth at Monolithic to moderate
Source: Company/MOSL
4.94.2
8.99.8
4.5
8.7
3.82.8 2.6
(2.6)(2.8)
1QFY
10
2QFY
10
3QFY
10
4QFY
10
1QFY
11
2QFY
11
3QFY
11
4QFY
11
1QFY
12
2QFY
12
3QFY
12
4.5 7.2 13.4 11.4 12.5 14.4
18%18%
19%20%
19%
18%
200
9
201
0
201
1
201
2E
201
3E
201
4E
Monol i thic Revenue(INR b) EBITDA margin(%)
Prefabs: Government's social spending continues to drive demandFor Sintex's prefabricated structures business, two major revenue contributors are:
(1) Classrooms under the Sarva Shiksha Abhiyan (SSA i.e. Education For All), and (2)
Healthcare centers under the National Rural Health Mission (NRHM). The budget for
SSA has increased from INR72b in 2006 to INR210b in 2012. A significant portion (30-
35%) of the SSA budget gets used up in the construction of classrooms in rural areas.
Similarly, the government has stated its objective of having a primary hospital in
every village in India under the NRHM. The budget for NRHM has grown at a CAGR of
18% over the last six years to INR178b in 2012. Thus, the size of the opportunity is huge
with central and state governments allocating funding to a wide range of social
schemes. In addition to government contracts (70-75%), there is also significant
opportunity in private sector projects such as cold chains, bunk houses, agricultures
sheds, etc.
27.9
46.261.8
93.0
1981 1991 2001 2011
Slum population (m) 93
Persons per house 6
Houses required 15.5
Avg House Area (sqf) 300
Cost per psf 1,000
Cost per house (INR m) 0.3
Slum rehab opportunity (INR b) 4,650
Monolithic: Huge long-term potential Slum rehabilitation, an INR4.5t opportunity: A recent government study
estimated India's slum population in 2011 at ~93m. This presents a housing
opportunity of at least INR4.5t. The government is committed to reduce
population residing in slums. This is evident in the rising budgets for initiatives
like Jawaharlal Nehru National Urban Renewal Mission (JNNURM) and the
recently launched Rajiv Awas Yojna, specifically aimed at slum rehabilitation.
Fast increasing slum population... ...presents a huge housing opportunity
Source: Industry/MOSL
Significant opportunity with Railways and Army: Railways intends to build
houses for 1.4m employees by FY20; This is a significant opportunity since land
and funding are not that problematic for Railways. Likewise, every year, the
Indian Army plans to build 15,000-20,000 houses.
A significant portion
(30-35%) of the SSA
budget gets used up in
the construction of
classrooms in rural areas

Sintex Industries
27 January 2012 7
Increasing budgets in social schemes, viz, SSA, NRHM, etc (INR b)
Source: GoI/MOSL
Established track record bestows competitive advantageSintex has already erected several schools and hospitals under various government
schemes. It is now one of the very few players with the ability to erect a structure in
half the time usually taken by traditional contractors, which, in turn, helps the state
to meet its annual deadline. The company has approvals in place for 17 states, of
which 12-13 states are active. At present, projects from UP, Bihar and Gujarat account
for a major chunk of Sintex's prefab revenue.
Logistics accounts for a significant share of prefab construction costs. Hence, an
established capacity and wide geographical reach hold the key to cost-effective
execution. Sintex's prefab plants are situated in 6 locations across the country to
maximize coverage. The gestation period for the business is 2-3 years; hence, currently,
L&T remains the only competitor at the national level, with both Sintex and L&T
enjoying a combined market share of 60-70% (on equal basis).
0
50
100
150
200
250
Sarv
a S
hiks
ha
Abh
iyan
(S
SA)
Nat
ion
al R
ural
Hea
lth
Mis
sion
(NR
HM
)
Indi
ra
Aw
as
Yoj
ana
JNN
UR
M
BSU
P
(urb
an
poo
r)
JNN
UR
M IH
SDP
(slu
m
reha
b/h
ousi
ng
Raj
iv
Aw
as
Yoj
ana
2006 2007 2008 2009 2010 2011 201220% CAGR
18% CAGR
24% CAGR
Huge completive positioning due to first mover's advantage and wide plant network
Source: Company/MOSL
Dadri
Baddi
Nagpur
Salem
KalolKolkata
Sintex has approvals in
place for 17 states, of
which 12-13 states
are active
Sintex's prefab plants are
situated in 6 locations
across the country to
maximize coverage

Sintex Industries
27 January 2012 8
6.75.6 6.5 7.0
7.88.8
19.5%19%20%21%
17%
20%
2009 2010 2011 2012E 2013E 2014E
Pre-fab Revenue (INR b) EBITDA margin
Impact of slowdown: expect only a limited moderation in growthSintex's prefab segment has witnessed an 8% CAGR over FY07-11. This is despite a
sharp cutback in BT (base transfusion) shelter business, due to slowdown in roll-out
of telecom towers. Ex BT shelters, the CAGR would be much higher at 25-30%. This is
helped by strong social spending by governments on rural improvement projects, viz,
education, healthcare, sanitation, etc.
As in monolithic, Sintex's pre-fab business is also witnessing slowdown with only 5%
YoY growth in 9MFY12. But unlike monolithic, we expect a limited impact of project
slowdown due to the following reasons -
a) Continuous product and geographic diversifications with multiple projects from
same customer/geography offering resilience to capacity utilization and margin.
Unlike monolithic, prefab business involves several shorter gestation projects
with smaller ticket size, which reduces the risk of cancellation/delay.
b) There are no significant payment delays, as small orders (~INR1m for prefab as
against INR700-800m in monolithic) can be cleared at the collector level itself.
c) Virtual duopoly creating a high entry barrier (gestation period for a new entrant
would be 2-3 years).
Going forward, we model in a much more moderated revenue CAGR of 11% over
FY11-14. We also model in EBITDA margins to decline 100bp from 20.5% in FY11 to
19.5% in FY14. This, we believe, captures both positives and negatives.
Positives: (1) Sintex's entry into new states like UP (FY11), Bihar, Maharashtra (FY12),
and (2) huge opportunity in newer segments like cold chain which could get further
boost with FDI allowance in multi-brand retail.
Negatives: Approvals and collections in FY13 could be impacted by the outcome of
elections in several states viz. UP, Punjab etc.
Expect revenue CAGR of 11% over FY11-14
Source: Company/MOSL
We expect a limited
impact of project
slowdown due to
continuous product and
geographic
diversification and cost
savings on logistics by
servicing repeat
customers

Sintex Industries
27 January 2012 9
Plasticization to drive composites growth;Sintex well-placed
"Plastic-ization" is an ongoing process of substitution of metals by plastic, driving Sintex's
composites business. We believe Sintex is poised to reap significant gains from two kinds of
synergies from its overseas subsidiaries:
1. Client synergy: Many global clients of Nief (Sintex's European subsidiary) are expected to
buy for their Indian operations, composite parts from Sintex India and its Indian subsidiary,
Bright Autoplast. Bright is already supplying electrical parts to Schneider in India. Other
clients like Areva, ABB, Bombardier, etc are also expected to have India operations shortly;
and
2. Operating synergy: Overseas subsidiaries will increasingly source intermediate products
and services (e.g. design) from India, leading to higher margins.
"Plasticization" trend to continueSintex will continue to benefit from the rising trend of "plasticization", i.e. substitution
of metals by plastic composites across industries, mainly autos, electrical, aerospace,
and healthcare, defense, etc. Plastic composites are gaining preference in various
industries over metal due to their sheer advantageous properties , viz, (1) low weight
but high strength (renders better fuel efficiency for Auto), (2) temperature resistance
and electrical insulation, (3) low corrosion and chemical inertness, etc. While
comparatively the growth is low overseas due to near-saturation in the rate of
substitution, significant opportunity exists in emerging countries like India.
Sintex's domestic positioning is strongSintex has established itself as a leading plastic composites molding player in India
with -
(1) A vast product range across segments, viz, household products, electrical and
automotive;
(2) A strong client base including auto OEMs (original equipment manufacturers),
engineering companies, state electricity boards, local governments, etc;
(3) Integrated processors and fabricators with as many as twelve plastic processes
(blow molding, injection molding, roto molding, extrusion, etc), and
(4) Manufacturing facilities across the country.
Key product segments:
Household products: Interior, kitchen cabinets, waste bins, solar cookers, furniture,
crates, etc.
Electrical - Meter boxes, pillar boxes, junction boxes, fiber-reinforced plastic
insulators, etc
Bright Auto: Bumper systems, acoustic management systems, seating systems,
instrument panel, trims and pillars, exterior trims, radiator grills, air vent grab
handles, fuel tank, air ducts, two-wheeler parts, etc.
Plastic composites are
gaining preference in
various industries over
metal due to their sheer
advantageous properties

Sintex Industries
27 January 2012 10
Poised to enjoy synergies with overseas subsidiariesBetween mid-2007 and mid-2008, Sintex embarked on an inorganic growth strategy
in composites, through a series of acquisitions both in India and overseas. The major
acquisitions include (1) Bright Autoplast in India, (2) Nief Plastics, France, and (3)
Wausaukee Composites, USA (see table below for full details on acquisition in custom
molding/composites business).
The rationale behind Sintex's acquisitions was (1) foray into new verticals and clients,
(2) moving up the product value chain, (3) gaining technological prowess, and (4)
exploiting synergies. Post acquisitions, there was a major global slowdown. So,
overseas subsidiaries did not grow as expected. However, we believe, Sintex is now
poised to reap significant gains from two kinds of synergy: (1) Client synergy and (2)
Operating synergy.
Overseas subsidiaries: Key products and target segments
Nief Plastics: 35% electrical, 27% auto, 26-30% aerospace/defense as major
segments as on FY11 revenue of INR9.2b. Dependence on auto segment has declined
from ~60% in FY07 to ~28%, while concentration on France has come down to ~55%
(v/s. ~90% in FY07).
Wausaukee Composites: Medical imaging, industrial trucks and tractors and mass
transit accounted for ~25% each to revenues of INR4b (including Nero Plastics).
Revenue is predominantly from the US.
Sintex embarked on an
inorganic growth strategy
in composites, through a
series of acquisitions
both in India and
overseas
Acquisitions in custom moldings to provide a strong client base
Company Date Stake Currency Price Products Clients Remarks
(%) (m)
Geiger Technik, 31-Jul-08 90 Euro 6.9 Precision plastic BMW, VW, Daimler, 67% of revenue
Germany (Written parts Audi, TRW, Bosch, from Tier l; off post
fi l ing Siemens 37% fromOEMs;
of Bankruptsy) 4 plants
Nero Plastics 3-Dec-07 100 USD 4.8 Structural plastic and Global OEMs Acquired by
(Merged with composite components Wausaukee
Wausaukee) Composites Inc
Nief Plastic, 28-Sep-07 100 Euro 30.7 Plastic products for auto, ABB, Areva, 11 manufacturing
France electrical and electronics, EADS, Faurecia, plants - 7 in France;
aeronautics, defence, Legrand, Schneider, others in Hungary,
household appliances, Siemens, Snecma, Tunisia, Morocco,
bui lding ThyssenKrupp Slovakia
Automotive, Valeo,
Visteon
Bright Autoplast 6-Sep-07 100 INR 1,489 Bumper systems, Maruti Suzuki, 5 plants - Pune,
Pvt Ltd Acoustic management Tata Motors, Sohna, Chennai,
systems, seating Honda, M&M, Pithampur, Nashik
sytems, etc Hyundai
Wausaukee 31-May-07 100 USD 20.5 Composite plastic Philips, Siemens, 3 plants in the US
Composites and fibreglass Alstom, GE Medical,
components Rail Plan Intl
Source: Company/MOSL

Sintex Industries
27 January 2012 11
Client synergy: Dedicated plant for Schneider; others may followWhat is Client synergy: Many global clients of Nief (Sintex's European subsidiary) are
expected to buy for their Indian operations, composite parts from Sintex India and its
Indian subsidiary, Bright Autoplast. Bright is already supplying electrical parts to
Schneider in India. Other clients like Areva, ABB, Bombardier, etc are also expected
to have India operations shortly.
The Schneider experience: Schneider Electric, a major client of Nief, has been investing
heavily in India since 2008. Recently, it acquired 74% stake in Luminous Inverters to
enter the business to customer (B2C) segment. Schneider plans to increase its exposure
to India by (1) serving institutional clients, and (2) growing retail presence through
organic and inorganic means. Nief has convinced Schneider to source its requirement
of composites in India from Sintex Group. A dedicated plant for Schneider is already
functional under Sintex's domestic subsidiary, Bright Autoplast.
More clients to follow: Sintex is replicating the Schneider model with Nief's other
clients like Areva and Legrand. Areva has become an anchor customer (dedicated
plant required, with 50-70% assured sales). Legrand, another French major, has signed
a contract with Sintex for outsourcing of electrical parts. Talks with ABB Alstom,
Bombardier, and other Nief customers are at advanced stages and the management
expects positive outcomes. We believe client synergy will meaningfully enhance
composites revenue growth for the Sintex Group as a whole.
Client synergy: Current and future
Client Relationship Vertical Geography
Schneider Anchor customer Electricals India and Africa
Areva Anchor customer Electricals India
Legrand Contract customer Electricals Outsourcing
ABB Contract customer Electricals India
ABB Alstom Expected to materialize Mass Transit India
Bombardier Expected to materialize Mass Transit India
Source: Company/MOSL
Snapshot: convincing growth visibility from Nief's clients
Schneider's revenue of INR1.3b includes Nief (INR1b) and Schneider India
(INR300m) in FY11
Schneider is expected to place orders worth INR1.5-1.8b over next 2-3years.
Areva is expected to place orders worth INR0.6-1b over FY12-FY14, while ABB
Alstom is expected to place an order of similar size, followed by Bombardier
Operating synergy: Provides resilience to overseas marginsWhat is operating synergy: Sintex is tapping operating synergies between Indian and
overseas operations: (1) in the first phase, by outsourcing intermediate processes
such as design and common services such as HR, finance and accounting from India,
and (2) in the next phase, by sourcing semi-finished goods from India.
Benefit - scope for margin expansion: Overseas, composite vertical involves high-
cost labor (25-38% of revenue compared to 9-11% in India). Thus, there is tremendous
scope for margin expansion in Sintex's overseas subsidiaries through outsourcing to
India non-core, labor-intensive processes, and also sourcing from India intermediate/
semi-finished products.
Sintex is replicating the
Schneider model with
Nief's other clients like
Areva and Legrand
Overseas, composite
vertical offers
tremendous scope for
margin expansion

Sintex Industries
27 January 2012 12
Besides, Sintex is also adopting various other margin-optimization and de-risking
steps in Nief, viz, (1) lowering production share of high-cost France facilities from
90% in FY08 to ~55% currently, by increasingly shifting production to low-cost
geographies such as Slovakia, Hungary, Tunisia, and Morocco, and (2) lowering
dependence on auto (down to 27% of revenue from 60% in FY08) by diversifying to
other verticals, viz, electrical, aerospace, defense, etc.
Slowdown likely to hurt growth, delay synergy benefitWe expect the prevailing domestic and global slowdown to hurt revenue growth, and
also delay the expected synergy benefits, as explained below.
Nief, Wausaukee: They account for ~64% of Sintex's composite revenue. Sovereign
debt crisis in Europe and slowdown in the US will affect topline growth for both.
Bright Autoplast: About 85% of Bright's revenue comes from the Auto sector. Our
Auto team expects flat volume growth in FY12 and muted 10-15% growth in FY13.
Business from selling electrical parts to Nief clients like Schneider and Areva are
no longer expected to clock hyper growth expected earlier.
Sintex composites: Major clients include industrial sector, State Electricity Boards
and Auto sector, all of which are in the midst of a slowdown.
Sintex expects clarity on client budgets to emerge in 1HCY12. However, we believe
the probability of slowdown is fairly high. We accordingly model in muted sales growth.
We also do not model in synergy benefit, and actually expect Composites EBITDA
margin to contract 150-200bp over FY11-14. The drop in margins could have been
much higher but for margin-optimization and de-risking steps described earlier.
Custom molding assumptions
Composit Business Break-up FY08 FY09 FY10 FY11 FY12E FY13E FY14E
Nief [Auto, Electrical, Aerospace, Defence]
Revenue 3,489 7,400 8,040 9,246 9,986 8,987 9,436
EBITDA 298 850 965 1,110 974 854 944
EBITDA Margin (%) 8.5 11.5 12.0 12.0 9.8 9.5 10.0
Sales Growth (%) 112 9 15 8 (10) 5
Wausaukee + Nero [Electrical, Mass Transit, Medical, Wind energy, Agri equipments, Trucks etc]
Revenue 1,017 2,200 1,509 2,664 2,930 2,930 3,077
EBITDA 32 115 151 269 278 278 292
EBITDA Margin (%) 3.1 7.0 10.0 10.1 9.5 9.5 9.5
Sales Growth (%) 116 (31) 77 10 - 5
Bright Brother (majorly Auto components ~85%, Electrical parts)
Revenue 404 1,270 1,910 2,750 3,300 3,796 4,365
EBITDA 80 203 267 443 462 531 611
EBITDA Margin (%) 19.8 16.0 14.0 16.1 14.0 14.0 14.0
Sales Growth (%) 214 50 44 20 15 15
Domestic Ex Bright
Revenue 4,120 3,470 3,548 4,050 4,860 5,588 6,427
EBITDA 923 500 836 985 1,142 1,257 1,446
EBITDA Margin (%) 22.4 14.4 23.6 24.3 23.5 22.5 22.5
Sales Growth (%) (16) 2 14 20 15 15
Total Domestics
Revenue 4,524 4,740 5,458 6,800 8,160 9,384 10,792
EBITDA 1,003 703 1,103 1,428 1,604 1,789 2,057
EBITDA Margin (%) 22.2 14.8 20.2 21.0 19.7 19.1 19.1
Sales Growth (%) 84 5 15 25 20 15 15
The hyper growth
expectation from Bright's
new and potential clients
such as Schneider, ABB,
Areva has also been
impacted significantly
leading to a delay/
moderation of
expansion/spending plan
De-growth in domestic/
EU car volume and
slowdown in order
inflow from light
electrical segment
foreign geographies
would be the key
challenges for FY13

Sintex Industries
27 January 2012 13
Nief: Due to higher dependence on Auto sector (27-30%), which has shown a
strong negative outlook, we model in ~10% sales de-growth in FY13, coupled with
250-300bp margin contraction. Higher contribution from electrical segment, cross-
border outsourcing synergy with Bright could ameliorate margin from current
level.
Wausaukee: Relatively healthier trend in electrical, medical, agricultural segments;
we expect sales to witness higher resilience than Nief. We assume a flattish FY13,
albeit we do see some margin contraction. Higher capacity utilization in Wind
energy segment could improve margin.
Bright: Again a higher dependence on domestic automobile segment would lead
to moderation in sales growth (estimated at 20% against management guidance
of 25% in FY12, and is further expected to moderate to15% in FY13). In electrical
segment too, a sharp slowdown in Schneider business, delay in order
commencement from other Nief clients (ABB, Areva etc) are likely to impact
capacity utilization and could drive margin contraction. We model in ~200bp margin
reduction over FY12-13.
Domestic car sales moderated over FY12 ('000) …so is Europe car volume, luxury segment relatively stable (m)
Wind energy outlook bearish, while medical imagingGlobal auto components sales posted declining trend (Biotech), Agri mechanic maintained growth
0
75
150
225
300
FY0
2
FY0
3
FY0
4
FY0
5
FY0
6
FY0
7
FY0
8
FY0
9
FY1
0
FY1
1
FY1
2
Apri l May June July
Augus t September October November
December January February March
(40)(20)
-
2040
6080
100
Ma
r-02
Dec
-02
Sep
-03
Jun-
04
Ma
r-05
Dec
-05
Sep
-06
Jun-
07
Ma
r-08
Dec
-08
Sep
-09
Jun-
10
Ma
r-11
Dec
-11
(40)
(20)
-
20
40
60
80
Automobi le vehicle mfg Auto Parts
Auto Reta i l
12
(2)
1(5
)(4
)8
(8)
(17
) (10
)(1
4)
(2)
(3)
6 6 72 1
10
1 01
65
(1)
(2)
0.0
1.0
2.0
3.0
De
c-09
Feb
-10
Apr
-10
Jun
-10
Au
g-1
0
Oct
-10
De
c-10
Feb
-11
Apr
-11
Jun
-11
Au
g-1
1
Oct
-11
-40
-30
-20
-10
0
10
20
EU car s ales Luxury CarCar sa les Growth (%) Luxury Car sa les Growth (%)
-30
0
30
60
Jun
-06
Oct
-06
Feb
-07
Jun
-07
Oct
-07
Feb
-08
Jun
-08
Oct
-08
Feb
-09
Jun
-09
Oct
-09
Feb
-10
Jun
-10
Oct
-10
Feb
-11
Jun
-11
Oct
-11
Wind Energy Biotech
Agri Machinaries AerospaceYoY growth(%)
Source: Bloomberg/MOSL
Almost 65-70% of
composite revenue is
driven by US and
European clients - a)
foreign subsidiaries
accounts for ~64%, b)
cross-client synergy
accounts for 2-3% of
Bright's sales

Sintex Industries
27 January 2012 14
FY11-14E Earning CAGR estimates of key clients depicts muted outlook for Auto and relativelybrighter scenario for electrical
2 %
5 %6 %
5 %
4 %
8 %
3 %
- 1 %Pe
ugeo
t
Ren
aul
t
Sch
neid
er
Are
va
Als
tom
AB
B
Val
eo
Sie
men
s
4,5
24
4,7
40
5,45
8
6,80
0
8,16
0
9,3
84
10,7
92
4,5
06 9,60
0
9,54
9
11,
910
12,9
16
11,9
18
12,5
13
2,46
0FY
07
FY08
FY09
FY10
FY11
FY1
2E
FY1
3E
FY1
4E
Domes tic Rev (INR m) Foreign Rev (INR m)
17.9
%
22.2
%
14.
8% 20
.2%
21.
0%
19.
7%
19.1
%
19.1
%
0.0%
7.3%
11.
4%
11.7
%
11.6
%
9.7%
9.5% 9.9
%
17.9
%
14.8
%
12.
5%
14.8
%
15.
0%
13.
6%
13.
7%
14.1
%
FY07
FY08
FY09
FY10
FY11
FY1
2E
FY1
3E
FY1
4E
Doemes tic Margin Foreign Margin Blended Margin
Slowdown in order inflow and lower capacity utilizations to moderate revenue growth and contract margins
Source: Bloomberg/MOSL
Source: Company/MOSL
Automobiles

Sintex Industries
27 January 2012 15
Headwinds to moderate growth, balance sheet to improve Deteriorating working capital in monolithic and order slowdown in custom molding could
be the key growth deterrents over 4QFY12 through 1HFY13, with some stability in
2HFY13-14. Over FY11-14, we see muted revenue CAGR of 7% and EBITDA CAGR of 3%.
However, stronger focus on receivable management, cash conservation, and lower capex
would improve FCF (cumulative INR8.1b over FY12-14) and strengthen balance sheet -
(1) this will support USD290m FCCB redemption due in Mar-13, and (2) Lower net debt-
equity to 0.3x in FY14 from 0.6x currently.
Near-term growth outlook dented considerablyWe expect Sintex to post muted revenue CAGR of ~7% over FY11-14 (v/s 25% over
FY08-11), driven by 2% CAGR in monolithic construction (85% over FY08-11), 11% CAGR
in prefabricated structures (8% over FY07-11) and 8% CAGR in composites (27% over
FY08-11). With lower capacity utilization hurting margins across segments, we estimate
EBITDA CAGR of 3% and adjusted PAT CAGR at 0%.
Revenue growth moderation is largely attributable to monolithic and composites segments
11.722.9
31.4 33.244.8 46.3 49.0 54.4
171617181617
1719
FY0
7
FY0
8
FY0
9
FY1
0
FY1
1
FY12
E
FY13
E
FY14
E
Revenue (INR b) EBITDA Margin (%)
Expect a de-growth in net profit over FY11-13
FCF to improve with moderating capex, better WC management
Y/E March 2008 2009 2010 2011 2012E 2013E 2014E
Cashflow before WC Change 3,491 5,030 4,981 6,990 6,898 7,118 7,920
(Inc)/Dec in WC -1,049 -3,664 -7,480 1,172 -3,637 -3,052 126
CF from operations 2,442 1,366 -2,499 8,162 3,261 4,066 8,046
Cepex -11,656 -5,286 -2,315 -8,253 -2,982 -1,610 -1,903
Free Cash Flow -8,984 -3,726 -4,327 99 -145 2,148 6,143
Interest/Dividend paid 804 996 921 1,295 1,669 1,642 1,708
Inc/(Dec) in Debt 12,372 3,702 3,339 1,434 2,471 -5,342 571
Ner cash flow 9,812 -2,028 -2,390 566 693 -4,805 5,037
2,27
3
3,98
1
5,21
9
5,38
0
8,15
5
7,65
2
7,92
5
9,01
71,30
4
2,12
6
3,09
6
2,8
96
4,4
57
3,7
39
3,8
01
4,4
05
FY07 FY08 FY09 FY10 FY11 FY12E FY13E FY14E
EBITDA PAT
8%
38%
2% 2%12%
-1%
8%15%
85%
11%6%
17%
Text
ile
Mon
olit
hic
Pref
ab
Dom
esti
c
Com
pos
ites
Ove
rse
as
Com
pos
ites
Tank
s
FY08-11 FY11-14EGrowth CAGR

Sintex Industries
27 January 2012 16
Working capital improvement process to be delayedOver the past 3 years, sharp growth in working capital intensive monolithic business
has deteriorated operating cash flows. The net working capital (NWC) days rose from
42 in FY07 to 152 in FY10, before retreating substantially to 102 in FY11, but rising again
to 126 days in 3QFY12. However, NWC in the other verticals is relatively lower - prefab
(50-65 days), custom molding (foreign 30-40 days, domestic 50-60 days), textiles (80-
90 days), water tanks (90 days), etc.
The management aims to improve balance sheet quality by stabilizing NWC at 120-
125 days. In the backdrop of payment delays from governments, Sintex is likely to
forego some growth in monolithic segment by selectively executing only those
projects with cash flow visibility, and conserve cash for FCCB redemption due in FY13.
Even in verticals other than monolithic, Sintex is focusing on (a) stabilizing business
composition, (b) better capacity utilization and (c) greater discipline in receivables
management (e.g. use of letters of credit, dedicated relationship management with
government departments, etc).
Still, we expect NWC to stretch further to 127/143 days over FY12/13, before a possible
trend reversal in FY14.
Expect receivable days to deteriorate over FY12/13 NWC days to be stretched further
73
127
96113 116
127 128 134
FY07
FY08
FY09
FY10
FY11
FY1
2E
FY1
3E
FY1
4E
46 41
74
152
102
127 143
128
FY07
FY08
FY09
FY10
FY11
FY1
2E
FY1
3E
FY1
4E
Source: Company/MOSL
(1,0
49)
(3,6
64)
1,17
2
(3,8
92)
(2,0
09)
(61)
(3,7
26)
(4,3
27)
(145
) 2,14
8 6,14
3
(7,4
80)
99
(8,9
84)
FY08 FY09 FY10 FY11 FY12E FY13E FY14E
Working capi ta l change FCF
But lower share of WC intensive monolithic business and lower capex commitment to improve FCF
Source: Company/MOSL
915
22
3025 25 26
10
16
25
32
28 28 29
FY0
8
FY0
9
FY1
0
FY1
1
FY12
E
FY13
E
FY14
E
Sa les contribution EBITDA contribution

Sintex Industries
27 January 2012 17
Expect positive FCF on the back of moderated capexWe expect Sintex to generate positive free cash flow over FY12-14, largely on account
of (1) improved emphasis on working capital management, and (2) moderating capex.
Sintex has already set up enough capacity in almost all the verticals. Accordingly,
management has guided for substantial moderation in capex from the earlier planned
INR10b over the next 3 years.
We model in capex of INR3.4b in FY12 (INR1.9-2b in 1HFY12) and a total of INR3.5b
over FY13-14. Decline in capex would improve the likelihood of positive FCF; we
estimate FCF at INR8.1b over FY12-14.
FCF to improve balance sheet; FCCB redemption under controlIn FY08, Sintex had raised USD225m of FCCBs (mainly for overseas acquisition), which
are maturing in Mar-13 with redemption value of ~USD290m. The company expects to
finance the same as follows -
1. USD110m of unused FCCBs in the form of overseas deposit;
2. USD70m from internal accruals; and
3. USD110m re-finance though ECB.
The redemption of FCCBs coupled with rising FCF would lower debt on the balance
sheet. Our estimates suggest Sintex's net DER will decline from 0.6x in FY11 to 0.3x in
FY14. Nonetheless, lower asset utilization and declining margin could dent RoE/RoCE
to 13.2%/11.4% in FY13 and 13.6%/12.8% in FY14 (v/s 20.5%/14.3% in FY11).
Du Pont: Lower assets turn and declining margins to impact RoE
FY07 FY08 FY09 FY10 FY11 FY12E FY13E FY14E
Net income / PBT 0.78 0.70 0.76 0.71 0.73 0.81 0.81 0.75
Interest burden (PBT/EBIT) 0.90 0.94 1.01 1.04 0.91 0.77 0.77 0.84
EBIT margin (EBIT/Revenue) 0.16 0.14 0.13 0.12 0.15 0.13 0.12 0.13
Asset turnover (Revenue/Avg TA) 0.87 0.95 0.83 0.77 0.92 0.85 0.87 0.94
Leverage (Avg TA/Avg equtiy) 2.06 2.20 2.32 2.36 2.25 2.13 1.96 1.78
RoE (%) 20.0 19.4 19.1 15.9 20.5 14.6 13.2 13.6
RoCE (%) 15.2 14.2 12.6 10.0 14.3 11.9 11.4 12.8
Source: Company/MOSL
Generation of FCF would
partly addresses the
accrual required for FCCB
redemption
0.3
0.5
0.6
0.8
0.60.6
0.20.2
FY07
FY08
FY09
FY10
FY11
FY1
2E
FY1
3E
FY1
4E
16%
15%14%
13%14%
12% 11%13%
10%
14%13%15%
19%19%20% 20%
FY07
FY08
FY09
FY10
FY11
FY1
2E
FY1
3E
FY1
4E
RoCE RoE
Net DER to decline from 0.6x in FY11 to 0.3x in FY14 RoE/RoCE to decline to 12.6%/12.2%
Source: Company/MOSL

Sintex Industries
27 January 2012 18
Concerns priced in; Buy with TP of INR112, 42% upside Sintex's current valuation reflects both (1) growth moderation, and (2) other concerns
(FCCB repayment, conflict of interest in power venture).
The company is expected to generate positive FCF over FY12-14, which should boost
investors' confidence.
We value Sintex at 8x FY13E EPS to arrive at a target price of INR112, 42% upside from
current levels. Buy.
Current valuation discounts unsustainableHistorically, Sintex has traded almost at par with Midcap CNX P/E, barring recent times
when concerns over FCCB repayment, MTM forex loss and conflict of interest issue on
power venture raised the discount. At current valuation, the stock trades at 5.6x
FY13E EPS and 4.9x FY14E EPS, which we believe adequately prices in most risks and
concerns (see page 20 for details).
Historically Sintex has traded almost at par with CNX Mid-cap Long-term average P/E stands at 11.9x
Source: Company/MOSL
2
6
10
14
18
22
26
30
De
c-06
Jun-
07
De
c-07
Jun-
08
De
c-08
Jun-
09
De
c-09
Jun-
10
De
c-10
-12
-8
-4
0
4
8
12Pre mi um Si nte x CNX Mi dca p
4.7
11.9
27.1
4.1
0
7
14
21
28
35D
ec-0
6
Jul-0
7
Dec
-07
Jun-
08
Dec
-08
Jun-
09
Dec
-09
Jun-
10
Dec
-10
Jun-
11
Dec
-11
P/E (x) Avg(x) Peak(x) Min(x)
Sales Growth assumptions (%)
FY08 FY09 FY10 FY11 FY12E FY13E FY14E
Textiles 10.2 6.5 -6.7 25.8 6.0 6.0 6.0
Plastics 126.0 39.7 9.3 37.5 2.9 5.9 11.6
Building Materials 68.9 22.9 14.5 50.9 -5.5 10.8 13.6
Prefab 38.9 1.2 -15.7 14.4 8.0 12.5 12.5
Monolithic 115.0 59.1 86.0 -15.0 10.0 15.0
Tanks 18.0 -9.5 14.9 22.4 15.0 10.0 10.0
Composites 267.1 58.8 4.7 24.7 12.6 1.1 9.4
Domestic 83.9 4.8 15.1 24.6 20.0 15.0 15.0
Foreign 113.0 -0.5 24.7 8.4 -7.7 5.0
Source: Company/MOSL
EBITDA Margin assumptions (%)
FY08 FY09 FY10 FY11 FY12E FY13E FY14E
Textiles 27.6 27.8 20.0 24.0 22.0 22.0 22.0
Plastics 16.1 15.5 15.9 17.5 15.9 15.5 16.0
Building Materials 17.2 18.1 17.1 19.0 18.3 17.2 17.7
Prefab 18.6 20.1 16.6 20.5 20.0 19.0 19.5
Monolithic 19.0 18.0 19.0 19.5 19.0 17.5 18.0
Tanks 9.0 9.0 10.1 11.0 10.0 10.0 10.0
Composites 14.8 12.5 14.8 15.0 13.6 13.7 14.1
Domestic 22.2 14.8 20.2 21.0 19.7 19.1 19.1
Foreign 7.3 11.4 11.7 11.6 9.7 9.5 9.9
Source: Company/MOSL

Sintex Industries
27 January 2012 19
Valuing Sintex at INR112/share, 42% upside; BuyWe value Sintex at 8x FY13E EPS, which is 33% discount to its long-term average P/E,
and also 20% discount to prevailing one-year forward multiple of 10x for CNX Mid-
cap. Our target price of INR112 offers 42% upside from current levels. We re-initiate
coverage on Sintex with a Buy rating.
SOTP based value is close to our P/E-based target price
FY13 EBITDA EV Remarks
Texti les 1,077 5,921 Textile peers trading at average 5.5x
one year forward
Prefab 1,489 8,934 Major construction companies IVRCL, HCC,
Monolithic 2,188 13,126 NCC trading at 5.5-6x one year forward EBITDA
Tanks 251 1,003 Nilkamal and Supereme trading at average 4x
on one year forward EBITDA
Domestic Composits 1,789 10,733 Auto sector average 7-8x EBITDA, valuing at 6x
Foreign Composits 1,132 4,529 Auto, electrical clients average multiple 5-8x,
valuing at 6x
Total 7,925 44,245
Net debt 16,598
Equity value 27,648
Value per share 102
Source: MOSL

Sintex Industries
27 January 2012 20
Key risks and mitigants
Severe domestic and/or global slowdownSintex's revenue growth and EBITDA margin for 2Q/3QFY12 and the downward trend
in management guidance reflect the impact of domestic political/economic uncertainty
and global slowdown. Domestic monolithic construction is seeing delayed payments
and execution slowdown. Overseas subsidiaries are facing muted growth and
pressure on margins. If this situation prolongs, there could be downside risks to our
estimates and target price.
Mitigant: Conservative estimates
We believe we have modeled in conservative assumptions for our estimates.
Accordingly, FY11-14E CAGR for both monolithic and overseas composites revenue
works out to 2%. Further, over the period, we have assumed margin contraction of
150bp in monolithic and 170bp in overseas composites.
Deterioration in working capital, FCCB redemption, balance sheet qualityIn YTDFY12, Sintex's working capital situation has deteriorated to 120+ days v/s 102
days as on March 2011. This is mainly due to (1) Rising share of working capital intensive
monolithic revenue, and (2) Delayed payments by state governments. This has caused
reversal of debt-equity correction - rising from 0.62x in March 2011 to 0.66x in
September 2011. This situation coupled with FCCB redemption (USD290m) overhang
and firm interest rates may pose risk to our estimates and target prices.
Mitigant: Management focus on cash conservation
The management has stated its current focus is on working capital management and
cash conservation through (1) selective execution in monolithic projects, (2) improving
collection efficiencies, and (3) lowering capex plan from INR10b over FY12-14. In fact,
our estimates suggest Sintex will start generating meaningful positive FCF of INR8b
over FY12-14. This should help Sintex in redeeming its FCCBs with low recourse to re-
financing (e.g. management targets ECB of USD100-110m).
Concerns on Sintex group power ventureMarkets have been concerned about the Sintex group power venture at two levels.
First, that Sintex itself would invest in the project. This was categorically denied by
the management, which said that the promoters of Sintex were putting up the project
under Shirpur Power Company, where Sintex would not even invest. Once this was
clarified, the second concern was that of conflict of interest i.e. Shirpur Power place
non-remunerative EPC orders with Sintex Infra, 100% subsidiary of Sintex.
Mitigant: Sintex Infra not to compromise on margins
The management clarified that Sintex Infra will execute the INR6b order through its
associate company Durha with expected margin of 14-15%. Durha currently operates
at 18-19% margin (power vertical margin of 15-16%), and hence confident of managing
14-15% margin in the Shirpur Power order as well. Even going forward, Sintex Infra
will only consider taking power orders if margins sustain at this guided level. We
believe management's assurance on future dealing mechanism with the power
venture and expected margin reasonably mitigate the concern.

Sintex Industries
27 January 2012 21
Financials and Valuation
Income Statement (INR Million)
Y/E March 2009 2010 2011 2012E 2013E 2014E
Operating income 31,358 33,192 44,837 46,303 49,041 54,444
Change (%) 37.0 5.8 35.1 3.3 5.9 11.0
EBITDA 5,219 5,380 8,155 7,652 7,925 9,017
EBITDA Margin (%) 16.6 16.2 18.2 16.5 16.2 16.6
Change (%) 31.1 3.1 51.6 -6.2 3.6 13.8
Depreciation 1,144 1,445 1,491 1,711 1,897 2,029
EBIT 4,075 3,936 6,664 5,941 6,028 6,988
Interest 820 731 1,089 1,448 1,420 1,486
Other income 650 392 327 532 367 372
Extraordinary items 194 486 190 -423 -308 0
PBT 4,100 4,083 6,092 4,602 4,667 5,874
Tax 826 772 1,508 1,256 1,143 1,439
Tax / PBT (%) 20.2 18.9 24.8 25.0 24.5 24.5
PAT before MI 3,274 3,311 4,584 3,346 3,523 4,435
PAT margin (%) 10.7 10.1 10.2 7.2 7.2 8.1
Change (%) 41.0 1.2 38.4 -27.0 5.3 25.9
MI + Share of profit/loss 23 21 -16 30 30 30
Consolidated PAT 3,251 3,290 4,600 3,316 3,493 4,405
Adj. Con. PAT 3,096 2,896 4,457 3,739 3,801 4,405
Change (%) 45.6 -6.5 53.9 -16.1 1.7 15.9
Balance Sheet (INR Million)
Y/E March 2009 2010 2011 2012E 2013E 2014E
Equity share capital 271 271 271 271 271 271
Reserves 16,778 19,198 23,745 26,839 30,111 34,295
Net Worth 17,049 19,469 24,016 27,110 30,383 34,566
Minority Interest 263 190 0 30 60 90
Total Debt 22,964 26,303 27,738 30,209 24,868 25,439
Net deferred tax 1,420 1,693 2,057 2,062 2,062 2,062
Capital employed 41,696 47,655 53,811 59,412 57,373 62,157
Gross fixed assets 23,788 25,581 33,276 37,999 39,609 41,512
Less: Acc. Depn. 6,366 7,746 9,156 10,867 12,764 14,793
Net fixed assets 17,422 17,834 24,120 27,132 26,845 26,719
Goodwil l 2,198 2,665 2,190 2,190 2,190 2,190
Capital WIP 2,377 1,716 1,363 0 0 0
Investments 1,819 2,470 3,775 3,398 3,398 3,398
Curr. assets 27,226 30,983 33,007 37,605 36,325 42,062
Inventory 3,771 3,411 3,770 4,978 5,988 5,621
Debtors 8,094 10,121 14,229 16,238 18,004 18,943
Cash & Bank 11,685 9,295 9,861 10,554 5,749 10,786
Loans, Adv. & Others 3,676 8,157 5,147 5,835 6,584 6,712
Current liab. & prov. 9,348 8,015 10,644 10,913 11,385 12,212
Creditors 5,147 4,029 6,522 7,413 7,885 8,712
Other Liabilities 518 479 497 0 0 0
Provisions 3,683 3,507 3,625 3,500 3,500 3,500
Net current assets 17,878 22,969 22,362 26,692 24,940 29,850
Misc. exp. 2 0 0 0 0 0
Total Assets 41,696 47,655 53,811 59,412 57,373 62,157
E: MOSL Estimates

Sintex Industries
27 January 2012 22
Financials and Valuation
Ratios
Y/E March 2009 2010 2011 2012E 2013E 2014E
Basic (INR)
EPS 11.4 10.7 16.4 13.8 14.0 16.2
Growth (%) 45.6 -6.5 53.8 -16.1 1.7 15.9
Cash EPS 16.2 17.4 22.5 18.5 19.8 23.7
Book value 62.9 71.8 88.6 100.0 112.1 127.5
Divd. Per Share 0.6 0.6 0.7 0.7 0.7 0.7
Payout incl. Div. Tax (%) 5.4 5.8 4.5 6.7 6.3 5.0
Valuation (x)
P/E 4.8 5.7 5.6 4.9
Cash P/E 3.5 4.3 4.0 3.3
Price/Book value 0.9 0.8 0.7 0.6
EV/Sales 0.8 0.8 0.8 0.6
EV/EBITDA 4.4 4.9 4.7 3.6
Dividend yield (%) 0.8 0.9 0.9 0.9
Profitability ratios (%)
Average RoE 19.1 15.9 20.5 14.6 13.2 13.6
Average RoCE 12.6 10.0 14.3 11.9 11.4 12.8
Turnover ratios
Debtors (days sales) 94 111 116 128 134 127
Inventory (days sales) 44 38 31 39 45 38
Creditor (days total exp) 79 59 70 70 70 70
Asset turnover (x) 0.8 0.7 0.9 0.8 0.9 0.9
Leverage ratio
Debt/Equity (x) 0.6 0.8 0.6 0.6 0.5 0.3
Cash Flow Statement (INR Million)
Y/E March 2009 2010 2011 2012E 2013E 2014E
PBT before EO items 3,883 3,576 5,918 4,995 4,944 5,844
Add: Depn. & Amort. 1,153 1,446 1,491 1,711 1,897 2,029
Interest 820 731 1,089 1,448 1,420 1,486
Less: Direct taxes 826 772 1,508 1,256 1,143 1,439
(Inc)/Dec in WC -3,664 -7,480 1,172 -3,637 -3,052 126
CF from operations 1,366 -2,499 8,162 3,261 4,066 8,046
CF from opn. incl. EO 1,560 -2,013 8,352 2,838 3,758 8,046
(Inc)/Dec in FA -6,719 -1,663 -6,948 -3,360 -1,610 -1,903
(Pur)/Sale of invts. 1,433 -651 -1,305 378 0 0
CF from invt. activity -5,286 -2,315 -8,253 -2,982 -1,610 -1,903
FCF -3,726 -4,327 99 -145 2,148 6,143
Inc/(Dec) in Net Worth -1,417 -680 153 0 0 0
Inc/(Dec) in Debt 3,702 3,339 1,434 2,471 -5,342 571
Inc/(Dec) in Minority Int. 60 -74 -190 30 30 30
Inc/(Dec) in deferred tax liab. 350 274 364 5 0 0
Less: Interest paid 820 731 1,089 1,448 1,420 1,486
Divd & Divd Tax 177 191 206 221 221 221
CF from fin. activity 1,699 1,938 467 837 -6,953 -1,106
Inc/Dec in cash -2,028 -2,390 566 693 -4,805 5,037
Add: Beginning balance 13,713 11,685 9,295 9,861 10,554 5,749
Closing balance 11,685 9,295 9,861 10,554 5,749 10,786
E: MOSL Estimates

Sintex Industries
27 January 2012 23
N O T E S

DisclosuresThis report is for personal information of the authorized recipient and does not construe to be any investment, legal or taxation advice to you. This research report does not constitute an offer, invitation or inducementto invest in securities or other investments and Motilal Oswal Securities Limited (hereinafter referred as MOSt) is not soliciting any action based upon it. This report is not for public distribution and has beenfurnished to you solely for your information and should not be reproduced or redistributed to any other person in any form.
Unauthorized disclosure, use, dissemination or copying (either whole or partial) of this information, is prohibited. The person accessing this information specifically agrees to exempt MOSt or any of its affiliates
or employees from, any and all responsibility/liability arising from such misuse and agrees not to hold MOSt or any of its affiliates or employees responsible for any such misuse and further agrees to hold MOStor any of its affiliates or employees free and harmless from all losses, costs, damages, expenses that may be suffered by the person accessing this information due to any errors and delays.
The information contained herein is based on publicly available data or other sources believed to be reliable. While we would endeavour to update the information herein on reasonable basis, MOSt and/or itsaffiliates are under no obligation to update the information. Also there may be regulatory, compliance, or other reasons that may prevent MOSt and/or its affiliates from doing so. MOSt or any of its affiliates or
employees shall not be in any way responsible and liable for any loss or damage that may arise to any person from any inadvertent error in the information contained in this report . MOSt or any of its affiliatesor employees do not provide, at any time, any express or implied warranty of any kind, regarding any matter pertaining to this report, including without limitation the implied warranties of merchantability, fitnessfor a particular purpose, and non-infringement. The recipients of this report should rely on their own investigations.
This report is intended for distribution to institutional investors. Recipients who are not institutional investors should seek advice of their independent financial advisor prior to taking any investment decision
based on this report or for any necessary explanation of its contents.
MOSt and/or its affiliates and/or employees may have interests/positions, financial or otherwise in the securities mentioned in this report. To enhance transparency, MOSt has incorporated a Disclosure of InterestStatement in this document. This should, however, not be treated as endorsement of the views expressed in the report.
Disclosure of Interest Statement Sintex1. Analyst ownership of the stock No2. Group/Directors ownership of the stock Yes3. Broking relationship with company covered No4. Investment Banking relationship with company covered No
Analyst CertificationThe views expressed in this research report accurately reflect the personal views of the analyst(s) about the subject securities or issues, and no part of the compensation of the research analyst(s) was, is, orwill be directly or indirectly related to the specific recommendations and views expressed by research analyst(s) in this report. The research analysts, strategists, or research associates principally responsiblefor preparation of MOSt research receive compensation based upon various factors, including quality of research, investor client feedback, stock picking, competitive factors and firm revenues.
Regional Disclosures (outside India)This report is not directed or intended for distribution to or use by any person or entity resident in a state, country or any jurisdiction, where such distribution, publication, availability or use would be contrary tolaw, regulation or which would subject MOSt & its group companies to registration or licensing requirements within such jurisdictions.
For U.K.This report is intended for distribution only to persons having professional experience in matters relating to investments as described in Article 19 of the Financial Services and Markets Act 2000 (Financial
Promotion) Order 2005 (referred to as "investment professionals"). This document must not be acted on or relied on by persons who are not investment professionals. Any investment or investment activity towhich this document relates is only available to investment professionals and will be engaged in only with such persons.
For U.S.MOSt is not a registered broker-dealer in the United States (U.S.) and, therefore, is not subject to U.S. rules. In reliance on the exemption from registration provided by Rule 15a-6 of the U.S. Securities Exchange
Act of 1934, as amended (the "Exchange Act") and interpretations thereof by the U.S. Securities and Exchange Commission ("SEC") in order to conduct business with Institutional Investors based in the U.S.,Motilal Oswal has entered into a chaperoning agreement with a U.S. registered broker-dealer, Marco Polo Securities Inc. ("Marco Polo").
This report is intended for distribution only to "Major Institutional Investors" as defined by Rule 15a-6(b)(4) of the Exchange Act and interpretations thereof by SEC (henceforth referred to as "major institutionalinvestors"). This document must not be acted on or relied on by persons who are not major institutional investors. Any investment or investment activity to which this document relates is only available to major
institutional investors and will be engaged in only with major institutional investors.
The Research Analysts contributing to the report may not be registered /qualified as research analyst with FINRA. Such research analyst may not be associated persons of the U.S. registered broker-dealer, MarcoPolo and therefore, may not be subject to NASD rule 2711 and NYSE Rule 472 restrictions on communication with a subject company, public appearances and trading securities held by a research analyst account.
Motilal Oswal Securities Ltd3rd Floor, Hoechst House, Nariman Point, Mumbai 400 021
Phone: (91-22) 39825500 Fax: (91-22) 22885038. E-mail: [email protected]