
Single-site sonoporation disrupts actin cytoskeleton...
11
rsif.royalsocietypublishing.org Research Cite this article: Chen X, Leow RS, Hu Y, Wan JMF, Yu ACH. 2014 Single-site sonoporation disrupts actin cytoskeleton organization. J. R. Soc. Interface 11: 20140071. http://dx.doi.org/10.1098/rsif.2014.0071 Received: 21 January 2014 Accepted: 28 February 2014 Subject Areas: biomedical engineering, biophysics Keywords: single-site sonoporation, actin cytoskeleton, F-actin disassembly, G-actin accumulation, structure tensor analysis, characteristic time Author for correspondence: Alfred C. H. Yu e-mail: [email protected] Electronic supplementary material is available at http://dx.doi.org/10.1098/rsif.2014.0071 or via http://rsif.royalsocietypublishing.org. Single-site sonoporation disrupts actin cytoskeleton organization Xian Chen 1 , Ruen Shan Leow 1 , Yaxin Hu 1 , Jennifer M. F. Wan 2 and Alfred C. H. Yu 1 1 Medical Engineering Program, and 2 School of Biological Sciences, The University of Hong Kong, Pokfulam, Hong Kong Sonoporation is based upon an ultrasound–microbubble cavitation routine that physically punctures the plasma membrane on a transient basis. During such a process, the actin cytoskeleton may be disrupted in tandem because this network of subcellular filaments is physically interconnected with the plasma membrane. Here, by performing confocal fluorescence imag- ing of single-site sonoporation episodes induced by ultrasound-triggered collapse of a single targeted microbubble, we directly observed immediate rupturing of filamentary actin (F-actin) at the sonoporation site (cell type: ZR-75-30; ultrasound frequency: 1 MHz; peak negative pressure: 0.45 MPa; pulse duration: 30 cycles; bubble diameter: 2–4 mm). Also, through conduct- ing a structure tensor analysis, we observed further disassembly of the F-actin network over the next 60 min after the onset of sonoporation. The extent of F-actin disruption was found to be more substantial in cells with higher uptake of sonoporation tracer. Commensurate with this process, cytoplasmic accumulation of globular actin (G-actin) was evident in sonoporated cells, and in turn the G-actin : F-actin ratio was increased in a trend similar to drug- induced (cytochalasin D) actin depolymerization. These results demonstrate that sonoporation is not solely a membrane-level phenomenon: organization of the actin cytoskeleton is concomitantly perturbed. 1. Introduction As the physical interface of mammalian cells, the plasma membrane effectively serves as a dynamic barrier that maintains cellular homoeostasis through active regulation of transmembranous transport. Pulsed disruption of membrane integrity would intrinsically give rise to a temporary permeability increase that favours enhanced passage of substances into and out of the cell [1]. Such an over-arching principle has been the norm for the design of physically oriented drug/gene delivery paradigms [2,3]. Among various physical perfor- ation approaches, sonoporation has been well considered as an emerging method in view of its strong potential in achieving high spatio-temporal specificity [4–6]. It is now established that this perforation strategy, which is founded upon acoustic cavitation principles [7,8], can readily enhance trans- membranous transport [9]. Also, it has been demonstrated that sonoporation can be controllably instigated through the use of an ultrasound–microbubble- mediated routine in which synthetic microbubbles are leveraged as cavitation sources nearby cells, while pulsed ultrasound is used to initiate acoustic cavitation [10,11]. Although sonoporation has shown significant potential as a controllable way of transiently breaching plasma membrane integrity, its crude impact on cellular structure has remained relatively unexplored in a biophysical con- text [12]. Often, membrane puncturing is considered as the sole impact of sonoporation on living cells; as long as post-sonoporation cellular viability is retained, the perforation process is considered to be sustainable [13–16]. This way of conceiving the cytostructural impact of sonoporation is perhaps over- simplified because post hoc changes in cellular morphology have in fact been observed downstream from the onset of sonoporation [17,18]; also, physical & 2014 The Author(s) Published by the Royal Society. All rights reserved. on May 13, 2018 http://rsif.royalsocietypublishing.org/ Downloaded from
Transcript of Single-site sonoporation disrupts actin cytoskeleton...

on May 13, 2018http://rsif.royalsocietypublishing.org/Downloaded from
rsif.royalsocietypublishing.org
ResearchCite this article: Chen X, Leow RS, Hu Y, Wan
JMF, Yu ACH. 2014 Single-site sonoporation
disrupts actin cytoskeleton organization.
J. R. Soc. Interface 11: 20140071.
http://dx.doi.org/10.1098/rsif.2014.0071
Received: 21 January 2014
Accepted: 28 February 2014
Subject Areas:biomedical engineering, biophysics
Keywords:single-site sonoporation, actin cytoskeleton,
F-actin disassembly, G-actin accumulation,
structure tensor analysis, characteristic time
Author for correspondence:Alfred C. H. Yu
e-mail: [email protected]
Electronic supplementary material is available
at http://dx.doi.org/10.1098/rsif.2014.0071 or
via http://rsif.royalsocietypublishing.org.
& 2014 The Author(s) Published by the Royal Society. All rights reserved.
Single-site sonoporation disrupts actincytoskeleton organization
Xian Chen1, Ruen Shan Leow1, Yaxin Hu1, Jennifer M. F. Wan2
and Alfred C. H. Yu1
1Medical Engineering Program, and 2School of Biological Sciences, The University of Hong Kong,Pokfulam, Hong Kong
Sonoporation is based upon an ultrasound–microbubble cavitation routine
that physically punctures the plasma membrane on a transient basis.
During such a process, the actin cytoskeleton may be disrupted in tandem
because this network of subcellular filaments is physically interconnected
with the plasma membrane. Here, by performing confocal fluorescence imag-
ing of single-site sonoporation episodes induced by ultrasound-triggered
collapse of a single targeted microbubble, we directly observed immediate
rupturing of filamentary actin (F-actin) at the sonoporation site (cell type:
ZR-75-30; ultrasound frequency: 1 MHz; peak negative pressure: 0.45 MPa;
pulse duration: 30 cycles; bubble diameter: 2–4 mm). Also, through conduct-
ing a structure tensor analysis, we observed further disassembly of the F-actin
network over the next 60 min after the onset of sonoporation. The extent of
F-actin disruption was found to be more substantial in cells with higher
uptake of sonoporation tracer. Commensurate with this process, cytoplasmic
accumulation of globular actin (G-actin) was evident in sonoporated cells, and
in turn the G-actin : F-actin ratio was increased in a trend similar to drug-
induced (cytochalasin D) actin depolymerization. These results demonstrate
that sonoporation is not solely a membrane-level phenomenon: organization
of the actin cytoskeleton is concomitantly perturbed.
1. IntroductionAs the physical interface of mammalian cells, the plasma membrane effectively
serves as a dynamic barrier that maintains cellular homoeostasis through active
regulation of transmembranous transport. Pulsed disruption of membrane
integrity would intrinsically give rise to a temporary permeability increase
that favours enhanced passage of substances into and out of the cell [1]. Such
an over-arching principle has been the norm for the design of physically
oriented drug/gene delivery paradigms [2,3]. Among various physical perfor-
ation approaches, sonoporation has been well considered as an emerging
method in view of its strong potential in achieving high spatio-temporal
specificity [4–6]. It is now established that this perforation strategy, which is
founded upon acoustic cavitation principles [7,8], can readily enhance trans-
membranous transport [9]. Also, it has been demonstrated that sonoporation
can be controllably instigated through the use of an ultrasound–microbubble-
mediated routine in which synthetic microbubbles are leveraged as cavitation
sources nearby cells, while pulsed ultrasound is used to initiate acoustic
cavitation [10,11].
Although sonoporation has shown significant potential as a controllable
way of transiently breaching plasma membrane integrity, its crude impact on
cellular structure has remained relatively unexplored in a biophysical con-
text [12]. Often, membrane puncturing is considered as the sole impact of
sonoporation on living cells; as long as post-sonoporation cellular viability is
retained, the perforation process is considered to be sustainable [13–16]. This
way of conceiving the cytostructural impact of sonoporation is perhaps over-
simplified because post hoc changes in cellular morphology have in fact been
observed downstream from the onset of sonoporation [17,18]; also, physical
transducer
broadbandamplifier
waveformgenerator
waveguide
condenser2 mm
5 mm
0.13 mmglass coverslip
observationdeck
innerframe
outerframe
55 mm
24 mm18 mm
40 mm
1 mm
acousticabsorber
cell chamber
40.0°
stage
attachedcell
camera
40×objectivetargeted
microbubble
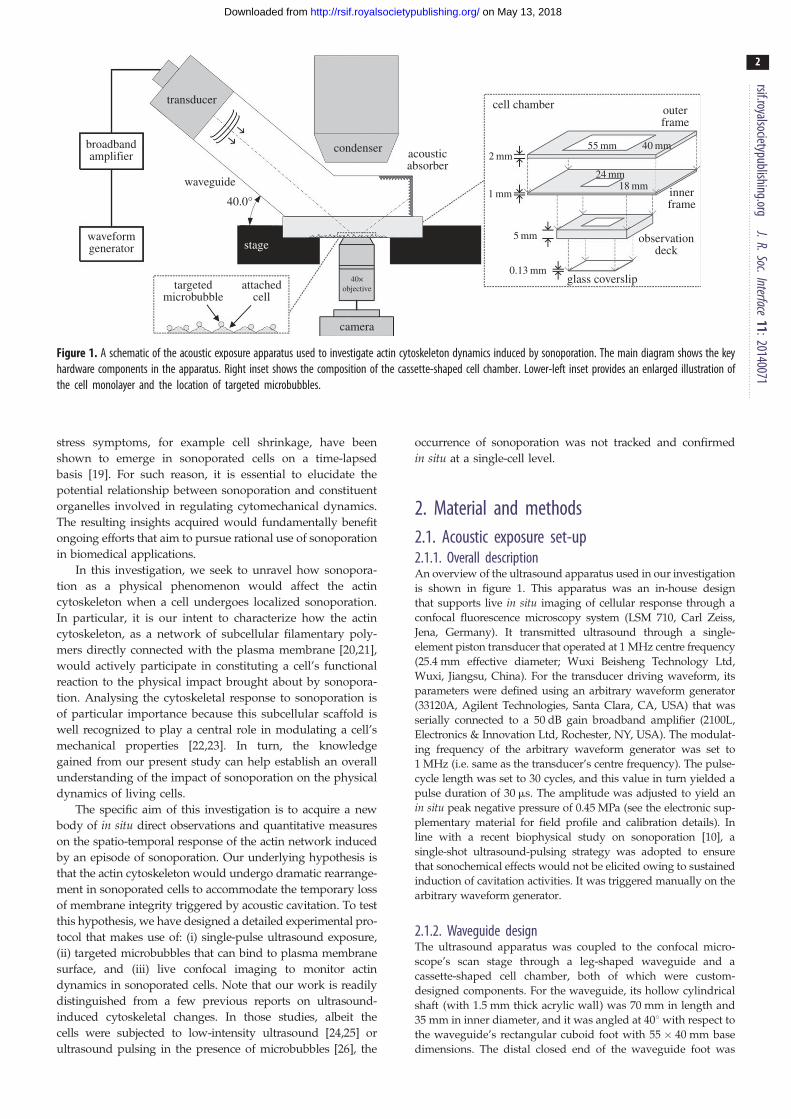
Figure 1. A schematic of the acoustic exposure apparatus used to investigate actin cytoskeleton dynamics induced by sonoporation. The main diagram shows the keyhardware components in the apparatus. Right inset shows the composition of the cassette-shaped cell chamber. Lower-left inset provides an enlarged illustration ofthe cell monolayer and the location of targeted microbubbles.
rsif.royalsocietypublishing.orgJ.R.Soc.Interface
11:20140071
2
on May 13, 2018http://rsif.royalsocietypublishing.org/Downloaded from
stress symptoms, for example cell shrinkage, have been
shown to emerge in sonoporated cells on a time-lapsed
basis [19]. For such reason, it is essential to elucidate the
potential relationship between sonoporation and constituent
organelles involved in regulating cytomechanical dynamics.
The resulting insights acquired would fundamentally benefit
ongoing efforts that aim to pursue rational use of sonoporation
in biomedical applications.
In this investigation, we seek to unravel how sonopora-
tion as a physical phenomenon would affect the actin
cytoskeleton when a cell undergoes localized sonoporation.
In particular, it is our intent to characterize how the actin
cytoskeleton, as a network of subcellular filamentary poly-
mers directly connected with the plasma membrane [20,21],
would actively participate in constituting a cell’s functional
reaction to the physical impact brought about by sonopora-
tion. Analysing the cytoskeletal response to sonoporation is
of particular importance because this subcellular scaffold is
well recognized to play a central role in modulating a cell’s
mechanical properties [22,23]. In turn, the knowledge
gained from our present study can help establish an overall
understanding of the impact of sonoporation on the physical
dynamics of living cells.
The specific aim of this investigation is to acquire a new
body of in situ direct observations and quantitative measures
on the spatio-temporal response of the actin network induced
by an episode of sonoporation. Our underlying hypothesis is
that the actin cytoskeleton would undergo dramatic rearrange-
ment in sonoporated cells to accommodate the temporary loss
of membrane integrity triggered by acoustic cavitation. To test
this hypothesis, we have designed a detailed experimental pro-
tocol that makes use of: (i) single-pulse ultrasound exposure,
(ii) targeted microbubbles that can bind to plasma membrane
surface, and (iii) live confocal imaging to monitor actin
dynamics in sonoporated cells. Note that our work is readily
distinguished from a few previous reports on ultrasound-
induced cytoskeletal changes. In those studies, albeit the
cells were subjected to low-intensity ultrasound [24,25] or
ultrasound pulsing in the presence of microbubbles [26], the
occurrence of sonoporation was not tracked and confirmed
in situ at a single-cell level.
2. Material and methods2.1. Acoustic exposure set-up2.1.1. Overall descriptionAn overview of the ultrasound apparatus used in our investigation
is shown in figure 1. This apparatus was an in-house design
that supports live in situ imaging of cellular response through a
confocal fluorescence microscopy system (LSM 710, Carl Zeiss,
Jena, Germany). It transmitted ultrasound through a single-
element piston transducer that operated at 1 MHz centre frequency
(25.4 mm effective diameter; Wuxi Beisheng Technology Ltd,
Wuxi, Jiangsu, China). For the transducer driving waveform, its
parameters were defined using an arbitrary waveform generator
(33120A, Agilent Technologies, Santa Clara, CA, USA) that was
serially connected to a 50 dB gain broadband amplifier (2100L,
Electronics & Innovation Ltd, Rochester, NY, USA). The modulat-
ing frequency of the arbitrary waveform generator was set to
1 MHz (i.e. same as the transducer’s centre frequency). The pulse-
cycle length was set to 30 cycles, and this value in turn yielded a
pulse duration of 30 ms. The amplitude was adjusted to yield an
in situ peak negative pressure of 0.45 MPa (see the electronic sup-
plementary material for field profile and calibration details). In
line with a recent biophysical study on sonoporation [10], a
single-shot ultrasound-pulsing strategy was adopted to ensure
that sonochemical effects would not be elicited owing to sustained
induction of cavitation activities. It was triggered manually on the
arbitrary waveform generator.
2.1.2. Waveguide designThe ultrasound apparatus was coupled to the confocal micro-
scope’s scan stage through a leg-shaped waveguide and a
cassette-shaped cell chamber, both of which were custom-
designed components. For the waveguide, its hollow cylindrical
shaft (with 1.5 mm thick acrylic wall) was 70 mm in length and
35 mm in inner diameter, and it was angled at 408 with respect to
the waveguide’s rectangular cuboid foot with 55 � 40 mm base
dimensions. The distal closed end of the waveguide foot was

rsif.royalsocietypublishing.orgJ.R.Soc.Interface
11:20140071
3
on May 13, 2018http://rsif.royalsocietypublishing.org/Downloaded from
padded with acoustic absorbing rubber, while the basal surface
was carved out and was replaced with a 0.13 mm thick glass cov-
erslip to improve acoustic field transmission into the cell
chamber. During operation, the cavity of the waveguide was
filled with deionized water, and the transducer was mounted
onto the upper end of the shaft (a rubber toric joint was used
to seal the spacing between the transducer and the shaft wall).
2.1.3. Cell chamber designThe cell chamber was of a cassette structure whose size was
carefully defined based on the physical dimensions of the wave-
guide’s cuboid foot and the confocal microscope’s stage-top 378Cincubation device (Chamlide TC; Live Cell Instrument, Seoul,
Korea). As shown in figure 1, this device consisted of three
acrylic layers: (i) a 2 mm thick outer frame with a 55 � 40 mm
window for coherent fitting with the waveguide’s foot, (ii) a
1 mm thick inner frame that served as a structural adapter, and
(iii) a 5 mm thick observation deck with an 24 � 18 mm
window and a 0.13 mm thick glass coverslip sealed onto the
bottom surface. In each experiment, the cell chamber was
mounted onto the microscope’s scan stage by simply slotting
the observation deck into the stage-top incubator that was posi-
tioned immediately above the objective lens. Cell samples were
seeded onto the basal coverslip of the observation deck (protocol
described in §2.2). To facilitate registration of their in situlocation, a numerated line grid with 1 � 1 mm box resolution
was impressed onto the bottom surface of the coverslip using
heat transfer printing principles. This grid allowed us to preci-
sely trace cells residing in different box coordinates by simply
adjusting the microscope’s scan stage position.
2.2. Cell sample preparations2.2.1. Cell line and culturing protocolIn line with our previous study [19], ZR-75-30 human breast car-
cinoma cells (CCL-1504; ATCC, Manassas, VA, USA) were used
for experimentation. They were grown in a culture flask inside
a 378C incubator environment with 5% carbon dioxide; cultur-
ing medium was based on Roswell Park Memorial Institute
1640 medium (R8758; Sigma-Aldrich, St Louis, MO, USA) with
10% fetal bovine serum supplements (30-2020; ATCC). The
cells were cultured to their exponential growth phase before
they were trypsinized and transferred to the cell chamber.
They were seeded onto the coverslip of the cell chamber at a
working density of 10 000 cells per slip. Subsequently, they
were fostered to reattach to the coverslip by filling the obser-
vation deck with fresh culture medium and placing the cell
chamber in the 378C incubator for 24 h.
Note that, as compared to normal cells, breast carcinoma cells
exhibit higher membrane deformability [27], and this cytomecha-
nical property is known to protect cells from physical injury and
favour recovery after a wounding event [28]. Such propensity
against membrane wounding represents a suitable baseline con-
dition for our investigation that involves pulsed disruption of
membrane integrity via sonoporation. Cancerous cells are also
known to express vascular endothelial growth factor (VEGF)
receptors on their membrane [29]. In our experiments, these recep-
tors are leveraged as binding sites for VEGF-receptor-targeted
microbubbles that are introduced as agents for site-specific
induction of sonoporation (methods described in §2.2.3).
2.2.2. Pre-exposure labelling of actinFor live microscopy experiments, pre-exposure labelling of the
actin cytoskeleton of the ZR-75-30 cells in the coverslip was car-
ried out with a commercial viral transfection stain. In particular,
2 ml of CellLight actin green fluorescent protein (actin-GFP)
(C10582, Invitrogen, Carlsbad, CA, USA; excitation/emission
maxima: 488/510 nm) was added to the observation deck, and
the transfection was allowed to take place in the dark for 24 h
inside the 378C incubator. Afterward, the observation deck was
washed with phosphate buffered saline (PBS).
2.2.3. Supplementation with targeted microbubblesTo facilitate induction of sonoporation on a site-specific basis, tar-
geted microbubbles with binding preference to VEGF receptors
were added to the observation deck of the cell chamber. These
lipid-shelled targeted microbubbles were 1–4 mm in diameter;
their fabrication procedure and cell-binding efficacy consider-
ations are described in the electronic supplementary material.
Before applying ultrasound exposure, 20 ml of targeted micro-
bubbles in mixture form (with 108 bubbles ml21 concentration)
was added to the cell chamber, and a 5 min idle period was
allocated to foster their attachment to the cell surface. Unbound
microbubbles were subsequently washed away using PBS, and
the cell chamber was refilled with fresh culturing medium.
2.2.4. Addition of sonoporation tracerBefore ultrasound exposure was applied, the culturing medium
in the cell chamber was supplemented with a fluorescent tracer
to enable tracing of cells that experienced sonoporation. For
live imaging studies, propidium iodide (PI) (P4170, Sigma-
Aldrich; excitation/emission maxima: 493/630 nm) was used
as the tracer (applied at 100 mM concentration). It is well
known that PI is membrane impermeant and would only be
taken up by a cell if membrane permeability is increased, and
its intracellular fluorescence would become plateaued once mem-
brane permeability returns to homoeostatic level. Hence, it can be
suitably leveraged as an indicator for sonoporation that is
marked by a transitory increase in membrane permeability
[10,11]. For fixed-cell imaging studies, 2.5 mM Sytox-Orange
(S34861, Invitrogen; excitation/emission maxima: 547/570 nm)
was used in lieu of PI to avoid cross-talk with other fluorescent
labels. The cellular uptake kinetics of this alternative sonopora-
tion tracer is largely similar to PI. Indeed, both tracers would
exhibit significantly increased fluorescence upon binding with
nucleic acids inside the cell.
2.3. Live microscopy of sonoporation-induced actindynamics
2.3.1. Pre-exposure imagingBright-field images were acquired before ultrasound exposure to
locate cells and to determine the microbubble attachment pos-
ition on the cell surface. Also, three-dimensional scanning of
actin-GFP fluorescence was carried out over the entire cell.
Both imaging processes were performed using our platform’s
confocal microscope and a 40� oil-immersion lens (420461–
9910, Carl Zeiss; numerical aperture: 1.3; refractive index: 1.518;
working distance: 0.21 mm). The fluorescence of actin-GFP was
elicited using a laser wavelength of 488 nm, and a detection
band of 500–540 nm was used. Pinhole size and pixel dwell
time were set to 91 mm and 6.3 ms, respectively. The scan plane
was swept from the cell’s basal layer to the apical surface (the
sectional step size was set to 0.436 mm; top slice was at
3.05 mm from the base).
2.3.2. Monitoring of actin response after sonoporationFollowing initial scanning, a single-shot ultrasound pulse was
applied to trigger microbubble collapse (confirmed by bright-
field imaging). The resulting actin-GFP dynamics was monitored
live over the scan plane that was 1.744 mm from the cell base.
Note that, with a 91 mm pinhole size, the scan plane’s sectional
thickness was 3 mm as required to cover the entire cell height.

rsif.royalsocietypublishing.orgJ.R.Soc.Interface
11:20140071
4
on May 13, 2018http://rsif.royalsocietypublishing.org/Downloaded from
To trace sonoporated cells, PI fluorescence was elicited using
488 nm laser wavelength and 610–650 nm detection band.
Using these parameters, one frame was acquired every 10 s in
the first 3 min after ultrasound pulsing; after that, the frame
acquisition period was lengthened to 1 min per frame. The ima-
ging process lasted until 1 h following the onset of sonoporation,
after which a three-dimensional sweep was performed similar to
pre-exposure scanning.
2.3.3. Tensor analysis of actin structureTo quantify the extent of actin cytoskeleton changes in response to
sonoporation, structure tensor analysis was carried out on the
acquired actin fluorescence images. This technique has recently
emerged as a quantitative way of analysing the structure of
actin cytoskeleton [30]. In conducting the analysis, image frames
were transferred to the IMAGEJ software (v. 1.47n; National Insti-
tutes of Health, Bethesda, MD, USA) that was installed with a
structure tensor analysis plugin called OrientationJ. For each
image, the cell boundary was first marked. Subsequently, using
OrientationJ, a coherency index for each pixel position within
the cell was derived by calculating the local tensor orientation
with respect to its spatial neighbourhood. As described elsewhere
[31], coherency would approach unity for pixels with a dominant
orientation (e.g. those that belong to a filamentary structure), and
it would tend to zero for pixels without significant orientation. To
summatively characterize the tensor coherency distribution over
the entire cell, we defined a global measure called total weighted
coherency, and it was calculated by summing intracellular coher-
ency values which were not less than 90% of the intracellular
maximum (i.e. pixels with relatively low coherency were zero-
weighted). For each cell being analysed, this global measure was
calculated before exposure and at various post-sonoporation
time points (10 s, 1 min, 5 min, 60 min).
2.3.4. Temporal kinetics estimationWith the temporal estimates of total weighted coherency, an
exponential decay regression was performed using GRAPHPAD
(v. 5; GraphPad Software Inc., La Jolla, USA) to determine the
characteristic time for actin cytoskeleton changes to take place.
The rate of change was in turn derived. Similarly, a growth sat-
uration analysis was conducted on the intracellular PI level to
quantify the uptake kinetics of sonoporation. For this analysis,
intracellular PI fluorescence was measured as a function of
post-sonoporation time using IMAGEJ’s built-in functions, and
they were fitted onto the growth saturation model to estimate
the characteristic time and rate of PI influx.
The relationship between actin changes and PI influx was
evaluated in three ways. First, we compared the temporal evol-
ution of actin’s total weighted coherency between sonoporated
cells with mild and high PI uptake; the threshold between
these two categories was nominally defined as 10-fold increase
in PI fluorescence. Each cell subgroup comprised eight cells,
and in total 16 cells were analysed; inter-group differences
were statistically analysed using Student’s t-test. Second, the
characteristic time constants for total weighted coherency were
compared between the mild and high PI uptake groups. Third,
a Pearson correlation analysis was performed on the estimated
rates of change (total weighted coherency versus PI uptake).
2.4. Post-exposure microscopy of actin contents2.4.1. Initial procedureTo further analyse the distribution of actin contents in sonopo-
rated cells, a set of experiments was conducted via a post-
exposure fixed-cell staining approach. We particularly focused
on characterizing the post-exposure level of two physical forms
of actin [32]: (i) filamentary actin (F-actin; the polymeric form)
and (ii) globular actin (G-actin; the monomer form). For these
experiments, cell samples were prepared similar to what has
been described earlier except that pre-exposure actin-GFP label-
ling was not performed and Sytox-Orange was used as the
sonoporation tracer. After acquiring pre-exposure bright-field
images to register the in situ position of cells and microbubbles,
single-shot pulsed ultrasound was applied, and the cell chamber
was placed in the incubator for 1 h (i.e. the same timeframe
for live imaging). Non-internalized Sytox-Orange was then
washed away using PBS. For comparative analysis, a subset of
experiments was conducted under sham exposure conditions
(i.e. without ultrasound pulsing). Another subset of positive con-
trol experiments was also performed by chemically inducing
actin depolymerization through treating the cells with 100 nM
cytochalasin D (Cyto D) (C8273; Sigma-Aldrich) for 1 h in a
378C incubator environment.
2.4.2. Live – dead pre-staining and imagingTo distinguish between observations on the actin distribution of
viable sonoporated cells and those of non-viable ones, a live–
dead bicolour staining cocktail was added to the cell chamber.
In this work, the live and dead stains were, respectively,
5 mM Calcein-Blue-AM (C1429, Invitrogen; excitation/emission
maxima: 360/449 nm) and 5 nM Sytox-Red (S34859, Invitrogen;
excitation/emission maxima: 640/658 nm). The live–dead stain
was washed away 30 min later, and confocal images of cell viability
and sonoporation tracer were acquired using the following laser
excitation wavelengths and detection bands: (i) Calcein-Blue-
AM (live cells): 360/485–510 nm, (ii) Sytox-Red (dead cells):
633/645–670 nm, and (iii) Sytox-Orange (sonoporation tracer):
543/555–580 nm. Other scan parameters were the same as before.
2.4.3. Actin staining and imagingStaining of cellular F-actin and G-actin contents was carried out
after determining the post-exposure viability of individual sono-
porated cells. Cells were first fixed by washing the cell chamber
twice with PBS and then adding 4% paraformaldehyde for
15 min at room temperature. Note that, given the time required
to conduct live–dead staining (about 1 h including imaging),
the cell fixation time point corresponded to 2 h after sonopora-
tion; this time point was synchronized with our previous study
that showed fixed-cell images of repressive morphological fea-
tures in sonoporated cells [19]. To permanently permeabilize
the fixed cells, 0.1% Triton X-100 was added after three rounds
of PBS washing, and it was followed by another round of PBS
washing afterward. Subsequently, a PBS cocktail supplemented
with 1% bovine serum albumin (A7030, Sigma-Aldrich) was
added to reduce non-specific binding of actin stains.
F-actin and G-actin were, respectively, labelled using
0.165 mM fluorescein-isothiocyanate-conjugated phalloidin
(phalloidin-FITC) (P5282, Sigma-Aldrich; excitation/emission
maxima: 495/520 nm) and 0.3 mM Alexa Fluor 594 deoxyribonu-
clease I (DNase I) (D12372, Invitrogen; excitation/emission
maxima: 590/617 nm). Reaction was allowed to take place for
20 min. After that, the actin stains were washed away with PBS
and the cells were imaged by the confocal microscope. Laser
wavelengths of 488 and 543 nm were used, respectively, for phal-
loidin-FITC and DNase I, while the detection bands were set to
505–530 nm and 605–630 nm, respectively (other scan settings
remained constant as before).
2.4.4. Ratiometric analysis of actin contentsUsing IMAGEJ, the fluorescence levels of phalloidin-FITC and
DNase I were measured. Their ratio (G : F-actin ratio) was
then calculated to estimate the post-exposure balance between
F-actin and G-actin. Results were compared between viable
and non-viable sonoporated cells, sham control group and

microbubble(a)
(b)
(i)
(ii)
(ii)
(i)
pre-exposure
pre-exposure
2.5 mm
0 s
1 min
1 min
20 min 40 min 60 min
20 min10 min 40 min 60 min
10 s
10 mm
5 mm
20 s 30 s
0 s 10 s 20 s 30 s
Figure 2. Sonoporation induces progressive disorientation of actin cytoskeleton network over a 60 min period. (a) Each frame shows a live confocal fluorescenceimage of actin contents (green; actin-GFP) and sonoporation indicator (red; PI). Sonoporation was induced by the collapse of a 2.5 mm microbubble, whose positionis indicated in the pre-exposure frame. Rapid cytoplasmic filling of PI took place as indicated by the yellow arrow in the short-term frames (10 s, 20 s, 30 s, 1 min).Subsequently, as shown in the long-term frames (10 – 60 min), there was gradual reduction of actin fluorescence, and its appearance was increasingly disorganized.(b) Enlarged view of the dashed window marked in (a). Each new episode of filamentary actin loss, deduced with respect to the previous time point shown, ismarked by a yellow cross. These episodes took place on an acute basis immediately after sonoporation (see frames at 10, 20 and 30 s) and on a time-delayed basis(see frames at 40 and 60 min).
rsif.royalsocietypublishing.orgJ.R.Soc.Interface
11:20140071
5
on May 13, 2018http://rsif.royalsocietypublishing.org/Downloaded from
positive control group (N ¼ 50 in each group). The significance of
trends was statistically confirmed via an analysis of variance test.
3. Results3.1. Actin network disassembly owing to single-
microbubble-mediated sonoporationDisruption of the actin cytoskeleton was generally observed
upon the onset of microbubble-mediated sonoporation at a
single site. Figure 2a shows a time-series rendering of this
observation based on live confocal images acquired from
our platform (green and red fluorescence, respectively,
depict actin contents and PI which serves as sonoporation
tracer). As can be observed, prior to exposure, one targeted
microbubble was attached to the cell membrane (indicated
by bright-field greyscale contrast), and the actin cytoskeleton
resembled an apparent network structure with significant
presence of filamentary fibres. Upon single-shot ultrasound
pulsing, the microbubble had collapsed, and it in turn induced
membrane perforation as indicated by rapid, localized PI
influx into the intracellular space through the pre-exposure
microbubble site. Note that PI had filled the entire nucleus
within 1 min.
Synchronous with the physical action of sonoporation, an
immediate rupture of F-actin fibres can be observed at the
position corresponding to the microbubble’s pre-collapse
location. This finding is highlighted in figure 2b that gives
an enlarged rendering of the temporal dynamics at the sono-
poration site (field of view corresponds to the dashed
window demarcated in figure 2a; only actin fluorescence is
depicted here). As illustrated, within the first 10 s after sono-
poration, rapid disappearance of F-actin fibres (with high
green fluorescence) was evident in the vicinity of the sono-
poration site (these events were marked in situ by yellow
crosses). Indeed, this local loss of F-actin fibres subsequently
propagated to other parts of the actin cytoskeleton. As shown

pre-exposure 10 s
10 mm
(a) (b)
0tensor coherency
0.5 1.0
1 min
post-sonoporation time
60 min
Figure 3. Tensor coherency maps of local actin structure for the sonoporated cell shown in figure 2 (cell boundary indicated by dashed line). Comparing to the pre-exposure form (a), post-sonoporation actin structure exhibited progressive loss of tensor coherency (b) for 10 s, 1 min, and 60 min after sonoporation. For pixels withcoherency values near unity (blue – magenta colour codes), their actin structure exhibits a dominant orientation; pixels without significant actin structure orientationhave coherency values near zero (red – yellow colour codes).
rsif.royalsocietypublishing.orgJ.R.Soc.Interface
11:20140071
6
on May 13, 2018http://rsif.royalsocietypublishing.org/Downloaded from
in the other short-term image frames (20 s, 30 s, 1 min),
F-actin fibres in the outskirts of this cell had largely vanished
within 1 min after the onset of sonoporation. As a result,
there was a significantly different appearance in the actin
cytoskeleton morphology before exposure and at 1 min
after sonoporation.
In addition to the initial F-actin rupturing in response to
sonoporation, further disassembly of the actin cytoskeleton
was apparent over a 60 min timeframe. As depicted in
figure 2b(ii), the F-actin fibres that remained visible at
10 min after sonoporation (distal from the perforation site)
were progressively disintegrated in the next 50 min. Conse-
quently, at 60 min after sonoporation, the actin contents
simply exhibited a granular texture without directional orien-
tation. It should be emphasized that such observation
occurred on a whole-cell level and was not localized at the
perforation site. According to images in figure 2a(ii), the
actin cytoskeleton’s network-like structure had essentially
faded away by this time.
3.2. Structure tensor coherency of actin network:progressively decreased in sonoporated cells
As a quantitative insight into the actin structure disassembly
induced by sonoporation, figure 3 plots, for the sonoporated
cell shown in figure 2, a temporal set of coherency maps
derived from structure tensor analysis of actin fluorescence.
Note that coherency was defined in this context as a normal-
ized measure of whether a dominant directional orientation
was exhibited at a certain part of the actin cytoskeleton. It
can be observed that, before exposure, the cell had distinct
bands of high tensor coherency values (blue–magenta
colour codes) as indicative of the presence of F-actin cables
at those positions. This organized pattern was progressively
lost owing to sonoporation. Within 60 min after the
onset of sonoporation, the tensor coherency became low
(red–yellow colour codes) over the entire cell.
Upon analysing different cells with a single sonoporation
site, a more substantial impact on actin disruption can be
observed in those with stronger intracellular fluorescence of
PI that served as sonoporation tracer. Evidence of this obser-
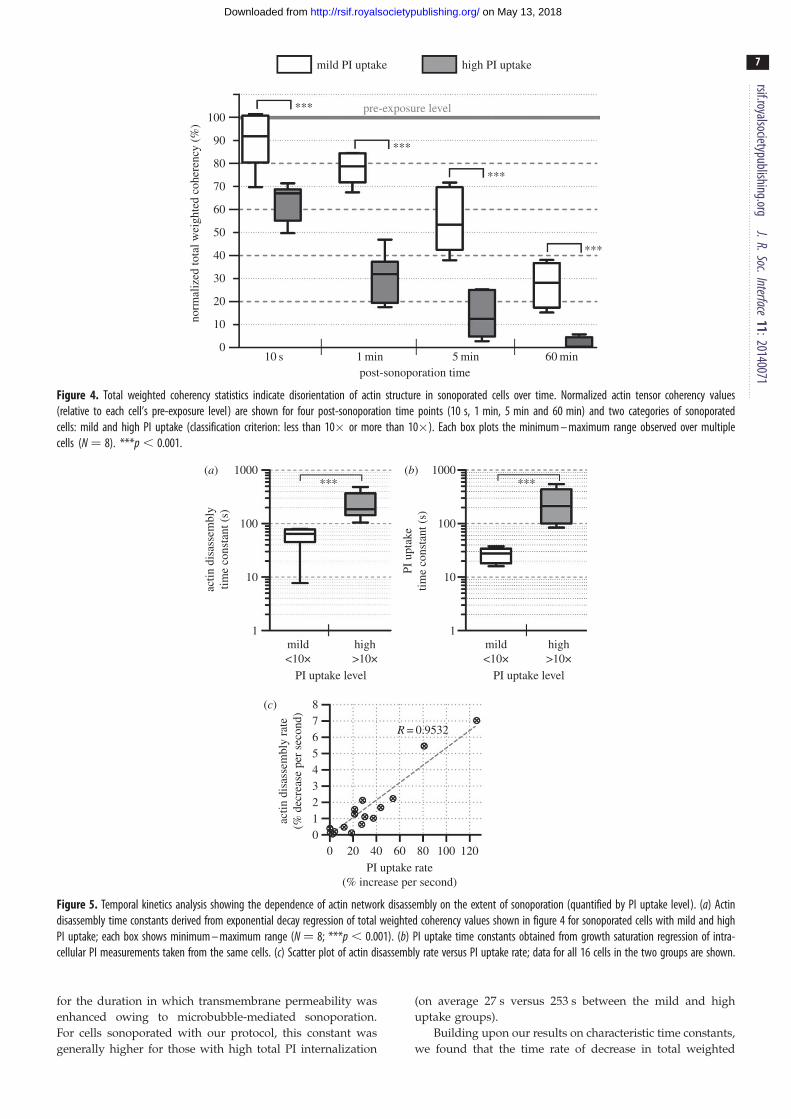
vation is shown in figure 4 that plots a set of box–whisker
plots of the total weighted coherency of actin fluorescence
at four different post-sonoporation time points: 10 s, 1 min,
5 min and 60 min. Results are shown for two equally sized
cell subgroups (N ¼ 8) that, respectively, comprised cells
with less than or more than 10-fold increase in total PI
fluorescence (referred to as mild and high uptake groups
accordingly). As can be noted, 10 s after sonoporation, a
decrease in total weighted coherency can already be observed
(on average about 10% and 40%, respectively, for the mild
and high uptake groups). In addition, cells in the high PI
uptake group exhibited a more dramatic reduction in total
weighted coherency. As time elapsed, sonoporated cells
with high PI uptake showed on average 95% reduction in
total weighted coherency, indicating that the actin cytoskele-
tons of these cells were almost completely disassembled from
their fibrous network form.
3.3. Actin network disassembly time: correlated withpropidium iodide uptake level
By fitting the temporal decrease of total weighted coherency
onto an exponential decay model, we observed that the charac-
teristic time of actin cytoskeleton disassembly was different for
sonoporated cells with mild and high PI uptake. Supporting
data for this observation are shown in figure 5a. As can be
observed, for cells with mild PI uptake, their actin disassembly
time constants were generally of the order of tens of seconds.
These estimated values were significantly shorter than those
deduced for sonoporated cells with high PI uptake, of which
the duration was generally over 100 s.
As an adjunct observation of the above trend, the charac-
teristic time constants of PI uptake were also found to be
statistically different between the mild and high PI internaliz-
ation cell groups. The corresponding statistical results are
summarized in the box–whisker plots shown in figure 5b.
Note that the PI uptake time constant represents an indicator
100***
mild PI uptake high PI uptake
***
pre-exposure level
***
***
90
80
70
60
50
40
30
20
10
010 s 1 min
post-sonoporation time
norm
aliz
ed to
tal w
eigh
ted
cohe
renc
y (%
)
5 min 60 min
Figure 4. Total weighted coherency statistics indicate disorientation of actin structure in sonoporated cells over time. Normalized actin tensor coherency values(relative to each cell’s pre-exposure level) are shown for four post-sonoporation time points (10 s, 1 min, 5 min and 60 min) and two categories of sonoporatedcells: mild and high PI uptake (classification criterion: less than 10� or more than 10�). Each box plots the minimum – maximum range observed over multiplecells (N ¼ 8). ***p , 0.001.
1000*** ***
mild<10×
PI uptake level
actin
dis
asse
mbl
ytim
e co
nsta
nt (
s)
actin
dis
asse
mbl
y ra
te(%
dec
reas
e pe
r se
cond
)
high>10×
mild<10×
0012345678
20 40 60
R = 0.9532
PI uptake rate(% increase per second)
80 100 120
PI uptake level
high>10×
100
(a)
(c)
(b)
10
1
1000
PI u
ptak
etim
e co
nsta
nt (
s)
100
10
1
Figure 5. Temporal kinetics analysis showing the dependence of actin network disassembly on the extent of sonoporation (quantified by PI uptake level). (a) Actindisassembly time constants derived from exponential decay regression of total weighted coherency values shown in figure 4 for sonoporated cells with mild and highPI uptake; each box shows minimum – maximum range (N ¼ 8; ***p , 0.001). (b) PI uptake time constants obtained from growth saturation regression of intra-cellular PI measurements taken from the same cells. (c) Scatter plot of actin disassembly rate versus PI uptake rate; data for all 16 cells in the two groups are shown.
rsif.royalsocietypublishing.orgJ.R.Soc.Interface
11:20140071
7
on May 13, 2018http://rsif.royalsocietypublishing.org/Downloaded from
for the duration in which transmembrane permeability was
enhanced owing to microbubble-mediated sonoporation.
For cells sonoporated with our protocol, this constant was
generally higher for those with high total PI internalization
(on average 27 s versus 253 s between the mild and high
uptake groups).
Building upon our results on characteristic time constants,
we found that the time rate of decrease in total weighted

sham control
bright-field image+
sonoporation tracer(Sytox-Orange)
live–dead assay(Calcein-Blue-AM and
Sytox-Red)
F-actin(phalloidin-FITC)
G-actin(DNase I 594)
5 mm
positive control(Cyto D)
viablesonoporated
non-viablesonoporated
Figure 6. Monomeric G-actin accumulates in sonoporated cells, and response is similar to cells treated with Cyto D actin depolymerization drug (positive control).Each column shows a set of post-exposure (2 h) fixed-cell confocal images for a cell with: sham exposure, Cyto D drug treatment, viable sonoporation and non-viablesonoporation. For each cell, four forms of images are shown: bright-field image merged with sonoporation tracer fluorescence (Sytox-Orange), live – deadfluorescence (Calcein-Blue-AM for live, Sytox-Red for dead), F-actin expression (phalloidin-FITC) and G-actin expression (DNase I 594).
rsif.royalsocietypublishing.orgJ.R.Soc.Interface
11:20140071
8
on May 13, 2018http://rsif.royalsocietypublishing.org/Downloaded from
coherency of actin was positively correlated with the time rate
of PI uptake. As illustrated in the scatter plot of figure 5c, for
sonoporated cells that exhibited a high PI uptake rate, their
decrease rate in total weighted coherency would also be
large (R ¼ 0.9532). This shows that, for sonoporation to facili-
tate rapid internalization of exogenous substance, the rate of
impact on actin network disruption is concomitantly high.
3.4. Accumulation of globular actin in sonoporated cellsFor the observed loss of F-actin in sonoporated cells, we found
that there was a commensurate gain in the amount of G-actin
within the cytoplasm. As an illustration of this finding, figure
6 shows a series of post-exposure confocal images (2 h after
exposure) for cells in different categories: sham exposure, posi-
tive control and sonoporation (viable and non-viable). The
primary information shown in these images is fluorescence
levels of F-actin (phalloidin-FITC) and G-actin (DNase I); data
are also provided on the cell’s morphology, live–dead status
and sonoporation tracer fluorescence. It can be observed that,
relative to the sham exposure cell (leftmost column), the
viable sonoporated cell (third column) showed a significantly
stronger G-actin fluorescence; also, it did not show the presence
of F-actin cables, consistent with our live-cell imaging results
(figure 2). A similar trend can be observed for the non-viable
sonoporated cell (fourth column), indicating that the actin
disruption impact of sonoporation may be persistent as a cell
progressed towards death. It is also in line with the positive
control cell that experienced actin depolymerization owing to
Cyto D treatment (second column).
Another observation to be noted from figure 6 is that, simi-
lar to the positive control cell, the viable sonoporated cell was
significantly more rounded in shape. This morphology is
rather different from that of the sham exposure cell, which
exhibited a stretched appearance. It is also not the same
as the morphology of the non-viable sonoporated cell (right-
most column) that showed irregular budding along the cell
boundary, characteristic of the apoptosis programme.
Statistical analysis across multiple cells (N ¼ 50) con-
firmed that a significant increase in G : F-actin ratio was
evident downstream from the onset of sonoporation. This
trend is illustrated in the series of box–whisker plots
shown in figure 7. In line with the image-level observations
in figure 6, sonoporated cells exhibited a statistically signifi-
cant reduction in F-actin fluorescence (figure 7a; mean level
was 32.2% lower than that for sham control) and concomitant
increase in G-actin fluorescence (figure 7b; mean level was 2.6
times higher than control). These in turn resulted in an aver-
age increase in G : F-actin ratio by 3.7-fold comparing with
sham exposure group (figure 7c). Note that the results are
consistent with that observed in cells in the positive control
group (middle column of boxes in figure 7).

2000
3000
(a)
(b)
(c)
2000
1000
0
0sham
controlCyto D sonoporated
1
2
3
4
5
6
1500
1000
500
0
***
***
***
***
F-ac
tin f
luor
esce
nce
(arb
. uni
ts)
G-a
ctin
flu
ores
cenc
e(a
rb. u
nits
)G
:F-a
ctin
rat
io***
***
Figure 7. Altered F-actin and G-actin expression in sonoporated cells resultedin a net increase in G : F-actin ratio. Results are shown for sham control cells,positive control cells (Cyto D drug treatment) and viable sonoporatedcells. Box – whisker plots of (a) F-actin fluorescence (phalloidin-FITC),(b) G-actin fluorescence (DNase I 594) and (c) G : F-actin ratio are given.Each box plots the minimum – maximum range (N ¼ 50). ***p , 0.001.
rsif.royalsocietypublishing.orgJ.R.Soc.Interface
11:20140071
9
on May 13, 2018http://rsif.royalsocietypublishing.org/Downloaded from
4. Discussion and conclusion4.1. Immediate impact of sonoporation on actin
networkAs we have demonstrated recently in another study, sono-
poration is in essence an act of traumatizing the plasma
membrane on an acute but transitory basis [33]. Its course
of action may well disrupt the integrity of the actin cytoske-
leton because this network of subcellular filaments is
physically interconnected with the plasma membrane. In
this study, we have demonstrated how each episode of sono-
poration, as realized via ultrasound-triggered collapse of a
single targeted microbubble attached on the cell membrane,
would lead to rapid rupture of the F-actin network adjacent
to the perforation site (figure 2). This finding effectively
serves as new evidence to illustrate that sonoporation is not
solely a membrane-level phenomenon. Furthermore, using a
structure tensor analysis approach (figures 3 and 4) coupled
with exponential decay regression, we have estimated that
the characteristic time for actin network disassembly was of
the order of seconds, and its rate of change was directly cor-
related with the rate of sonoporation tracer uptake into the
cell (figure 5). Although this time scale of actin network dis-
ruption is not as short as the microsecond-range microbubble
dynamics that take place during ultrasound pulsing [34], it
can still be considered as acute in that it matches well with
the perforation phase of a sonoporation episode which is
known to happen of the order of seconds [33].
Note that, in a sonoporation episode, immediate disruption
of the actin network is after all not an undesirable event. As
suggested in the cell biology literature [35], this event would
favour wound repair because the resulting sparser cytoskeleton
lattice would structurally make it easier for intracellular vesicles
to translocate to the perforation site to undergo homotypic
patch fusion (an important course of action for living cells to
reseal membrane pores). Therefore, acute remodelling of actin
near the site of sonoporation can by and large be regarded as
a cytoprotective process that would facilitate pore closure
[20,21]. In fact, a similar actin disruption phenomenon has
been reported in cells punctured by a micro-tip [36] or pulsed
by short-duration electrical fields [37,38].
4.2. Downstream reorganization of actin contents insonoporated cells
It is worth highlighting the fact that the impact of sonopora-
tion on the actin cytoskeleton was not limited to the initial
disruption. In particular, further disassembly of the actin net-
work was observed in sonoporated cells as time elapsed
(figures 2–4). Post-exposure microscopy has revealed that
such a disassembly event was due to enhanced disintegration
of F-actin into its globular monomer form (G-actin), and
during this process cell viability remained unaffected
(figure 6). In turn, the G : F-actin ratio was significantly
increased in sonoporated cells: a trend that was characteristi-
cally similar to that for cells which underwent biochemically
induced actin disruption via Cyto D treatment (figure 7).
As F-actin is the primary cytoskeletal component that pro-
vides mechanical support to the cell [39,40], its net reduction
in sonoporated cells (and the resulting increase in G : F-actin
ratio) can be interpreted as an act of cell softening or fluidiza-
tion [41]. However, temporal persistence of this phenomenon,
which was indeed observed in sonoporated cells, would have
implications on the long-term functional activeness of the
actin machinery. It would not only affect cell locomotion
and motility [42], but also trigger the activation of pro-
apoptotic stress signals [43,44]. The latter implication matches
well with our team’s previous flow cytometry findings that
showed: (i) time-lapsed loss of viability in sonoporated cells
starting at 2 h after the onset of sonoporation [45] and (ii)
retardation in cell-cycle progression over a multi-hour time-
frame [19,46]. It is also seemingly linked to other reports on
sonoporation-mediated bioeffects that showed upregulation
of various stress messengers like reactive oxygen species
and calcium ions [47,48]. As such, the range of biological con-
sequences that can be instigated by the physical action of
sonoporation (in addition to its biophysical impact on actin)
should not be underplayed. Indeed, recent statistics have
raised concerns over the efficiency of sonoporation in facilitating
drug uptake without fatally injuring the cells [49].
4.3. Perspectives for further investigationsFrom a biophysical context, this investigation is essentially
poised between our team’s recent reports on the spatio-
temporal dynamics of sonoporation sites [33] and the down-
stream stress response elicited in sonoporated cells [19,45,46].
In the future, it would be worthwhile to strengthen the con-
nections between these bodies of findings by performing

rsif.royalsocietypublishing.orgJ.R.So
10
on May 13, 2018http://rsif.royalsocietypublishing.org/Downloaded from
a correlational study between sonoporation-induced actin
disruption kinetics and other sonoporation-related cellular
phenomena. For instance, a three-way correlation analysis
should be conducted to explicitly establish the link between
the size of sonoporation sites, actin structure tensor coherency
and sonoporation tracer uptake.
As another avenue for extension beyond our current body of
findings, direct measurements of the mechanical properties
of sonoporated cells can be pursued using established rheology
techniques [23]. Various cytomechanical parameters would be of
interest, such as fluidity, stiffness, surface viscosity and mem-
brane tension. The acquired data would represent important
information on the biophysical details related to sonoporation.
Coupled with other research efforts that seek to establish the
key acoustic cavitation conditions for realizing sonoporation
[50,51], it should eventually be possible to formulate an analyti-
cal model for sonoporation to associate between cavitation
physics, membrane perforation dynamics and biophysical
impact. This model would be important to substantiate the
merit of sonoporation as an emerging membrane perforation
technique that is different from other established methods like
electroporation, whose biophysical details have already been
well characterized and modelled [52,53].
Funding statement. This work has been supported in part by the HongKong Innovation and Technology Fund (ITS/292/11) and theUniversity of Hong Kong (201109176229).
c.Interface
References11:20140071
1. Stephens DJ, Pepperkok R. 2001 The many ways tocross the plasma membrane. Proc. Natl Acad. Sci.USA 98, 4295 – 4298. (doi:10.1073/pnas.081065198)
2. Villemejane J, Mir LM. 2009 Physical methods ofnucleic acid transfer: general concepts andapplications. Br. J. Pharmacol. 157, 207 – 219.(doi:10.1111/j.1476-5381.2009.00032.x)
3. Escoffre JM, Teissie J, Rols MP. 2010 Gene transfer:how can the biological barriers be overcome?J. Membr. Biol. 236, 61 – 74. (doi:10.1007/s00232-010-9275-0)
4. Geers B, Dewitte S, de Smedt C, Lentacker I. 2012Crucial factors and emerging concepts inultrasound-triggered drug delivery. J. Control.Release 164, 248 – 255. (doi:10.1016/j.jconrel.2012.08.014)
5. Mehier-Humbert S, Guy RH. 2005 Physical methodsfor gene transfer: improving the kinetics of genedelivery into cells. Adv. Drug Deliv. Rev. 57,733 – 753. (doi:10.1016/j.addr.2004.12.007)
6. Frenkel V. 2008 Ultrasound mediated delivery of drugsand genes to solid tumors. Adv. Drug Deliv. Rev. 60,1193 – 1208. (doi:10.1016/j.addr.2008.03.007)
7. Ohl CD, Arora M, Ikink R, de Jong N, Versluis M,Delius M, Lohse D. 2006 Sonoporation from jettingcavitation bubbles. Biophys. J. 91, 4285 – 4286.(doi:10.1529/biophysj.105.075366)
8. Zhou Y, Cui J, Deng CX. 2008 Dynamics ofsonoporation correlated with acoustic cavitationactivities. Biophys. J. 94, L51 – L53. (doi:10.1529/biophysj.107.125617)
9. Zarnitsyn V, Rostad CA, Prausnitz MR. 2008Modeling transmembrane transport through cellmembrane wounds created by acoustic cavitation.Biophys. J. 95, 4124 – 4138. (doi:10.1529/biophysj.108.131664)
10. Kudo N, Okada K, Yamamoto K. 2009 Sonoporationby single-shot pulsed ultrasound with microbubblesadjacent to cells. Biophys. J. 96, 4866 – 4876.(doi:10.1016/j.bpj.2009.02.072)
11. Fan Z, Liu H, Mayer M, Deng CX. 2012Spatiotemporally controlled single cell sonoporation.Proc. Natl Acad. Sci. USA 109, 16 486 – 16 491.(doi:10.1073/pnas.1208198109)
12. Campbell P, Prausnitz MR. 2007 Future directions oftherapeutic ultrasound. Ultrasound Med. Biol. 33,657. (doi:10.1016/j.ultrasmedbio.2006.11.001)
13. Guzman HR, Nguyen DX, Khan S, Prausnitz MR.2001 Ultrasound-mediated disruption of cellmembranes. I. Quantification of molecular uptakeand cell viability. J. Acoust. Soc. Am. 110, 588 – 596.(doi:10.1121/1.1376131)
14. Sundaram J, Mellein BR, Mitragotri S. 2003 Anexperimental and theoretical analysis of ultrasound-induced permeabilization of cell membranes.Biophys. J. 84, 3087 – 3101. (doi:10.1016/S0006-3495(03)70034-4)
15. Hallow DM, Mahajan AD, McCutchen TE, PrausnitzMR. 2006 Measurement and correlation of acousticcavitation with cellular bioeffects. Ultrasound Med.Biol. 32, 1111 – 1122. (doi:10.1016/j.ultrasmedbio.2006.03.008)
16. Lai CY, Wu CH, Chen CC, Li PC. 2006 Quantitativerelations of acoustic inertial cavitation withsonoporation and cell viability. Ultrasound Med.Biol. 32, 1931 – 1941. (doi:10.1016/j.ultrasmedbio.2006.06.020)
17. Schlicher RK, Radhakrishna H, Tolentino TP,Apkarian RP, Zarnitsyn V, Prausnitz MR. 2006Mechanism of intracellular delivery by acousticcavitation. Ultrasound Med. Biol. 32, 915 – 924.(doi:10.1016/j.ultrasmedbio.2006.02.1416)
18. Schlicher RK, Hutcheson JD, Radhakrishna H,Apkarian RP, Prausnitz MR. 2010 Changes in cellmorphology due to plasma membrane woundingby acoustic cavitation. Ultrasound Med. Biol.36, 677 – 692. (doi:10.1016/j.ultrasmedbio.2010.01.010)
19. Chen X, Wan JMF, Yu ACH. 2013 Sonoporation as acellular stress: induction of morphological repressionand developmental delays. Ultrasound Med. Biol.39, 1075 – 1086. (doi:10.1016/j.ultrasmedbio.2013.01.008)
20. Ko KS, McCulloch CAG. 2000 Partners in protection:interdependence of cytoskeleton and plasmamembrane in adaptions to applied forces. J. Membr.Biol. 174, 85 – 95. (doi:10.1007/s002320001034)
21. Doherty GJ, McMahon HT. 2008 Mediation, modulation,and consequences of membrane-cytoskeleton
interactions. Annu. Rev. Biophys. 37, 65 – 95.(doi:10.1146/annurev.biophys.37.032807.125912)
22. Trepat X, Lenormand G, Fredburg JJ. 2008Universality in cell mechanics. Soft Matter 4,1750 – 1759. (doi:10.1039/b804866e)
23. Mofrad MRK. 2009 Rheology of the cytoskeleton.Annu. Rev. Fluid Mech. 41, 433 – 453. (doi:10.1146/annurev.fluid.010908.165236)
24. Mizrahi N, Zhou EH, Lenormand G, Krishnan R, WeihsD, Butler JP, Weitz DA, Fredberg JJ, Kimmel E. 2012Low intensity ultrasound perturbs cytoskeletondynamics. Soft Matter 8, 2438 – 2443. (doi:10.1039/c2sm07246g)
25. Zhang S, Cheng J, Qin YX. 2012 Mechanobiologicalmodulation of cytoskeleton and calcium influx inosteoblastic cells by short-term focused acousticradiation force. PLoS ONE 7, e38343. (doi:10.1371/journal.pone.0038343)
26. Juffermans LJM, van Dijk A, Jongenelen CAM,Drukarch B, Reijerkerk A, de Vries HE, Kamp O,Musters RJP. 2009 Ultrasound and microbubble-induced intra- and intercellular bioeffects in primaryendothelial cells. Ultrasound Med. Biol. 35, 1917 –1927. (doi:10.1016/j.ultrasmedbio.2009.06.1091)
27. Suresh S. 2007 Biomechanics and biophysics ofcancer cells. Acta Biomater. 3, 413 – 438. (doi:10.1016/j.actbio.2007.04.002)
28. Yalcin HC, Hallow KM, Wang J, Wei MT, Ou-YangHD, Ghadiali SN. 2009 Influence of cytoskeletalstructure and mechanics on epithelial cell injuryduring cycle airway reopening. Am. J. Physiol. LungCell Mol. Physiol. 297, L881 – L891. (doi:10.1152/ajplung.90562.2008)
29. Carmeliet P. 2005 VEGF as a key mediator ofangiogenesis in cancer. Oncology 69(Suppl. 3),4 – 10. (doi:10.1159/000088478)
30. Weichsel J, Herold N, Lehmann MJ, Krausslich H-G,Schwarz US. 2010 A quantitative measure foralterations in the actin cytoskeleton investigated withautomated high-throughput microscopy. Cytometry A77A, 52– 63. (doi:10.1002/cyto.a.20818)
31. Rezakhaniha R, Agianniotis A, Schrauwen JTC, GriffaA, Sage D, Bouten CVC, van de Vosse FN, Unser M,Stergiopulos N. 2011 Experimental investigation ofcollagen waviness and orientation in the arterial

rsif.royalsocietypublishing.orgJ.R.Soc.Interface
11:20140071
11
on May 13, 2018http://rsif.royalsocietypublishing.org/Downloaded from
adventitia using confocal laser scanning microscopy.Biomech. Model. Mechanobiol. 11, 461 – 473.(doi:10.1007/s10237-011-0325-z)
32. Dominguez R, Holmes KC. 2011 Actin structure andfunction. Annu. Rev. Biophys. 40, 169 – 186. (doi:10.1146/annurev-biophys-042910-155359)
33. Hu Y, Wan JMF, Yu ACH. 2013 Membraneperforation and recovery dynamics in microbubble-mediated sonoporation. Ultrasound Med. Biol.39, 2393 – 2405. (doi:10.1016/j.ultrasmedbio.2013.08.003)
34. van Wamel A, Kooiman K, Hartzveld M, Emmer M,ten Cate FJ, Versluis M, de Jong N. 2006 Vibratingmicrobubbles poking indvidual cells: drug transferinto cells via sonoporation. J. Control. Release 112,149 – 155. (doi:10.1016/j.jconrel.2006.02.007)
35. Miyake K, McNeil PL, Suzuki K, Tsunoda R, Sugai N.2001 An actin barrier to resealing. J. Cell Sci. 114,3487 – 3494.
36. Godin LM, Vergen J, Prakash YS, Pagano RE,Hubmayr RD. 2011 Spatiotemporal dynamics ofactin remodeling and endomembrane trafficking inalveolar epithelial type I cell wound healing.Am. J. Physiol. Lung Cell Mol. Physiol. 300,L615 – L623. (doi:10.1152/ajplung.00265.2010)
37. Berghofer T, Eing C, Flickinger B, Hohenberger P,Wegner LH, Frey W, Nick P. 2009 Nanosecondelectric pusles trigger actin responses in plant cells.Biochem. Biophys. Res. Commun. 387, 590 – 595.(doi:10.1016/j.bbrc.2009.07.072)
38. Stacey M, Fox P, Buescher S, Kolb J. 2011Nanosecond pulsed electric field inducedcytoskeleton, nuclear membrane and telomeredamage adversely impact cell survival.
Bioelectrochemistry 82, 131 – 134. (doi:10.1016/j.bioelechem.2011.06.002)
39. Pollard TD, Cooper JA. 2009 Actin, a central playerin cell shape and movement. Science 326,1208 – 1212. (doi:10.1126/science.1175862)
40. Tojkander S, Gateva G, Lappalainen P. 2012 Actinstress fibers: assembly, dynamics and biologicalroles. J. Cell Sci. 125, 1855 – 1864. (doi:10.1242/jcs.098087)
41. Trepat X, Deng L, An SS, Navajas D, TschumperlinDJ, Gerthoffer WT, Butler JP, Fredburg JJ. 2007Universal physical responses to stretch in the livingcell. Nature 447, 592 – 595. (doi:10.1038/nature05824)
42. Revenu C, Athman R, Robine S, Louvard D. 2004The co-workers of actin filaments: from cellstructures to signals. Nat. Rev. Mol. Cell Biol. 5,1 – 12. (doi:10.1038/nrm1437)
43. Gourlay CW, Ayscough KR. 2005 The actincytoskeleton: a key regulator of apoptosis andageing? Nat. Rev. Mol. Cell Biol. 6, 583 – 589.(doi:10.1038/nrm1682)
44. Desouza M, Gunning PW, Stehn JR. 2012 Theactin cytoskeleton as a sensor and mediator ofapoptosis. BioArchitecture 2, 75 – 87. (doi:10.4161/bioa.20975)
45. Zhong W, Chen X, Jiang P, Wan JMF, Qin P, Yu ACH.2013 Induction of endoplasmic reticulum stress bysonoporation: linkage to mitochondria-mediatedapoptosis initiation. Ultrasound Med. Biol. 39,2382 – 2392. (doi:10.1016/j.ultrasmedbio.2013.08.005)
46. Zhong W, Sit WH, Wan JMF, Yu ACH. 2011Sonoporation induces apoptosis and cell cycle arrest
in human promyelocytic leukemia cells. UltrasoundMed. Biol. 37, 2149 – 2159. (doi:10.1016/j.ultrasmedbio.2011.09.012)
47. Honda H, Kondo T, Zhao QL, Feril Jr LB, Kitagawa H.2004 Role of intracellular calcium ions and reactiveoxygen species in apoptosis induced by ultrasound.Ultrasound Med. Biol. 30, 683 – 692. (doi:10.1016/j.ultrasmedbio.2004.02.008)
48. Hassan MA, Campbell P, Kondo T. 2010 The role ofCa2þ in ultrasound-elicited bioeffects: progress,perspectives and prospects. Drug Discov. Today 15,892 – 906. (doi:10.1016/j.drudis.2010.08.005)
49. Liu Y, Yan J, Prausnitz MR. 2012 Can ultrasoundenable efficient intracellular uptake of molecules? Aretrospective literature review and analysis.Ultrasound Med. Biol. 38, 876 – 888. (doi:10.1016/j.ultrasmedbio.2012.01.006)
50. Zinin PV, Allen III JS. 2009 Deformation of biologicalcells in the acoustic field of an oscillating bubble.Phys. Rev. E 79, 021910. (doi:10.1103/PhysRevE.79.021910)
51. Forbes MM, O’Brien Jr WD. 2012 Development of atheoretical model describing sonoporation activity ofcells exposed to ultrasound in the presence ofcontrast agents. J. Acoust. Soc. Am. 131,2723 – 2729. (doi:10.1121/1.3687535)
52. Teissie J, Golzio M, Rols MP. 2005 Mechanisms ofcell membrane electropermeabilization: aminireview of our present (lack of?) knowledge.Biochim. Biophys. Acta 1724, 270 – 280. (doi:10.1016/j.bbagen.2005.05.006)
53. Krassowska W, Filev PD. 2007 Modelingelectroporation in a single cell. Biophys. J. 92,404 – 417. (doi:10.1529/biophysj.106.094235)


![The Actin Cytoskeleton: Functional Arrays forUpdate on the Actin Cytoskeleton The Actin Cytoskeleton: Functional Arrays for Cytoplasmic Organization and Cell Shape Control1[OPEN] Dan](https://static.fdocuments.us/doc/165x107/5f0830197e708231d420c69d/the-actin-cytoskeleton-functional-arrays-update-on-the-actin-cytoskeleton-the-actin.jpg)