
environmental site management & rehabilitation awareness course
Upload
brian-murrayCategory
view
213download
1
A R T I C L E S
Single-Site, Results-Level Evaluation of Quality Awareness Training
Brian Murray, Gary C. RaJae7e
A Crosby quality-training intervention was studied in a single facility to eval- uate its long-term effects in terms of both quality level and dollar utility. Using a n interrupted time-series design pooling six twelve-year series, this study found that the training demonstrates a positive eject size for the quality level of the goods produced in a vitreous china plant and has a positive dollar util- ity. The study also revealed a n important contextual factor-production process-in the evaluation of the effect size of a quality-training interven- tion. In addition, the analysis method-afixed ejects model-was shown to be useful for studying training interventions in single facilities where there are multiple product lines.
Quality programs are pervasive in U S . organizations. Estimates of companies employmg quality initiatives range from 68 percent (Moras, Sanchez, and Ford, 1994) to almost 75 percent (Conference Board, cited in Powell, 1995) to 93 percent (Arthur D. Little Corporation, cited in Powell, 1995). In most of these programs, training plays a significant role (Brocka and Brocka, 1992; Crosby, 1979; George, 1992; Juran, 1992; Krishnan, Shani, Grant, and Baer, 1993; Walton, 1986). However, its utility has not been rigorously evaluated in an unbiased manner; surveys of quality program implementation and success gen- erally either have been conducted by organizations that had a vested interest in demonstrating positive results or have been limited by significant method- ological problems (Powell, 1995). Accordingly, useful research would apply sys- tematic evaluation to quality-training interventions to demonstrate their efficacy
The purpose of the present study was to address this deficiency by exam- ining the efficacy of awareness training in achieving results-level outcomes; specifically, our purpose was to discover whether quality-awareness training
Note: The authors gratefully acknowledge the financlal assistance of the College of Business, Univer- sity of Texas, San Antonio, the site coordination of Lee Wingert, and comments on an earlier version by Raydel Tullous.
HNIAN R n o m c ~ D ~ V ~ L ~ P M F N r Q V A R T L R ~ Y . vol. 8, no. 3, Fall 1997 0 Jossey-Bass Publishers 229
Murray, Raffele 230
can be useful in reducing levels of production scrap. Further, we wanted to examine whether awareness training outcomes differ under alternative pro- duction processes. To achieve these ends, we pursued three specific areas to enhance research knowledge. First, we completed a results-level evaluation of both product quality and dollar utility. Second, we examined production process, an important contextual factor, to measure its influence. Third, we demonstrated an appropriate cross-sectional time-series design using a fixed- effects model for evaluating a training program at a single facility with multi- ple product lines. The reasoning behind the development of our research questions in each of these three areas follows.
Research Questions
Product Quality. Industrial psychologists and human resource researchers have discussed the importance of integrating personnel practices with orga- nizational goals and strategy (for example, Dyer, 1983, 1984; Dyer and Holder, 1988; Lawler and Jenkins, 1992; Milkovich, 1988; Raghuram, 1994; Tichy, Fombrun, and Devanna, 1984). Likewise, Schonberger (1992) has argued that training, specifically quality training, is a key element in an organization’s strat- egy and its ability to maintain a competitive advantage. However, despite its perceived importance, a review of the literature reveals that training researchers have virtually ignored the impact of quality training on organizational outcomes.
Although at first glance quality management appears to be an operations problem, quality interventions need the support of human resource develop- ment. Despite this apparent relationship, the effectiveness of quality awareness training remains unexamined. Although training programs have been shown to be effective in changing behavior both‘ in the classroom and on the job (for example, Burke and Day, 1986; Mathieu and Leonard, 1987; Schmidt, Hunter, and Pearlman, 1982), the efficacy of quality-awareness training has not been rigorously demonstrated. Likewise, the long-term effects of quality awareness training have not been examined.
To investigate the role of training in achieving organizational goals, it would be necessary to examine how its outcomes affect organizational perfor- mance objectives. Of the four levels of training evaluation-reaction, learning, behavior, and results-the latter is the most closely tied to the goals of the company Therefore, we sought studies in the literature that measured out- comes at the results level. Although we were not entirely successful in our search, we could identify the articles described in the following paragraphs.
First, Shani and Rogberg (1994) reviewed nine case studies of quality interventions, each of which included a training component. From the sum- mary of the studies it was apparent that commonly reported positive outcomes were satisfaction, awareness, and communication, while the negatives were financial problems, increased overtime, and increased document handling. It

23 1 -~
Evaluation of Quality Awareness Training
was not possible, however, to determine the role of training or the expected effect on quality measures.
Second, Easton (1993) discussed quality interventions from the perspec- tive of a Baldridge examiner. He concluded that quality training tended to focus on awareness. He also found that the effectiveness of training was not directly examined; rather, the evaluations were at the reaction level, disre- garding behavioral and results levels.
Third, Sommer and Merritt (1994) evaluated a quality intervention and tried to measure changes in attitudes and behaviors. They showed a positive change in organizational citizenship perceptions, satisfaction, and group cli- mate, as well as a reduction in perceived conflict, turnover, and absenteeism. But it is difficult to draw conclusions from their study because they did not use an experimental design with controls for or measures of threats to validity Fur- thermore, they reported no tests of significance for changes in absenteeism or turnover. Finally, their evaluation included no direct measure of the interven- tion on quality.
Thus, it is not possible to determine from prior studies the results-level impact of quality training. Although studies reported perceptual changes, few were able to demonstrate to what extent, if any, the quality intervention affected organizational goals.
Yet there are reasons to believe that quality training is useful for achieving organizational objectives. Deming (cited in Walton, 1986), Juran (1992), and Crosby (1979), all popular quality program developers, have included train- ing as an important component in their plans. They proposed that as employ- ees achieve a greater understanding of work processes, standards and outcomes, quality improvement, and measurement, they demonstrate higher quality production. This background research led us to develop Question 1: Does quality training have a positive effect on product quality?
Utility. If we understand the effect on product quality, however, we still have only a partial understanding of quality training’s effect on organizational objectives. To demonstrate quality training’s usefulnesss to an organization at the results level, its outcomes must be discussed relative to the investment- in other words, its efficiency (Pritchard, 1992). An approach used to under- stand the efficiency of training is utility analysis. Boudreau (1991) reviewed the development and application of utility analysis to training evaluation and concluded that it has been demonstrated to include important variables, has been used in simulation analysis, has been applied to empirical demonstration, and has been used for inference in meta-analysis. Although it has generally been studied as a decision tool to use before implementation, it can also pro- vide important information about the relationship between costs and benefits. Therefore, it may provide a useful criterion by which to evaluate quality training.
Because quality management is expected to yield better products at lower scrap cost, increased customer and employee satisfaction, and more favorable performance (Walton, 1986), quality programs are expected to generate a pos-

232 Murray, Raffaele
itive dollar utility. Powell (1995), however, reviews articles that warn of sig- nificant implementation costs that might not generate equal benefits. Question 2 seeks to understand this relationship: Does quality training demonstrate a positive dollar utility?
Context. While quality and utility are the generally proposed outcomes of quality-awareness training, actual interventions and results vary among orga- nizations. In their survey of quality programs, Moras, Sanchez, and Ford (1994) observed that different organizations used varied plan elements. They concluded that although there were no clear prescriptions, each organization could successfully choose among sets of program characteristics. The organi- zations differed on important contextual dimensions and these could explain some of the variance.
Jackson and Schuler (1995) discussed the role of context in human resource management. They reviewed internal and external environmental fac- tors and theoretical perspectives that might explain both the similarities and the differences among human resource practices and outcomes in organiza- tions. Noe and Ford (1992) further supported the importance of context when they called for research on generalizability or similarity of training research results. They asked for identification of the key dimensions of similarity (and, conversely, dissimilarity) that influence the generalizability of training.
One contextual dimension that may explain the variance in the outcomes of quality training is production process. We expect that different processes are affected by quality training in different ways, even within a single facility man- ufacturing a single product. The production process elements that might affect outcomes are opportunity for human control and differences in equipment. The production process issue is addressed in Question 3: Does the change in rate of product quality after quality training differ depending on production process?
Method
To examine the results-level outcomes of quality-awareness training, we stud- ied a quality intervention that was implemented at a vitreous china production facility To describe the methodology, we first explain the experimental manip- ulation, then describe the experimental facility and data collected, and finally discuss the analysis procedures.
Experimental Manipulation and Design. The experimental manipulation we studied was the implementation of a Crosby quality-training program.
Crosby (1979, 1988) developed an approach to achieving total quality in the manufacturing process by preventing defects in production. His program was based on four “absolutes.” First, quality is the prevention of defects and is a skill that can be taught. Second, quality improvement interventions are a per- manent process rather than a single event. Third, quality is the achievement of production requirements, the first time and every time. Fourth, quality can be measured as the price of deviations from requirements.
233 _____________ Evaluation of Quality Awareness Training _____
To implement and maintain quality, Crosby (1979) developed fourteen steps, summarized by Brocka and Brocka (1992). The steps included manage- ment commitment; formation of quality-improvement teams; measurement of potential problems and cost; increased quality awareness; training of all employees; establishment of goals, communication, recognition; and a “zero defects day.”
The program implemented at the experimental facility focused on aware- ness training. First, managers were trained off-site by the Crosby consulting organization on all elements of the plan; this training consisted of presenta- tions and videos. Then, these managers trained the salaried employees from each of the work areas; this training consisted of four class hours of presenta- tions .and videos, and the employees were also provided with a workbook. Finally, all the hourly employees were trained in quality awareness and improvement; their training consisted of thirty-two class hours of presenta- tions and videos, and they too were provided with a workbook. After training, an exam was administered. All trainees passed the test.
Following the training, organization members were able to apply their new knowledge and address the other components of the program. Specifically, they identified needed improvements, made recommendations, identified costs, and held a zero defects day to emphasize the change in quality expectations. When they described the program elements and implementation, the managers emphasized that the significant part of the intervention was the training and that all members of the organization had participated in the training.
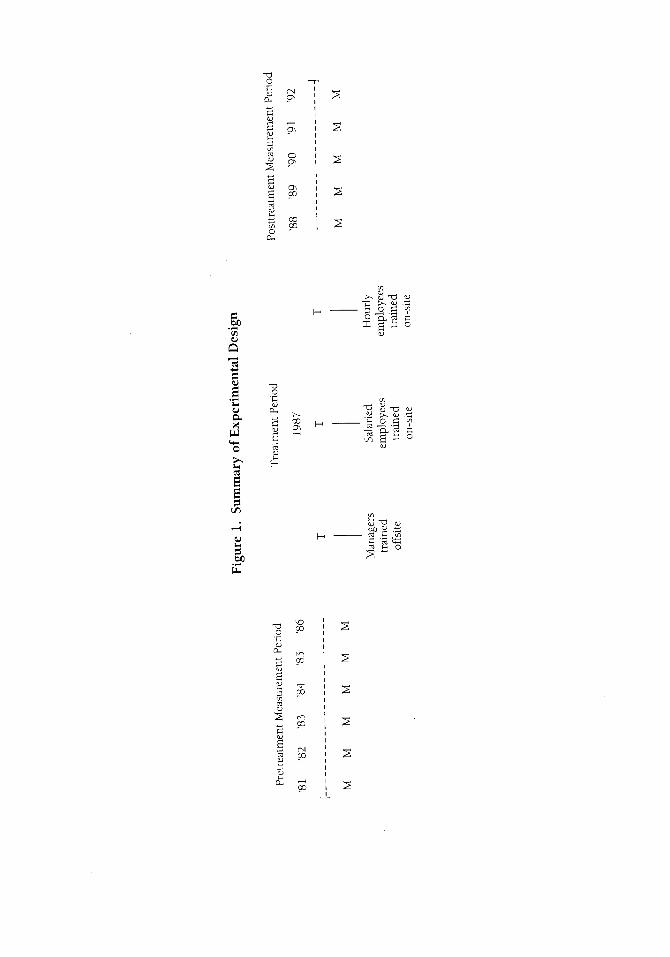
The total training process took approximately one year to complete. Fol- lowing the initial training year, the program was allowed to progress for five years. During those five years, training continued for all new organization members. Figure 1 summarizes the order of events in the manipulation.
Experimental Facility and Subjects. As already noted, the quality-train- ing program was implemented at a vitreous china plant located in a rural town in the southwestern United States. The facility produces ceramic toilets and vanities. The study focused on six product lines (two types of vanities and four types of toilets) that were in production during the twelve years of the study The technology used in these production processes did not change through- out the twelve-year period; thus, there was an important control to aid in the evaluation of the training intervention.
The main production processes examined were greenware and firing. The greenware process involves mixing and molding of wet clay. Opportunities to affect quality were present in mixing the sludge and molding. The firing process deals with the kiln and the baking of the clay. Opportunities to affect quality were in controlling the timing and temperature. Another opportunity 10 affect quality was in the handling of the pieces in either process.
The organization was motivated to implement quality training because of the high cost of scrapped items. The reported value of scrapped items was approximately $3 million to $5 million per year. Managers felt that there was
c 0

Evaluation of Quality Awareness Training 235
an opportunity on the employees’ part to reduce this level, and they expected to achieve this reduction through training.
The employees at the facility were long-term, with an average tenure of approximately eleven years. The average turnover rate was 1.5 percent. The high tenure and low turnover created a very stable employee environment in which to study the intervention.
Data. Three methods of data collection were used in this study. First, we interviewed the human resource manager to obtain a description and timeline of the intervention and a description of the training and the employees. The industrial engineer conducted a tour of the facility, and we also interviewed him for information about the production process, products, and quality- related practices.
Second, we collected archival data regarding product quality. Quality was defined as the percent of good pieces following a production process. Annual percentages were available for the two processes across six product lines. These yielded two twelve-year (1981 to 1992) pooled cross-sectional time series.
Third, we distributed surveys to managers to estimate the dollar utility of scrap. The first survey, modeled after that discussed by Schmidt, Hunter, McKenzie, and Muldrow (19791, asked for estimates of the dollar value of scrap for low, average, and superior performing employees. A second single survey was completed by the organization’s accounting officer to provide the organizational tax rate, discount rate, and costs.
Analysis. Opportunities for bias or threats to validity present a challenge to training evaluation in field settings. While the use of control groups can alle- viate many of the concerns, these are not always available in practice. Cook and Campbell (1979) suggest using a time-series, quasi-experimental design to address threats to validity when a control group is not possible. Basically, the series of observations acts as a control by modeling trends in the data and the influence of external events.
In situations where multiple groups are involved in the training, time- series evaluation can be enhanced by pooling the outcome data into a cross- sectional time-series design. One modeling approach to this pooling is fixed effects (Greene, 1993; Hausman and Taylor, 1981; Judge and others, 1985). This approach allows for estimating across-group effects while controlling within-group differences. By taking the form of a least squares equation that includes dummy variable indicators for each group, it recognizes unspecified events or characteristics unique to an individual group.
Pooled cross-sectional time-series fixed-effects models can be applied to training programs implemented across departments, product lines, teams, facil- ities, and organizations. To provide useful information, they require (a) an interrupted time series, (b) a training intervention that is applied across all groups, and (c) within-group differences that can be expected to influence the outcome measure. To evaluate the training, the data required include an out- come measure, a dummy variable indicating the posttraining period, and a
236 Murruy, Rufuele
dummy indicator for each group (omitting one group as the comparison). The resulting evaluation model is outcome = pre/posttruining +group, h, and is evaluated on the coefficient for the pre-/post-variable (post = 1) as equal to the training effect size.
We elaborate upon this model here because it not only allows for the sys- tematic evaluation of a training program in a single facility but also uses the information from data across groups inside the organization. The fixed-effects evaluation method has been applied in economics, job design, and compen- sation research (for example, Gerhart, 1988; Gerhart and Milkovich, 1990; Murray and Gerhart, 1994), and interrupted time series have been applied in compensation interventions (for example, Hatcher and Ross, 199 1; Wagner, Rubin, and Callahan, 1989). Yet they are not prevalent together in the training literature. This application in the present study demonstrates its utility.
The primary analysis was a fixed-effects, interrupted time-series regression model of the form:
Qualityi = training, + product line, + training year + trend 111 Qualityl = percent of good pieces for each process I (greenware and firing) Training, = dummy indicator of time t (t = 1, posttraining) Product line, = dummy indicators of product lines k (k = 1 for each toilet or vanity line) Training year = dummy indicator for the training year (I987 = 1) Trend = year of data observation
Two regressions were completed, one for each production process. In each regression the training indicator for the posttreatment period was interpreted as the training effect size. Indicators of the product lines were included to pool the data and control any effects unique to a product. A dummy indicator of the training year was included to recognize that either pre- or postdata qual- ity levels might be very different and, thus, confound the results. Finally, a year variable was included to control for any threats due to an existing trend or mat- uration in the series.
Detailed annual reports for each year (1981 to 1992) were examined for any changes in equipment, processes, raw materials, employees, or human resource practices aside from the training intervention that might have affected quality outcomes and should have been included as controls in the model. While there were reports of routine adjustments in the handling of the raw inputs, no significant changes were noted. Likewise, there were no important changes in equipment, practices, or personnel that went across years or might have affected quality outcomes. In fact, because of the low turnover and static technology, this facility provided a relatively controlled environment for quasi- experimentation, especially compared with other field studies.

23 7
As already noted, the second analysis was of dollar utility. Utility analysis is a technique for estimating the potential dollar returns from a training inter- vention. It asks the question, “What is the net financial benefit of the training given the number of people trained, the cost of training, and the dollar bene- fits of training?” It relies on the evaluator’s ability to estimate a distribution of worker performance levels in dollars, indexed by the standard deviation. Applying the slandard deviation of performance, the evaluator compares it to the standard effect size of the training to calculate the dollar benefit of the training. Dollar utility, then, is the net of this benefit to the cost of the train- ing. Several refinements to this technique have been developed to better esti- mate the dollar utility value by considering the time value of money, tax rates, and variable costs (Boudreau, 1991).
We used the following utility model developed from Boudreau (1983, 1991), Schmidt, Hunter, and Pearlman (1982), and Mathieu and Leonard (1987).
~ . _ _ _ Evaluation of Quality Awareness Training
AU = c, [l/(l + i),] X [NkSDy(l + V > (1 - TAX)d,]
AU = marginal utility C, = sum over k years k = number of years over which utility estimates are calculated i = discount rate N, = the number of trainees in year k adusted for turnover SDy = standard deviation of performance in dollar units v = variable cost TAX = organizational tax rate d,, = effect size estimate for training C, = costs incurred in year k
- [Ck(l/(l +ilk) (1 - TAX)]
The average annual tax rate, variable cost, input cost, and discount rate were provided by the company’s accounting officer. The number of people trained and the training cost per employee were provided by the human resource man- ager, In calculating the amount, he was asked to consider direct training costs, travel and reimbursement, consulting fees, facilities, time away from work, trainer time and fees, materials, and miscellaneous expenses.
The standard deviation of performance (SDy) in dollars was calculated using the global estimation method (Schmidt, Hunter, McKenzie, and Muldrow, 1979; Boudreau, 1991). Each of five managers was asked to estimate the dollar value of scrap produced by an employee at the fifteenth, fiftieth, and eighty-fifth percentiles, representing one standard deviation in performance. These were averaged. The individuals providing this information had tenure within the organization ranging from six to thirty-five years and tenure in their current positions ranging from four to twenty-five years. Job titles included foreman, senior ceramics engineer, industrial engineer, assistant plant man- ager, and plant manager.

238 Murray, Raffaele
The calculated dollar utility was interpreted as the net value of the train- ing program to the organization.
The final analysis compared the training effect sizes between the green- ware and firing production processes. We compared the regression coefficients for the treatment variable and tested the difference using the standard error. The null hypothesis was that quality training would have an equal effect size regardless of process.
Results
Descriptive statistics for each of the product lines within each of the produc- tion processes are shown in Table 1. They indicated that the greenware process yelded less scrapped items than the firing process and that there was variance in the percent of good items across product lines, with greater variance evident in the firing process.
We tested the first research question, “Does quality-awareness training have a positive effect on product quality?” by using equation [l] detailed ear- lier. We used generalized least squares rather than ordinary least squares regres- sion to correct for autocorrelation indicated by a Durbin-Watson statistic (1.37 for greenware analysis and 1.46 for firing analysis). An alternative to the gen- eralized least squares model would have been to use an ARIMA model (Cook and Campbell, 1979). But given the form of our equation, the pooling of cross- sections, and especially the relatively short time series, it was appropriate to use a general linear model (of which ARIMA is a specialized case).
Using the first dependent variable, quality in greenware, we found a sig- nificant positive effect (see again Table 1). The coefficient indicated that qual- ity training increased the percent of good pieces by 4.84 (p < .Ol) percentage points. Additional coefficients also indicated that during the training year there was a significant positive increase in percentage points (3.62, p < .05> and a significant negative trend across the time series ( 0.895, p < ,011. Significant results reported for product line dummy variables indicated that the mean quality levels differed significantly among product lines compared with the omitted line and including these variables controlled for those mean differences.
Table 1. Descriptive Statistics
Greenware Percent Firing Percent
Variable N Mean SD Min. Max. Mean SD Min. Max.
Product 1 12 89.6 3.6 83.5 94.0 65.8 5.9 55.5 72.7 Product 2 12 91.9 2.8 87.9 96.0 80.2 6.0 70.2 86.7 Product3 12 97.9 0.6 96.6 98.7 84.4 3.2 79.1 89.0 Product4 12 89.9 3.3 83.1 94.6 73.7 4.5 66.6 80.9 Product 5 12 87.2 3.2 81.2 92.3 59.2 5.8 46.5 67.8 Product6 12 93.0 2.1 89.0 96.7 73.3 7.5 62.1 83.6

239
Testing the second dependent variable, quality in firing, we calculated a significant positive coefficient indicating an 8.08 (p < ,051 percentage point increase in quality over what would be expected without the training. Again we also found a significant increase in percentage of good parts fired (8.37, p < . O l ) during the training year and a significant negative trend across the time series ( 1.18, p < .05). Significant results reported for product line dummy variables indicated that the mean levels of quality differed significantly among product lines compared with the omitted line and including these variables controlled for those mean differences. (See Table 2.)
For each of the dependent variables, we also examined the fit of our model to the data. An advantage that time series offer is the ability to look for exter- nal events that may be causing an observed effect. Figure 2 illustrates both time series for data aggregated to the plant level. In both cases the fit of the modeled data to the actual data was evident in how closely they track together. It was also encouraging to see a clear change in outcomes occur at the training year.
We tested the second research question, “Does quality awareness training demonstrate a positive dollar utility?” by using equation [2] described earlier. In calculating the utility estimate we employed the previously described process for an initial employee sample size of N = 237 and additional sample members for following years of N = 4. From the surveys of managers, the esti- mated standard deviation of performance was SDy = $799.50, which suggests that an employee whose performance is one standard deviation better than the average will make (or save) the organization $799.50 more than the average performer. We had only a single estimate of SDy available to us even though
.~ Evaluation of Qiiality Awareness Training
Table 2. GLS Regression Estimates of the Effect Size of Quality Training
Production Process
Grrenware Firing
Variable CoeJ. s.e. coeff s.e.
Training Training Year Product Line 1 Product Line 2 Product Line 3 Product Line 4 Product Line 5 Trend Intercept
4.841 ** 1.749 3.617 * 1.542
-3.478 * * 0.813 -1.093 0.916
4.927 ** 0.937 -3.144 * * 0.913 -5.817 * * 0.801 -0.895 * * 0.241
168.092 * * 20.137
8.080 ’ 8.368 * *
-7.612 * * 6.885 * *
11.146 * * 0.455
-14.127 * * -1.184 *
171.615 * *
3.741 3.333 1.877 2.082 2.118 2.076 1.855 0.516
43.079
N GLS RL GLS F
72 77
26.36
72 .77
26.36
* p < 0 5 ; * * p < . O l .

240 Murray, Raffaele
85
Figure 2. Modeled and Actual Observations of Good Piece Percentage for Greenware and Firing
--
- MODEL FIRING + GREENWARE --Jt MODELGREEN
I
50 ! I I I I I I I I I I
Year
each product line and production process may have produced greater or lesser returns to performance, because the movement of employees, variance of scrap levels among products, sequencing of production processes, and assembly of different products (tanks, rims, bowls) into a final product (toilets) made it dif- ficult for the managers to estimate dollar values for individual products. The discount rate, tax rate, and variable cost rate were .20, .40 and .72, respec- tively. The training effect size for each process was d = 2.768 (greenware) and d = 2.160 (firing). The calculated cost estimate per trainee for the year of train- ing was C = $600.
We calculated a positive utility value for each of the processes (greenware = $606,269 and firing = $45 1,404). To test the significance of these values, we calculated the standard error of the utility estimate (Alexander and Barrick, 1987) (greenware standard error = 12,572.36; firing standard error = 11,578.51).We were able to estimate only two sources of error variance, SDy and training effect size. To the extent that other elements of the utility analy- sis were unreliable, the resulting standard error is underestimated. The calcu- lated 99 percent confidence intervals (greenware: 593,026 61931 1; firing: 439,208 463,599) and t-ratios (greenware = 48.22, p < .01; firing = 38.99, p < .Ol) indicated significant positive dollar utility
24 1 -
Evaluation of Quality Awareness Training
We tested the third research question, “Does the change in rate of product quality from quality-awareness training differ depending on production process?” by comparing the training effect coefficients and their standard errors. The calculated t-statistic for a difference in coefficients was 11.65 (p <. 01), indicating a significant difference.
Discussion
This study was prompted by the question of whether quality-awareness train- ing has any efficacy toward positively affecting organizational outcomes. The importance of the question stemmed from the apparent lack of results-level research to support the existing behavioral and attitudinal research. Past stud- ies indicated that quality programs affected satisfaction, awareness, communi- cation, conflict, and citizenship behaviors, but they did not extend these outcomes to the level of organizational results. To address this deficiency, this study examined product quality in a long-term test of scrap rates. The analy- sis and results support the conclusion that a quality intervention in which quality awareness training plays a foundational role can have a positive effect on organizational outcomes. In the following paragraphs, each of the study’s research questions are discussed in detail.
The results support the proposition that the implementation of quality training is associated with greater quality outcomes. In this case, Crosby qual- ity training was associated with decreased rates of scrap in both greenware and firing production processes. These results support many results reviewed by Powell (1999, that is, that quality interventions play a part achieving out- comes. They also extend the literature reviewed earlier, which demonstrated the more direct effects on employee attitudes and behavior by demonstrating the subsequent indirect effect.
These data also support a positive response to the second question regard- ing dollar utility Powell’s (1995) concern about the cost of quality compared with the benefits is not supported by the data. To make a fair comparison, though, one would have to look beyond training and include any and all costs associated with quality Although the training constituted the largest part of this particular intervention, there may have been other costs not reported as a cost of the training.
The results also support a positive answer to the final question regarding differential effects by process. Production process is an important contextual variable to consider when evaluating training programs, including the meta- analysis of effect sizes across interventions.
Limitations. We interpreted the results of this study with the knowledge that our conclusions have some constraints. First, studying only the results level assumes that each of the more direct effects on behavior and attitudes evolved into the organizational outcomes. To support this point, we reviewed a literature base that demonstrated these levels of outcomes. Further, an estab-

242 Murray, Raffaele
lished literature has reported behavioral and attitudinal outcomes from train- ing interventions in general (for example, Burke and Day, 1986; Campion and Campion, 1987; Gist, 1989; Gist, Schwoerer and Rosen, 1989; Hand and Slocum, 1972). Finally, the method we employed included a search for alter- native explanations for the results-level outcomes.
Second, the sample was a twelve-year series. Individually, each series of data had relatively few observations and the stability of the training effect coef- ficient for any one series was not assured. However, we addressed this con- straint by pooling six separate series across product lines to achieve a more consistent estimate of the effect size.
Third, the data were annual percentages rather than daily or weekly rates. This level of data did not provide graphical output that could be interpreted for external events that might affect quality on a shorter-term basis. To address this limitation, we collected and studied the annual reports to identify any important external influences. In addition, the stability of employment, tech- nology, and practices helped to ensure the internal validity of the results.
Fourth, the evaluation lacked a control comparison. We addressed this limitation by using a time-series design, which allowed us to examine the pat- tern of quality outcomes for external influences or trends. Although no shocks were evident in the data, a trend was identified and controlled for in the analy- sis. Furthermore, the interviews and annual reports yielded no indication of threats to internal validity.
Fifth, the external generalizability of the results may be limited. As we demonstrated, context matters. Although the focus on training is a strength for this study, Moras, Sanchez, and Ford (1994) and Powell (1995) both showed variation in the use of plan elements across interventions. We addressed this limitation by specifically identifying the differing effects for two production processes so that they might be compared with other facilities.
Finally, the SDy estimates in the utility analysis were based on a relatively small sample. This limitation was addressed by surveying people knowledge- able in quality, production, and cost, who had been with the plant for a sig- nificant number of years. Further, the variance in their responses was examined to ensure that there was no unreasonable disagreement.
Implications and Contributions. This study has two important implica- tions for research and practice in training. First, a fixed-effects model for pooled cross-sectional time-series data is useful for evaluating training pro- grams. A difficulty faced in practical training evaluation and in field research is the cost and lack of control groups. Here, while time-series data allow for the examination of the pattern of outcomes, fixed effects allows heterogeneous cross-sections to be pooled so that within-group differences are controlled and consistent estimates of the effect size can be calculated.
Second, context matters. When training programs are evaluated, impor- tant contextual variables that affect the estimates and their generalizability should be identified and tested. This study demonstrates that production

Evaluation oJ Quality Awareness Training 243
process is one contextual element that needs to be considered when training sites and evaluations are compared. Comparative studies of human resource development especially need to consider-or at least control for-aspects of the manufacturing process that constrain or direct behavior in a way that either inhibits or enhances performance outcomes.
This study also makes several important contributions to the knowledge regarding quality training. First, it is one of the few to study the long-term effects of a quality-training program and it is the only systematic empirical study of the long-term effects that we could identify Quality interventions gen- erally are not designed as one-shot programs; rather, they are meant to focus workers’ attention on continuous improvement. Prior articles have demon- strated only the shorter-term outcomes; they do not indicate whether the effects result simply from the existence of an intervention or from actual learn- ing and behavior change. This study shows that this quality-awareness train- ing program had lasting effects over a five-year period.
Second, the study demonstrates important results-level outcomes. With today’s increased focus on organizational goals and strategy, it is important to identify and measure training outcomes. The calculated effect size suggests that awareness training can play a part in moving an organization from a 30 per- cent scrap rate to a 26 or a 22 percent rate depending on the production process. Moreover, it is important to show that the result can be achieved at a net benefit to the organization in dollar terms. The utility analysis illustrates that this training program gives the organization greater than $439,000 in net benefit in just one production process. Looking at the long-term outcomes, it also demonstrates that the company can see a five-year return on investment of over 600 percent.
Finally, this research is unique among field studies because so much remained constant for so long. The stability in technology, personnel, and prac- tices enhances the interpretability of the results and allows more confidence in the estimates.
References
Alexander, R. A,, & Barrick, M. R. (1987). Estimating the standard error of projected dollar gains in utility analysis. Journal of Applied Psychology, 72 (3), 4 7 5 4 7 9 ,
Boudreau, J. W. (1983). Effects of employee flows on utility analysis of human resource pro- ductivity improvement programs. lournal of Applied Psychology, 68 (3), 396-406.
Boudreau, J . W. (1991). Utility analysis for decisions in human resource management. In M. D. Dunnette & L. M. Hough (Eds.), Handbook of industrial and organizational psychology. (2nd ed.) V. 2. Palo Alto, CA: Consulting Psychologists Press.
Brocka, B., & Brocka, M. S. (1992). Quality manugement: Implementing the best ideas ofthe mas- ters. Homewood, IL: Business One Irwin.
Burke, M. J . , & Day, R. R. (1986). A cumulative study of the effectiveness of managerial train- ing Journal of Applied Psychology, 71 (2), 232-245.

244 Murray, Raffaele
Campion, M. A,, & Campion, J. E. (1987). Evaluation of an interview skills training program in
Cook, T. D., & Campbell, D. 7. (1979). Quasi-Experimentation: Design and analysis issuesforfield
Crosby, P. (1979). Quality isfree: The art of making quality certain. New York: McGraw-Hill. Crosby, P. (1988). The eternally successful organization. New York: McGraw-Hill. Dyer, L. (1983). Bringing human resources into the strategy formulation process. Human Resource
Management, 22 (3), 257-271. Dyer, L. (1984). Studying human resource strategy: An approach and an agenda. lndustnal Rela-
tions, 23, 156-169. Dyer, L., & Holder, G. W. (1988). A strategic perspective of human resource management. In
L. Dyer & G. W. Holder (Eds.), Human resource management: Evolving roles and responsibilities. Washington, D.C.. Bureau of National Affairs.
Easton, G. S. (1993). The 1993 state of U.S. total quality management: A Baldridge examiner’s perspective. Calfornia Management Review, 35 (3), 32-54.
George, S. (1992). The Baldridge quality system. New York. Wiley. Gerhart, B. (1988). Sources of variance in incumbent perceptions of job complexity. Journal of
Applied Psychology, 73, 154-162. Gerhart, B., & Milkovich, G. T. (1990). Organizational differences in managerial compensation
and financial performance. Academy of Management Journal, 33 (4), 663-691. Gist, M. E. (1989). The influence of training method on self-efficacy and idea generation among
managers. Personnel Psychology, 42, 787-805. Gist, M. E., Schwoerer, C., & Rosen, B. (1989). Effects of alternative training methods on self-
efficacy and performance in computer software training. journal of Applied Psychology, 74,
a natural field setting. Personnel Psychology, 40, 675-691.
settings. Boston: Houghton-Mifflin.
884-89 1. Greene, W. H. (1993). Econometric analysis. (2nd ed.) New York: Macmillan. Hand, H. H . , & Slocum, Jr., J . W. (1972). A longitudinal study of the effects of a human rela-
tions training program on managerial effectiveness. Journal of Applied Psychology, 56, 4 12-41 7. Hatcher, L. & Ross, T. (1991). From individual incentives to an organizationwide gainsharing
plan: Effects on teamwork and product quality. Journal of Organizational Behavior, 12, 169-183. Hausman, J. A. & Taylor, W. E. (1981). Panel data and unobservable individual effects. Econo-
metrica, 49, 1377-1398. Jackson, S. E. & Schuler, R. S. (1995). Understanding human resource management in the con-
text of organizations and their environments. Annual Review of Psychology, 46, 237-264. Judge, G. G., Griffiths, W. E., Hill, R. C., Lutkepohl, H., & Lee, T. (1985). The theory andprac-
tice ofeconometrics. (2nd ed.) New York: Wiley. Juran, J. (1992). Juran on quality by design. New York: Free Press. Krishnan, R., Shani, A,, Grant, R., & Baer, R. (1993). In search of quality improvement: Prob-
lems of design and implementation. The Academy of Management Executive, 7 (4), 7-20. Lawler, E. E., &Jenkins, G. D. (1992). Strategic reward systems. In M. D. Dunnette & L. M.
Hough (Eds.), Handbook of industrial and organizational psychology. (2nd ed.) V. 3. Palo Alto, CA: Consulting Psychologists Press.
Mathieu, J. E., & Leonard, R. L. (1987). Applying utility concepts to a training program in super- visory skills: A time-based approach. Academy of Manugement]ournal, 30 (2), 316-335.
Milkovich, G. T. (1988). A strategic perspective on compensation management. Research in Per- sonnel and Human Resource Management, 6, 263-288.
Moras, R. G., Sanchez, C. M., &Ford, R. G. (1994). Quality success stones in San Antonio indus- try. Production and Inventory ManagementJournal, 35 (4), 36-41.
Murray, B., & Gerhart, B. (1994). A field study of early organizational outcomes from the intro- duction of a skill-based pay program. Working Paper 94-26. Center for Advanced Human Resource Studies, Comell University, Ithaca, New York.
Noe, R. A., & Ford, J . K. (1992). Emerging issues and new directions for training research. Research in Personnel and Human Resource Management, 10, 345-384.
2 45 Evaluution of Quality Awareness Training
Powell, T. C. (1995). Total Quality Management as a competitive advantage: A remew and empir- ical study. Strategic Management Journal, 16, 15-37.
Pritchard, R. D (1992). Organizational productivity. In M. D. Dunnette & L. M. Hough (Eds.), Handbook of industrial and organizational psychology. (2nd ed.) V. 3. Palo Alto, CA. Consulting Psychologists Press.
Raghuram, 5. (1994). Linking staffing and training practices with business strategy: A theoreti- cal perspective. Human Resource Development Quarterly, 5 (3), 237-25 1.
Schmidt, F. L., Hunter, J . E , McKenzie, R. C., & Muldrow, T. W. (1979). Impact of valid selec- tion procedures on workforce productivity. Journal of Applied Psychology, 64 (6), 609-626.
Schmidt, F. L., Hunter, J . E., & Pearlman, K. (1982). Assessing the economic impact of person- nel programs on workforce productivity. Personnel Psychology, 3.5, 333-347.
Schonberger, R. J . (1992). Total Quality Management cuts a broad swath-Through manufac- turing and beyond. Organizational Dynamics, 20 (41, 16-28.
Shani, A B., & Rogberg, M. (1994). Quality, strategy, and structural configuration Journal of Organizational Change Management, 7 ( 2 ) , 15-30.
Sommer, 5. M., & Merritt, D. E. (1994). The impact of a TQM intervention on workplace atti- tudes in a health-care organization. Journal of Organizational Change Managrment, 7 (21, 53-62.
Tichy, N M., Fombrun, C. J . , & Devanna, M. A (1984) The organizational context of human resource management In C J Fomhrun, N . M . Tichy, & M A. Devanna (Eds.), Strutegic human resource management. New York. Wiley.
Wagner, J . , Ruhin, P., & Callahan, T. (1989). Incentive payment and nonmanagerial productiv- ity: Interrupted time-series analysis of magnitude and trend. Orgunizational Behavior and Human Decision Processes, 42, 47-74.
_ _ .~
Walton, M. (1986). The Deming management method. New York: Pedigree.
Brian Murray is assistant projestor of human resource management, University o/ Texas, San Antonio
a Gary C. Raffele is associate professor of human resource management, University of Texas, Sun Antonio.