
Single point active alignment method (SPAAM) for optical ... · ied extensively in the computer...
32
MANUSCRIPT — The final version of this article has appeared in the journal Presence: Teleoperators and Virtual Environments, Vol. 11, Issue 3, pp. 259–276, June 2002, published by the MIT Press. Single point active alignment method (SPAAM) for optical see-through HMD calibration for augmented reality Mihran Tuceryan Yakup Genc Nassir Navab Dept. of Computer and Information Sci. Siemens Corporate Research Indiana Univ Purdue Univ Indianapolis (IUPUI) Imaging and Visualization Department Indianapolis, IN 46202-05132, USA Princeton, NJ 08540, USA [email protected] ygenc,navab @scr.siemens.com January, 2002 Abstract Augmented reality (AR) is a technology in which a user’s view of the real world is en- hanced or augmented with additional information generated from a computer model. In order to have a working AR system, the see-through display system must be calibrated so that the graphics is properly rendered. The optical see-through systems present an additional challenge because, unlike the video see-through systems, we do not have direct access to the image data to be used in various calibration procedures. This paper reports on a calibration method we developed for optical see-through head- mounted displays. We first introduce a method for calibrating monocular optical see-through display (i.e., a display for one eye only) and then extend it to stereo optical see-through displays in which the displays for both eyes are calibrated in a single procedure. The method integrates 1
Transcript of Single point active alignment method (SPAAM) for optical ... · ied extensively in the computer...

MANUSCRIPT — The final version of this article has appeared in the journal Presence: Teleoperators andVirtual Environments, Vol. 11, Issue 3, pp. 259–276, June 2002, published by the MIT Press.
Single point active alignment method (SPAAM) for
optical see-through HMD calibration for augmented
reality
Mihran Tuceryan� Yakup Genc� Nassir Navab�
�Dept. of Computer and Information Sci. �Siemens Corporate Research
Indiana Univ Purdue Univ Indianapolis (IUPUI) Imaging and Visualization Department
Indianapolis, IN 46202-05132, USA Princeton, NJ 08540, USA
[email protected] �ygenc,navab�@scr.siemens.com
January, 2002
Abstract
Augmented reality (AR) is a technology in which a user’s view of the real world is en-
hanced or augmented with additional information generated from a computer model. In order
to have a working AR system, the see-through display system must be calibrated so that the
graphics is properly rendered. The optical see-through systems present an additional challenge
because, unlike the video see-through systems, we do not have direct access to the image data
to be used in various calibration procedures.
This paper reports on a calibration method we developed for optical see-through head-
mounted displays. We first introduce a method for calibrating monocular optical see-through
display (i.e., a display for one eye only) and then extend it to stereo optical see-through displays
in which the displays for both eyes are calibrated in a single procedure. The method integrates
1

the measurements for the camera and a six-degrees-of-freedom tracker which is attached to the
camera in order to do the calibration. We have used both an off-the-shelf magnetic tracker as
well as a vision-based infrared tracker we have built. In the monocular case, the calibration
is based on the alignment of image points with a single 3D point in the world coordinate sys-
tem from various viewpoints. In this method, the user interaction to perform the calibration is
extremely easy compared to prior methods, and there is no requirement for keeping the head
static while doing the calibration. In the stereo calibration case, the user aligns a stereoscop-
ically fused 2D marker, which is perceived in depth, with a single target point in the world
whose coordinates are known. As in the monocular case there is no requirement that the user
keep his head fixed.
1 Introduction
In a typical AR system, the view of a real scene is augmented by superimposing the computer
generated graphics on this view such that the generated graphics are properly aligned with real
world objects as needed by the application. The graphics are generated from geometric models of
both non-existent (virtual) objects and real objects in the environment. In order for the graphics
and the video to align properly, the pose and optical properties of the real and virtual cameras must
be the same. The position and orientation of the real and virtual objects in some world coordinate
system must also be known. The locations of the geometric models and virtual cameras within
the augmented environment may be modified by moving its real counterpart. This is accomplished
by tracking the location of the real objects and using this information to update the corresponding
transformations within the virtual world. This tracking capability may also be used to manipulate
purely virtual objects, ones with no real counterpart, and to locate real objects in the environment.
Once these capabilities have been brought together, real objects and computer-generated graph-
ics may be blended together, thus augmenting a dynamic real scene with information stored and
processed on a computer.
In order for augmented reality to be effective the real and computer-generated objects must be
accurately positioned relative to each other and properties of certain devices must be accurately
2

specified. This implies that certain measurements or calibrations need to be made at the start
of the system. These calibrations involve measuring the pose of various components such as the
trackers, pointers, cameras, etc. What needs to be calibrated in an AR system and how easy or
difficult it is to accomplish this depends on the architecture of the particular system and what types
of components are used.
There are two major modes of display which determine what types of technical problems arise
in augmented reality systems, what the system architecture is, and how these problems are to be
solved: (i) video-see-through AR systems and (ii) optical see-through AR systems. The calibration
issues in a video-see-through system was described in detail elsewhere (Tuceryan et al., 1995). We
define an optical see-through system as the combination of a see-through head-mounted display
and a human eye. We will call this display and eye combination the virtual camera of the AR
display system.
In this paper, we look at the calibration issues in an AR system of the second type, namely,
an optical see-through system. In particular, we concentrate on the camera calibration in both
monocular optical see-through displays and stereo optical see-through displays and describe a
method of calibration in such a system.
2 Previous Work
Research in augmented reality is a recent but expanding activity. We briefly summarize the research
conducted to date in the topic of calibration for augmented reality.
Calibration has been an important aspect of research in augmented reality, as well as in other
fields, including robotics and computer vision. Camera calibration, in particular, has been stud-
ied extensively in the computer vision community (Maybank & Faugeras, 1992; Weng, Cohen, &
Herniou, 1992; Lenz & Tsai, 1988). Its use in computer graphics, however, has been limited. Deer-
ing (Deering, 1992) has explored the methods required to produce accurate high resolution head-
tracked stereo display in order to achieve sub-centimeter virtual to physical registration. Azuma
and Bishop (Azuma & Bishop, 1994), and Janin et al. (Janin, Mizell, & Caudell, 1993) describe
techniques for calibrating a see-through head-mounted display. Janin’s method comes closest to
3

our approach in terms of its context and intent. In this paper, they do consider the tracker in the
loop so that the user is free to move during calibration. There are differences between our and their
method. The first difference is that we use only a single point in the world for calibration. They
use a calibration object with multiple points so that the user has to make an extra decision about
picking the calibration point and its image. The use of a single calibration point at a time, instead
of a multipoint configuration aligned simultaneously, simplifies the user interaction process which
is very important. In the past, we also have implemented interactive calibration schemes which
require the simultaneous alignment of multi-point configurations in order to perform the camera
calibration (McGarrity & Tuceryan, 1999). We have found that this makes the user-interaction dur-
ing the calibration process very cumbersome. The second difference is that they use the traditional
intrinsic and extrinsic camera parameterization to model the virtual camera. This requires that a
set of non-linear equations be solved in order to get the calibration results. We use a projection
matrix representation to model the camera which can be estimated by linear methods, making the
result of the calibration more robust. We do not need to extract anything more than the projection
matrix because ultimately what we want to do is to project the 3D objects onto the image plane.
The projection matrix has also been found to be more accurate and less sensitive to data collection
errors (Navab et al., 1998). Recently, Kato and Billinghurst describe an interactive camera cali-
bration method (Kato & Billinghurst, 1999) that uses multiple points on a grid. Gottschalk and
Hughes (Gottschalk & Hughes, 1993) present a method for auto-calibrating tracking equipment
used in AR and VR.
Some researchers have studied the calibration issues relevant to head mounted displays (Bajura,
Fuchs, & Ohbuchi, 1992; Caudell & Mizell, 1992; Azuma & Bishop, 1994; Holloway, 1994, 1997;
Kancherla, Rolland, Wright, & Burdea, 1995). Others have focused on monitor based approaches
(Tuceryan et al., 1995; Betting, Feldmar, Ayache, & Devernay, 1995; Grimson et al., 1995; Henri
et al., 1995; Mellor, 1995; Peria et al., 1995; Uenohara & Kanade, 1995). Both approaches can be
suitable depending on the demands of the particular application.
Various tracking modalities, beside the magnetic trackers have been used by numerous re-
searchers. Among those, vision based trackers that use fiducials have been implemented (Koller
4
et al., 1997; Neumann & Cho, 1996; Sauer et al., 2000). Some researchers have also tried to
improve the robustness and accuracy of these trackers using hybrid methods (State, Hirota, Chen,
Garrett, & Livingston, 1996).
Kutulakos et al. have taken a different approach and demonstrated a calibration-free AR system
(Kutulakos & Vallino, 1996). These uncalibrated systems work in contexts in which using metric
information is not necessary and the results are valid only up to a scale factor.
3 Overview of the Hardware and Software
In order to provide the proper context in which to describe our calibration method, and also for
the sake of completeness, we briefly review the hardware and software setup. The typical optical
see-through AR system hardware is illustrated in Figure 1. In this configuration, the display con-
sists of a pair of see-through head-mounted displays (HMD). In our setup, we use the i-glassesTM
that can be used both as immersive displays as well as see-through displays by removing a piece of
opaque plastic from the front of the display screens. Since our research involves augmented reality
systems, we have been using these HMD’s as see-through displays permanently. The graphical im-
age is generated by the workstation graphics hardware and displayed on the workstation’s monitor
which is fed at the same time to the see-through displays (i-glassesTM) over a VGA port. This setup
also works for other, possibly higher resolution displays, such as the Sony Glastron or the Micro-
vision VRD. The tracker can be any system that is capable of providing six degrees of freedom
(three positional and three rotational). For the work reported in this paper, we have used both a six-
degrees-of-freedom (6-DOF) magnetic tracker (Flock-of-Birds from Ascension Technologies) and
an infra-red vision based tracker that we have built ourselves. The tracker provides the worksta-
tion with continually updated values for the position and orientation of the tracked objects which
includes the i-glassesTM and a 3D mouse pointing device.
The software is based on the Grasp system that was developed at ECRC for the purposes of
writing AR applications. We have added the calibration capabilities to the Grasp software and
tested our methods in this environment. The Grasp software was implemented using the C++
programming language.
5

Figure 1: The hardware diagram of a typical see-through augmented reality system. The particular
see-through displays we used for this research are from i-glassesTM, and have a limited resolution
(���� ��� for each eye in monocular mode and ���� ��� for each eye in stereo mode). We have
also experimented with other displays such as the Sony Glastron and the Microvision VRD.
4 Overview of the Calibration Requirements
In an AR system there are both “real” entities in the user’s environment and virtual entities. Cal-
ibration is the process of instantiating parameter values for mathematical models which map the
physical environment to internal representations, so that the computer’s internal model matches the
physical world. These parameters may be the optical characteristics of a physical camera as well
as position and orientation (pose) information of various entities such as the camera, the magnetic
trackers, and the various objects.
The calibration requirements of a video-see-through AR system have been described elsewhere
(Tuceryan et al., 1995). In this paper, we describe these requirements as modified for an optical
see-through system. This modification for an optical see-through system is the new content of this
paper that distinguishes it from (Tuceryan et al., 1995). Figure 2 shows the local coordinate systems
relevant for camera calibration in a typical optical-see-through AR system. All the calibration
6
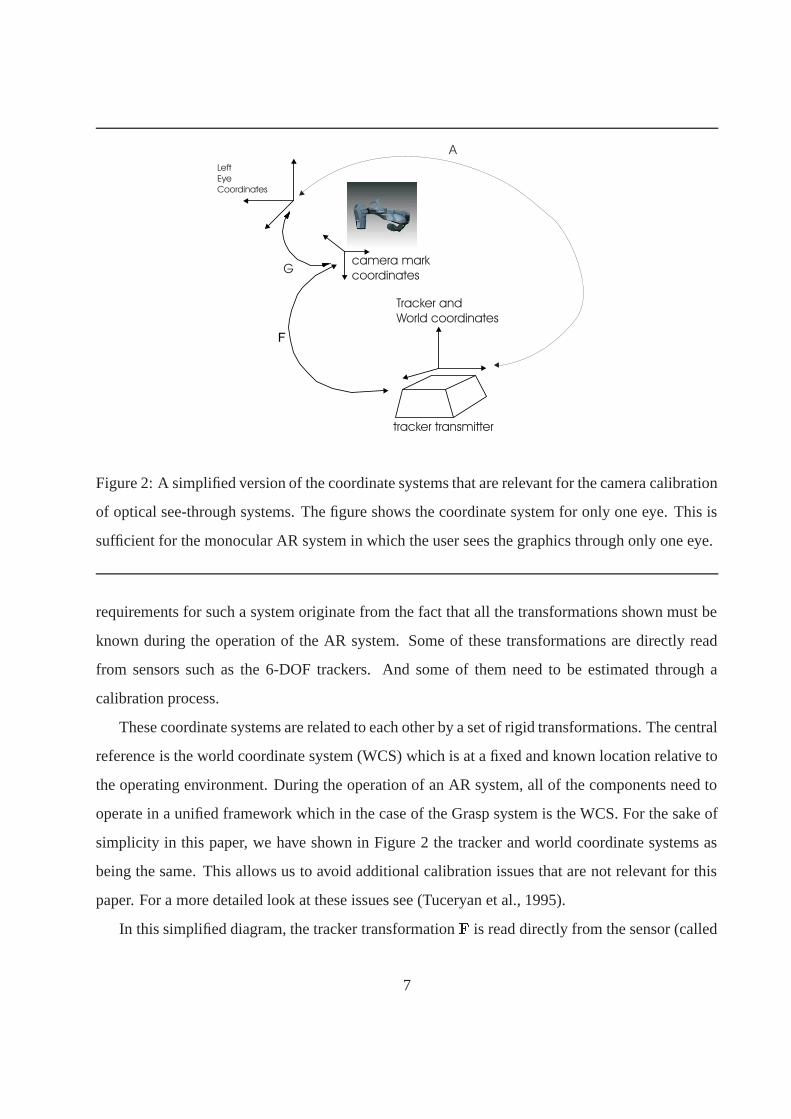
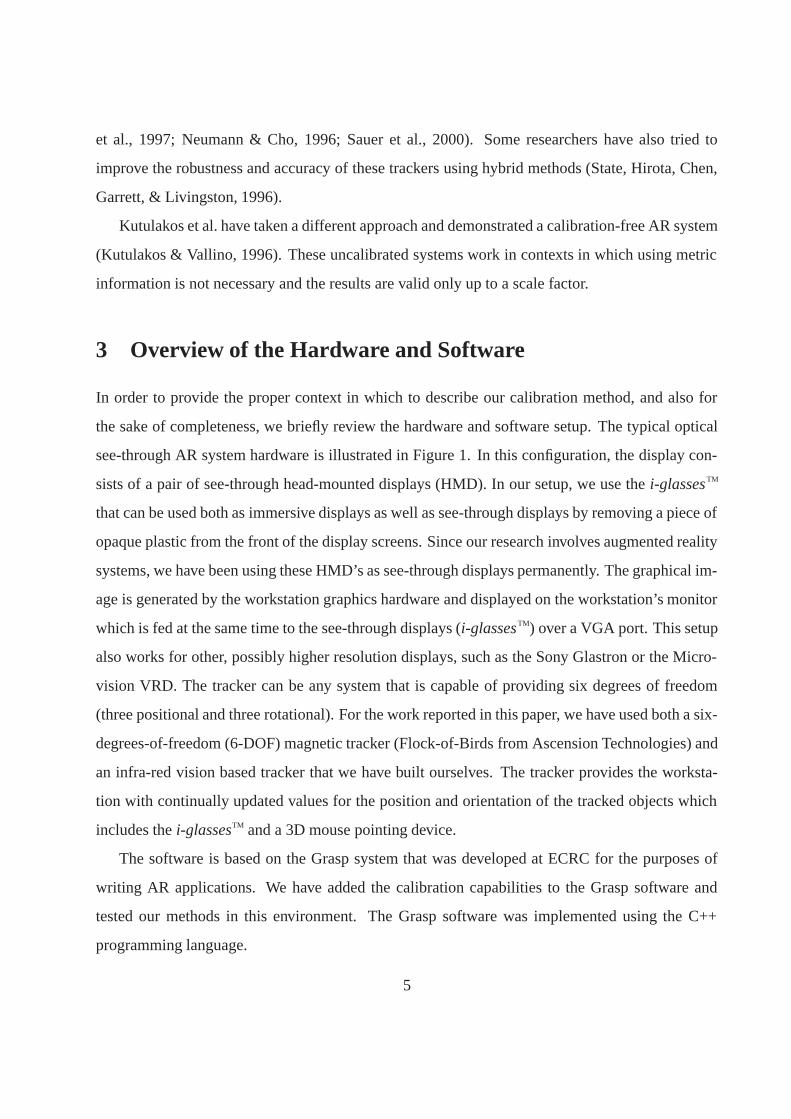
Figure 2: A simplified version of the coordinate systems that are relevant for the camera calibration
of optical see-through systems. The figure shows the coordinate system for only one eye. This is
sufficient for the monocular AR system in which the user sees the graphics through only one eye.
requirements for such a system originate from the fact that all the transformations shown must be
known during the operation of the AR system. Some of these transformations are directly read
from sensors such as the 6-DOF trackers. And some of them need to be estimated through a
calibration process.
These coordinate systems are related to each other by a set of rigid transformations. The central
reference is the world coordinate system (WCS) which is at a fixed and known location relative to
the operating environment. During the operation of an AR system, all of the components need to
operate in a unified framework which in the case of the Grasp system is the WCS. For the sake of
simplicity in this paper, we have shown in Figure 2 the tracker and world coordinate systems as
being the same. This allows us to avoid additional calibration issues that are not relevant for this
paper. For a more detailed look at these issues see (Tuceryan et al., 1995).
In this simplified diagram, the tracker transformation � is read directly from the sensor (called
7

mark) attached to the HMD. For the monocular case reported in this paper, we use only one eye
to display the graphics. The display for the other eye is covered so that the AR display is truly
monocular. The transformation � from the mark to one eye is not known and needs to be cali-
brated. The transformation� that models the camera with respect to the WCS is inferred from �
and�.
Camera calibration is the process by which the extrinsic camera parameters (location and orien-
tation) as well as the intrinsic camera parameters (focal length, image center, and aspect ratio) are
calculated for a given camera. Normally, this process would calculate the transformation labeled
� in Figure 2 as well as the camera intrinsic parameters. In the case of a video-see-through camera
calibration system, this would be the estimation of the parameters for the physical camera. In the
case of optical see-through AR system, estimating� directly would require that we collect a suf-
ficient number of 3D-2D point correspondences without moving the head and body in the process.
Because this is an almost impossible task, we choose to calibrate � (which is fixed because the
tracker sensor is rigidly attached to the HMD) and infer� from� and�. The resulting calibration
parameters describe a virtual camera which models the combined imaging system formed by the
i-glassesTM display and the human eye.
A point in the world coordinate system �� is projected on the image plane of the virtual
camera as �� with:
��� � ��� � ���� � (1)
where � is the projection matrix from tracker mark coordinate frame to the virtual image plane
and � is a scalar.
5 Camera Calibration for Optical See-through Displays
In this section, we will describe our calibration method for an optical see-through head mounted
display. After some preliminaries in Section 5.1, we describe our calibration method for monocu-
lar optical see-through head-mounted display in Section 5.2. Then we will extend it to the stereo
display case in Section 5.3. The camera calibration method described in our previous work on
8

video see-through systems was based on using the correspondence between known 3D points and
the 2D positions of their projected image positions. From this, the camera parameters were es-
timated (Tuceryan et al., 1995). This was purely for the video-see-through case in which it was
assumed that we have access to the picture points (pixels) which we can select and whose image
coordinates we can obtain. This can be done in a video-see-through display system because we
can always access the image digitized by the video camera and use it to analyze the input images.
With an optical see-through system, the images of the scene are formed on the retina of the human
user’s eye and we do not have direct access to the image pixels. Therefore, we need to have a
different approach to calibrating optical see-through systems.
The most difficult part of calibrating such a system is devising the proper user interaction
method for collecting the necessary data for performing the calibration. There have been attempts
in the past to devise such interaction methods with various degrees of success. The earlier meth-
ods tried to use multiple point configurations in the world in order to collect the calibration data.
Examples of this include Janin’s method (Janin et al., 1993). Another approach in the past has
been to have the user align a model of a 3D object with multiple configurations with the physical
object in the display interactively. In an earlier paper, we described such an interactive approach
for calibrating an optical see-through AR system (McGarrity & Tuceryan, 1999). The approach let
the user adjust camera parameters interactively until he was satisfied that a 3D model of a calibra-
tion jig was aligned properly with the physical calibration jig itself. This method worked but the
user interface was cumbersome. The major advantage of using a single point at a time makes the
alignment process during calibration a much easier task for the user. Notice also that the fact that
we are aligning a single point at a time does not preclude us from using multiple calibration points
(although we have not implemented this), but only that we need to use them one at a time. In fact,
using multiple calibration points may be one way to extend the method presented in this paper to
calibrate for trackers that extend over a large area. In addition, the number of parameters being
estimated was too large, and therefore, the interaction did not provide a very intuitive feedback to
the user. In general, we have found that using multipoint configurations and demanding that the
user align them simultaneously or use them to collect data in some fashion is cumbersome and
9

prone to errors.
The contribution of the method described in this paper is an attempt at making this interaction
easy for the user and reduce the causes of error by making the user’s task for collecting data
simple. The approach described in this paper has two major advantages compared to previous
approaches. First, it simplifies the data collection process by making the interaction very simple:
aligning a single cursor with a single point in the world. This is in contrast to the traditional camera
calibration approaches which have access to pixel data in a video buffer or to previous interactive
approaches in which the user is either required to keep his head from moving while collecting data
or the user is asked to interactively align a multiple-point configuration simultaneously. Second,
because we keep the camera model as a projection matrix without decomposing it into its intrinsic
and extrinsic components, the results are numerically more stable.
The user interaction needed to collect the data for the calibration is a streamlined process and
does not impose a great burden on the user. During this process of aligning a single cursor on the
display with a single world point, there is no interaction with a mouse or any other device to try to
move items on the display at the same time that the head is moving. These types of multiple task
interactions increase the complexity and make the calibration process more cumbersome and prone
to error (McGarrity & Tuceryan, 1999). Therefore, a major source of errors as well as a source
of difficulty in interaction is eliminated by keeping the user interaction simple in the calibration
procedure.
In the following sections, we first briefly describe the camera model we are using which defines
the parameters to be estimated. We then describe the calibration procedure for both the monocular
and the stereo displays.
5.1 Camera Model and Calibration Formulation
A simple pinhole model is used for the camera, which defines the basic projective imaging geom-
etry with which the 3D objects are projected onto the 2D image surface. There are different ways
of setting up the coordinate systems, and in our model we use a right-handed coordinate system in
which the center of projection is at the origin and the image plane is at a distance � (focal length)
10

away from it.
A pinhole camera can be modeled by a set of intrinsic and extrinsic parameters. The intrinsic
parameters are those that define the optical properties of the camera such as the focal length, the
aspect ratio of the pixels, and the location of the image center where the optical axis intersects
the image plane. One last intrinsic parameter is the skew of the image plane axes. The intrinsic
parameters are usually modeled by a �� � matrix of the form
� �
�������
�� � ��
� �� ��
� � �
�������
(2)
where �� and �� are the focal lengths in the directions of two major axes in the image plane, ��� ��
is the location of the image center, and � describes the skew between the two axes in the image
plane. The �� and �� also model the scale factor and aspect ratio in going from the sensor units to
image units. The 3D points in the world coordinate system get projected onto the image plane of
the camera to form the image points.
The extrinsic parameters define the position and orientation (pose) of the camera with respect
to some external world coordinate system and are given by a �� � rotation matrix � and a �� �
translation vector �.
The camera transformation that maps 3D world points into 2D image coordinates can be char-
acterized by writing the transformation matrices for the rigid transform defining the camera pose
and the projection matrix defining the image formation process. This is given by the classic equa-
tion
��� � ��� ���� (3)
where �� � ��� � �� � � � ��� is the homogeneous 3D coordinates of the world point and �� �
��� � �� � ��� is the homogeneous coordinates of its image. The overall camera transformation, there-
fore, is a �� � matrix
����� � ��� �� (4)
The entries of ����� can be estimated directly instead of the actual extrinsic and intrinsic
camera parameters. This estimation is a standard technique often used in computer vision. The
11

calibration proceeds by collecting a number of 2D image coordinates of known 3D calibration
points, and the correspondence between the 3D and 2D coordinates defines a linear system to be
solved in terms of the entries of the camera matrix (see Appendix A).
Normally, in traditional video cameras, this 3D-2D correspondence is done by identifying the
calibration points in a statically grabbed image of a calibration jig. In an optical see-through
display, collecting these correspondences in a similar way would require that the HMD and the
user’s head (and body) be fixed. Since this is not realistic, we have modified the data collection
process so that the user does not have to keep his head and body fixed.
5.2 Calibration Procedure for the Monocular Case
In order to get a practical calibration procedure for the see-through displays, the above formulation
needs to be converted to a user-friendly procedure. This means that the design of the way the
calibration data is collected by the user has to be thought out carefully in order to minimize the
burden on the user and the chances of making errors.
In our method, we have a tracking system that is attached to the HMD in a rigid way. The
tracker can be anything that provides 6-DOF positional and rotational data. We have used both
a magnetic tracker and an infra-red vision based tracker built by us. In our discussion in this
paper, we will normally refer to the magnetic tracker. The tracker system can read (sense) the
position and orientation of the receiver in the tracker coordinate system. For convenience we call
the tracker sensor attached to the HMD (the object to be tracked) the mark. Because the mark is
attached rigidly to the HMD, the camera can be defined and calibrated with respect to the mark
coordinate system. Therefore, taking this approach, we have the camera transformation fixed and
unaffected by the head motion. This is the reason that the head is allowed to move freely during
our calibration procedure.
Referring to Figure 2, we see three coordinate systems relevant for the monocular camera
calibration, and the transformations between them (�, �, and �). The transformation � is the
��� projective camera transformation with respect to the world coordinate system that is estimated
in traditional video-based systems,� is a ��� homogeneous transformation matrix that defines the
12

tracker mark position and orientation being sensed and updated. Finally,� is the �� � projection
matrix that defines the camera transformation with respect to the mark coordinates.
In order to calibrate the camera (i.e., estimate the transformation�) we need to get the image
coordinates of known 3D points in the world coordinate system. But � is not fixed and varies as
the user moves his head. Therefore, we obtain � indirectly by estimating the transformation �
which does not change, and computing� � ��.
Thus, the camera calibration for such a system means we need to estimate the transform �.
We have implemented the calibration procedure as follows:
1. A single point in the world coordinate system is used to collect the calibration data. This
single point in the world coordinate system is mapped to many distinct points in the mark
coordinate system as the user’s head (and body) is moved about. This is given by the formula
�� � ��� . Since � is changing as the head moves, so is, therefore, the coordinates of the
point, �� in the mark coordinate system even though�� is fixed.
2. The user is presented with a 2D marker1 on the display and is asked to move about his head
and body until the marker is aligned with the image of the single calibration point as seen
by the user (see Figure 4). The user then clicks a button on the 3D mouse and the data is
collected for calibration that consists of the image coordinates of the 2D marker �� and the
3D coordinates of the calibration point in mark coordinates �� . These collected points are
then fed into the Equation (7) (in Appendix A) which is used to estimate the transformation
�. After the matrix � is estimated, it is integrated in Grasp and OpenGL as described in
Appendix B so that the graphics is rendered correctly.
Normally, we need to collect a minimum of 6 points for the calibration. However, in order to
account for the errors and obtain a more robust result, we collect more points and use a least
squares estimation as stated in Appendix A. Notice here that the more of the tracker volume
1We use the term marker generically both here and in Section 5.4 to indicate a 2D marker on the display that the
user aligns with the calibration point in the world. The shape of this marker becomes important, particularly in the
case of the stereo calibration procedure, in order to improve the perception of alignment in depth (see Section 6 for
details).
13

the user’s head covers, the more of possible systematic errors in the tracker measurements will be
taken into account in the optimization process. The user is encouraged to move his head around
the tracker transmitter as much as possible while collecting the calibration data. It is not always
easy for the user to cover all possible angles during the calibration. For example, it is easier for the
user to move around the calibration point sideways than trying to obtain top views. The important
thing is to do the calibration from the set of viewpoints that the user will use during the operation
of the AR system. Another restriction on the user’s movements during calibration is that if the
tracker being used has any intrinsic range restrictions, naturally, the user will be restricted to those
areas. For example, most popular magnetic trackers have range restrictions from three feet to ten
feet. In this case also, the user is encouraged to cover as much of the volume that is going to
be actually used. In the case of the monocular case, we have implemented the 2D marker as a
crosshair centered on the pixel and its components have odd numbered widths. The resolution of
the marker is limited by the resolution of the display and clearly this can have an effect on the
accuracy of the result. However, even more important is how the user actually aligns this cursor
with the calibration point. Even if we tried to design the marker with great resolution, we would
still have no control over how the user aligns it during calibration. The inaccuracies in the tracker
measurements and user’s alignment are greater sources of error than the resolution of the cursor.
5.3 Calibration Formulation for Stereoscopic Displays
The extension of the above calibration method to stereo HMD displays is straightforward but we
still would like to keep the interaction method as simple and as little cumbersome as possible.
Therefore, we would like to avoid calibrating the left and right displays independently using the
above method. The stereo calibration method presents a marker to the left and right eyes of the
user with a horizontal disparity and relies on the human visual system’s ability to fuse left and right
views of a cursor to generate a marker in depth. This perceived marker in depth is then aligned
by the user with the target calibration point in the WCS. The use of stereoscopic perception to
make precise alignments is a complicated issue that has been studied by other researchers before.
For example, Nagata has studied the depth sensitivities of visual cues such as binocular parallax,
14

World Coordinate System
Calibration point
Figure 3: The world coordinate system is
fixed on the tracker transmitter box as shown
in this image.
Figure 4: The calibration procedure requires
the user to align a cursor as shown here with
a fixed point in the world.
motion parallax, and accomodation (Nagata, 1991). He has found in this work that “of the different
cues, binocular parallax is most effective at distances of less than 1m.” In most situations, the
working volume for the methods described in this paper are within this range. We also address the
perception of depth and depth accuracy later in the paper.
The camera model and the mathematics of the calibration are the same as the monocular case
presented above, but now there are two displays, a left one and a right one. The stereo setup is
summarized in Figure 5 which shows the coordinate systems that are relevant for the calibration
of a stereo optical see-through system. In this figure, we see five transformations (��, � , �,
��, and � ) that need to be estimated. The transformations�� and� are the traditional �� �
projective camera transformation with respect to the WCS. Similarly, � is a � � � homogeneous
transformation matrix that defines the tracker to mark rigid transform. That is, � is the pose of the
mark with respect to the tracker transmitter coordinate system. Finally, �� and � are the �� �
projection matrices that define the camera transformations with respect to the mark coordinates.
As in the monocular case, for simplicity we assume that the tracker and world coordinate systems
are the same. The figure can be summarized by the equations
�� � ���
15

Figure 5: Figure 2 modified to show the coordinate systems in a stereo optical see-through setting.
� � � � (5)
The calibration data is collected as a set of 3D-2D point correspondences that are then used
to solve for the camera matrices �� and � . The contribution of this part of the paper comes in
collecting the calibration data for both eyes in a single step.
5.4 Calibration Procedure for Stereoscopic Displays
The data collection procedure for calibrating the stereo displays is given below.
1. A single point in the world coordinate system is used to collect the calibration data. This
single point in the world coordinate system is mapped to many distinct points in the mark
coordinate system as the user’s head moves. This is given by the formula �� � ��� .
Since � is changing as the head moves, so is, therefore, the coordinates of the point,�� , in
the mark coordinate system even though �� is fixed.
16

2. The user is presented with 2D markers on the display for each eye placed randomly in the
2D image plane. The markers for the two eyes are slightly offset creating a disparity. The
user’s brain automatically fuses these markers and the user perceives it in 3D at a particular
location in depth. The user collects the calibration data by moving his head and body until
he aligns the perceived marker in 3D with the 3D physical calibration point (see Figure 6).
The user then clicks a button on the 3D mouse and the data is collected for calibration that
consists of the image coordinates �� of the 2D marker and the 3D mark coordinates �� of
the calibration point.
These collected points are now used to estimate the camera matrices as described in Ap-
pendix A. As in the monocular case, the user is encouraged to cover as much of the tracker
volume that will be used during the operation of the AR system.
Since we do not know what the camera geometry is before the calibration is actually performed,
we do not have a rigorous way of determining what the disparities should be for the image markers
in the left and right eyes. However, we have some rough idea about what the depth range should
be. This is determined either by the range restrictions of some trackers or by the fact as the distance
in depth of the marker from the user increases the depth acuity of the user decreases and alignment
becomes harder. With these restrictions in mind, we picked the disparities in a range that when
the HMD’s were worn, the marker in depth was roughly within arms length and within the tracker
range. This was done by trial and error. Notice that we do not need to compute the actual depth of
the marker and the values of the disparities are inputs to the calibration procedure. As long as the
disparities result in a fused marker in depth that is reasonably easy to align in depth, we have the
calibration procedure set. The disparities are also varied for the various markers presented to the
user during the data collection process.
Since we have 2D positions of the markers for both eyes when the mouse is clicked and since
the user has aligned the 3D crosshair with the 3D world point, this is equivalent to having the two
markers in the two eyes aligned with the corresponding images of the world point. Therefore, at
the moment that the mouse button is clicked and calibration data data in the form of �� and �� is
collected for both left and right eyes simultaneously. In particular, we have the crosshair position
17
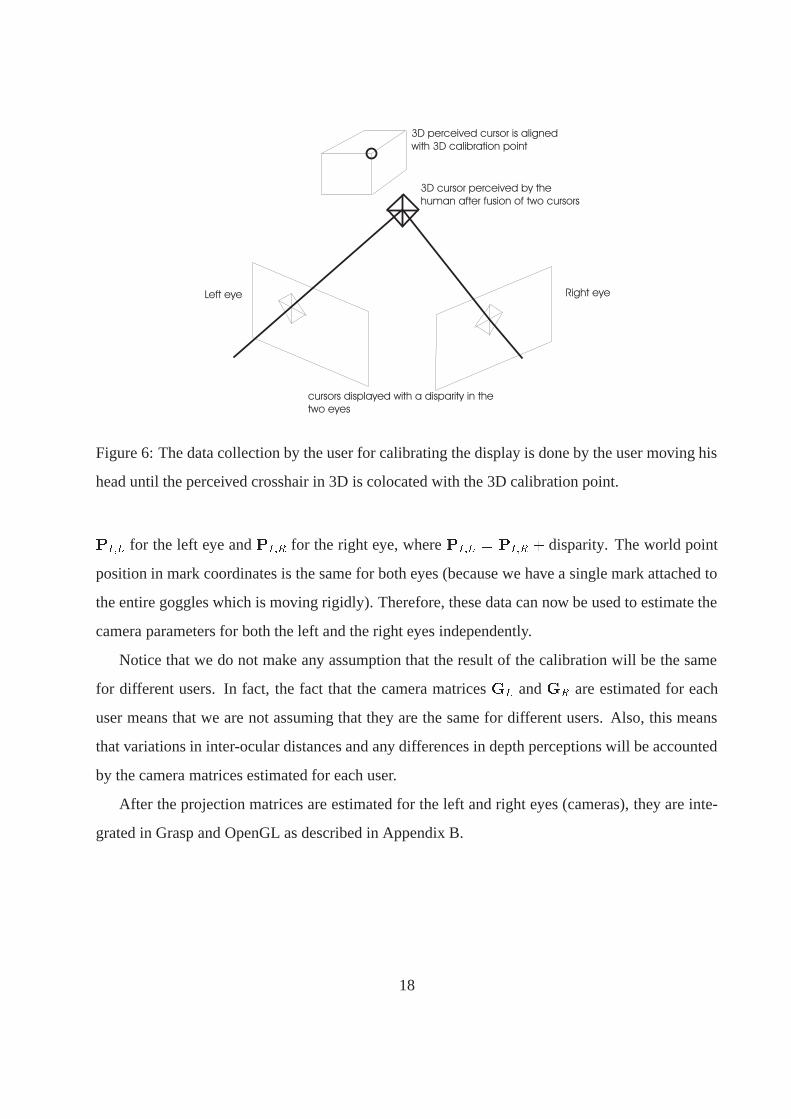
Figure 6: The data collection by the user for calibrating the display is done by the user moving his
head until the perceived crosshair in 3D is colocated with the 3D calibration point.
���� for the left eye and ��� for the right eye, where ���� � ��� disparity. The world point
position in mark coordinates is the same for both eyes (because we have a single mark attached to
the entire goggles which is moving rigidly). Therefore, these data can now be used to estimate the
camera parameters for both the left and the right eyes independently.
Notice that we do not make any assumption that the result of the calibration will be the same
for different users. In fact, the fact that the camera matrices �� and � are estimated for each
user means that we are not assuming that they are the same for different users. Also, this means
that variations in inter-ocular distances and any differences in depth perceptions will be accounted
by the camera matrices estimated for each user.
After the projection matrices are estimated for the left and right eyes (cameras), they are inte-
grated in Grasp and OpenGL as described in Appendix B.
18

6 Experimental Verification for Calibration
A serious problem with the verification of an optical see-through display calibration is that it is not
possible to show how well the model corresponds with the object for a human viewer. This is a
difficult task for the monocular displays, but it gets even more difficult to show quantitative results
for the stereoscopic displays.
There are a number of ways to approach this problem from simple to more complex. The first
and simplest approach to either type of display is to have a human put the HMD’s on, go through
the calibration procedure, and report whether the result is “good” or “bad”. We have used this
approach with a number of users. In fact, we did set up demo sessions at International Workshop
on Augmented Reality (IWAR ’99) and at International Symposium on Augmented Reality (ISAR
’00) where many users tried the calibration scheme within the live demo setting. The results of
these trials were generally positive. Many users who tried the calibration were satisfied with the
resulting accuracy of the calibration. However, we have no way of reporting any objective data on
these experiments.
A second and a more complicated approach is to replace the human eye with a video camera in
some fashion in the optical-see-through displays and apply the calibration method via this camera
(with the displays). This allows us to obtain video images of the procedure as well as the results.
We have built a setup in which a camera is put in a mannequin’s head behind the i-glassesTM
displays and the display is recorded (see Figure 7). The images in Figures 4, 8, and 9 were collected
using this setup. Figure 4 shows the view of the user during the monocular calibration in which the
cursor is aligned with the world point in the display. A sample result of the monocular calibration
is shown in Figure 8 in which a model of the calibration pattern defining the world coordinate axes
is shown superimposed on the image of the real tracker with the world coordinate system on it.
We have tried this calibration method in numerous trials and in all instances the calibration results
are very good. The quality of the alignment shown in Figure 8 is representative of the calibration
results in these trials. The quality of the calibration results does not change greatly as the head
moves around in the world. The only problem is due to the lag in the readings from the magnetic
tracker which tends to settle down to the correct position after a certain delay after the head stops
19
moving.
Figure 7: A mannequin’s head with a camera placed at the eye behind the i-glassesTM displays.
This setup was built so that we could collect images during and after the calibration of the HMD.
In the case of using magnetic trackers, some of the factors that affect the calibration include the
distance of the user’s head from the tracker transmitter and how quickly the user clicks the mouse
to collect the calibration data. The magnetic tracker we use has a range of about 3 feet and the
quality of the sensor readings are not very reliable when the receivers operate near the boundaries
of this range. The problems arising from this can be alleviated if an extended range tracker is used
that has a larger operational volume (about 10 feet). The second factor that affects the calibration
is the lag in the tracker data at the point of collection (i.e., when the mouse is clicked). If the button
is clicked too quickly, the tracker data read may not correspond to where the user’s head is. We
have found that if the user is careful during the calibration, both of these factors can be put under
control and the calibration results are good.
A third way in which we can try to quantify the accuracy of our results of calibration is to use
a video-see-through setup and calibrate it using the method described in this paper. This does not
exactly match the conditions and optics of the optical-see-through displays, but it approximates
them. In the process, it also allows us to capture the event on video and later analyze the accuracy
of the results. Therefore, we have also implemented the calibration procedure described in this
paper in a video see-through system.
20
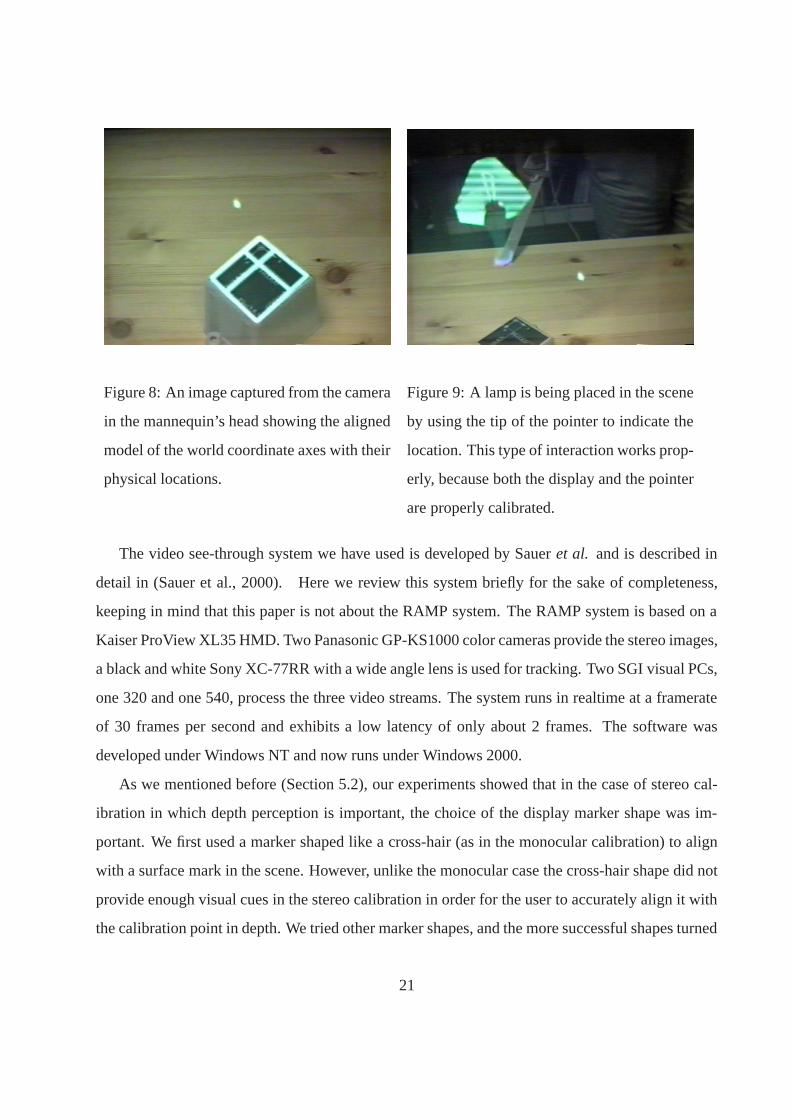
Figure 8: An image captured from the camera
in the mannequin’s head showing the aligned
model of the world coordinate axes with their
physical locations.
Figure 9: A lamp is being placed in the scene
by using the tip of the pointer to indicate the
location. This type of interaction works prop-
erly, because both the display and the pointer
are properly calibrated.
The video see-through system we have used is developed by Sauer et al. and is described in
detail in (Sauer et al., 2000). Here we review this system briefly for the sake of completeness,
keeping in mind that this paper is not about the RAMP system. The RAMP system is based on a
Kaiser ProView XL35 HMD. Two Panasonic GP-KS1000 color cameras provide the stereo images,
a black and white Sony XC-77RR with a wide angle lens is used for tracking. Two SGI visual PCs,
one 320 and one 540, process the three video streams. The system runs in realtime at a framerate
of 30 frames per second and exhibits a low latency of only about 2 frames. The software was
developed under Windows NT and now runs under Windows 2000.
As we mentioned before (Section 5.2), our experiments showed that in the case of stereo cal-
ibration in which depth perception is important, the choice of the display marker shape was im-
portant. We first used a marker shaped like a cross-hair (as in the monocular calibration) to align
with a surface mark in the scene. However, unlike the monocular case the cross-hair shape did not
provide enough visual cues in the stereo calibration in order for the user to accurately align it with
the calibration point in depth. We tried other marker shapes, and the more successful shapes turned
21

out to give the perception of a plane with an orientation as well as the depth. So, for example, a
solid disk or a rhombus shape with a cross inside it worked better. With the plane of the marker
pointing in a certain direction as the user moved towards the calibration point made the alignment
in depth a little easier. We discovered that the user could improve this accuracy by moving back
and forth in depth to see when the calibration point was crossing the plane of the marker.
One of the most important issues we were interested in addressing was to find out the degree
of accuracy of the stereo alignment process described above. Since our video see-through system
provided us with the complete tracking and calibration parameters, we conducted the following
experiment to assess the accuracy of the alignment process. We first set the disparity between the
left and right images of the virtual marker such that it is at some distance away from the user.
Using the calibration parameters obtained for the two cameras providing the stereo image stream
for the HMD, we computed the position of the virtual object in the tracker coordinate system. We
then let the users do the alignment from different positions for the same disparity many times.
With a fixed disparity the users can move their head on a sphere centered at the physical target.
Therefore, when the virtual marker and the physical target are aligned, the different positions of
the user’s head should be at the same distance to the physical target. We recorded some 15-35 such
alignments per user for two different disparity values (resulting in marker distance of 750mm and
720mm). We found in each case that these alignments resulted in an average distance very close
to the measured ones with a standard deviation of around 1mm or better. Figure 10 shows the
results of multiple trials of depth alignment for a typical user. As can be observed from the graph,
the alignment is very consistent over the trials for the particular user. We have also tried for other
users and the results are comparable to this example.
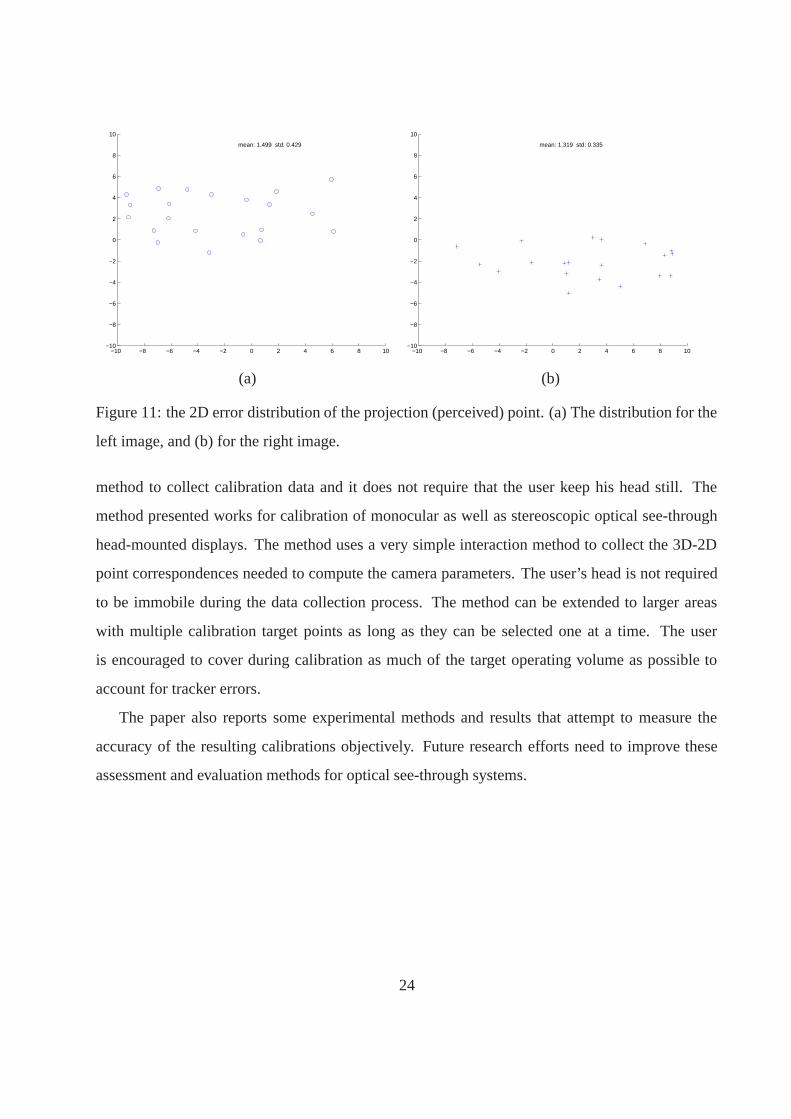
We also conducted some experiments to assess the reprojection errors for the estimated projec-
tion matrices. The results are presented in Figure 11 which shows the results for two experiments
on one user. The experiments were run for three different users and the results from the other users
are comparable to the results in this figure. Figure 11(a) shows the reprojection errors in the left
image of the perceived 3D point picked by the user (i.e., the cursor is aligned with the target point).
Figure 11(b) shows the reprojection errors in the right image for the same data. Each point in this
22

5 10 15 20 25 30 35
708
710
712
714
716
718
720
722
Alignment on a Fixed Point by one user for 36 trials
mean = 719.2mm std = 1.002mm
ground truth distance = 720mm
Var
iatio
n in
Rad
ius
(mm
)
Trial number2 4 6 8 10 12 14
740
742
744
746
748
750
Alignment on a Fixed Point by one user for 15 trials
mean = 748.5 std = 0.684
ground truth distance = 750mm
Var
iatio
n in
Rad
ius
(mm
)
Trial number
(a) (b)
Figure 10: Experimental results of measuring the accuracy of the depth judgment for the perceived
marker. (a) shows the alignment results for the ground truth distance of 720mm over 36 trials
(x-axis) for one of the users, and (b) shows the alignment results for the ground truth distance of
750mm over 15 trials for the same user.
figure represents one of the data points collected. As can be seen from the data, the uncertainty in
the horizontal direction is larger than in the vertical direction. This is not surprising since the depth
perception depends on the horizontal disparity in our setup. The mean error for the left image is
1.499 pixels with a standard deviation of 0.429. For the right image the mean reprojection error
is 1.319 pixels with a standard deviation of 0.335. The results are similar for the other users not
shown in this figure. As it can be seen from this figure, the reprojection errors are quite low, less
than 1.5 pixels on the average.
7 Conclusion
In this paper, we presented a camera calibration procedure for optical see-through head-mounted
displays for augmented reality systems. Because in optical see-through augmented reality systems
we do not have direct access to the image produced on the retina, the procedure needs to use
indirect methods to do the calibration. The method presented in this paper uses an interactive
23
−10 −8 −6 −4 −2 0 2 4 6 8 10−10
−8
−6
−4
−2
0
2
4
6
8
10
mean: 1.499 std: 0.429
−10 −8 −6 −4 −2 0 2 4 6 8 10−10
−8
−6
−4
−2
0
2
4
6
8
10
mean: 1.319 std: 0.335
(a) (b)
Figure 11: the 2D error distribution of the projection (perceived) point. (a) The distribution for the
left image, and (b) for the right image.
method to collect calibration data and it does not require that the user keep his head still. The
method presented works for calibration of monocular as well as stereoscopic optical see-through
head-mounted displays. The method uses a very simple interaction method to collect the 3D-2D
point correspondences needed to compute the camera parameters. The user’s head is not required
to be immobile during the data collection process. The method can be extended to larger areas
with multiple calibration target points as long as they can be selected one at a time. The user
is encouraged to cover during calibration as much of the target operating volume as possible to
account for tracker errors.
The paper also reports some experimental methods and results that attempt to measure the
accuracy of the resulting calibrations objectively. Future research efforts need to improve these
assessment and evaluation methods for optical see-through systems.
24

Appendix A Standard Camera Calibration Formulation
The standard projective camera calibration is set up as follows. Let there be calibration points
whose image coordinates we measure. There are 12 parameters of the � � � projection matrix
we need to estimate. But the projection matrix is defined up to a scale factor, therefore, there are
really 11 independent parameters that need to be estimated. Therefore, , the number of calibration
points to be measured, should be at least 6. However, to make the calibration results more robust
against noise and user errors, normally more data points are collected and the estimation is done
using a least squares approach.
Let the ��� measurement point have homogeneous mark coordinates���� � ������ ����� ���� ���
and its image point have homogeneous image coordinates ���� � ���� ��� ��� . The basic camera
equation is given by
����� � ����� for � � �� � � � � (6)
This gives us a linear equation to solve for the entries of the �� � camera matrix�:
� � (7)
in which is the unknown parameter vector that consists of all the entries � ��� of the� matrix put
into a column vector. The coefficient matrix � is given by
� �
����������
......
......
......
......
......
......
���� ���� ��� � � � � � ������� ������� ������ ���
� � � � ���� ���� ��� � ������� ������� ������ ���...
......
......
......
......
......
...
����������
(8)
The matrix� has � rows, two rows for each data point, and 12 columns. If more than 6 points
are collected, the system is overdetermined.
Solving this equation gives us the camera matrix�. As we mentioned before there are only 11
independent parameters and the camera equation is valid up to a scale factor. Therefore, to solve
the camera Equation (7), we estimate the unknown parameter vector by minimizing ���� such
that ��� � �. This puts a constraint on the scale and reduces the number of parameters to 11.
25

The solution to this constraint minimization is found by finding the eigenvector associated with
the smallest eigenvalue (Trucco & Verri, 1998, Appendix A). In practice this is done by finding
the singular value decomposition (SVD) of the matrix � given by � � �� � , and the solution
is the column of the matrix corresponding to the smallest singular value.
Appendix B Integrating the Projection Matrix with OpenGL
Since our camera model now consists of a � � � projection matrix, we have to implement the
renderer to use a camera defined by a � � � projection matrix. Unfortunately, OpenGL does not
provide an easy interface to do this, so, we had to write a camera class in C++ that is defined by
a projection matrix, but uses a number of OpenGL calls to implement the camera. Even though,
the details presented in this section are routine, we believe that giving these details enhances the
reproducibility of the results and algrithms presented in this paper by other researchers. Therefore,
we give these details for completeness sake.
The decision to write a C++ camera class is a result of the fact that all our implementation
is done using the GRASP platform developed at ECRC which was written in C++. In fact, the
new camera class is implemented as a subclass of the GRASP camera class. In implementing this
camera class, we have to be careful that (i) the renderer does not take a performance hit, and (ii) we
do not want to extract explicit intrinsic camera parameters for doing this. So, in our implementation
we set up the viewing transformation as a Orthographic projection, but push our own constructed
viewing matrix onto the transformation stack.
In order to accomplish this, we need to create a �� � matrix that has the clipping plane infor-
mation from OpenGL as well as our estimated camera projection matrix entries. So, here are the
steps to convert it into an OpenGL viewing matrix. First, we make our �� � camera matrix� into
a � � � matrix which has the depth entries in the third row. This is accomplished by multiplying
26

the camera matrix with the transform�������������
� � �
� � �
� � ��
� � �
�������������
(9)
Here, � and are the far and near clipping planes used by OpenGL. In addition to the far and
near clipping planes, there are the top (t), bottom (b), left (l), and right (r) clipping planes, which
will be used in the equations below.
Next, we add in the entry that is used for Z-buffer quantization as defined by the matrix:�������������
� � � �
� � � �
� � � � �
� � � �
�������������
(10)
Next, we define the form of the orthographic projection matrix in OpenGL as defined by the
function call glOrtho(l,r,b,t,n,f). This is given by the matrix�������������
� � � ��� � � � ����
� � �� ��� � � ������
� � �� � � �� ����
���
� � � �
�������������
Finally, we obtain the OpenGL viewing matrix by putting all these together as follows:
��� �
������������
�������������
� � �
� � �
� � �� �
� � �
�������������
�
�������������
� � � �
� � � �
� � � �
� � � �
�������������
������������
27

�
�������������
� � � ��� � � � ����
� � �� ��� � � ������
� � �� � � �� ����
���
� � � �
�������������
28
References
Azuma, R., & Bishop, G. (1994). Improving static and dynamic registration in an optical see-
through display. In Proceedings of the 21st Annual Conference on Computer Graphics,
Orlando, FL (pp. 197–204). New York, NY: ACM Press.
Bajura, M., Fuchs, H., & Ohbuchi. (1992). Merging Virtual Objects with the Real World: Seeing
Ultrasound Imagery within the Patient. In Proceedings of the 19th Annual Conference on
Computer Graphics, Chicago, IL (pp. 203–210). New York, NY: ACM Press.
Betting, F., Feldmar, J., Ayache, N., & Devernay, F. (1995). A framework for fusing stereo images
with volumetric medical images. In Proceedings of the IEEE First International Conference
on Computer Vision, Virtual Reality and Robotics in Medicine (CVRMed’95), Nice, France
(pp. 30–39). Berlin: Springer-Verlag.
Caudell, T., & Mizell, D. (1992). Augmented reality: An application of heads-up display technol-
ogy to manual manufacturing processes. In Proceedings of the 25th Annual Hawaii Interna-
tional Conference on System Sciences (HICSS-25),Kauai, HI (Vol. II, pp. 659–669).
Deering, M. (1992). High resolution virtual reality. In Proceedings of the 19th Annual Conference
on Computer Graphics, Chicago, IL (pp. 195–202). New York, NY: ACM Press.
Gottschalk, S., & Hughes, J. (1993). Autocalibration for virtual environments tracking hardware.
In Proceedings of the 20th Annual Conference on Computer Graphics, Anaheim, CA (pp.
65–72). New York, NY: ACM Press.
Grimson, W., Ettinger, G. J., White, S., Gleason, P., Lozano-Perez, T., W. M. Wells, I., & Kikinis,
R. (1995). Evaluating and validating an automated registration system for enhanced real-
ity visualization in surgery. In Proceedings of the IEEE First International Conference on
Computer Vision, Virtual Reality and Robotics in Medicine (CVRMed’95), Nice, France (pp.
3–12). Berlin: Springer-Verlag.
29

Henri, C. J., Colchester, A., Zhao, J., Hawkes, D., Hill, D., & Evans, R. L. (1995). Registration of
3D surface data for intra-operative guidance and visualization in frameless stereotactic neu-
rosurgery. In Proceedings of the IEEE First International Conference on Computer Vision,
Virtual Reality and Robotics in Medicine (CVRMed’95), Nice, France (pp. 47–58). Berlin:
Springer-Verlag.
Holloway, R. (1994). An analysis of registration errors in a see-through head-mounted display
system for craniofacial surgery planning. Unpublished doctoral dissertation, University of
North Carolina at Chapel Hill.
Holloway, R. L. (1997). Registration error analysis for augmented reality. Presence: Teleoperators
and Virtual Environments, 6(4), 413–432.
Janin, A., Mizell, D., & Caudell, T. (1993). Calibration of head-mounted displays for augmented
reality applications. In Proceedings of the Virtual Reality Annual Symposium (VRAIS’93),
Seattle, WA (pp. 246–255).
Kancherla, A. R., Rolland, J. P., Wright, D. L., & Burdea, G. (1995). A novel virtual reality tool for
teaching dynamic 3D anatomy. In Proceedings of the IEEE First International Conference
on Computer Vision, Virtual Reality and Robotics in Medicine (CVRMed’95), Nice, France
(pp. 163–169). Berlin: Springer-Verlag.
Kato, H., & Billinghurst, M. (1999). Marker tracking and HMD calibration for a video-based aug-
mented reality conferencing system. In Proceedings of the 2nd IEEE and ACM International
Workshop on Augmented Reality (IWAR’99),San Francisco, CA (pp. 85–94).
Koller, D., Klinker, G., Rose, E., Breen, D., Whitaker, R., & Tuceryan, M. (1997). Real-time
vision-based camera tracking for augmented reality applications. In Proceedings of the Sym-
posium on Virtual Reality Software and Technology (VRST-97), Lausanne, Switzerland (p.
87-94).
Kutulakos, K. N., & Vallino, J. R. (1996). Affine object representations for calibration-free aug-
30

mented reality. In Proceedings of the Virtual Reality Annual Symposium (VRAIS’96), Santa
Clara, CA (pp. 25–36).
Lenz, R. K., & Tsai, R. (1988). Techniques for calibration of the scale factor and image center for
high accuracy 3-D machine vision metrology. IEEE Trans. on Pattern Analysis and Machine
Intelligence, 10(5), 713–720.
Maybank, S. J., & Faugeras, O. D. (1992). A theory of self calibration of a moving camera.
International Journal of Computer Vision, 8(2), 123–151.
McGarrity, E., & Tuceryan, M. (1999). A method for calibrating see-through head-mounted
displays for AR. In Proceedings of the 2nd IEEE and ACM International Workshop on
Augmented Reality (IWAR’99),San Francisco, CA (pp. 75–84).
Mellor, J. P. (1995). Real-time camera calibration for enhanced reality visualizations. In Proceed-
ings of the IEEE First International Conference on Computer Vision, Virtual Reality and
Robotics in Medicine (CVRMed’95), Nice, France (pp. 471–475). Berlin: Springer-Verlag.
Nagata, S. (1991). How to reinforce perception of depth in single two-dimensional pictures. In
S. R. Ellis (Ed.), Pictorial Communication in Virtual and Real Environments (Second Edition
ed., pp. 527–545). London: Taylor & Francis Ltd.
Navab, N., Bani-Hashemi, A., Nadar, M. S., Wiesent, K., Durlak, P., Brunner, T., Barth, K., &
Graumann, R. (1998). 3D reconstruction from projection matrices in a C-arm based 3D-
angiography system. In First International Conference on Medical Image Computing and
Computer Assisted Intervention (MICCAI), Cambridge, MA (p. 119-129).
Neumann, U., & Cho, Y. (1996). A self-tracking augmented reality system. In Proceedings of the
ACM Symposium on Virtual Reality and Applications, Hong Kong (pp. 109–115).
Peria, O., Chevalier, L., Francois-Joubert, A., Caravel, J. P., Dalsoglio, S., Lavallee, S., & Cinquin,
P. (1995). Using a 3D position sensor for registration of spect and us images of the kidney. In
31

Proceedings of the IEEE First International Conference on Computer Vision, Virtual Reality
and Robotics in Medicine (CVRMed’95), Nice, France (pp. 23–29). Berlin: Springer-Verlag.
Sauer, F., Wenzel, F., Vogt, S., Tao, Y., Genc, Y., & Bani-Hashemi, A. (2000). Augmented
workspace: Designing an AR testbed. In Proceedings of the IEEE and ACM First Interna-
tional Symposium on Augmented Reality (ISAR’00), Munich, Germany (pp. 47–53).
State, A., Hirota, G., Chen, D. T., Garrett, W. F., & Livingston, M. A. (1996). Superior augmented
reality registration by integrating landmark tracking and magnetic tracking. In Proceedings
of the 23rd Annual Conference on Computer Graphics, New Orleans, Louisiana (pp. 429–
438). New York, NY: ACM Press.
Trucco, E., & Verri, A. (1998). Introductory techniques for 3-D computer vision. Upper Saddle
River, NJ: Prentice-Hall.
Tuceryan, M., Greer, D., Whitaker, R., Breen, D., Crampton, C., Rose, E., & Ahlers, K. (1995).
Calibration requirements and procedures for a monitor-based augmented reality system.
IEEE Transactions on Visualization and Computer Graphics, 1(3), 255–273.
Uenohara, M., & Kanade, T. (1995). Vision-based object registration for real-time image over-
lay. In Proceedings of the IEEE First International Conference on Computer Vision, Virtual
Reality and Robotics in Medicine (CVRMed’95), Nice, France (pp. 13–22). Berlin: Springer-
Verlag.
Weng, J., Cohen, P., & Herniou, M. (1992). Camera calibration with distortion models and
accuracy evaluation. IEEE Trans. on Pattern Analysis and Machine Intelligence, 14(10),
965–980.
32


![Think-Pair-Share · 2017-11-13 · Think-Pair-Share What visual or physiological cues help us to perceive 3D shape and depth? Shading [Figure from Prados & Faugeras 2006] Focus/defocus](https://static.fdocuments.us/doc/165x107/5f7db3632ba38311ee1090e1/think-pair-share-2017-11-13-think-pair-share-what-visual-or-physiological-cues.jpg)


![AlstonineasanAntipsychotic:EffectsonBrainAminesand ...The separations were performed using pH-zone-refining counter-current chromatography as previously described [17]. Briefly,](https://static.fdocuments.us/doc/165x107/60d950730dde9d1199357f10/alstonineasanantipsychoticeffectsonbrainaminesand-the-separations-were-performed.jpg)