Single-photon sensitive light-in- ight...
15
Single-photon sensitive light-in-flight imaging Genevieve Gariepy, 1* Nikola Krstaji´ c, 2,3 Robert Henderson, 2 Chunyong Li, 1 Robert R. Thomson, 1 Gerald S. Buller, 1 Barmak Heshmat, 4 Ramesh Raskar, 4 Jonathan Leach 1 and Daniele Faccio 1* 1 Institute of Photonics and Quantum Sciences, Heriot-Watt University Edinburgh, EH14 4AS, UK 2 Institute for Micro and Nano Systems, University of Edinburgh, Edinburgh, UK 3 Queen’s Medical Research Institute, University of Edinburgh, Edinburgh, UK 4 Camera Culture, MIT Media Lab, MIT, Boston, USA * To whom correspondence should be addressed; E-mail: [email protected], [email protected] The ability to record images with extreme temporal resolution enables a diverse range of applications, such as fluorescence lifetime imaging, time- of-flight depth imaging and characterisation of ultrafast processes. Recently, ultrafast imaging schemes have emerged, which require either long acquisition times or raster scanning and have a requirement for sufficient signal that can only be achieved by reflecting light off an object or diffused by a strongly scattering medium. Here, we present a demonstration of the potential of single-photon detector arrays for visualisation and rapid characterisation of events evolving on picosecond time scales. The single-photon sensitivity, tem- poral resolution and full-field imaging capability enables the observation of light-in-flight in air, as well as the measurement of laser-induced plasma for- mation and dynamics in its natural environment. The extreme sensitivity 1
Transcript of Single-photon sensitive light-in- ight...

Single-photon sensitive light-in-flight imaging
Genevieve Gariepy,1∗ Nikola Krstajic,2,3 Robert Henderson,2
Chunyong Li,1 Robert R. Thomson,1 Gerald S. Buller,1
Barmak Heshmat,4 Ramesh Raskar,4 Jonathan Leach1
and Daniele Faccio1∗
1Institute of Photonics and Quantum Sciences, Heriot-Watt University
Edinburgh, EH14 4AS, UK2Institute for Micro and Nano Systems, University of Edinburgh, Edinburgh, UK3Queen’s Medical Research Institute, University of Edinburgh, Edinburgh, UK
4Camera Culture, MIT Media Lab, MIT, Boston, USA∗To whom correspondence should be addressed;
E-mail: [email protected], [email protected]
The ability to record images with extreme temporal resolution enables
a diverse range of applications, such as fluorescence lifetime imaging, time-
of-flight depth imaging and characterisation of ultrafast processes. Recently,
ultrafast imaging schemes have emerged, which require either long acquisition
times or raster scanning and have a requirement for sufficient signal that can
only be achieved by reflecting light off an object or diffused by a strongly
scattering medium. Here, we present a demonstration of the potential of
single-photon detector arrays for visualisation and rapid characterisation of
events evolving on picosecond time scales. The single-photon sensitivity, tem-
poral resolution and full-field imaging capability enables the observation of
light-in-flight in air, as well as the measurement of laser-induced plasma for-
mation and dynamics in its natural environment. The extreme sensitivity
1
and short acquisition times pave the way for real-time imaging of ultrafast
processes or visualisation and tracking of objects hidden from view.
Light was first captured in its flight by Abramson in 1978 [1], who used a holographic
technique to record the wavefront of a pulse propagating and being scattered by a white-
painted screen placed in its path. This high-speed recording technique allowed the dy-
namic observation of light phenomena like reflection, interference and focusing that are
normally observed statically [2,3]. More recently, light-in-flight holography was performed
in a scattering medium rather than using a reflective screen [4,5]. Light can also be cap-
tured in motion in a scattering medium using a streak camera that has picosecond tem-
poral resolution, thus removing the need for interferometry and coherent illumination but
requires additional hardware to raster scan the 2D scene which increases the acquisition
time to hours [6, 7]. A few other techniques possess the temporal resolution to observe
light in motion as it illuminates a scene, such as photonic mixer devices based on mod-
ulated illumination, albeit with a temporal resolution limited to a few nanoseconds [8].
Alternatively, time-encoded amplified imaging can record images at the repetition rate of
a laser by exploiting wavelength-encoded illumination of a scene and amplified detection
through a dispersive fiber, albeit with 160 ns temporal and spatial resolution [9]. Recent
studies based on computer tomography using data from multiple probe pulses enabled
reconstruction of picosecond pulse propagation phenomena in condensed media [10]. The
current challenge is to simplify data acquisition and reduce acquisition times by achieving
full imaging capability and low-light sensitivity whilst maintaining temporal resolution in
the picosecond regime.
Here we address this challenge and provide an imaging solution that simultaneously
acquires spatial and temporal information (x, y, and t). The technology we use is based
2

Figure 1: Light-in-flight measurement and data cube. a) A laser pulse is reflectingoff multiple mirrors, passing three times across the field of view of the SPAD camera(35x35 cm). The same laser is used to create a trigger sent to the camera. The SPADcamera collects scattered photons from the laser pulse. The field of view does not containthe mirrors because the scattered light coming from the mirror surfaces is much moreintense than the Rayleigh-scattered light during propagation. b) The histogram indicatesthe time of arrival of the laser pulse as measured by pixel (22, 21). The time frames, shownat 0, 1, 2, 3, and 4 ns, show the evolution of the pulse in time as it propagates across thescene. The integration of all frames gives the total path followed by the light, similarlyto what can be acquired by an EMCCD camera at maximum gain for an exposure timeof 7 s.
3
upon a two dimensional Silicon CMOS array of single-photon avalanche diode (SPAD)
detectors with each individual pixel operated in time-correlated-single-photon-counting
(TCSPC) mode [11–14]. Individual SPAD detectors are increasingly used throughout the
field of optics; in particular, their high temporal resolution has made them useful for
single-photon time-of-flight measurements [15, 16], fluorescence lifetime imaging [14] and
photon counting [17]. Recent advances in electronics have enabled the development of
arrays of SPADs, giving the capability to perform light-in-flight measurements. In these
experiments, we use a 32 × 32-pixel array that has single-photon sensitivity and acquires
time information with a resolution of 67 ps, which provides the ability to freeze the motion
of light with a blurring of only a few centimeters [18].
Results
The setup for our experiment is illustrated in figure 1. The scene is imaged onto the
SPAD array using a fisheye lens. Laser pulses propagate at 4 kHz from right to left across
the field of view and are reflected by two mirrors. Light from the laser pulses is scattered
by air molecules and then detected by the SPAD camera.
The SPAD camera is operated in time-correlated single photon counting (TCSPC)
mode: every pixel has its own picosecond timer. The timer is started by the detection
of a single photon, and stopped by the arrival of a periodic trigger, which is derived
from the laser pulses. The time between start and stop is recorded, and a histogram
of photon arrival times builds up as a number of optical pulses successively propagate
through the setup. The camera is connected directly to a computer and we acquire data
for the histograms during a ten-minute period – this corresponds to 2 million identical
pulses propagating through the setup. Use of a higher repetition rate laser (MHz) would
4
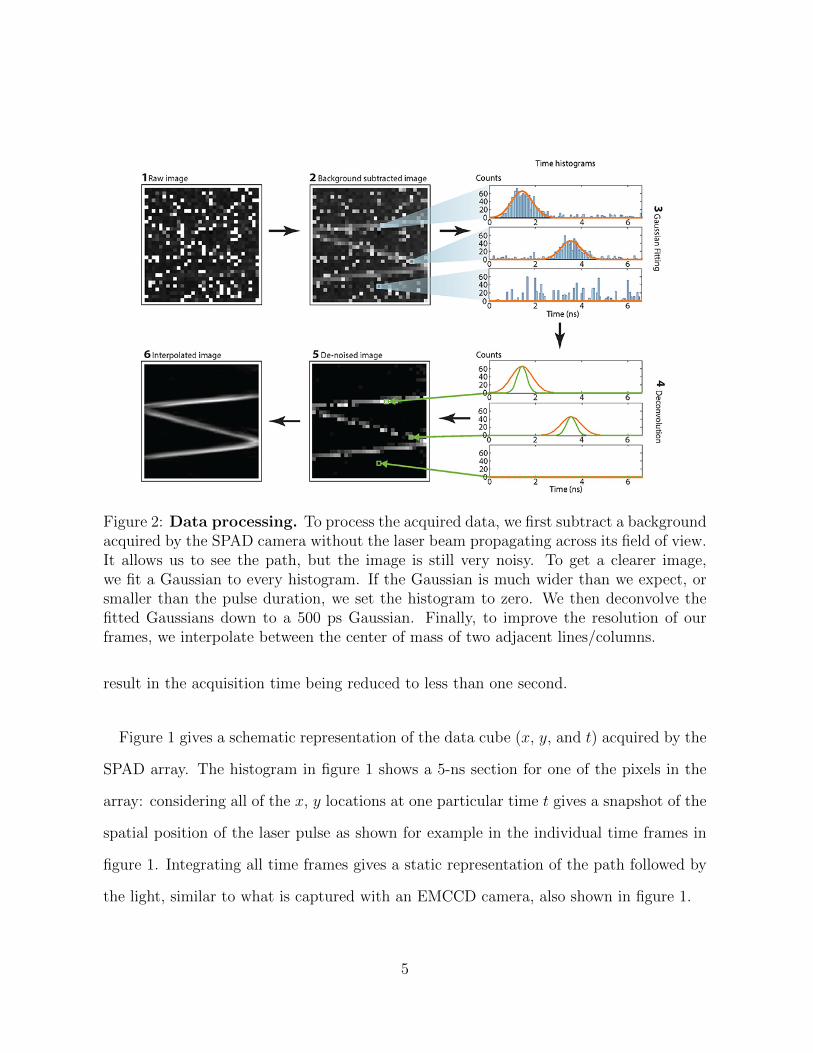
Figure 2: Data processing. To process the acquired data, we first subtract a backgroundacquired by the SPAD camera without the laser beam propagating across its field of view.It allows us to see the path, but the image is still very noisy. To get a clearer image,we fit a Gaussian to every histogram. If the Gaussian is much wider than we expect, orsmaller than the pulse duration, we set the histogram to zero. We then deconvolve thefitted Gaussians down to a 500 ps Gaussian. Finally, to improve the resolution of ourframes, we interpolate between the center of mass of two adjacent lines/columns.
result in the acquisition time being reduced to less than one second.
Figure 1 gives a schematic representation of the data cube (x, y, and t) acquired by the
SPAD array. The histogram in figure 1 shows a 5-ns section for one of the pixels in the
array: considering all of the x, y locations at one particular time t gives a snapshot of the
spatial position of the laser pulse as shown for example in the individual time frames in
figure 1. Integrating all time frames gives a static representation of the path followed by
the light, similar to what is captured with an EMCCD camera, also shown in figure 1.
5

The unique features of the three-dimensional data allow efficient data processing and
noise suppression in both the temporal and spatial dimensions. The image processing
algorithm is schematically illustrated in figure 2 that shows the time-integrated image
after each step of the data processing. Starting with the raw data, we first subtract the
background data cube acquired in the same conditions, but without the laser propagating
through the scene. Second, every time histogram is fitted with a Gaussian. For pixels con-
taining signal from the laser pulse, this fitting removes what we could call the “temporal
noise”, i.e. the noise in the time bins with no signal from the laser pulse. Moreover, some
spatial pixels are never illuminated by the laser pulse scatterings and contain only noise
and background light and are thus set to zero. We therefore use the time information
contained in each pixel to improve the spatial quality of our data. Third, we deconvolve
the instrument impulse response function (largely due to electronic jitter and measured
by uniformly illuminating the camera with a 100 fs laser pulse) from the Gaussian fits.
This results in histograms with a full width at half maximum of ∼500 ps FWHM that
is consistent with an independent measurement of the laser pulse duration. Finally, we
increase the spatial quality of the images by a standard linear re-interpolation, frame
by frame, between each line and column of the 32 × 32 pixel array as in figure 2. We
interpolate in a way that connects the center of mass of each line and column, in order
to achieve a final spatial 310x310 pixel count. Summarising, the data processing essen-
tially relies on a three-stage process composed of noise removal, temporal deconvolution
and re-interpolation: this process does not require any a priori knowledge of the scene
content itself and is therefore inherently robust. The re-interpolation process is a very
basic nearest-neighbour interpolation: no information is lost in this process and, natu-
rally, no information is gained either. More importantly, all quantitative data analysis
(e.g. the plasma decay times shown in Fig. 4 below), is always performed on the raw (not
6
interpolated) data.
The final result is shown in figure 3 where we show the evolution of the light pulse
propagating through air. The figure shows selected time frames acquired by the camera,
each separated by 0.7 ns and overlaid on a photograph (taken with a commercial DSLR
camera) of the setup. The field of view of the SPAD camera is represented by dashed lines
on each frame. In the first frame, the laser pulse has just entered the field of view. We
then see the pulse propagate and reflecting off the two mirrors in the subsequent frames,
before finally leaving the field of view. A video of the full evolution of the laser pulse
propagation is provided in the Supplementary Information. The scene that we observed,
i.e. the pulse reflecting between the three mirrors, happens within a few nanoseconds,
only a fraction of the 69 ns time range of the camera. During that time, the 500 ps pulse,
which is 15 cm long, travels 67 ps or 2 cm between each frame of the movie. The figure
(and video) clearly demonstrates that we are able to capture the full dynamic of light
propagation in air.
In these measurements, the average count rate from the detector is found to be of the
order of 0.0005 detected events per laser pulse, per pixel. Even allowing for the relatively
low fill-factor and single photon detection efficiency, this implies a photon flux of the order
of 0.2 photons per pulse, per full pixel area. The combination of single-photon sensitivity
and picosecond temporal resolution make it very difficult for detector technologies such
as intensified CCD [19] to achieve the results shown.
We also captured the dynamics of a more complex light phenomenon that is still the
object of intense research studies for various applications: the formation of a weakly
ionised plasma filament by a femtosecond laser pulse [20]. Laser pulses with 90 fs, 12 mJ
7

Figure 3: Frames of the light-in-flight movie. In these frames, we see a pulse of lightpropagating between three mirrors. The laser first hits the mirror on the right and isdirected toward the field of view of the SPAD camera, as indicated by the green arrowon the integrated image. The FOV is represented by dashed rectangles and correspondsto a 35x35 cm region. In the first and second frames, we show the laser pulse enteringthe FOV. In the second, third and fourth frames, we see the light being reflected by themirrors, before exiting the FOV in the last frame.
8
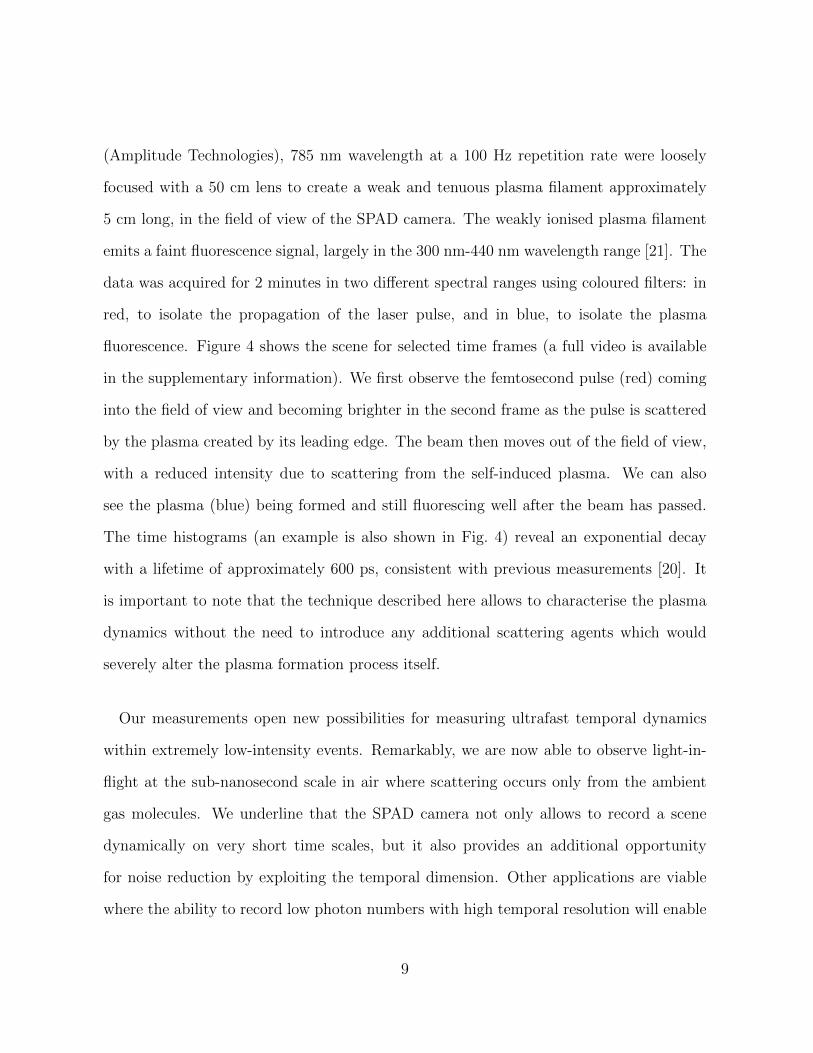
(Amplitude Technologies), 785 nm wavelength at a 100 Hz repetition rate were loosely
focused with a 50 cm lens to create a weak and tenuous plasma filament approximately
5 cm long, in the field of view of the SPAD camera. The weakly ionised plasma filament
emits a faint fluorescence signal, largely in the 300 nm-440 nm wavelength range [21]. The
data was acquired for 2 minutes in two different spectral ranges using coloured filters: in
red, to isolate the propagation of the laser pulse, and in blue, to isolate the plasma
fluorescence. Figure 4 shows the scene for selected time frames (a full video is available
in the supplementary information). We first observe the femtosecond pulse (red) coming
into the field of view and becoming brighter in the second frame as the pulse is scattered
by the plasma created by its leading edge. The beam then moves out of the field of view,
with a reduced intensity due to scattering from the self-induced plasma. We can also
see the plasma (blue) being formed and still fluorescing well after the beam has passed.
The time histograms (an example is also shown in Fig. 4) reveal an exponential decay
with a lifetime of approximately 600 ps, consistent with previous measurements [20]. It
is important to note that the technique described here allows to characterise the plasma
dynamics without the need to introduce any additional scattering agents which would
severely alter the plasma formation process itself.
Our measurements open new possibilities for measuring ultrafast temporal dynamics
within extremely low-intensity events. Remarkably, we are now able to observe light-in-
flight at the sub-nanosecond scale in air where scattering occurs only from the ambient
gas molecules. We underline that the SPAD camera not only allows to record a scene
dynamically on very short time scales, but it also provides an additional opportunity
for noise reduction by exploiting the temporal dimension. Other applications are viable
where the ability to record low photon numbers with high temporal resolution will enable
9

Figure 4: Plasma evolution recorded by light-in-flight. In these frames, the fem-tosecond pulse is shown in red, and the plasma fluorescence in blue. The plasma is createdas soon as the leading edge of the pulse passes through focus. The laser pulse is thenscattered by the plasma, which can be seen in the second frame. As a large portion ofthe beam is scattered or absorbed at the focus by the plasma, the exiting beam is weaker,as we observe in the third to fifth frames. We also see the plasma being formed at focuswhen the laser pulse is focused, then evolving and decaying after the pulse has passed. Afull video is provided in Supplementary Information. The graph shows the temporal his-togram of the plasma fluorescence (solid black curve, normalised photon counts, raw data)corresponding to the region indicated with a white square in the last frame. The dashedline is the detector impulse response function, the dotted red curve is an exponentialdecay fit with a 600 ps decay constant.
10

viewing objects that are hidden from view, for example looking around corners [22–24]
or through walls [24–26]. The single photon sensitivity of our ultrafast imaging method
enables direct spatially resolved measurements of dynamic quantum phenomena [19], and
also very weak scattering phenomena such as air-born acousto-optic effects [27].
Methods
The fisheye lens of 12-mm focal length provides a 35 cm wide field of view at the
chosen object distance of 1.8 m. The laser used to observe light reflecting off mirrors is
a 532 nm wavelength microchip laser (Teem Photonics STG 03E), which emits 500 ps
duration pulses of 3.5 µJ energy at 4 kHz repetition rate. The laser polarisation is set
to vertical to maximise scattering in the direction of the camera. Experiments repeated
in a pure Nitrogen environment (data not shown) gave identical light intensities on the
camera, thus verifying that the scattering is from air molecules and not from any possible
dust particles that may be present in a standard atmospheric environment.
The TCSPC timer of the SPAD array is operated in reverse mode, i.e. it is started
by the detection of a single photon, and stopped by the arrival of a periodic trigger. The
trigger is derived from detection of a reflection of the laser pulse with an optical constant
fraction discriminator (Becker & Hickl OCF-401). The time range of the histogram ac-
quired in TCSCP mode is 68.6 ns with a bin-width of 67 ps (determined by the 10 bit
acquisition electronics), and the median dark count rate of the pixels is 50 counts/second.
In the experiment, the SPAD camera detects an average of 0.0005 photon per pulse per
pixel, thus operating in the photon-starved regime as required for TCSPC.
Acknowledgements
11

Authors acknowledge support from the European Research Council under the European
Union’s Seventh Framework Programme (FP/2007-2013)/ERC GA 306559, the Engi-
neering and Physical Sciences Research Council (EPSRC, UK, Grants EP/J00443X/1,
EP/K03197X/1, EP/K015338), UK-STFC (grant ST/H005595/1), USAR Laboratory
and USAR Office through the ISN (contract number W9911NF-13-D-0001) and ST Mi-
croelectronics, Imaging Division, Edinburgh, for their support in the manufacture of the
Megaframe chip.
References
[1] Abramson, N. Light-in-flight recording by holography. Opt. Lett. 3, 121–123 (1978).
[2] Abramson, N. Light-in-flight recording: high-speed holographic motion pictures of
ultrafast phenomena. Appl. Opt. 22, 215–232 (1983).
[3] Abramson, N. H. & Spears, K. G. Single pulse light-in-flight recording by holography.
Appl. Opt. 28, 1834–1841 (1989).
[4] Hausler, G., Herrmann, J. M., Kummer, R. & Lindner, M.W. Observation of light
propagation in volume scatterers with 1011-fold slow motion. Opt. Lett. 21, 1087–
1089 (1996).
[5] Kubota, T., Komai, K., Yamagiwa, M. & Awatsuji, Y. Moving picture recording and
observation of three-dimensional image of femtosecond light pulse propagation. Opt.
Express 15, 14348–14354 (2007).
[6] Velten, A. et al. Femto-photography: Capturing and visualizing the propagation of
light. ACM Trans. Graph. 32, 44:1–44:8 (2013).
12
[7] Velten, A., Lawson, E., Bardagjy, A., Bawendi, M. & Raskar, R. Slow art with a
trillion frames per second camera. In ACM SIGGRAPH 2011 Talks, SIGGRAPH
’11, 44:1–44:1 (ACM, New York, NY, USA, 2011).
[8] Heide, F., Hullin, M. B., Gregson, J. & Heidrich, W. Low-budget transient imaging
using photonic mixer devices. ACM Trans. Graph. 32, 45:1–45:10 (2013).
[9] Goda, K., Tsia, K. & Jalali, B. Serial time-encoded amplified imaging for real-time
observation of fast dynamic phenomena. Nature 458, 1145-1149 (2009).
[10] Li, Z., Zgadzaj, R., Wang, X., Chang, Y.-Y. & Downer, M. C. Single-shot tomo-
graphic movies of evolving light-velocity objects. Nat Commun 5 (2014).
[11] O’Connor, D. & Phillips, D. Time-Correlated Single Photon Counting (Academic
Press, 1984).
[12] Becker, W. Advanced time-correlated single photon counting techniques, vol. 81
(Springer, 2005).
[13] Richardson, J. et al. A 32x32 50ps resolution 10 bit time to digital converter array in
130nm cmos for time correlated imaging. In Custom Integrated Circuits Conference,
2009. CICC ’09. IEEE, 77–80 (2009).
[14] Li, D.-U. et al. Real-time fluorescence lifetime imaging system with a 32x32 cmos
low dark-count single-photon avalanche diode array. Opt. Express 18, 10257–10269
(2010).
[15] Buller, G. S. & Wallace, A. Ranging and three-dimensional imaging using time-
correlated single-photon counting and point-by-point acquisition. Selected Topics in
Quantum Electronics, IEEE Journal of 13, 1006–1015 (2007).
13
[16] Kirmani, A. et al. First-photon imaging. Science 343, 58–61 (2014).
[17] Guerrieri, F., Tisa, S., Tosi, A. & Zappa, F. Two-dimensional spad imaging camera
for photon counting. IEEE Photon. J. 2, 759 (2010).
[18] Richardson, J., Grant, L. & Henderson, R. Low dark count single-photon avalanche
diode structure compatible with standard nanometer scale cmos technology. Photon-
ics Technology Letters, IEEE 21, 1020–1022 (2009).
[19] Fickler, R., Krenn, M., Lapkiewicz, R., Ramelow, S. & Zeilinger, A. Real-time
imaging of quantum entanglement. Sci. Rep 3 (2013).
[20] Couairon, A. & Mysyrowicz, A. Femtosecond filamentation in transparent media.
Physics Reports 441, 47 – 189 (2007).
[21] Xu, H., Azarm, A., Bernhardt, J., Kamali, Y. & Chin, S. The mechanism of nitrogen
fluorescence inside a femtosecond laser filament in air. Chem. Phys. 360, 171 (2009).
[22] Velten, A. et al. Recovering three-dimensional shape around a corner using ultrafast
time-of-flight imaging. Nat Commun 3, 745 (2012).
[23] Gupta, O., Willwacher, T., Velten, A., Veeraraghavan, A. & Raskar, R. Reconstruc-
tion of hidden 3d shapes using diffuse reflections. Opt. Express 20, 19096–19108
(2012).
[24] Katz, O., Small, E. & Silberberg, Y. Looking around corners and through thin turbid
layers in real time with scattered incoherent light. Nat Photon 6, 459-553 (2012).
[25] Freund, I. Looking through walls and around corners. Physica A: Statistical Me-
chanics and its Applications 168, 49 – 65 (1990).
14

[26] Popoff, S., Lerosey, G., Fink, M., Boccara, A. C. & Gigan, S. Image transmission
through an opaque material. Nat Commun 1 (2010).
[27] Heshmat, B. et al. The effect of detector distance and beam width in acousto-optical
beam deflection probing in air. J. of Opt. L. Tech 44, 734 (2012).
15


![The Impact of Single Photon SLR Technology on Large Scale ...single photon sensitive SLR2000 system and the first generation “Microaltimeter” [1]. The SPL is the most efficient](https://static.fdocuments.us/doc/165x107/5f8a88845f4c9b202d4dc7f8/the-impact-of-single-photon-slr-technology-on-large-scale-single-photon-sensitive.jpg)