Single nucleotide polymorphism (SNP)–Methods and...
25
Indian Journal of Biotechnology Vol 5 October 2006, pp 435-459 Single nucleotide polymorphism (SNP)–Methods and applications in plant genetics: A review Tabassum Jehan and Suman Lakhanpaul* Department of Botany, Delhi University, Delhi 110 007, India Received 4 April 2005; revised 21 November 2005; accepted 15 February 2006 An array of genetic markers viz. morphological, biochemical and DNA based has been used in various fields including plant genetics and crop improvement. A novel class of DNA markers namely single nucleotide polymorphisms (SNPs) has recently become highly preferred in genomic studies. They are single nucleotide base polymorphism in genomic DNA and are the most abundant class of markers. In recent times, various SNP databases have been constructed to assess the SNP data available in humans, animals and plants. Seeing the huge potential of SNPs in pharmacogenomics and crop genetics, various assays for their genotyping have been described, which include direct sequencing, mining from EST databases, cleavage assays, molecular beacons, etc. Each of these assays are having their own merits and demerits and the choice of assay depends on the objective of the study and availability of the resources. These assays utilize detection platforms that range from the conventional gel based detection to high throughput systems like microarrays, mass spectrometry and flow cytometry. SNPs have tremendous applications and prospects in crop genetics. They can be used in association studies, tagging of economic important genes, genotyping, diversity analysis and evaluation among the plant species. Keywords: single nucleotide polymorphism (SNP), genotyping assay, microarrays, application in plants, linkage disequilibrium (LD), diversity analysis IPC Code: Int. Cl. 8 C12N15/00 Introduction Genetic improvement of crop species is required to enhance their economic traits such as yield, resistance to abiotic and biotic stresses, etc. and thus forms the ultimate goal of plant breeding. The most funda- mental and important step in plant breeding pro- gramme is the selection of plants/individuals with desirable characters. The conventional method used by plant breeders for selection is the phenotypic selection where morphological/phenotypic agronomic traits such as plant height; grain yields, etc are taken into account. These can be called as phenotypic markers or morphological markers. They are visible manifestations of genes and therefore, provide some idea about the genotype. However, most of them are controlled by many genes and follow quantitative inheritance and thus are highly influenced by environment. They are also subjected to allelic interactions like epistasis or pleiotropy. Since too plastic in nature and subjected to many factors, they sometimes do not give correct picture of genetic make-up of the plants. In phenotypic markers, the extent of variation available is also limited. The dominant-recessive interactions between the alleles make it dominant marker system. Moreover, use of morphological markers excludes the analysis of non- coding sequences of genomes, which in higher plants often account for more than 95% of the total genome 1 . Further they are field requiring, that is, for phenotypic selection the accessions are first raised in field and then scored at appropriate growth stages, e.g. for scoring yield, fruiting time is to be attained. Thus, raising large populations in field up to appropriate stage makes it time, effort and labour requiring. In the field they are subjected to environmental hazards also. In some cases, a trait may not express if suitable environment/condition is not available particularly in the case of stress related genes 2 . Moreover, scoring of these markers is subjective the results may differ when scored by different breeders. These constraints make the use of phenotypic markers limited. __________________ *Author for correspondence: Tel: 91-11-27667573, 27667575 ext 1420, 1421 Fax: 91-11-27667829 E-mail: [email protected]
Transcript of Single nucleotide polymorphism (SNP)–Methods and...
Indian Journal of Biotechnology Vol 5 October 2006, pp 435-459
Single nucleotide polymorphism (SNP)–Methods and applications in plant genetics: A review
Tabassum Jehan and Suman Lakhanpaul*
Department of Botany, Delhi University, Delhi 110 007, India
Received 4 April 2005; revised 21 November 2005; accepted 15 February 2006
An array of genetic markers viz. morphological, biochemical and DNA based has been used in various fields including plant genetics and crop improvement. A novel class of DNA markers namely single nucleotide polymorphisms (SNPs) has recently become highly preferred in genomic studies. They are single nucleotide base polymorphism in genomic DNA and are the most abundant class of markers. In recent times, various SNP databases have been constructed to assess the SNP data available in humans, animals and plants. Seeing the huge potential of SNPs in pharmacogenomics and crop genetics, various assays for their genotyping have been described, which include direct sequencing, mining from EST databases, cleavage assays, molecular beacons, etc. Each of these assays are having their own merits and demerits and the choice of assay depends on the objective of the study and availability of the resources. These assays utilize detection platforms that range from the conventional gel based detection to high throughput systems like microarrays, mass spectrometry and flow cytometry. SNPs have tremendous applications and prospects in crop genetics. They can be used in association studies, tagging of economic important genes, genotyping, diversity analysis and evaluation among the plant species.
Keywords: single nucleotide polymorphism (SNP), genotyping assay, microarrays, application in plants, linkage disequilibrium (LD), diversity analysis
IPC Code: Int. Cl.8 C12N15/00 Introduction
Genetic improvement of crop species is required to enhance their economic traits such as yield, resistance to abiotic and biotic stresses, etc. and thus forms the ultimate goal of plant breeding. The most funda-mental and important step in plant breeding pro-gramme is the selection of plants/individuals with desirable characters. The conventional method used by plant breeders for selection is the phenotypic selection where morphological/phenotypic agronomic traits such as plant height; grain yields, etc are taken into account. These can be called as phenotypic markers or morphological markers. They are visible manifestations of genes and therefore, provide some idea about the genotype. However, most of them are controlled by many genes and follow quantitative inheritance and thus are highly influenced by environment. They are also subjected to allelic interactions like epistasis or pleiotropy. Since too
plastic in nature and subjected to many factors, they sometimes do not give correct picture of genetic make-up of the plants. In phenotypic markers, the extent of variation available is also limited. The dominant-recessive interactions between the alleles make it dominant marker system. Moreover, use of morphological markers excludes the analysis of non-coding sequences of genomes, which in higher plants often account for more than 95% of the total genome1. Further they are field requiring, that is, for phenotypic selection the accessions are first raised in field and then scored at appropriate growth stages, e.g. for scoring yield, fruiting time is to be attained. Thus, raising large populations in field up to appropriate stage makes it time, effort and labour requiring. In the field they are subjected to environmental hazards also. In some cases, a trait may not express if suitable environment/condition is not available particularly in the case of stress related genes2. Moreover, scoring of these markers is subjective the results may differ when scored by different breeders. These constraints make the use of phenotypic markers limited.
__________________ *Author for correspondence: Tel: 91-11-27667573, 27667575 ext 1420, 1421 Fax: 91-11-27667829 E-mail: [email protected]

INDIAN J BIOTECHNOL, OCTOBER 2006
436
Another set of markers called biochemical markers can be used which overcome most of the limitations of phenotypic markers. They include proteins, isozyme/allozyme and secondary metabolites, etc. Proteins/Allozymes are quite stable and are minimally influenced by environment. They give closest insight into the genetic makeup. These markers can be analyzed at early stages, e.g. isozymes can be assessed from seeds, and that too with small amount of tissue as against the morphological markers. Electrophoretic variations in proteins can be detected by staining and directly related to allelic variation1. They are codominant markers, an attribute useful for the detection of recessive alleles in heterozygotes. However, as in the case of morphological markers they depict functional polymorphisms thus only giving polymorphism in coding regions selectively that too only the enzyme coding sequences. Furthermore, only those variations are detected that affect the electrophoretic mobility of the proteins. As with classical phenotypic markers, the extent of variation is also somewhat limited. In case of secondary metabolites, their use is restricted to only such plants that produce a suitable range of those metabolites. Moreover, secondary metabolites are products of long and complex pathways and therefore, require study of many genes.
Over the last three decades a new class of markers, namely, molecular markers or DNA markers have been introduced, which have totally revolutionized the entire field of molecular biology. Though, due to simplicity and low cost, biochemical markers especially isozymes are still frequently used in various laboratories, the high information content and high quality of the DNA markers have made them preferred over biochemical markers. DNA markers can broadly be defined as ‘DNA profiles that give information about the genotype’. They possess unique advantages over the phenotypic and biochemical markers. They look directly at the basic level of variation, i.e. DNA level giving direct insight into the genetic makeup, screen the whole genome and reveal variations in both coding and non-coding regions and hence offer large extent of polymorphism. Since the only marker systems to assess organelle genome diversity, make it more important in plants, as many traits are controlled or influenced by the organelle (mitochondria and chloroplast) genome. Analysis of chloroplast genome is used for phylogenetic studies at taxonomic level as these genomes are conserved as
compared to nuclear and mitochondrial genome. DNA markers are highly amenable to automation and once automated, they can be used as efficient selection tools by the plant breeders and contribute in Marker Assisted Selection (MAS). Different DNA markers can be classified into three classes: (i) the hybridi-zation based markers, which include RFLPs and their modifications. RFLPs have their origin due to sequence insertions or deletions that create or delete restriction site/s. Polymorphism is observed by treating the DNA with restriction enzymes followed by electrophoresis and hybridization by a labeled probe. However, RFLPs suffer from some drawbacks. They require large amount of DNA, are labour intensive, time consuming, mostly require radio-actively labeled probes, hence safety factors must be considered1. (ii) PCR based markers that include RAPDs and their modifications. In RAPD, ten-mer, arbitrary primers are used to amplify the genomic DNA and the products are separated by agarose gel electrophoresis and visualized by staining. RAPD has its modifications like DAF and AP-PCR that differ in the length of the primer used. They are relatively low cost markers and prior sequence information of the target genome is not required. However, RAPD markers are dominant markers and considered less reproducible. They also show fragment allelism i.e. RAPD bands of same molecular weight may not have same nucleotide sequence. (iii) Markers that combine principles of both RFLP and PCR include SSRs, AFLPs and their modifications. These markers have high information content and have high resolution of genetic variations than the first generation markers. SSRs, also known as microsatellites, are ubiquitous short tendem repeat motifs of 1-6 bp in genome. They show high mutation rate, which has now been estimated to be between 10-2-10-6 making them highly polymorphic markers1. They are codominant markers. SSR assays are, however, quite costly and time consuming as primers are to be synthesized from the flanking sequences of microsatellite, which need to be isolated, cloned and sequenced. Since the polymorphism can be the result of addition or deletion of single copy of repeat motif, it requires high-resolution agarose/polyacrylamide gel electrophoresis or the use of automated sequencers. AFLP marker is based on selective amplification of double digested restriction products using adaptors linked to restriction fragment ends acting as specific primer binding site for PCR amplification. For more specific
JEHAN & LAKHANPAUL: SNPs IN PLANTS
437
amplification one to three extra nucleotides (arbitrarily chosen) are added to adapter sequence. AFLP markers are highly reproducible and number of markers that can be produced is unlimited as single restriction digest can be used for amplification with different primer combinations. However, they are of high cost and are dominant markers. As in the case of SSRs they also need high-resolution electrophoresis or automated sequencers.
In recent years, a novel class of markers namely SNPs has emerged as an important tool in genomics and are increasingly being used as molecular markers in various laboratories for diverse applications. They possess unique merits that make them preferred over the above classes of markers. They have high information content and depict extremely high level of polymorphisms. Initial cost involved is quite high for these markers. However, they are highly amenable to automation, thus eventually can become cost-effective. Since most of them are non-gel based, they are less time consuming against rest of the markers.
What are SNPs?
Single nucleotide polymorphisms are single base pair positions in genomic DNA at which different sequence alternatives (alleles) exist in normal indivi-duals in some population(s), wherein the least frequent allele has an abundance of at least 1% or greater. Thus, single base insertion/deletion variants (indels) would not be considered to be SNPs3. However, a number of properties attributed to SNPs also apply to insertion or deletion. The above definition is limited by the practical challenges of attaining and surveying representative global popu-lation samples. The non-polymorphic sequence should be accompanied by statement of actual popu-lation studied3. In simple words, SNP is the polymorphism occurring between DNA samples with respect to single base. SNPs comprise the most abundant molecular markers in the genome. The international SNP map working group has prepared a map of human genome sequence variation containing 1.42 million SNPs i.e. one SNP per 1.9 kb4. In plants also they are found to be present in high density across the genome. In maize genome, one SNP per 70 bp and in wheat one SNP per 20 bp has been observed in some regions5.
The SNPs have become the markers of choice. Due to their abundance in genome, they are extremely useful for creating high-density genetic map. This
density cannot be achieved with other genetic marker classes. Due to this abundance, SNPs have the potential to provide basis of a superior and highly informative genotyping assay. SNPs in coding regions (cSNPs) may have functional significance if the resulting amino acid change causes the altered phenotype. SNP markers associated with phenotypic changes pinpoint functional polymorphism. They seem to comprise the largest class of functional polymorphisms.
At a particular site in a DNA molecule theoretically four possible nucleotides are involved but in reality only two of these four possibilities have been observed at the specific sites in a population, thus SNPs are largely biallelic in nature. Although the biallelic nature of SNPs makes them less informative per locus examined than multiallelic markers such as RFLPs and microsatellites6 but this difficulty is overcome by their abundance, which allows the use of more number of loci. Kruglyak determined that a 4 cM map of 750 SNP-based markers was equivalent in the information content to a 10 cM map of 300 microsatellite markers7.
SNPs are less mutable as compared to other markers, particularly microsatellites. The low rates of recurrent mutation make them evolutionarily stable. They are excellent markers for studying complex genetic traits and for understanding the genomic evolution. This also makes them suitable and easier to follow in population studies.
The SNP Consortium (TSC)
In April 1999, ten large pharmaceutical companies and the Wellcome Trust, UK established a consortium called The SNP Consortium (TSC) to put together a database of 300,000 SNPs plus detailed mapping of over 170,000 of these8,9. It was established to generate a widely accepted, extensive, publicly available map using SNPs as markers evenly distributed throughout the human genome. At the end of 2001, 1.4 million SNPs had been released into the public domain by the consortium far exceeding the initial goal of 300,000 SNPs4. The TSC data is available on website (http://snp.cshl.org) to the research community. Till September 2001, 1,255,386 SNPs in human genome are already present in the database. Users can access the data via gene or SNP keyword searches. SNP allele frequency, genotype data and SNP linkage maps are available on the website10. SNPs are involved in common human diseases like cancer,

INDIAN J BIOTECHNOL, OCTOBER 2006
438
hypertension, etc. TSC views its map as a way to make available an important precompetetive research tool that will spark innovative work throughout the research and industrial communities.
Databases and Bioinformatics
Since a rapidly emerging field, it is important to have adequate systems for collection and integration of all the data. Ready access to the available SNP data is the prerequisite for its utilization and application. To meet these goals public databases are being constructed. Four major public SNP databases are:
(i) HGBASE (http://hgbase.interactiva.de) from Uppsala University and Interactive Biotech-nologies GmbH links more than 2400 SNPs to gene. It focuses on relationship between SNPs and gene functions. It has a collection of SNPs from human genome only.
(ii) dbSNP (http://www.ncbi.nlm.nih.gov./SNP/ snp. how-to-submit.html)–A joint effort by National Human Genome Research Institute (NHGRI) and the National Center for Bio-technology Information (NCBI). Data within dbSNP is available free. Since its inception in September 1998, dbSNP has served as a central, public repository for genetic vari-ation. dbSNP currently has most of the submissions for humans but accepts infor-mation from any species and from any part of a particular genome. dbSNP currently classifies nucleotide sequence variation with the following types: (i) single nucleotide substitutions (99.77%), (ii) small indel poly-morphisms (0.21%), (iii) invariant regions of sequence (0.02%), (iv) microsatellite repeats (0.001%), (v) named variants (0.001`%), and (vi) uncharacterized heterozygous assays (<0.001%)11.
(iii) The SNP database from Washington University and the Standard Genome Center (http://www.ibc.wustt.edu/SNP/).
(iv) The Whitehead SNP database (http://www.genome. wi.mit.edu/SNP/human/ index.html). It contains over 3000 SNPs most of which are chromosomally mapped.
In addition, owing to anticipated commercial use of
SNPs, many of the discovered SNPs are currently stored in private databases owned by genomic companies or the pharmaceutical industries like
Celera Genomics, Genset and Incyte, etc. In principle, SNPs can be patented, especially if their relevance to a disease is disclosed. Many patent applications on SNPs have been filed12. Although SNP data is a valuable resource for the researchers, a large number of SNPs may have no functional consequences. Many variations are either in non-coding regions or in coding regions that do not alter protein sequence. Therefore, extraction of useful SNPs from the databases is very important13.
SNP Detection and Genotyping
Seeing the huge potential of SNPs being used in pharmacogenomics and crop improvement, various methods have been described to detect and genotype SNPs. First requirement is to identify or detect the presence of SNPs in DNA samples. There are a number of methods for the detection of SNPs within a genetic locus. SNP assays namely Cleavage assay14-17, BACs and PACs18, ligation assay19-21, Reduced representation shotgun (RRS)22 and DASH23 have already been reviewed24,25. Some other assays that are widely used are outlined below:
Direct Sequencing
Sequence analysis is the most direct way of identifying SNPs. DNA could be sequenced using various methods available like Sangar dideoxy and other nucleotide sequencing. Direct sequencing is time consuming and costly. The other problem encountered in the use of this method in identifying SNPs is the sequencing error. A sequencing error rate of just one base per 100 would equal the rate at which SNPs are found to occur. Another significant problem, which arises is that many plant species are heterozygotes or polyploids. In these cases, direct sequencing would help only highlighting the base difference and not the exact bases that were changed24,26.
In one of the approaches, direct sequencing of AFLP bands can isolate SNP. This has been applied for the first time to discover 24 SNPs from 10 DNA fragments in 11.11 Kb of genomic DNA of brown trout (Salmo trutta). This strategy can be useful for SNP analysis of non-model organisms where sufficient sequence data is not available27.
We can also use locus specific-PCR amplification. Locus specific primers are synthesized from available genomic sequences and PCR amplification is done. The PCR products are then sequenced and the sequence differences are used to discover new SNPs.
JEHAN & LAKHANPAUL: SNPs IN PLANTS
439
Direct Mining from ESTs Databases EST databases include partial cDNA clones from
the genome of the organisms. It gives the most convenient method for the discovery of SNPs as they are present in the database. A comparison of genomic sequences by aligning them will detect SNPs in the coding region. This method provides the greatest potential for cost-effective SNP discovery, which is currently most important limitation of SNP geno-typing assays as it uses preexisting sequence data. EST sequence data may provide the richest source of biologically useful SNPs due to relatively high redundancy of gene sequence, the diversity of genotypes represented within databases and the fact that each SNP would be associated with an expressed gene. Major drawback of this approach is the relatively high sequence error naturally associated with EST program that may lead to identification of false positives, therefore, SNP identified through data mining must be verified28. However, this mining of sequence data sets provides the cheapest source of abundant SNPs. Specialized computer software is also available to fully utilize the EST databases for SNP identification by aligning the sequence from the same locus of different genotypes in an automated manner28,29. This method has been successfully used in identifying 8051 SNPs in Arabidopsis30 and 180 SNPs in barley (Hordeum vulgare)31. Similarly, a number of SNPs in hexaploid wheat has been detected32,33.
Electrophoretic Assays
It detects polymorphisms by observing different electrophoretic migration behaviour of DNA sequences. In Single Strand Conformation Polymor-phism (SSCP), amplified PCR products are denatured and electrophoresed under renaturing conditions. A single base difference between the sequences can result in changes in 3-dimensional conformation thus resulting in differences in the rate of migration during electrophoresis and thereby detecting single nucleotide polymorphism. An improved version of the technique involves the step of asymmetric PCR so that the denaturation step is eliminated. Thus, SSCP test requires amplification of small fragments from numerous genotypes, running them in acrylamide gel electrophoresis and then visualizing the bands by silver staining or ethidium bromide staining. Any change in mobility would indicate a sequence change, which could be targeted by direct sequencing25,26,34. There are many modifications and improvements to
SSCP technique such as Denaturing Gradient Gel Electrophoresis (DGGE), Temperature Gradient Gel Electrophoresis (TGGE)35, etc. In DGGE, separation of DNA is based on difference in their melting behaviour through a polyacrylamide gel containing a gradient of DNA denaturants along the direction of run36. The heteroduplex DNA molecule containing the base mismatch separates from homoduplex as there is difference in their melting behaviour during denatu-ring gel electrophoresis.
In a significant modification of gel electrophoresis for SNP analysis, a novel additive Zn2+-cyclen complex (cyclen=1,4,7,10-tetraazacyclododecane) is used37. Zn2+-cyclen binds to the thymine base and changes the total charge from 0 to +1 (thymine first gets deprotonated and then binds to Zn2+ ion thus making net charge +1)38. Binding of Zn2+-cyclen to dT rich regions changes the local conformation in the DNA. This can be used for the detection of SNP as each base substitution would result in a characteristic conformation of the DNA due to binding to Zn2+-cyclen. PCR products of both wild type and the SNP containing DNA are mixed resulting in the formation of both homo- and heteroduplexes. The DNA mis-match in heteroduplex promotes Zn2+-cyclen binding to the thymine base/s around the mismatch site resulting in a conformational change that enables visualization of all mutations as different DNA bands. Thus, it presents a simple, low-cost and sensitive method of SNP detection in an ordinary laboratory.
PNA Directed PCR Clamping
This assay was described by Orum et al39. Peptide nucleic acid (PNA) is a synthetic analogue of DNA having a N-2-aminoethyl glycine backbone with nucleoside bases attached to the backbone by methylene carbonyl groups40. PNA is a potent DNA mimic in terms of sequence specific hybridization, i.e it recognizes and binds to the complementary nucleic acid sequence with higher thermal stability than corresponding DNA oligonucleotides. At physio-logical ion strength, PNA/DNA duplexes are generally 1oC per base pair more stable thermally than the corresponding DNA/DNA duplexes. PNA/DNA effectively block the formation of PCR product when the PNA is targeted against one of the PCR primer sites. These PNA/DNA duplexes are more easily destabilized by mismatches than DNA-DNA, which makes them an efficient analytical tool for the genotyping of SNPs. PNAs selectively amplify target

INDIAN J BIOTECHNOL, OCTOBER 2006
440
sequences in a sequence specific manner that differs by only one base pair39.
Ross genotyped two SNPs located within human mitochondrial DNA using allele specific PNA probes uniquely mass labeled by non-complementary dT nucleobase to the 3' end of the PNA oligomer41. However, multiplex analysis of SNPs using PNA probes is limited by high variability in the thermal stabilities of different probe sequences, which require the hybridization of probe pairs at each polymorphic position to be conducted in separate reaction tubes under different conditions. To design PNA probe sequences with similar thermal stabilities, two algo-rithms for predicting PNA:DNA duplex stabilities have been developed, which can enable single tube multiplex SNP genotyping to be carried out 42- 44.
Temperature Modulated Heteroduplex Assay (TMHA)
TMHA is also called Denaturing High Performance Liquid Chromatography (DHPLC). It is a mismatch detection technology that relies on differences in physical properties between DNA homoduplexes and mismatched heteroduplexes formed during the annealing of wild type and mutant DNA and has extraordinary sensitivity to distinguish homoduplexes from heteroduplexes. The assay involves heating of DNA mixture of wild type and the variant DNA and subsequent slow cooling at an empirically determined optimal temperature resulting in a mixture of homoduplexes and heteroduplexes. The heteroduplex partially denatures due to single base pair mismatch and hence can be distinguished from homoduplex by different chromatographic patterns. Different SNPs have their unique chromatographic patterns. Trasge-nomics Inc. (USA) has developed DHPLC WAVETM
system that brings the assay in a fully automated manner25. For most of the SNP genotyping methods, prior knowledge of DNA sequence in the region surrounding the SNP is needed. The detection requires screening for a sequence variant without any a priori knowledge of the exact mutation site and does not need detection labels and allows multi-plexing and automated genotyping of SNPs. Development of SNP map of barley is in progress using DHPLC45. However, it is useful for the identi-fication of SNP-containing DNA segment prior to sequencing as it only detects the presence or absence of a mutation and not the nature or location of the mutation. Furthermore, in case of highly polymorphic species this approach may not be useful. This assay is
time consuming also as optimum assay temperature for each of the targets has to be determined28.
Fluorescence Resonance Energy Transfer Based Method
The method is based on real time PCR and depends upon fluorescent energy transfer. It includes TaqMan assay and molecular beacons (MBs). It allows on-line reading of result. In TaqMan assay, TaqmanTM probe contains a fluorescent reporter molecule (ex. FAM or TET) at the 5' end and a quencher (ex-TAMRA) at the 3' end and a blocking group to prevent probe extension. This probe is complementary to the PCR amplicon. The probe on hybridization to the template DNA is degraded at its 5' end by 5' → 3' exonuclease activity of Taq polymerase thereby releasing the reporter from quencher and thus emits signals. Due to the presence of SNP, the probe does not lead to duplex formation and no such degradation at 5' end of the probe is possible hence, no fluorescent signal is received. Therefore, discrimination of polymorphism is solely by hybridization and not by the enzyme as Taq polymerase can presumably cleave a matched as well as mismatched probe24.
However, due to limited number of compatible reporter-quencher combination availability, the multiplexing capability is low. MBs provide an efficient tool to genotype SNPs with considerable multiplexing. They are short oligonucleotide probes with a stem loop structure. The 3′ and 5′ ends are complementary (forms stem due to pairing) and the intervening loop is complementary to the target sequence containing SNP. The 3′ and 5′ end contains a fluorescence and a quencher moiety, respectively. In the stem loop/hairpin configuration, the quencher and reporter lie in close proximity thus the reporter is quenched. MBs free in solution remain in this hairpin configuration due to self-annealing of the two ends and are non-fluorescent due to quenching of reporter but when complimentary target is present, they hybridize with the target sequence. Conformational reorganization in the probe occurs so that the reporter and quencher are dissociated, the reporter is no longer quenched and the MB fluoresces (Fig. 1)46. However, if an SNP is present then the MB will not hybridize to the target sequence and no fluorescence would be observed. This assay is PCR dependent thus MBs are designed by choosing the length of probe (loop) and arm (stem) sequences appropriately. The length of the probe should be such that it would be dissociated from its target at temperature 7-10oC higher than the

JEHAN & LAKHANPAUL: SNPs IN PLANTS
441
annealing temperature of the PCR. The melting temperatures of probe target hybrid could be predicted using the per cent GC rule, which is available in most primer design software packages. The prediction should be made for the probe sequence alone before adding the arm sequences. In practice, length of the probe sequences usually ranges from 15 to 33 nucleotides.
This is a technically simple gel free assay. It has potential for high genotyping throughput and is more efficient than assays using linear probe, since the stem-loop formation thermodynamically competes with the amplicon for hybridization47. The MB approach could also be used in an immobilized format, so has the potential for high throughput28. MBs have been immobilized on solid surfaces like silica to construct MB array. However, there are several problems encountered in this, chiefly the electrostatic properties at the solid-liquid interface. Wang et al used agarose-coated surface of micro-arrays48. They provide advantage of both porous structure and a planer surface; also provide high binding capacity and a solution like environment in which the assay resembles a homogeneous liquid phase reaction rather than a heterogeneous liquid-solid interface reaction.
However, the number of probes that can be used is limited since the monochromatic light used in most of detection systems does not excite all fluorophores equally well. To overcome this, wavelength-shifting MB with two fluorophores, harvester fluorophore that absorbs strongly in the wavelength range of the monochromatic light source and emitter fluorophore that absorbs strongly in the wavelength of the desired
emission colour, arranged serially at one end of the beacon and a quencher on the other end can be used49. In the presence of target the absorbed energy from harvester fluorophore is transferred to the emitter fluorophore by fluorescence resonance energy transfer and therefore the MB fluoresce in the emission range of emitter fluorophore. This enhances the multi-plexing capacity of MB detection assay. MBs are in less frequent use inspite of the above-mentioned advantages due to high cost of synthesis and design of probes and requirement of expensive dual labeled oligos24.
AlphaScreen Method
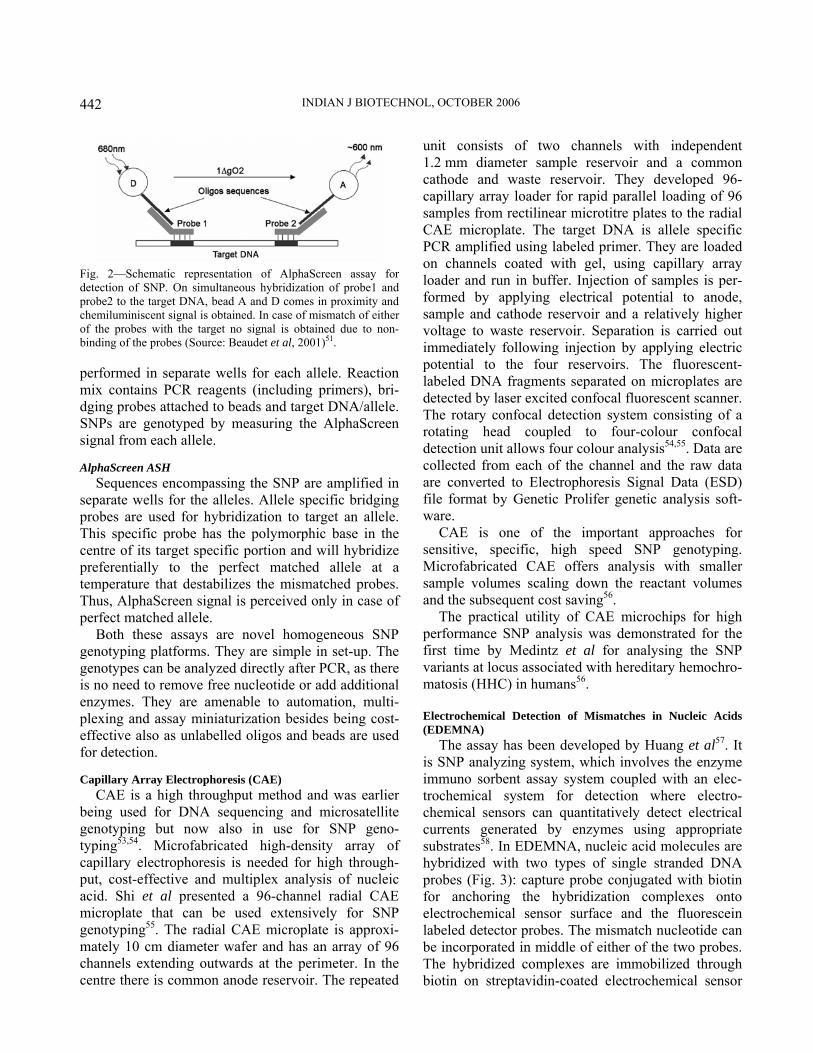
This assay of genotyping SNP utilizes AlphaScreen technology, which was developed initially by Ullman et al 50. In this assay, two beads called Donor (D) and Acceptor (A) are used. D beads contain phthalo-cyanine, a photosensitizer that generates short-lived singlet oxygen on irradiation at 680 nm. This singlet oxygen is accepted by bead A when it is in proximity of D as singlet oxygen diffuses only a short distance (~200 nm) before decaying. A bead contains a mixture of chemiluminescer and fluorophores, which on reacting with singlet oxygen undergo a series of chemical transformations that culminate in a time delayed energy transfer to fluorophores. The activated fluorophore emits light signal at ~ 600 nm50,51.
This assay was initially used to measure inter-actions between biological binding partners50. Now it is adopted for the detection of nucleic acids52. Alpha-Screen assay coupled with Allele-Specific Amplifi-cation (ASA) and Allele-Specific Hybridization (ASH) provides novel SNP genotyping platform43. Bridging probes are used, which can bind simulta-neously to a common nucleic acid target and with oligo sequences like dA attached covalently to A and D beads surface (Fig. 2). On hybridization of the bridging probes to the target, the two beads come in proximity and give signal. In both AlphaScreen ASA and AlphaScreen ASH, PCR and probe hybridization are performed in the same reaction mixture and genotype analysis can be performed immediately after thermal cycling.
AlphaScreen ASA
Allele specific PCR primers are designed with polymorphic base at the 3' end of the primer. Second mismatch is introduced at the penultimate position of the allele specific primer to increase the specificity of amplification reaction. AlphaScreen assays are
Fig. 1—Molecular beacon assay for SNP genotyping. Molecular beacon hybridizes with complementary sequence on target DNA and opens so that reporter separates from quencher and fluoresces. In case of single base mismatch, hybridization does not occur therefore, no fluorescence signal is obtained (Adapted from Tyagi et al, 1998)47.
INDIAN J BIOTECHNOL, OCTOBER 2006
442
performed in separate wells for each allele. Reaction mix contains PCR reagents (including primers), bri-dging probes attached to beads and target DNA/allele. SNPs are genotyped by measuring the AlphaScreen signal from each allele.
AlphaScreen ASH
Sequences encompassing the SNP are amplified in separate wells for the alleles. Allele specific bridging probes are used for hybridization to target an allele. This specific probe has the polymorphic base in the centre of its target specific portion and will hybridize preferentially to the perfect matched allele at a temperature that destabilizes the mismatched probes. Thus, AlphaScreen signal is perceived only in case of perfect matched allele.
Both these assays are novel homogeneous SNP genotyping platforms. They are simple in set-up. The genotypes can be analyzed directly after PCR, as there is no need to remove free nucleotide or add additional enzymes. They are amenable to automation, multi-plexing and assay miniaturization besides being cost-effective also as unlabelled oligos and beads are used for detection.
Capillary Array Electrophoresis (CAE)
CAE is a high throughput method and was earlier being used for DNA sequencing and microsatellite genotyping but now also in use for SNP geno-typing53,54. Microfabricated high-density array of capillary electrophoresis is needed for high through-put, cost-effective and multiplex analysis of nucleic acid. Shi et al presented a 96-channel radial CAE microplate that can be used extensively for SNP genotyping55. The radial CAE microplate is approxi-mately 10 cm diameter wafer and has an array of 96 channels extending outwards at the perimeter. In the centre there is common anode reservoir. The repeated
unit consists of two channels with independent 1.2 mm diameter sample reservoir and a common cathode and waste reservoir. They developed 96-capillary array loader for rapid parallel loading of 96 samples from rectilinear microtitre plates to the radial CAE microplate. The target DNA is allele specific PCR amplified using labeled primer. They are loaded on channels coated with gel, using capillary array loader and run in buffer. Injection of samples is per-formed by applying electrical potential to anode, sample and cathode reservoir and a relatively higher voltage to waste reservoir. Separation is carried out immediately following injection by applying electric potential to the four reservoirs. The fluorescent-labeled DNA fragments separated on microplates are detected by laser excited confocal fluorescent scanner. The rotary confocal detection system consisting of a rotating head coupled to four-colour confocal detection unit allows four colour analysis54,55. Data are collected from each of the channel and the raw data are converted to Electrophoresis Signal Data (ESD) file format by Genetic Prolifer genetic analysis soft-ware.
CAE is one of the important approaches for sensitive, specific, high speed SNP genotyping. Microfabricated CAE offers analysis with smaller sample volumes scaling down the reactant volumes and the subsequent cost saving56.
The practical utility of CAE microchips for high performance SNP analysis was demonstrated for the first time by Medintz et al for analysing the SNP variants at locus associated with hereditary hemochro-matosis (HHC) in humans56.
Electrochemical Detection of Mismatches in Nucleic Acids (EDEMNA)
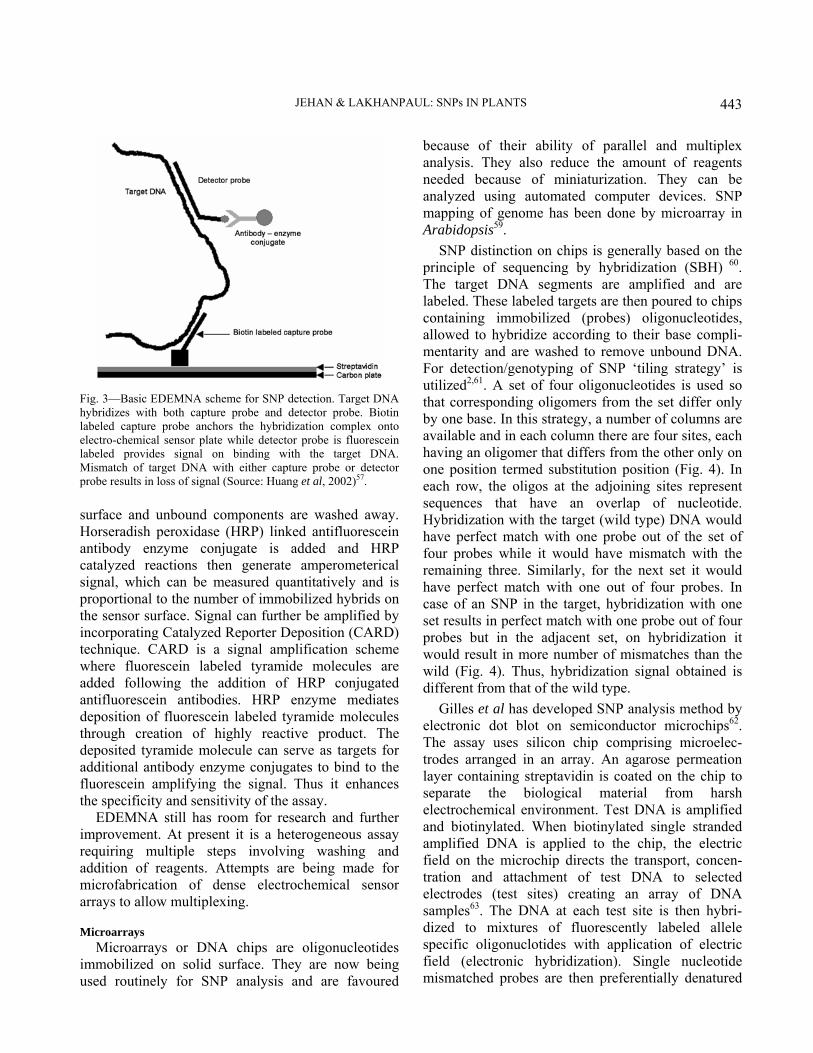
The assay has been developed by Huang et al57. It is SNP analyzing system, which involves the enzyme immuno sorbent assay system coupled with an elec-trochemical system for detection where electro-chemical sensors can quantitatively detect electrical currents generated by enzymes using appropriate substrates58. In EDEMNA, nucleic acid molecules are hybridized with two types of single stranded DNA probes (Fig. 3): capture probe conjugated with biotin for anchoring the hybridization complexes onto electrochemical sensor surface and the fluorescein labeled detector probes. The mismatch nucleotide can be incorporated in middle of either of the two probes. The hybridized complexes are immobilized through biotin on streptavidin-coated electrochemical sensor
Fig. 2—Schematic representation of AlphaScreen assay for detection of SNP. On simultaneous hybridization of probe1 and probe2 to the target DNA, bead A and D comes in proximity and chemiluminiscent signal is obtained. In case of mismatch of either of the probes with the target no signal is obtained due to non-binding of the probes (Source: Beaudet et al, 2001)51.
JEHAN & LAKHANPAUL: SNPs IN PLANTS
443
surface and unbound components are washed away. Horseradish peroxidase (HRP) linked antifluorescein antibody enzyme conjugate is added and HRP catalyzed reactions then generate amperometerical signal, which can be measured quantitatively and is proportional to the number of immobilized hybrids on the sensor surface. Signal can further be amplified by incorporating Catalyzed Reporter Deposition (CARD) technique. CARD is a signal amplification scheme where fluorescein labeled tyramide molecules are added following the addition of HRP conjugated antifluorescein antibodies. HRP enzyme mediates deposition of fluorescein labeled tyramide molecules through creation of highly reactive product. The deposited tyramide molecule can serve as targets for additional antibody enzyme conjugates to bind to the fluorescein amplifying the signal. Thus it enhances the specificity and sensitivity of the assay.
EDEMNA still has room for research and further improvement. At present it is a heterogeneous assay requiring multiple steps involving washing and addition of reagents. Attempts are being made for microfabrication of dense electrochemical sensor arrays to allow multiplexing.
Microarrays
Microarrays or DNA chips are oligonucleotides immobilized on solid surface. They are now being used routinely for SNP analysis and are favoured
because of their ability of parallel and multiplex analysis. They also reduce the amount of reagents needed because of miniaturization. They can be analyzed using automated computer devices. SNP mapping of genome has been done by microarray in Arabidopsis59.
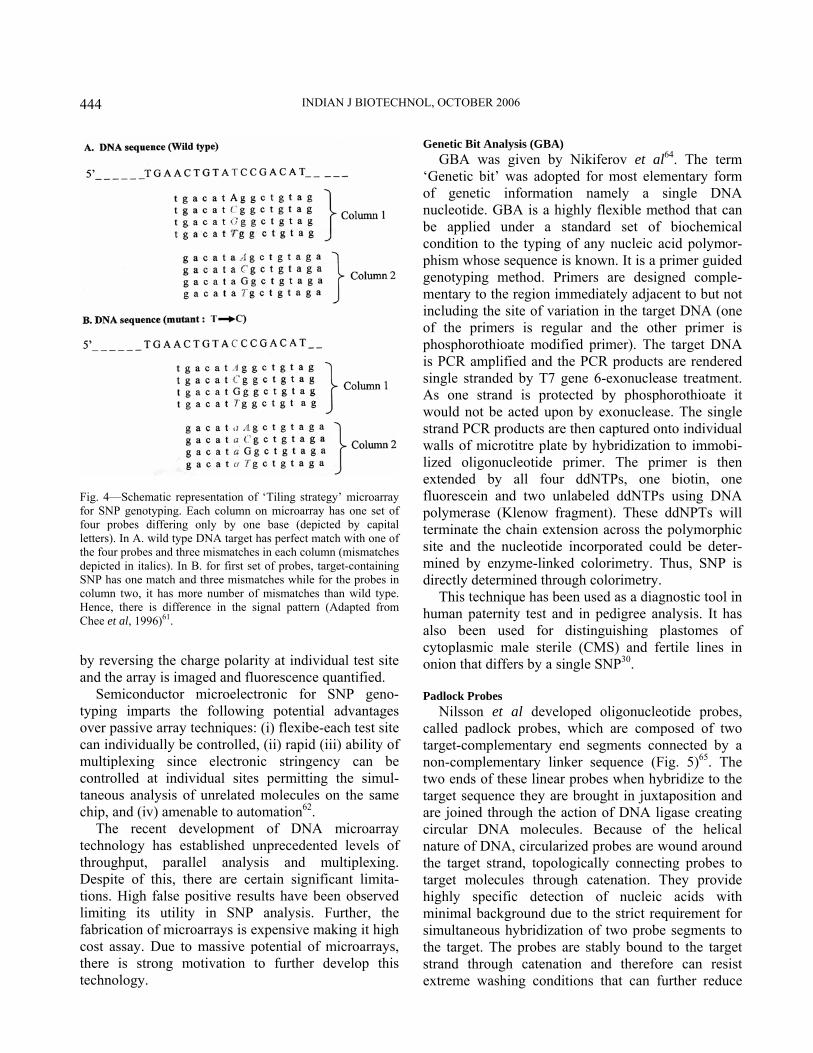
SNP distinction on chips is generally based on the principle of sequencing by hybridization (SBH) 60. The target DNA segments are amplified and are labeled. These labeled targets are then poured to chips containing immobilized (probes) oligonucleotides, allowed to hybridize according to their base compli-mentarity and are washed to remove unbound DNA. For detection/genotyping of SNP ‘tiling strategy’ is utilized2,61. A set of four oligonucleotides is used so that corresponding oligomers from the set differ only by one base. In this strategy, a number of columns are available and in each column there are four sites, each having an oligomer that differs from the other only on one position termed substitution position (Fig. 4). In each row, the oligos at the adjoining sites represent sequences that have an overlap of nucleotide. Hybridization with the target (wild type) DNA would have perfect match with one probe out of the set of four probes while it would have mismatch with the remaining three. Similarly, for the next set it would have perfect match with one out of four probes. In case of an SNP in the target, hybridization with one set results in perfect match with one probe out of four probes but in the adjacent set, on hybridization it would result in more number of mismatches than the wild (Fig. 4). Thus, hybridization signal obtained is different from that of the wild type.
Gilles et al has developed SNP analysis method by electronic dot blot on semiconductor microchips62. The assay uses silicon chip comprising microelec-trodes arranged in an array. An agarose permeation layer containing streptavidin is coated on the chip to separate the biological material from harsh electrochemical environment. Test DNA is amplified and biotinylated. When biotinylated single stranded amplified DNA is applied to the chip, the electric field on the microchip directs the transport, concen-tration and attachment of test DNA to selected electrodes (test sites) creating an array of DNA samples63. The DNA at each test site is then hybri-dized to mixtures of fluorescently labeled allele specific oligonuclotides with application of electric field (electronic hybridization). Single nucleotide mismatched probes are then preferentially denatured
Fig. 3—Basic EDEMNA scheme for SNP detection. Target DNA hybridizes with both capture probe and detector probe. Biotin labeled capture probe anchors the hybridization complex onto electro-chemical sensor plate while detector probe is fluorescein labeled provides signal on binding with the target DNA. Mismatch of target DNA with either capture probe or detector probe results in loss of signal (Source: Huang et al, 2002)57.
INDIAN J BIOTECHNOL, OCTOBER 2006
444
by reversing the charge polarity at individual test site and the array is imaged and fluorescence quantified.
Semiconductor microelectronic for SNP geno-typing imparts the following potential advantages over passive array techniques: (i) flexibe-each test site can individually be controlled, (ii) rapid (iii) ability of multiplexing since electronic stringency can be controlled at individual sites permitting the simul-taneous analysis of unrelated molecules on the same chip, and (iv) amenable to automation62.
The recent development of DNA microarray technology has established unprecedented levels of throughput, parallel analysis and multiplexing. Despite of this, there are certain significant limita-tions. High false positive results have been observed limiting its utility in SNP analysis. Further, the fabrication of microarrays is expensive making it high cost assay. Due to massive potential of microarrays, there is strong motivation to further develop this technology.
Genetic Bit Analysis (GBA) GBA was given by Nikiferov et al64. The term
‘Genetic bit’ was adopted for most elementary form of genetic information namely a single DNA nucleotide. GBA is a highly flexible method that can be applied under a standard set of biochemical condition to the typing of any nucleic acid polymor-phism whose sequence is known. It is a primer guided genotyping method. Primers are designed comple-mentary to the region immediately adjacent to but not including the site of variation in the target DNA (one of the primers is regular and the other primer is phosphorothioate modified primer). The target DNA is PCR amplified and the PCR products are rendered single stranded by T7 gene 6-exonuclease treatment. As one strand is protected by phosphorothioate it would not be acted upon by exonuclease. The single strand PCR products are then captured onto individual walls of microtitre plate by hybridization to immobi-lized oligonucleotide primer. The primer is then extended by all four ddNTPs, one biotin, one fluorescein and two unlabeled ddNTPs using DNA polymerase (Klenow fragment). These ddNPTs will terminate the chain extension across the polymorphic site and the nucleotide incorporated could be deter-mined by enzyme-linked colorimetry. Thus, SNP is directly determined through colorimetry.
This technique has been used as a diagnostic tool in human paternity test and in pedigree analysis. It has also been used for distinguishing plastomes of cytoplasmic male sterile (CMS) and fertile lines in onion that differs by a single SNP30.
Padlock Probes
Nilsson et al developed oligonucleotide probes, called padlock probes, which are composed of two target-complementary end segments connected by a non-complementary linker sequence (Fig. 5)65. The two ends of these linear probes when hybridize to the target sequence they are brought in juxtaposition and are joined through the action of DNA ligase creating circular DNA molecules. Because of the helical nature of DNA, circularized probes are wound around the target strand, topologically connecting probes to target molecules through catenation. They provide highly specific detection of nucleic acids with minimal background due to the strict requirement for simultaneous hybridization of two probe segments to the target. The probes are stably bound to the target strand through catenation and therefore can resist extreme washing conditions that can further reduce
Fig. 4—Schematic representation of ‘Tiling strategy’ microarray for SNP genotyping. Each column on microarray has one set of four probes differing only by one base (depicted by capital letters). In A. wild type DNA target has perfect match with one of the four probes and three mismatches in each column (mismatches depicted in italics). In B. for first set of probes, target-containing SNP has one match and three mismatches while for the probes in column two, it has more number of mismatches than wild type. Hence, there is difference in the signal pattern (Adapted from Chee et al, 1996)61.

JEHAN & LAKHANPAUL: SNPs IN PLANTS
445
non-specific signals. The ligation allows efficient distinction among sequence variants and can efficiently be utilized for detection of single nucleo-tide polymorphisms as DNA ligase will ligate the two ends of the probes only in case of perfect match with the target. Nilsson used padlock probes labeled with different fluorescent dyes to reveal single nucleotide differences in alpha satellite sequences in centromeres of human chromosomes 13 and 2166.
The circularized probe can act as efficient templates for a rolling circle amplification reaction and can be amplified by polymerase, thus obviating the need of PCR67. However, it is not possible to replicate padlock probes that remain threaded on their target sequences68. This problem can be overcome by cleaving the target strands to permit the probes to slide off their target, or for the 3′ end of the cleaved target itself to serve as a primer in the rolling circle replication (RCR) reaction69. RCR results in linear amplification of the signal, however, with the addition of a second amplification primer complementary to the RCR products, hyperbranched rolling circle amplification (HRCA) reaction results. It proceeds much faster than linear amplification67.
Pyrosequencing Pyrosequencing is a new DNA-sequencing method
that employs coupled enzyme reaction to monitor the pyrophosphate (PPi) released during nucleotide incor-poration. It is a sequencing-by-synthesis method that relies on luminometric detection of inorganic phos-phate release. It allows short segments of sequence, typically 20 nucleotide, to be obtained and sequenced in an automated manner. It is suitable for genotyping of previously identified SNPs as it requires sequencing of only a few nucleotides (1-5 bp).
For the detection of SNPs by this method, primers are designed for sequences flanking SNP sites. The DNA is PCR amplified and PCR products are rendered single stranded. The reaction mixture contains single stranded DNA with a short annealed primer, DNA polymerase, ATP sulphyrase, luciferase and apyrase and the dNTP are added in a cyclic order. If the added nucleotide forms a base pair, DNA polymerase incorporates the nucleotide and pyrophos-phate will consequently be released. The released pyrophosphate is utilized to convert 5' aminopho-sulfonate (APS) into ATP by ATP sulphyrase. Lucifrase uses this ATP to generate detectable light (Fig. 6A). The amount of light produced by luciferase could be estimated by a light sensitive device such as a luminometer or a Charge-Coupled Device (CCD) camera. The light produced is seen as a peak in pyrogram and the height of the peak tells about the number of dNTP incorporated. The excess of added nucleotide (unincorporated) and the produced ATP are degraded between each cycle by apyrase. If the added nucleotide does not form a base pair to DNA template, the polymerase will not incorporate it and no light will be produced (Fig. 6B). Thus, real-time signals are obtained and for each allele combination a specific pattern (pyrogram) is obtained. This makes the assay extremely accurate. Simple manual com-parison can score an SNP. It is possible to auto-matically determine the allelic status by pattern recognition software701,71.
Primer + dNTP polymerase
Primer + 1N + PPi … (1)
APS + PPi Sulphyrase
ATP … (2)
Luciferin + ATP Luciferase
Oxyluciferien + light … (3)
Pyrosequencing is a proprietary technique deve-loped by the company named Pyrosequencing AB. It markets the complete pyrosequencing system
Fig. 5—Schematic representation of padlock probe assay. Padlock probes have end sequences complementary to target. In case of perfect match, ligase ( ) joins the two ends of the probe brought in juxtaposition on hybridization with the target creating circular DNA molecules. The circular DNA probe binds to the target DNA and gives signal. In case of mismatch, ligase do not seal the ends of the probe, therefore, no signal is obtained (Banér et al, 1998)68.

INDIAN J BIOTECHNOL, OCTOBER 2006
446
PSQTM96 that is both developed and manufactured by them. In the present configuration, it is carried out in an automated microtitre base pyrosequencer that allows simultaneous analysis of 96 samples within 15 min after template preparation. It analyzes one SNP every 6 seconds. Thus, this technique is rapid and suitable for large-scale studies. Pyrosequencing avoids use of labeled primers or labeled nucleotides and even gel electrophoresis. However, this method has some limitations. Firstly, it requires a PCR step before SNP assay. Secondly, it needs single-stranded sequencing template that adds to the cost and time required for the assay.
Pyrosequencing has been used for SNP genotyping and for rapid mapping of ESTs in maize.
Invader assay
Third Wave Technologies Inc. have developed a SNP genotyping based on nuclease. It employs exo-nuclease activity of endonuclease from the FEN
family (cleavase), a thermostable structure-specific archaebacterial flap endonuclease enzyme to cleave structure-specific rather than sequence-specific sites72. Sequence specific oligonucleotide probes are synthe-sized, one is invader oligonucleotide and the other is signal probe. The invader oligonucleotide has a sequence homology with segment of DNA upstream of the SNP site while the signal nucleotide at its 3' end has sequence homology with the target DNA and a segment at its 5' end having no homology with the target DNA. The signal oligonucleotide forms a duplex with the target DNA and the invader oligo-nucleotide now invades into the duplex thus forming an overlap at this point. The flap endonuclease acts on the overlapping conformation and cleaves the unpaired (overlapping) region on 5' end of signal oligonucleotide freeing an oligonucleotide called ‘flap’. The precise site of cleavage is dependent on the amount of overlap with the upstream oligo-nucleotide. Nucleotide at the overlap site in the signal probe has to be complementary to the target for enzymatic cleavage of the 5′ flap whereas overlapped nucleotide at 3′ end of invader probe does not need to be complementary to the target for enzymatic cleavage. When the target and the probe are not complementary at this position the overlap is eliminated and cleavage rate is very slow. The difference in the cleavage rate of the enzyme between overlaps with the perfect match and imperfect match ensures a high level of nucleotide discrimination in SNP analysis73,74. Thermostable variants of flap endo-nuclease allows the reaction to be performed near the melting temperature (Tm) of signal probe and target duplex, which promote probe turnover without the need of temperature cycling. With the excess of signal probe present in the solution, as signal probe is cleaved, it is replaced by uncleaved probe which is in turn cleaved and replaced and so on. It results in amplification of cleavage signal and enables the detection of specific DNA target present in small amount or present in complex mixture. This assay identifies polymorphisms with high specificity74.
A modification of Invader assay called ‘Invader squared assay’ has been used. This involves two step reaction. The flap produced in primary cleavage reaction participates in second cleavage reaction as invader probe which in turn is directed against another complementary target added externally containing fluorescent reporter and quencher. On cleavage, the target release fluorescent signal. It
Fig. 6—Basic principle of pyrosequencing for SNP genotyping. Four nucleotides added in a defined order (Arrow depicting the order) in the reaction mixture consisting of single-stranded DNA with short primer annealed, DNA polymerase, ATP sulphyrase, luciferase and apyrase. In A. incoming base is incorporated releasing pyrophosphate that through cascade of reactions results in light as signal. In B. due to mismatch, no pyrophosphate is released, hence no signal is obtained. These signals are estimated by light sensitive device and program is formed (Adapted from Ahmadian et al, 2000)71.
JEHAN & LAKHANPAUL: SNPs IN PLANTS
447
approximately squares the amount of amplification of cleavage production compared with the single stage invader reaction73.
This assay does not involve PCR and is, therefore, free from disadvantages of PCR like contamination, thus has average signal to noise ratio far superior to that of standard PCR based methods. Besides it is quite accurate. Wellcome Trust, Cambridge University analyzed same 36 SNPs in 384 individuals. The typing was found to be 99.6% accurate75. No special instru-ments are needed, however, semi and fully automated systems are under development. It is highly sensitive method and sufficiently specific to enable discrimi-nation of single base differences. However, in the common format using fluorescent signal, it is uniplex, as only one genotype can be performed per assay.
Cleavase fragment length polymorphism (CFLP)
This assay utilizes the property of cleavase enzyme. It is based on observations that when single strands of DNA fold on themselves, they assume secondary structure that are highly specific of the sequence of the DNA molecule26. The intrastrand structures that are formed are hairpin structures. The cleavase I enzyme is a structure specific, thermostable nuclease. It recognizes and cleaves the junctions between these single stranded and double stranded regions (formed by hairpin structure). Target DNA is PCR amplified using locus specific oligonucleotide probes (LSOPs) and PCR products are heat denatured. This single stranded DNA is now allowed to produce secondary intrastrand structures by cooling. The sample is then treated with cleavase. On resolving by electrophoresis, it creates unique ‘barcodes’ that highlight the conformational characteristics of the DNA. A change in even a single nucleotide (SNP) can lead to alteration in these conformations and thus creating another characteristic barcode. So this array is a robust method of genotyping SNPs.
CFLP can be used to identify sequence polymor-phism in large DNA fragments as the secondary structures are detected by enzymatic cleavage rather than by electrophoretic mobility.
SNP Genotyping Scoring Platforms
Each SNP genotyping technique may be scored in one or more formats76. The important platforms that are nowadays used extensively in the genotyping assays for their high throughput and speed include arrays, mass spectrometry and flow cytometry. As arrays have been discussed earlier, the other two
platforms viz. mass spectrometry and flow cytometry are discussed.
Mass Spectrometry Based Genotyping
Matrix-Assisted Laser Desorption Ionization Time-of-Flight (MALDI-TOF) mass spectrometry (MS) is amongst the most promising approach to genotype SNPs. MALDI-TOF MS has been in use for the analysis of proteins, peptides and nucleic acids77-79. The analysis is based on the intrinsic property of mass-to charge ratio (m/z). This approach has several advantages over the other arrays/platforms developed for SNP genotyping. It is fast as ionization, separation by size and detection takes milliseconds to complete. The results being based on intrinsic property of m/z ratio, this is inherently more accurate than electro-phoresis based or hybridization array based method. It is also not affected by secondary structures formed in nucleic acid.
MALDI-TOF MS has been integrated in many SNP analysis approaches. Enzymatic DNA sequ-encing coupled with MALDI-TOF MS analysis has been shown to be effective at discovering previously unknown and known SNPs80,81. But its current limitation is of loss of signal intensity and mass resolution with increasing DNA size. This might be due to size dependent tendency of the phosphodiester backbone of DNA to fragment during the MALDI process. This size dependent loss of signal has limited MALDI-TOF MS DNA sequencing lengths to <100 nucleotides per sequencing reaction82.
SNPs can also be detected by minisequencing that is sequencing of a few bases around the SNP site. Minisequencing for SNP genotyping involves annealing a primer to a template PCR amplicon at immediate downstream of SNP site. A mixture of dNTPs and ddNTPs are added to PCR template along with DNA polymerase. The primer extends in 5′ to 3′ direction and incorporates nucleotides complementary to the bases in PCR template immediately adjacent to the primer position. Extension terminates at the first position in the template where ddNTP incorporates. The extended primers are solid phase purified and detected using MALDI-TOF MS. SNP is detected at m/z value specific to the nucleotide added to the extension reaction82. Paris et al utilized this approach for the analysis of SNPs in barley, which could be used for codominant MAS (Marker assisted selection) in barley83. Minisequencing and MALDI-TOF MS have been improved for multiplex SNP analysis by employing multiple primers with 5′ oligo (dT)

INDIAN J BIOTECHNOL, OCTOBER 2006
448
sequences (MassTags)84. These primers have 3' position, typically 12-25 bases, complementary to the target and a 5' position of 0-20 bases, which are not complementary, termed MassTag and composed of variable number of Thymidylic acid residue. dT residues are desirable for composition of MassTag as they are more resistant to fragmentation during MALDI-TOF than other bases. Due to these MassTags all extended and non-extended primers are resolved as distinct peaks during MALDI-TOF analysis. Successful multiple genotyping of five SNPs occurring within the same PCR amplicon from BRAC1 exon 13 locus in humans has been reported.
Many other SNP genotyping approaches integrate MALDI-TOF MS analysis for rapid and high through-put assay. Invader assay for SNP with detection by MALDI-TOF MS provides the inherent benefits of both the direct signal amplification without the need for PCR by invader assay and extremely rapid and accurate signal detection by MALDI-TOF MS73. Similarly, PNA directed SNP analysis is also compa-tible with MALDI-TOF MS85. PNA is easily analyzed by MALDI-TOF MS because unlike DNA molecules, the peptide backbone does not fragment during the MALDI process. In PNA-MALDI MS analysis for SNP genotyping, two PNA hybridization probes, each corresponding to one of the two possible SNP alleles, are annealed to biotinylated, single stranded PCR amplicon immobilized on streptavidin coated mag-netic beads. After PNA probe annealing, the beads are washed so that only a perfectly matched probe will remain hybridized to PCR target. This entire bead is then spotted onto MALDI probe tip and an acidic matrix solution is added which dissociates the hybridized PNA probes from immobilized DNA. The PNA is then ionized upon radiation with the laser and detected by its mass; each uniquely mass-labeled PNA probe detected corresponds to a specific SNP allele present in the PCR amplicon41,85.
There is lack of specificity in mass peaks when the characterization of DNA in MS solely depends on mass-to-charge ratio. Current MS measurements to detect SNPs are accomplished through resolving the mass differences due to single base substitutions but it can measure masses of oligonucleotide within an accuracy of only 0.02-0.08%. To overcome this, nucleotide-specific tagging with stable isotopes are utilized for better resolution as isotopic labeling of nucleotide is able to generate a mass shift of 9-27 Da per nucleotide (depending upon the combination of
isotopes like 13C, 15N and 2H in enriching the nucleotide). The stable-isotope labeled dNTPs carry characteristic mass shift that can serve as interior “massTags” product. The nucleotide specific tagging with stable isotopes provides internal signatures that quantitatively display the nucleotide content of oligomer peaks in MS spectra. This provides indica-tions of number of labeled precursors and in turn the base substitution in each mass peak and provides for efficient SNP detection. Chen et al used stable isotopes 13C/15N labeling of PCR products of the target sequences with analysis of the mass shift by mass spectrometry86. The mass shift due to labeling of a single type of nucleotide i.e. A, T, G or C reveals the numbers of that nucleotide in the given DNA fragment and the nucleotide composition of DNA fragment can be determined. An extension of this strategy for more efficient and accurate detection of SNPs and characterization of DNA has been reported. For this, partial 13C/15N labeled dNTPs that carry unique massTags and used to trace a particular type of nucleotide in DNA fragments have been utilized87. The number of labeled nucleotides in the target sequence is determined by the mass shift between labeled and unlabeled digests.
Flow Cytometry Based Genotyping
Minisequencing is a routinely used assay for SNP scoring. Its integration with flow cytometry provides a new platform for high throughput SNP scoring88. A single biotinylated oligonucleotide is annealed imme-diately adjacent to the SNP site and extended one base by DNA polymerase and fluorescent ddNTPs. After extension, the biotinylated primers are captured onto streptavidin-coated microsphere and fluorescence is measured by flow cytometry.
Flow cytometry provides intrinsic resolution between free and particle bound fluorescence. There-fore, samples can be analyzed without any washing or separation step and thus eliminating the need for purification of PCR products. Flow cytometry is a multiparameter detection platform as it is possible to measure several features of a particle simultaneously. It is possible to label each of the four ddNTPs with a different fluorophore and detect in a single reaction, thus has the ability for multiplex analysis. The assay is very efficient and sensitive. However, this method suffers from the same limitations as that of minise-quencing, namely primer heterodimer formation and false priming. However, these limitations can be overcome by careful primer selection88.
JEHAN & LAKHANPAUL: SNPs IN PLANTS
449
The Hunt is On Since SNPs are the most abundant markers in
humans, plants and animal genomes they must be identified efficiently and rapidly for their applications in various aspects like pharmacogenomics and crop genetics. To make these studies possible, a plethora of SNP genotyping technologies have been described but there is still room for faster, better and cheaper genotyping89. Among the various methods available till date a worker can choose any one depending on various parameters such as infrastructure available, cost, specificity, etc. Table 1 gives a comparative account of the techniques available for SNP geno-typing with reference to certain parameters such as homogeneous (carried out in a single closed tube and no need of washing or addition of reagents in multisteps) or solid phase assay, real time or end point detection, multiplexing ability, cost, specialized equipments required for detection to have an overall assessment of the techniques available. As each reaction and detection technique has its pros and cons, further advances will be needed to achieve the desired breakthrough in cost and speed. At the moment, no single technology has monopolized the field90.
Comparison of SNPs with Other Marker Systems SNPs have emerged as a powerful tool in marker
technology. But usefulness of SNPs over other markers depends on a number of factors. If there is very little sequence information available then certainly SNPs should not be considered as the marker of choice, either RAPDs or AFLPs could be better choices. Cost of SNP genotyping assays is also a major factor where resources are limited because most of the current assays involve high cost. Efforts are being made to develop cost effective SNP genotyping assays. SNP research is also dependent on large-scale data handling and specialized softwares. Some of these softwares are not currently widely available. Once the SNPs have been generated, their amenability to automation could provide advantage over other markers, especially in plant breeding as it often requires genotyping of thousands of samples over tens of loci in a single breeding season. This is the great strength of SNPs when compared with other markers.
Although relatively new in their concept, SNPs are well on their way to becoming the important marker system in commercial plant breeding. Inspite of the large resources required to develop and utilize SNPs, due to other significant practical advantages, SNPs
are likely to become the method of choice to the plant biologists very soon.
Significance of SNPs in Plants
SNPs are by far the most common form of DNA polymorphism in a genome. They have been exten-sively used in genotyping human populations and most human sequence variation is attributable to SNPs. They are used in pharmacogenomics, diag-nostic and biomedical research. However, SNPs have not been in regular use yet in plant genotyping. A large amount of SNP data is available in humans but very limited data is available on SNPs in plants. This is mainly due to the enormous cost involved in developing SNPs, but since human geneticists have developed a number of SNP genotyping assays, plant biologists can take advantage and use the already well-developed assays in human studies. SNPs have tremendous potential for germplasm fingerprinting and MAS. In several crop plants, markers associated with phenotypic traits have been used in selection for desirable traits in plant breeding programmes. However, practical use of MAS has been very limited. The example where MAS has been actually used in plant breeding programme is in the development of soybean cultivars resistant to Soybean Cyst Nematode (SCN)91.
SNPs found in coding sequences may result in phenotypic polymorphism or show 100% association with a particular trait. Therefore, they can be used efficiently in MAS. SNPs present in close proximity to the coding sequences and showing <100% associ-ation can also be used in MAS.
SNPs: Applications and Prospects in Crop Genetics
DNA markers have been used for the detection of polymorphism. Among them, SSRs are usually preferred as they are highly informative but are less suitable for association studies because they exhibit homoplasy (occurrence of SSR allele of identical size but of different evolutionary origin and/or conversely SSRs of different size embedded in identical haplo-types)92. However, this can be overcome by using SNPs as they are highly informative and their assays do not require DNA separation by size. They are easier to locate in most single copy regions of genome than SSRs. Edward et al have identified abundant SNPs in the flanking sequence of maize micro-satellites26. Thus, SSRs can be converted into SNP markers.
i.exe

INDIAN J BIOTECHNOL, OCTOBER 2006
450
Table 1—Comparison of SNP genotyping techniques with respect to various papameters
Genotyping PNA Genetic bit TaqManTM Molecular Ligation Padlock probe Pyro- technique analysis beacon sequencing Homogeneous or solid phase
Homogeneous Solid phase Homogeneous Homogeneous Solid phase Homogeneous Homo- geneous
Real time or end point detection
End point End point Real time Real time End point End point Real time
Gel based or non-gel based
Both Non-gel Non-gel Non-gel Both Non-gel
Non-gel
PCR based or Non-PCR based
PCR based PCR based PCR based PCR based PCR based Non-PCR based
PCR based
Detection platform
(i) Staining
(ii) m/z ratio
Enzyme based
Fluorescence Fluorescence (i) Gel electrophoresis (ii) ELISA
Fluorescence Lumino- metric
*Specialized equipments needed
MALDI-TOF Colorimeter Fluorescence monitoring thermocycler
Fluorescence monitoring thermocycler
(i) Fluorescence detector/scanner (ii) Colorimeter
Fluorescence detector/scanner
Pyro- sequencer
Multiplexing ability
- Moderate Very Low Low High Limited Moderate
Cost Moderate to high
High High High Moderate High High
Genotyping technique
Invader squared assay
DASH Microarray AlphaScreen CAE EDEMNA Mini- sequencing
Homogeneous or solid phase
Homo- geneous
Solid phase Solid phase Homogeneous Homogeneous Solid phase Solid phase
Real time or end point detection
End point Real time End point End point End point End point End point
Gel based or non-gel based
Non-gel Non-gel Non-gel Non-gel Gel-based Non-gel Non-gel
PCR based or Non-PCR based
Non-PCR based
PCR based PCR based PCR based PCR based Non-PCR based
PCR based
Detection platform
Fluorescence Fluorescence Fluorescence Chemilumine-scence
Fluorescence Amperometric signals
(i) m/z ratio (ii) Fluore- scence
*Specialized Equipments needed
Fluorescence detector/ scanner
Fluorescence detector/ scanner
Chip scanner Luminometer Specialized softwares
Electrochemicalsensor
(i) MALDI- TOF (ii) Flow cytometer
Multiplexing ability
Low Moderate Very high High High High Moderate
Cost High Moderate Very high High High High High
Specificity High High Low (many times give false positive results)
High Moderate High Moderate
-Could not be ascertained *In addition to the routine equipments used in molecular biology lab, the technique requires the respective specialized equipment/s forSNP detection.

JEHAN & LAKHANPAUL: SNPs IN PLANTS
451
Nasu et al established 213 SNP markers distributed throughout the rice genome and thereby illustrating the immense potential of SNPs as molecular markers for genome research as well as molecular breeding of rice93. Analysis of chromosome 4 in two different subspecies of rice identified 9056 SNPs, 3627 of which are found to be in exons94 and 4,08,898 SNPs/INDEL between indica and japonica rice are discovered95. As the entire rice genome sequence is released, the significance of SNPs in various rice cultivars, strains and mutants is increasing for both genetic research and breeding. SNPs in hexaploid wheat, which can be converted into CAPS markers, have been identified96.
Use of SNP markers for linkage analysis has some of the following advantages:
(1) Analysis could be performed in early growth stage of plants, requiring only a small quantity of DNA.
(2) Time and labour could be saved, as no electrophoresis is required in most of the SNP genotyping assays.
SNPs in Association Studies: Role of LD
To understand the use of SNPs in association studies, the concept of Linkage Disequilibrium (LD) has to be understood first. In the simplest terms the non-random segregation of SNP alleles at different loci is referred to as LD. In case of SNPs the term ‘haplotype’ is preferred as compared to the term ‘allele’. Haplotype is a group of alleles on closely linked loci, which due to their proximity are usually inherited together. The current consensus is that each defined sequence type is a single haplotype and not a single allele. They can be analyzed for the presence of LD. Analysis of SNP haplotypes rather than of individual SNPs provides a more effective way of associating alleles with traits.
LD is a complex phenomenon and is of great interest to population geneticists. The existence of LD enables an allele of one polymorphic marker to be used as surrogate for a specific allele of another. Sometimes an allele is 100% predictive of the alleles present at the nearby polymorphic sites. However, the extent of LD depends on many factors like population history, presence of population bottlenecks, admix-ture, migration, immigration, inbreeding and frequency of recombination, i.e. ratio of genetic to physical distance3,92. LD can also be maintained by natural selection, as sometimes a particular combina-
tion of character states may be selectively favoured over others24. The magnitude and extent of LD is of interest because it will determine the choice of associ-ation mapping technology. In association mapping, alleles at a few selected candidate genes may be tested for association with a phenotype or on the other hand the whole genome may be scanned to identify regions that are associated with a particular phenotype. The minimum number of loci required to scan the genome is again dependent on the extent of LD. Regions of relatively high LD could require fewer loci to be genotyped since a single locus can represent a larger set24.
Extent of LD in Plants
Population bottlenecks and inbreeding increases LD. Populations undergone bottlenecks show exten-sive LD. Soybean in US went through severe bottlenecks when it was imported from Asia. Seven to ten plants introduced contributed four-fifth of the total diversity in soybean. In addition, due to an inbreeding species it is likely to show high LD. Haplotype analysis of SNPs in soybean for studying LD has proved that there is limited genetic variation in cultivated soybean97. In the case of maize, due to narrow genetic base, a slow decay of LD is expected inspite of the crop being an outcrosser. Studies conducted have reported large differences in the rate of LD decay in maize accessions eventhough broad sets of germplasm have been investigated92.
However, LD is not stable over long periods of time. With successive generations the level of LD between two markers decreases due to meiotic recom-bination events, which tend to shuffle alleles at different loci along with DNA. In case of two alleles A and B depicting LD, if recombination occurs between the two loci, the rate of decay of LD will be a function of recombination rate and number of generations. Assuming there is selective neutrality and no recurrent mutation then LD can be determined by the following equation:
LDt = (1-C)t LD0 … (1)
where, LDt, LD after t generation; LD0, Initial LD and C, Recombination frequency.
Thus the predictive value of B allele with respect to A allele depends on the age of polymorphism and recombination rate between A and B24. There are attempts to correlate SNP patterns with phenotypes to directly associate SNPs acting as markers. ‘Candidate gene’ approach can be used for successful association

INDIAN J BIOTECHNOL, OCTOBER 2006
452
studies, where the location of the susceptibility gene is either already known or suspected. The other more rational approach is whole genome analysis to identify the location of unknown susceptibility genes across the whole genome. In first step, a low density SNP map of the whole genome is used to identify region(s) containing potential agronomic trait gene(s). Once the region is identified, a high density SNP map is used to fish the agronomic trait gene within the region. The success of this approach greatly depends on the degree of LD across the genome since it will determine the number and location of SNPs required to make meaningful predictions98. A report on maize suggested that low level of LD in this species would require marker densities of one SNP every 100-200 bp for genome wide SNP scan. The high level of LD suggests that lower SNP densities will permit successful allele mining of soybean germplasm99.
Ching et al100 assessed SNP frequency, haplotype structure and linkage disequilibrium in elite maize inbred lines. They analyzed 18 loci in 36 diverse maize genotypes representing the major heterotic group of cultivated maize germplasm mainly of US origin. They analyzed primarily the 3′-UTR of the selected maize genes to maximize the SNP discovery. PCR primers were designed to amplify 300-500 bp segment of each gene to detect SNP by direct sequencing. They reported single nucleotide change occurring at an average of every 60.8 bp and the frequency was found to be about three times higher in non-coding regions than the coding regions. Most of the nucleotide changes in the protein-coding region were found to be silent, only 5 out of the 18 changes resulted in amino acid substitution. These large numbers of SNPs can be used as genetic markers and such a collection of SNPs may enable whole genome scanning LD for trait dissection and gene mapping in maize.
They found that haplotype is more informative than individual SNPs as expected heterozygosity in SNP was found to be 0.263 while haplotype expected heterozygosity value was 0.561 which is nearly twice the former suggesting that haplotype approach is better than individual SNP approach for genetic diagnostics.
The observed haplotypes and their distribution at different loci help to understand the process of domestication. The high yield and consequently heterosis in open pollinated varieties favour the presence of highly divergent haplotypes but at the
same time bottleneck effects limit the number of haplotypes. Due to these conflicting processes despite strong selection relatively high fraction of diversity is retained in the elite germplasm as few highly divergent haplotypes.
SNP Markers Associated with Genes of Economic Value
SNP markers associated with economic traits in plants are summarized in Table 2. They have the potential to be used in MAS and may enable extrapolation into transgenes.
Evaluation of Diversity and Cultivar Identification
Molecular markers have proven to be powerful tools for assessing genetic variation within and bet-ween populations of plants. SNPs have become popular tools for identifying genetic loci that contri-bute phenotypic variations.
SNP Markers in Tree Species Scots pine (Pinus sylvestris) is highly heterozygous
and many scots pine marker genes are highly variable. It suggests that the levels of nucleotide variation may be very high. However, sequence amplification and analysis in these trees can be performed in haploid megagametophytes to avoid problems caused by heterozygosity. SNP patterns have been examined in three scots pine populations for genes that encode several important enzymes or structural proteins e.g., Phenylalanine ammonia lyase (PAL), a key enzyme involved in lignin biosynthesis for the development of secondary xylem in wood formation so that selection can be exercised for desirable phenotypes using SNPs112.
Closely related species of Picea viz. P. rubens (red spruce), P. mariana (black spruce) and P. glauca (white spruce) are difficult to differentiate morpho-logically. A total of 12 nuclear and 13 chloroplast SNPs has been developed in these species, which can distinguish white, red and black spruce113. Two species-specific SNPs, which could distinguish black spruce from red spruce and white spruce showed consistency among 96-100% of the trees surveyed. Five SNPs that distinguished white spruce from red and black spruce were consistent among 100% of surveyed trees. These species-specific SNPs marker can identify anonymous spruce samples even with small amounts of tissue as little as single needles.
Eurychoma longifolia Jack. (Family Simarou-baceae) is widely used throughout Southeast Asia for its reported medicinal properties. It is used tradi-tionally as a blood coagulant, for the treatment of
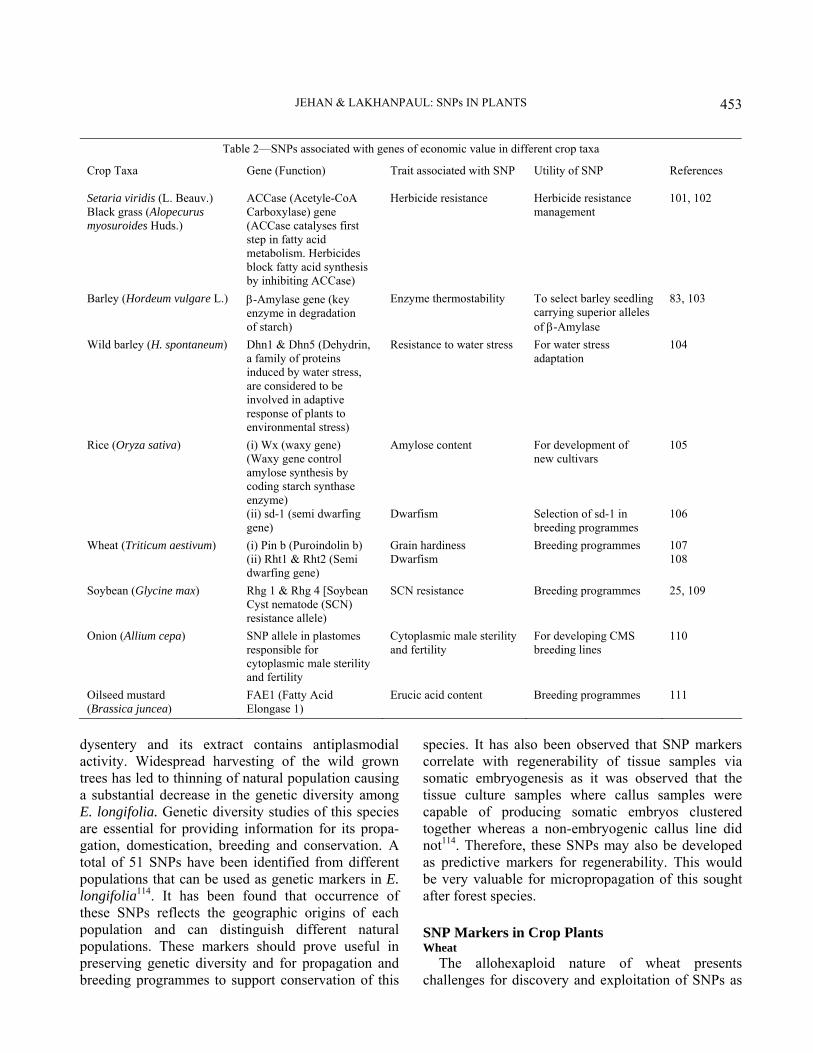
JEHAN & LAKHANPAUL: SNPs IN PLANTS
453
dysentery and its extract contains antiplasmodial activity. Widespread harvesting of the wild grown trees has led to thinning of natural population causing a substantial decrease in the genetic diversity among E. longifolia. Genetic diversity studies of this species are essential for providing information for its propa-gation, domestication, breeding and conservation. A total of 51 SNPs have been identified from different populations that can be used as genetic markers in E. longifolia114. It has been found that occurrence of these SNPs reflects the geographic origins of each population and can distinguish different natural populations. These markers should prove useful in preserving genetic diversity and for propagation and breeding programmes to support conservation of this
species. It has also been observed that SNP markers correlate with regenerability of tissue samples via somatic embryogenesis as it was observed that the tissue culture samples where callus samples were capable of producing somatic embryos clustered together whereas a non-embryogenic callus line did not114. Therefore, these SNPs may also be developed as predictive markers for regenerability. This would be very valuable for micropropagation of this sought after forest species.
SNP Markers in Crop Plants Wheat
The allohexaploid nature of wheat presents challenges for discovery and exploitation of SNPs as
Table 2—SNPs associated with genes of economic value in different crop taxa
Crop Taxa Gene (Function) Trait associated with SNP Utility of SNP References Setaria viridis (L. Beauv.) Black grass (Alopecurus myosuroides Huds.)
ACCase (Acetyle-CoA Carboxylase) gene (ACCase catalyses first step in fatty acid metabolism. Herbicides block fatty acid synthesis by inhibiting ACCase)
Herbicide resistance Herbicide resistance management
101, 102
Barley (Hordeum vulgare L.) β-Amylase gene (key enzyme in degradation of starch)
Enzyme thermostability To select barley seedling carrying superior alleles of β-Amylase
83, 103
Wild barley (H. spontaneum) Dhn1 & Dhn5 (Dehydrin, a family of proteins induced by water stress, are considered to be involved in adaptive response of plants to environmental stress)
Resistance to water stress For water stress adaptation
104
Rice (Oryza sativa) (i) Wx (waxy gene) (Waxy gene control amylose synthesis by coding starch synthase enzyme) (ii) sd-1 (semi dwarfing gene)
Amylose content Dwarfism
For development of new cultivars Selection of sd-1 in breeding programmes
105 106
Wheat (Triticum aestivum) (i) Pin b (Puroindolin b) (ii) Rht1 & Rht2 (Semi dwarfing gene)
Grain hardiness Dwarfism
Breeding programmes 107 108
Soybean (Glycine max) Rhg 1 & Rhg 4 [Soybean Cyst nematode (SCN) resistance allele)
SCN resistance Breeding programmes 25, 109
Onion (Allium cepa) SNP allele in plastomes responsible for cytoplasmic male sterility and fertility
Cytoplasmic male sterility and fertility
For developing CMS breeding lines
110
Oilseed mustard (Brassica juncea)
FAE1 (Fatty Acid Elongase 1)
Erucic acid content Breeding programmes 111
INDIAN J BIOTECHNOL, OCTOBER 2006
454
diagnostic markers as it contains excessive amounts of both repeated DNA and paralogous gene families115. At DuPont Biotech 1 kb fragment of DNA from 3 genes viz. Starch branching enzyme1, ADP-glucose pyrophosphorylase and Granule Bound Starch Synthase were amplified116. Resulting pool of ampli-fied products represented a mixture of sequences from the A, B and D genomes, as these genes exist as homeologous loci. On cloning and sequencing 24 colonies per gene, one SNP every 20 bp were detected, which will allow development of genome specific primers. The genome specific primers can be utilized to evaluate the level of intervarietal SNP variation in wheat for each genome. The SNP variation can be correlated with phenotypic diffe-rences and can provide new sources of desirable allelic variation in land races and wild relatives for gene introgression.
Due to explosion in availability of ESTs they can be used for the development of SNP markers in wheat. ESTs enable PCR primers to be designed that will amplify the sequence present at one locus only. It also enables the verification that the SNP is real and not a sequencing error117. An open international con-sortium of public and private institutions is attempting to mine the EST contigs in a coordinated way, pooling information on validated SNPs and avoiding duplication of effort (http://wheat.pw.usda.gov/ITMI/ 2002/wheatSNP.html).
Maize
Diversity of DNA sequences among the maize genome is greater than that of humans or fruit flies according to the survey of chromosome 1 in maize. It has been estimated that on an average, two randomly sampled maize DNA sequence has one SNP every 104 base pairs118. Shattuck-Eidens et al121 studied four loci for variation due to SNPs and indels in seven yellow dent genotypes, depicting variant occurring for every 13 bases. Selinger and Chandler sequenced a 594 bp region of a regulatory gene in maize (b gene) in 18 genotypes120. They found 116 SNPs and 30 small insertions of 1-15 bp. Doebley and Colleagues used SNP data from tb1 (teosinte branched) gene of maize and concluded that during domestication selection affected the promoter region more strongly than the coding region, thereby leading to a change in the phenotype121.
The abundance of SNPs makes them highly useful for placing ESTs or the candidate genes onto a genetic map that has been previously constructed with other
markers. Ching and Rafalski reported EST mapping using pyrosequencing method (described earlier in SNP genotyping) in B73 and Mol 17 lines of maize122. It is frequently needed to genetically map a newly identified EST. They first identified polymorphisms between two mapping parents within the EST sequence by dideoxy sequencing of the corresponding PCR amplified segments of the genomic DNA. About 3-8 SNPs were found within single lane of sequence (300-600 bp). A sequencing primer close to the identified SNP site(s) is designed, amplified and then pyrosequencing done to sequence several bases including the SNP site and then the EST is mapped.
Dupont and Pioneer Hi-Bred analyzed EST collection from Dupont and designed primers to amplify about 300 bp preceding the polyadenylation site at 3′-unsaturated segments of maize genes. Genomic DNA from over 30 maize lines was ampli-fied and sequenced. The alignment and analysis of amplification products from 20 loci randomly distributed in the genome revealed the occurrence of one SNP per 70 bp and one indel per 160 bp. Examination of the patterns of nucleotide changes between different corn lines reveals conservation of haplotypes spanning up to 300 bp or more25. Now, SNP haptotype composition of maize ancestors and relatives are also being examined. This study allowed selection of eight maize lines representing maximum allelic diversity and this set of genotypes will be used to catalogue SNP alleles at 1000 loci selected from ESTs and genes of applied interest25.
Barley
In a study of a number of barley cultivars, SNPs were detected and allele-specific primers were developed, which enabled identification of these cultivars. Sequences of more than 50 loci among modern barley varieties were compared. On an average one SNP per 189 bp sequence was found123. An assortment of SNP haplotypes by germplasm group has been observed. Similar alleles are present in both cultivated barley and various Hordeum spontaneum accessions suggesting either multiple domestication event or multiple transfers of genes between barley and its wild ancestors. This provides the possibility of generating a number of well-characterized SNP markers for each chromosome and performing genome wide haplotype analysis. This approach would be useful for QTL analysis, marker assisted selection and varietal identification.

JEHAN & LAKHANPAUL: SNPs IN PLANTS
455
Soybean The frequency of sequence polymorphism within
coding regions of cultivated soybean and its progenitor Glycine soja is in lower magnitude than that of other crops like maize. However, introns, 3' and 5' UTRs (Untranslated Regions) and associated genomic DNA exhibit higher levels of polymorphism and appear to be a good source of SNPs in soybean99. More than 22,000 soybean unigenes have been defined and 3′-end EST sequence data are available for each. Using 3′-EST data, PCR primers were designed for amplification of DNA sequences124. Many of these primer sets amplified multiple fragments due to tetraploid nature of soybean genome. SNP frequency reported was 1.4/kbp in exon sequences and 2.0/kbp in intron sequences. A large proportion of the SNPs discovered in exons appear to be in the 3′-UTR sequence.
Other Crops
Undoubtedly, SNPs represent one of the most powerful tools for analysis of genomes, as proved in human research but in the case of crop and horticultural plants not much has been done in this direction. Grapevine (Vitis vinifera L.) has a relatively small genome (475 Mbp). Inspite of this, very little is known about grape genetics. In order to improve the knowledge of genetic diversity in V. vinifera and to rationalize the management of grape collections, analysis of the genome using nuclear microsatellite markers and polymorphism in the chloroplast genome using SNP markers has been done125. Seventeen SNP markers have been analyzed in the chloroplast genome of grapevine. SNP frequency of one every 78 bp has been discovered in grapevine126.
SNPs have been identified in the allele sequences of 8 to 12 sunflower genotypes for a sample of 81 loci originally mapped using RFLP markers127. High throughput SNP markers have been developed for the RFLP loci for linkage mapping, diversity analysis, molecular breeding and genomics research. The goal is to assess the utility and polymorphism of the SNP markers across a genetically diverse panel of unse-quenced wild and domesticated sunflower genotypes.
TraitGenetics, Germany intended to contribute SNP markers in sugar beet by employing a high throughput procedure for SNP development. In order to achieve this, primer pairs are deduced from EST sequences. Using these primers DNA is amplified, purified and sequenced. Under strict quality criteria chosen to avoid analysis of sequencing error, an SNP
is called when the minor allele occurs at least in two reliable sequences of the panel. Currently, more than 1000 SNPs have been detected with an average of 4.6 SNPs per amplicon128. A set of SNP marker has been developed for nine likage groups of sugar beet. Each set monitors polymorphic state of five to six linked marker loci129.
Cultivated tomato (Lycopersicon esculentum Mill.) has very low polymorphism rate therefore SNP discovery through de novo sequencing is inefficient because the polymorphism rate is lower than the sequencing error. SNP mining from EST database is a better approach in this species. Yang et al analyzed EST sequences of various varieties for SNP and detected one SNP for every 7000 bases analyzed129. They identified 101 candidate SNPs in 31 genes. These SNPs can be used in the mapping of tomato genome and for other applications.
The genome of sweet potato, a major food crop in some areas, remains very little understood. A compa-rative genome analysis project has been initiated for understanding the sweet potato genome using DNA sequence information specific for the model plant species, Arabidopsis thaliana. The analysis of the sweet potato genome involved primers specific for a 5 kb A. thaliana sequence found in GenBank. Sequences used to design the primers were both gene based and non-coding. A total of eight SNPs were detected in about 12000 bp of sweet potato genome scanned130.
In plants, however, the application of SNPs is only at an initial stage and potentially a lot more can be achieved in future. With the increasing number of cost-effective and rapid SNP detection and geno-typing techniques becoming available and enormous genomic and cDNA databases, SNPs will certainly be used in crop genetics on a routine basis for various applications including genetic diversity along with assessment and association of economic traits studies.
Acknowledgement
Dr K V Bhat, National Research Centre on DNA Fingerprinting, National Bureau of Plant Genetic Resources, New Delhi, India is gratefully acknow-ledged for his critical suggestions. TJ acknowledges the financial support from Council for Scientific and Industrial Research, Government of India.
References
1 O’Neill R, Snowdon R & Köhler W, Population genetics: Aspects of biodiversity, Prog Bot, 64 (2003) 115-137.

INDIAN J BIOTECHNOL, OCTOBER 2006
456
2 Gupta P K, Roy J K & Prasad M, DNA chips, microarrays and genomics, Curr Sci, 77 (1999) 875-884.
3 Brookes A J, The essence of SNPs, Gene, 234 (1999) 177-186.
4 Sachidanandam R, Wiessman D, Schmidt S C, Kakol J M, Stein L D et al, A map of human genome sequence variation containing 1.42 million single nucleotide polymorphisms, Nature (Lond), 409 (2001) 928-933.
5 Bhattramakki D, Ching A, Morgante M, Dolan M, Register J et al, Conserved single nucleotide polymorphism (SNP) haplotypes in maize, in Proc Plant Anim Genomes VIII Conf (San Diego, CA) 2000 (http://www.intl-pag.org/pag/8/ abstracts/).
6 Xiong M & Jin L, Comparison of the power and accuracy of biallelic and microsatellite markers in population based gene-mapping methods, Am J Hum Genet, 64 (1999) 629-640.
7 Kruglyak L, The use of a genetic map of biallelic markers in linkage studies, Nat Genet, 17 (1997) 21-24.
8 Masood E, An consortium plans free SNP map of human genome, Nature (Lond), 398 (1999) 545-546.
9 Leslei R, SNP mappers confronts reality and find it daunting, Science, 287 (2000) 1898-1899.
10 Thorisson G A & Stein L D, The SNP consortium website: Past, present and future, Nucleic Acids Res, 31 (2003) 124-127.
11 Sherry S T, Ward M H, Kholodov M, Baker J, Phan L et al, dbSNP: The NCBI database of genetic variation, Nucleic Acids Res, 29 (2001) 308-311.
12 Syvånen A, Landergren U, Isaksson A, Gyllensten U & Brookes A, Enthusiasm mixed with scepticism about single nucleotide polymorphism markers for dissecting complex disorders, Eur J Hum Genet, 7 (1999) 98-101.
13 Zubritsky E, SNP mining–The rush is on, Anal Chem News Features, 71 (1999) 683A-686A.
14 Cotton R G H, Rodrigues N R & Campbell R D, Reactivity of cytosine and thymine in single-base-mismatches with hydroxylamine and osmium tetraoxide and its application to the study of mutations, Proc Natl Acad Sci USA, 85 (1988) 4397-4401.
15 Youil R, Kemper B W & Cotton R G H, Screening for mutations by enzyme mismatch cleavage with T4 endo-nuclease VII, Proc Natl Acad Sci USA, 92 (1995) 87-91.
16 Huang T J, Kirk B, Favis R, Soussi T, Paty P et al, An endo-nuclease/ligase based mutation scanning method especially suited for analysis of neoplastic tissue, Oncogene, 21 (2002) 1909-1921.
17 Tong J, Cao W & Barany F, Biochemical properties of a high fidelity DNA ligase from Thermus species AK16D, Nucleic Acids Res, 27 (1999) 788-794.
18 Taillon-Miller P, Gu Z, Li Q, Hiller L & Kwok P Y, Over-lapping genome sequences: A treasure trove of single nucleotide polymorphism, Genome Res, 8 (1998) 748-754.
19 Landergren U, Kaisar R, Sanders J & Hood L, A ligase-mediated gene detection technique, Science, 241 (1988) 1077-1080.
20 Tobe V O, Taylor S N & Nickerson D A, Single-well genotyping of diallelic sequence variation by a two colour ELISA-based oligonucleotide ligation assay, Nucleic Acids Res, 24 (1996) 3728-3732.
21 Nickerson D A, Kaiser R, Lappin S, Stewart J, Hood L et al, Automated DNA diagnostics using ELISA-based oligo-
nucleotide ligation assay, Proc Natl Acad Sci USA, 87 (1990) 8923-8927.
22 Altshuler D, Pollara V J, Cowles C R, Van Etten W J, Balwin J et al, An SNP map of the human genome generated by reduced representation shotgun sequencing, Nature (Lond), 407 (2000) 513-515.
23 Howell W M, Jobs M, Gyllensten U & Brookes A J, Dynamic allele specific hybridization, Nat Biotechnol, 17 (1999) 87-88.
24 Kirk B W, Feinsod M, Favis R, Kleiman R M & Barany F, Single nucleotide polymorphism seeking long-term associ-ation with complex disease, Nucleic Acids Res, 30 (2002) 3295-3311.
25 Gupta P K, Roy J K & Prasad M, Single nucleotide polymor-phisms: A new paradigm for molecular marker technology and DNA polymorphism detection with emphasis on their use in plants, Curr Sci, 80 (2001) 524-535.
26 Edward K J & Mogg R, Plant genotyping by analysis of single nucleotide polymorphisms, in Plant genotyping: The DNA fingerprinting of plants, edited by R J Henry (CABI Publishing, UK) 2001, 1-13.
27 Nicod J & Largiader C R, SNPs by AFLP (SBA): A rapid SNP isolation strategy for non-model organisms, Nucleic Acids Res, 31 (2003) e19.
28 Bhattaramakki D & Rafalski A, Discovery and applications of single nucleotide polymorphism markers in plants, in Plant genotyping: The DNA fingerprinting of plants, edited by R J Henry (CABI Publishing, UK) 2001, 179-193.
29 Buetow K H, Edmonson M N & Cassidy A B, Reliable identification of large number of candidate SNPs from public EST data, Nat Genet, 21 (1999) 323-325.
30 Schmid K J, Sorensen T R, Stracks R, Torjek O, Altmann T et al, Large-scale identification and analysis of genome wide single nucleotide polymorphism for mapping in Arabidopsis thaliana, Genome Res, 13 (2002) 1250-1257.
31 Kota R, Vashney R K, Theiel T, Dehmes K S & Graner A, Generation and comparison of EST derived SSRs and SNPs in barley, Hereditas, 135 (2001) 145-151.
32 Mochida K, Yamazaki Y & Ogihare Y, Discrimination of homologous gene expression in hexaploid wheat by SNP analysis of contigs grouped from a large number of expressed sequence tags, Mol Gen Genomics, 270 (2003) 371-377.
33 Somers D J, Kirkpatrick R, Moniwa M & Walsh A, Mining SNP from hexaploid wheat ESTs, Genome, 46 (2003) 431-437.
34 Orita M, Iwahana H, Kanazawa H, Hayashi K & Sekiya T, Detection of polymorphism of human DNA by gel electro-phoresis as single-strand conformation polymorphisms, Proc Natl Acad Sci USA, 86 (1989) 2766-2770.
35 Etscheid M & Riesner D, TGGE and DGGE, in Molecular tools for screening biodiversity, edited by A Karp, P G Isaac & D S Ingram (Chapman & Hall, London) 133-156.
36 Myers R M, Lumelski N, Lerman L S & Maniatis T, Detection of single base substitution in total genomic DNA, Nature (Lond), 313 (1985) 495-497.
37 Kinoshita-Kikuta E, Kinoshita E & Koike T, A novel procedure for simple and efficient genotyping of single nucleotide polymorphisms by using the Zn2+-cyclen complex, Nucleic Acids Res, 30 (2002) e126.
38 Shionaya M, Kimura E & Shiro M, A new ternery Zn(II) complex with [12]ane N4(1,4,7,10-tetraazacyclododecane)

JEHAN & LAKHANPAUL: SNPs IN PLANTS
457
and AZT (=3′ azido-3′-deoxythymidine), J Am Chem Soc, 115 (1993) 6730-6737.
39 Orum H, Neilson P E, Egholm M, Berg R H, Buchardt O et al, Single base pair mutation analysis by PNA directed PCR clamping, Nucleic Acids Res, 21 (1993) 5332-5336.
40 Lemieux B, Plant genotyping based on analysis of single nucleotide polymorphisms using microarrays, in Plant genotyping: The DNA fingerprinting of plants, edited by R J Henry (CABI Publishing, UK) 2001, 47-57.
41 Ross P L, Discrimination of single nucleotide polymorphism in human DNA using peptide nucleic acid probes detected by MALDI-TOF mass spectrometry, Anal Chem, 69 (1997) 4197-4202.
42 Griffin T J, Tang W & Smith L M, Genetic analysis by peptide nucleic acid affinity MALDI-TOF mass spectro-metry, Nat Biotechnol, 15 (1997) 1368-1372.
43 Griffin T J & Smith L M, An approach to predicting the stabilities of peptide nucleic acid: DNA duplexes, Anal Biochem, 260 (1998) 56-63.
44 Giesen U, A formula for thermal stability (Tm) prediction of PNA/DNA duplexes, Nucleic Acids Res, 26 (1998) 5004-5006.
45 Kota R, Wolf M, Michalek W & Graner A, Application of denaturing high performance liquid chromatography for mapping of SNPs in barley (Hordeum vulgare L.), Genome, 44 (2001) 523-528.
46 Tyagi S & Kramer F R, Molecular beacons: Probes that fluo-resce upon hybridization, Nat Biotechnol, 14 (1996) 303-308.
47 Tyagi S, Bratu D P & Kramer F R, Multicolour molecular beacons for allele discrimination, Nat Biotechnol, 16 (1998) 49-56.
48 Wang H, Li J, Liu H, Liu Q, Wang Y et al, Label-free detection of a single nucleotide mismatch by immobilization of molecular beacon on an agarose film, Nucleic Acids Res, 30 (2002) e61.
49 Tyagi S, Marras S A E & Kramer F R, Wavelength-shifting molecular beacons, Nat Biotechnol, 18 (2000) 1191-1196.
50 Ullman E F, Kirakossian H, Singh S, Ping Wu Z, Irvin B R et al, Luminescent oxygen channeling immunoassay: Measurement of particle binding kinetics by chemilum-iniscence, Proc Natl Acad Sci USA, 91 (1994) 5426-5430.
51 Beaudet L, Bedard J, Breton B, Mercuri R & Budarf M L, Homogeneous assays for single nucleotide polymorphism typing using Alphascreen, Genome Res, 11 (2001) 600-608.
52 Patel R, Pollner R, De Kecker S, Pease J, Pirio M et al, Quantification of DNA using the luminescent oxygen channeling assays, Clin Chem, 46 (2000) 1471-1477.
53 Kheterpal I & Mathies R A, Capillary array electrophoresis DNA sequencing, Anal Chem, 17 (1999) 31A-37A.
54 Kheterpal I, Scherer J R, Clark S M, Radhakrishan A, Ju J et al, DNA sequencing using a four-colour confocal fluore-scence capillary array scanner, Electrophoresis, 17 (1996) 1852-1859.
55 Shi Y, Simpson P C, Scherer J R, Wexler D, Skibola C et al, Radial capillary array electrophoresis microplate and scanner for high-performance nucleic acid analysis, Anal Chem, 71 (1999) 5354-5361.
56 Medintz I, Wong W W, Berti L, Shiow L, Ton J et al, High performance multiplex SNP analysis of three Hemochro-matosis-related mutations with capillary array electro-phoresis microplates, Genome Res, 11 (2001) 413-421.
57 Huang T J, Liu M, Knight L D, Grody W W, Miller J F et al, An electrochemical detection scheme for identification of single nucleotide polymorphism using hairpin-forming probes, Nucleic Acids Res, 30 (2002) e55-e63.
58 Doyle M J, Halsall H B & Heineman W R, Enzyme-linked immunoadsorbent assay with electrochemical detection for α1-acid glycoprotein, Anal Chem, 56 (1984) 2355-2360.
59 Cho R J, Mindrius M, Richerds R, Sapolsky R J, Anderson M et al, Genome wide mapping with biallelic markers in Arabidopsis thaliana, Nat Genet, 23 (1999) 203-207.
60 Pease A N, Solas D, Sullivan E J, Cronin M T, Holmes C P et al, Light generated oligonucleotide arrays for rapid DNA sequence analysis, Proc Natl Acad Sci USA, 91 (1994) 5022-5026.
61 Chee M, Yang R, Hubbell E, Berno A, Huang X C et al, Assessing genetic information with high-density DNA arrays, Science, 274 (1996) 610-614.
62 Gilles P N, Wu D J, Foster C B, Dillon P J & Chanock S J, Single nucleotide polymorphic discrimination by an electronic dot blot assay on semiconductor microchips, Nat Biotechnol, 17 (1999) 365-370.
63 Sosnowski R G, Tu E, Butler W F, O’Connel J P & Heller M J, Rapid determination of single base mismatch mutations in DNA hybrids by direct electric field control, Proc Natl Acad Sci USA, 94 (1997) 1119-1123.
64 Nikiferov T, Rendle R B, Goelet P, Rogers Y, Kotewicz M L et al, Genetic bit analysis: A solid phase method for typing single nucleotide polymorphisms, Nucleic Acids Res, 22 (1994) 4167-4175.
65 Nilsson M, Malmgren H, Samiotaki M, Kwaitkwoski M, Chowdhary B P et al, Padlock probes: Circularizing oligo-nucleotides for localized DNA detection, Science, 265 (1994) 2085-2088.
66 Nilsson M, Krejci K, Koch J, Kwaitkwoski M, Gustavsson P et al, Padlock probes reveals single-nucleotide differences, parent of origin and in situ distribution of centromeric sequences in human chromosomes 13 and 21, Nat Genet, 16 (1997) 252-255.
67 Lizardi P M, Huang X, Zhu Z, Bray-Ward P, Thomas D C et al, Mutation detection and single-molecule counting using isothermal rolling circle amplification, Nat Genet, 19 (1998) 225-232.
68 Banér J, Nilsson M, Mendel-Hartig M & Landegren U, Signal amplification of padlock probes by rolling circle replication, Nucleic Acids Res, 26 (1998) 5073-5078.
69 Mendel-Hartig M, Banér J, Nilsson M & Landegren U, Localized mutation detection with padlock probes and rolling circle replication, Clin Chem, 45 (1999) 2050.
70 Ronaghi M, Uhlén M & Nyrén P, A sequencing method based on real-time pyrophosphate, Science, 281 (1998) 363-364.
71 Ahmadian, Gharizadeh B, Gustafsson A C, Sterky F, Nyren P et al, Single nucleotide polymorphism analysis by pyro-sequencing, Anal Biochem, 280 (2000) 103-110.
72 Lyamichev V I, Mast A L, Hall J G, Prudent J R, Kaiser M W et al, Polymorphism identification and quantitative detection of genomic DNA by invasive cleavage of oligo-nucleotide probes, Nat Biotechnol, 17 (1999) 292-297.
73 Griffin T J, Hall J G, Prudent J R & Smith L M, Direct genetic analysis by matrix assisted laser desorption/ onization mass spectrometry, Proc Natl Acad Sci USA, 96 (1999) 6301-6306.
INDIAN J BIOTECHNOL, OCTOBER 2006
458
74 Lyamichev V I, Kaiser M W, Lyamichev N E, Vologodski A V, Hall J G et al, Experimental and theoretical analysis of the invasive signal amplification reaction, Biochemistry, 39 (2000) 9523-9532.
75 Mein L A, Barratt B J, Dunn M G, Siegmund T, Smith A N et al, Evaluation of single nucleotide polymorphism typing with invader on PCR amplicon and its automation, Genome Res, 10 (2000) 330-343.
76 Carlson C S, Newman T L & Nickerson D A, SNPing the human genome, Chemical Biol, 5 (2001) 78-85.
77 Hillenkamp F, Matrix assisted laser desorption/ionization mass spectrometry of biopolymers, Anal Chem, 63 (1991) 1193A-1202A.
78 Nordhoff E, Matrix assisted laser desorption/ionization mass spectrometry as a new method for characterization of nucleic acids, Trends Anal Chem, 15 (1996) 240-250.
79 Yates J R, Mass spectrometry and the age of proteome, J Mass Spectrom, 33 (1998) 1-19.
80 Fu D J, Tang K, Braun A, Reuter D, Demar B et al, Sequencing exons 5 to 8 of the p53 gene by MALDI-TOF mass spectrometry, Nat Biotechnol, 16 (1998) 381-384.
81 Kirpekar F, Nordhoff E, Larsen L K, Kristiansen K, Roepstorff P et al, DNA sequence analysis by MALDI mass spectrometry, Nucleic Acids Res, 26 (1998) 2554-2559.
82 Griffin T J & Smith L M, Single nucleotide polymorphism analysis by MALDI-TOF mass spectrometry, Trends Biotechnol, 18 (2000) 77-84.
83 Paris M, Lance R & Jones M G K, Single nucleotide primer extensions to type SNPs in barley, in Proc 10th Australian Barley Tech Symp (ACT, Canberra, Australia) 2001.
84 Haff L A & Smirnov I P, Multiplex genotyping of PCR products with masstag-labeled primers, Nucleic Acids Res, 25 (1997) 3749-3750.
85 Butler J M, Peptide nucleic acid characterization by MALDI-TOF mass spectrometry, Anal Chem, 68 (1996) 3283-3287.
86 Chen X, Fei Z, Smith L M, Bradburg E M & Majidi V, Stable isotope-assisted MALDI-TOF mass spectrometry for accurate determination of nucleotide composition of PCR products, Anal Chem, 71 (1999) 3118-3125.
87 Abdi F, Bradburg M, Dogett N & Chen X, Rapid characterization of DNA oligomers and genotyping of single nucleotide polymorphism using nucleotide specific mass tags, Nucleic Acids Res, 29 (2001) e61-e72.
88 Cai H, White P S, Torney D, Deshpande A, Wang Z et al, Flow cytometry-based minisequencing: A new platform for high throughput single nucleotide polymorphism scoring, Genomics, 66 (2000) 135-143.
89 Chicurel M, Faster, better, cheaper genotyping, Nature (Lond), 412 (2001) 580-582.
90 Ellis M C, “Spot on” SNP genotyping, Genome Res, 10 (2000) 895-897.
91 Young N D, A cautiously optimistic vision for marker assisted breeding, Mol Breed, 5 (1999) 505-510.
92 Rafalski A, Applications of single nucleotide polymorphism in crop genetics, Curr Opin Plant Biol, 5 (2002) 94-100.
93 Nasu S, Suzuki J, Ohta K, Hasegawa K, Yui I et al, Search and analysis of single nucleotide polymorphisms (SNP) in rice and establishment of SNP markers, DNA Res, 9 (2002) 163-171.
94 Han B & Hue Y, Genome wide intraspecific DNA sequence variations in rice, Curr Opin Plant Biol, 6 (2003) 134-138.
95 Feltus E A, Wan J, Schulze S R, Estill J C & Jiang N, An SNP resource for rice genetics and based on subspecies indica and japonica genome alignments, Gemone Res, 14 (2004) 1812-1819.
96 Blake N K, Sherman J D, Dvorek J & Talbert L E, Genome specific primer sets for starch biosynthesis genes in wheat, Theor Appl Genet, Vol (2004) Pages
97 Zhu Y L, Song Q J, Hyten D L, Tassel C P, Matu K L et al, Single nucleotide polymorphism in soybean, Genetics, 163 (2003) 1123-1134.
98 Roses A D, Pharmacogenetics and the practices of medicine, Nature (Lond), 405 (2000) 857-865.
99 Cregan P B, Zhu Y & Song Q, SNP detection and mapping in soybean and related Glycine species, in Proc Plant, Anim, Microbes Genome X Conf (San Diego, CA) 2002 (http://www.intl-pag.org/pag/10/abstracts/).
100 Ching A, Caldwell K S, Jung M, Dolan M, Smith O et al, Haplotype structure and linkage disequilibrium in elite maize inbred lines, BMC Genet, 3 (2002) 19.
101 Délye C, Calmes E & Matejcek A, SNP markers for black grass (Alopecurus myosuroides Huds.) genotypes resistant to acetyl CoA-carboxylase inhibiting herbicides, Theor Appl Genet, 104 (2002) 1114-1120.
102 Délye C, Wang T & Darmency H, An isoleucine-leucine substitution in chloroplast acetyl-CoA carboxylase from green foxtail (Setaria viridis L. Beauv.) is responsible for resistance to the cyclohexanedione herbicide sethoxydim, Planta, 214 (2002) 421-427.
103 Chiapparino E, Lee D, Acquadro A, Tuberosa R & Donini P, Detection and characterization of SNPs from sequences coding hydrolytic enzymes in malting barley varieties, in Proc Plant, Anim Genomes XI Conf (San Diego, CA) 2003 (http://www.intl-pag.org/pag/11/abstracts/).
104 Weining S, Hu Y & Nevo E, Towards understanding the molecular mechanism of drought resistance in wild barley through the identification of nucleic acids polymorphisms in dehydrin gene, in Proc Plant, Anim Genomes XI Conf (San Diego, CA) 2003, (http://www.intl-pag.org/pag/11/ abstracts/).
105 Ayres N M, Anna M M, Larkin P D, Bligh H F J, Jonnes C et al, Microsatellites and a single nucleotide polymorphism differentiate apparent amylase classes in an extended pedigree of US rice germplasm (2000) (http://www.nal.usda. gov/ttic/tektran/data/000007/55/0000075521.html).
106 Garland S H, Lewin L, Blakmey A & Henry R, Micro-satellite and SNP marker for sd-1 in rice, in Proc Plant, Anim Genomes VIII Conf (San Diego, CA) 2000 (http://www.intl-pag.org/pag/8/abstracts/).
107 Huang X & Coder M S, Development of SNP assays for genotyping the Puroindoline b gene for grain hardiness in wheat using pyrosequencing, J Agric Food Chem, 53 (2005) 2070-2075.
108 Ellis M, Speilmeyer W, Gale K, Rebetzke G & Richards R, “Perfect” markers for the Rht-B1b and Rht-D1b dwarfing genes in wheat, Theor Appl Genet, 105 (2005) 1038-1042.
109 Jang S Y & Lee S, Sequence variation on major plant disease genes of soybean, in Proc Plant, Anim Genomes XI Conf (San Diego, CA) 2003 (http://www.intl-pag.org/pag/11/ abstracts/).
110 Acala J, Giovannoni L M, Pike L M & Reddy A S, Application of genetic bit analysis (GBATM) for allelic selection in plant breeding, Mol Breed, 3 (1997) 495-502.

JEHAN & LAKHANPAUL: SNPs IN PLANTS
459
111 Gupta V, Mukhopadhyaya A, Arumugam N, Sodhi Y S, Pental D et al, Molecular tagging of erucic acid trait in oilseed mustard (Brassica juncea) by QTL mapping and single nucleotide polymorphism in FAE1 gene, Theor Appl Genet, 108 (2004) 743-749.
112 Dvornik V, Mikkonen M, Sirviö A & Savolainin O, Single nucleotide polymorphisms in scots pine, in Proc Plant, Anim Genomes VIII Conf (San Diego, CA) 2000 (http://www.intl-pag.org/pag/8/abstracts/).
113 Germano J & Klein A S, Species-specific nuclear and chloroplast single nucleotide polymorphisms to distinguish Picea glauca, P. mariana and P. rubens, Theor Appl Genet, 99 (1999) 37-49.
114 Osman A, Jordan B, Lessard P A, Muhammad N, Rosli Haron M et al, Genetic diversity in Eurychoma longifolia inferred from single nucleotide polymorphisms, Plant Physiol, 131 (2003) 1294-1301.
115 Procunier J D, Gray M, Ali L, Zhou Y, Prashar S et al, Single nucleotide polymorphisms (SNPs) in hexaploid wheat and high throughput SNP detection by invader operating system, in Proc Plant Anim Genomes XI Conf (San Diego, CA) 2003 (http://www.intl-pag.org/pag/11/abstracts/).
116 Wolters P, Powell W, Lagudah E, Snape J & Henderson K, Nucleotide diversity at homeologous loci in wheat, in Proc Plant Anim Genomes VIII Conf (San Diego, CA) 2000 (http://www.intl-pag.org/pag/8/abstracts/).
117 Isaac P, Somers D, Banks T & Matthews D, Towards a mutational atlas of wheat-the heat SNP initiative, in Proc Plant Anim Genomes XI Conf (San Diego, CA) 2003 (http://www.intl-pag.org/pag/11/abstracts/).
118 Tenaillon M I, Patterns of DNA sequence polymorphism along chromosome 1 of maize (Zea mays ssp. mays L.), Proc Natl Acad Sci USA, 98 (2001) 9161-9166.
119 Shattuck-Eidens D M, Bell R N, Neuhausen S L & Helentjaris T, DNA sequence variation within maize and melon: Observation from polymerase chain reaction amplification and direct sequencing, Genetics, 126 (1990) 207-217.
120 Selinger D A & Chandler V C, Major recent and independent changes in levels and patterns of expression have occurred at the b gene, a regulatory locus in maize, Proc Natl Acad Sci USA, 96 (1999) 15007-15012.
121 Wang R L, Syec A, Hey J, Lukens L & Doebley J, The limits of selection during maize domestication, Nature (Lond), 398 (1999) 236-239.
122 Ching A & Rafalski A, Rapid genetic mapping of ESTs using SNP pyrosequencing and indel analysis, Cell Mol Biol Lett, 7 (2002) 803-810.
123 Kanazin V, Talbert H, Mickelson S & Blake T, Haplotype distribution in wild and cultivated barleys, in Proc Plant, Anim Genomes XI Conf (San Diego, CA) 2003 (http://www.intl-pag.org/pag/11/abstracts/).
124 Choi I, Hyten D L, Kumar L & Cregan P B, Single nucleotide polymorphism discovery in 3′-EST sequence of soybean, in Proc Plant, Anim Genomes XI Conf (San Diego, CA) 2003 (http://www.intl-pag.org/pag/11/abstracts/).
125 Laucou V, Lacombe T, Moreau F, Roux C, Bruno J et al, Development of high-throughput methods for the analysis of genetic diversity in grapevine using microsatellite and P technology, in Proc Plant, Anim Genomes XI Conf (San Diego, CA) 2003 (http://www.intl-pag.org/pag/11/abstracts/).
126 Salmaro M, Faes G, Segala C, Stefanin M, Salakhatdinev I et al, Genome diversity and gene haplotype in the grapevine (Vitis vinifera L.) as revealed by single nucleotide polymorphisms, Mol Breed, 14 (2005) 385-395.
127 Freeman C A, Kolkman J M, Slabough M B, Berry S, Olungu C et al, SNP marker development and diversity in domesticated and wild sunflowers, in Proc Plant, Anim Genomes XI Conf (San Diego, CA) 2003 (http://www.intl-pag.org/pag/11/abstracts/).
128 Scmidt D, Polley A, Reich S, Kehling C & Gana M W, Identification of SNP markers in the sugar beet (Beta vulgaris) genome, in Proc Plant, Anim Genomes XI Conf (San Diego, CA) 2003 (http://www.intl-pag.org/pag/11/abs-tracts/).
129 Yang W, Bai X, Eaton C, Kamoun S, Knapp E et al, Discovery of single nucleotide polymorphisms in Lycopersicon esculentum by computer aided analysis of expressed sequenced tags, Mol Breed, 14 (2004) 21-34.
130 Hays S, Shi L, He G, Ankumah N, Drummond P et al, Comparative genome analysis of the sweet potato using primers specific for the model plant Arabidopsis thaliana, in Proc Plant, Anim Genomes VIII Conf (San Diego, CA) 2000 (http://www.intl-pag.org/pag/8/abstracts/).