Single-molecule studies of DNA organization by bacterial ...
88
National University of Singapore Single-molecule studies of DNA organization by bacterial architectural proteins LIN JIE – HT051204B
Transcript of Single-molecule studies of DNA organization by bacterial ...

National University of Singapore
Single-molecule studies of DNA organization by bacterial architectural proteins
LIN JIE – HT051204B

2
Acknowledgement
Special thank goes to Assoc Prof. YAN Jie, my PhD. supervisor, for his supervision and
support. This thesis would not have been possible without his help.
I am also grateful to my collaborator Assoc Prof. Peter Droge for IHF protein
expression and purification, Dr. CHEN Hu for the simulation, Assoc Prof. Linda J.
Kenney for stimulating discussions, and all my lab mates for their help and suggestions.
Last but not the least I would like to thank my university, National University of
Singapore, for offering me such a great opportunity to pursue my PhD. study.
3
Summary
In my PhD study, I focused on the project of non-specific DNA binding of IHF by using a
combination of single DNA manipulation and atomic force microscopy imaging methods.
The integration host factor (IHF) is an abundant nucleoid-associated protein and an
essential co-factor for phage λ site-specific recombination and gene regulation in E. coli.
Introduction of a sharp DNA kink at specific cognate sites is critical for these functions.
Interestingly, the intra-cellular concentration of IHF is much higher than the
concentration needed for site-specific interactions, suggesting that non-specific binding
of IHF to DNA plays a role in the physical organization of bacterial chromatin. However,
it is unclear how non-specific DNA association contributes to DNA organization. By
using single molecular manipulation and imaging methods, we show here that distinct
modes of non-specific DNA binding of IHF result in complex global DNA conformations.
Changes in KCl and IHF concentrations, as well as tension applied to DNA dramatically
influence the degree of DNA-bending. In addition, IHF can crosslink DNA into a highly
compact DNA meshwork that is observed in the presence of magnesium at low
concentration of monovalent ions, and high IHF-DNA stoichiometries. Our findings
provide important insights how IHF contributes to bacterial chromatin organization, gene
regulation, and biofilm formation.

4
TABLE OF CONTENTS
Chapter 1: Introduction ................................................................................................................................................ 9
1.1 Bacterial chromosomal DNA organization ........................................................................................................... 9
1.2 Nucleoid associated proteins ............................................................................................................................. 10
1.3 current understanding of major NAPs: HU, Fis, H-NS and IHF ........................................................................... 14
1.3.1 HU ............................................................................................................................................................... 14
1.3.2 Fis ................................................................................................................................................................ 15
1.3.3 H-NS ............................................................................................................................................................ 16
1.3.4 IHF ............................................................................................................................................................... 17
1.4 DNA and NAPs in extracellular polymeric substances (EPS) of biofilms ............................................................ 19
1.5 Questions raised and the motivations ............................................................................................................... 20
Chapter 2: Methods and Materials ............................................................................................................................. 22
2.1 Micromechanics of DNA and its force response ................................................................................................ 22
2.1.1 Structure of DNA double helix .................................................................................................................... 22
2.1.2 Worm-Like-Chain (WLC) model .................................................................................................................. 24
2.1.3 Force-extension curve of DNA .................................................................................................................... 27
2.1.4 Effects of DNA-distorting proteins on DNA force-response ....................................................................... 29
2.2 Single-molecule manipulation by magnetic tweezers ....................................................................................... 35
2.2.1 Single-molecule manipulation techniques ................................................................................................. 36
2.2.2 Transverse magnetic tweezers used in the study ....................................................................................... 41
2.2.3 DNA extension measurement, Force-calibration and determination of single tethers ............................. 44
2.3 Single-molecule imaging by Atomic Force Microscopy ..................................................................................... 46
2.3.1 Principles of AFM imaging technique ......................................................................................................... 46
2.3.2 Functionalization of mica surface for imaging experiments ....................................................................... 49
2.4 Expression, purification and concentration measurement of Integration Host Factor ..................................... 52
2.5 Experiment procedures and DNA constructs..................................................................................................... 54
2.5.1 Magnetic tweezers experiments ................................................................................................................ 54

5
2.5.2 AFM imaging experiments ......................................................................................................................... 55
Chapter 3: Non-specific binding of Integration host factor regulates chromatin organization .................................. 57
3.1 Abstract .............................................................................................................................................................. 57
3.2 KCl concentration affects the influence of IHF on the force response of single DNA ....................................... 58
3.3 KCl concentration mediates switch between weak and sharp bending of IHF-DNA complex ........................... 64
3.4 The sharper DNA bending is inhibited at high IHF concentration ..................................................................... 67
3.5 IHF induces more compact DNA conformations at low KCl concentration ....................................................... 68
3.6 IHF condenses DNA into higher order structures in the presence of magnesium ............................................ 72
Chapter 4: Discussion and conclusion ........................................................................................................................ 78
4.1 Summary of DNA binding modes of IHF and their dependence on environmental factors .............................. 78
4.2 Implications on global bacterial gene regulation............................................................................................... 80
4.3 Implications on packaging of chromosomal DNA in bacteria ............................................................................ 80
4.4 Implications on biofilm maintenance ................................................................................................................ 81
4.5 Relevance of bending induced by specific and non-specific IHF binding........................................................... 81
4.6 Conclusion.......................................................................................................................................................... 83
Reference..................................................................................................................................................................... 85

6
Table of Figures
Fig.1 Schematic diagram of a bacterial cell 10
Fig. 2 Bacterial growth phases and NAPs intracellular abundance 12
Fig. 3 Some examples of NAP-DNA binding modes 14
Fig. 4 Specific Functions of Integration Host Factor (IHF) 18
Fig. 5 Extracellular DNA meshwork bound by non-specific binding of IHF
and HU
20
Fig. 6 Schematic structure of DNA backbone and structure of B-form of
DNA
24
Fig. 7 Schematic of FJC model 27
Fig. 8 Schematic of WLC model 27
Fig. 9 Fits of Marko-Siggia formula and FJC formula to experimental data
of Smith et al.
29
Fig. 10 Schematic of the model for DNA –bending proteins 32
Fig. 11 Simulation of the Force-extension curves of the stiff bending and
flexible bending
32
Fig. 12 Force-extension curves of DNA and DNA-stiffening protein
complex with different binding strengths
34
Fig. 13 Force-extension curves of DNA and DNA-intercalating protein
complex with different binding strengths
35
Fig. 14 Schematic diagram of optical tweezers operating principle 38

7
Fig. 15 Schematic diagram of vertical magnetic tweezers apparatus 41
Fig. 16 Transverse magnetic tweezers setup and the screenshot of the
LabVIEW control software
43
Fig. 17 Transverse magnetic tweezers set up in my study 44
Fig. 18 Schematic diagram of Atomic Force Microscopy 48
Fig. 19 Molecular Imaging 5500 AFM (Molecular Imaging, Agilent
Technologies) set-up in my lab
49
Fig. 20 Schematic diagram of mica modification process, including AP-
mica and Glu-mica
52
Fig. 21 Purified IHF was analyzed by (18%) SDS-PAG 54
Fig. 22 Effects of IHF on the force response of 48,502 bp λ-DNA at varying
concentrations of KCl and pH 7.4
62-63
Fig. 23 Previous study of the force-extension curves of 48,502 bp λ-DNA in
200 mM KCl solution at different concentrations of IHF
64
Fig. 24 Decreasing KCl concentration, from 200 mM KCl to 50 mM KCl,
drives a switch from a weaker DNA bending conformation to a
sharper DNA bending conformation.
66
Fig. 25 Force-extension curves of λ-DNA in 50 – 200 mM KCl and pH 7.4
(10 mM Tris).
67
Fig. 26 Atomic force microscopy images of linearized double-stranded
Φx174 DNA (5,386 bp) incubated with varying concentrations of
IHF
70
Fig. 27 Atomic force microscopy image of linearized double-stranded 71

8
Φx174 DNA (5,386 bp) incubated with the saturation concentration
of 1,250 nM IHF in 200mM KCl
Fig. 28 Effects of magnesium on DNA condensation in the presence of IHF
by magnetic tweezers
75
Fig. 29 Atomic force microscopy analysis of effects of magnesium on
linearized Φx174 DNA (5,386 bp) condensation in the presence of
IHF in 50 mM KCl, 2mM MgCl2
76
Fig. 30 Magnesium does not have an apparent influence on DNA-IHF
interaction in 200mM KCl, where only the weaker DNA bending
occurs
77
Fig. 31 Schematic of the conformational states of the DNA-IHF complex
and their dependence on force, [IHF], [KCl], and [MgCl2].
79
Fig. 32 The occupancy of IHF bound to DNA predicted to introduce a DNA
bending angle that causes 50% reduction in DNA extension at 0.1
pN as a function of DNA bending angle
83

9
CHAPTER 1: INTRODUCTION
1.1 BACTERIAL CHROMOSOMAL DNA ORGANIZATION
Bacteria are a large group of single-cell, prokaryote organisms (Fig. 1). The most
apparent characteristic of bacterial cell is its small size. For example, Escherichia coli
cell, a medium sized bacteria, is about 2 μm in length and 0.5 μm in diameter, with a
cell volume of 0.6~0.7 μm3 [1]. The most important structure in this small cell is the
bacterial chromosome which contains many genes, regulatory elements and other
nucleotide sequences. Unlike the eukaryotes, the bacterial chromosome is not confined
to a membrane-enclosed nucleus but instead, is located inside the bacterial cytoplasm.
The unstrained bacterial chromosomal DNA molecule is usually a couple of millimeters
long. The Escherichia coli chromosome is one example. It has about 4.6M bp of
genome with a linear length of about 1.6 mm [2]. When randomly coiled, it has a volume
of about 200 μm3, which is approximately 300 times larger than the entire volume of the
cell. Therefore, the chromosomal DNA in bacteria has to be highly compacted to fit into
the cell space. This compacting task in bacterial cell is executed by DNA supercoiling,
macromolecular crowding and protein-DNA interactions [2].
It must be emphasized is that this highly compacted chromosomal DNA is not simply a
disordered jumble but is in fact a well-organized and dynamic structure [3] which can be
partially activated or deactivated rapidly during cell cycle or in response to
environmental stimuli [2], such as the change of salt concentration, temperature or pH

10
value. There must be a sort of bacterial chromosomal DNA compaction which is
effective only regionally and can be removed immediately. Protein-DNA interaction
undoubtedly is the most suitable candidate to fulfill these functions, according to the
way they modulate the DNA compaction.
Figure 1. Schematic diagram of a bacterial cell (from Anatomy and Physiology
Resource Site which is free to copy under the license CC BY-NC-SA 3.0)
1.2 NUCLEOID ASSOCIATED PROTEINS
Of all the bacterial chromosomes, Escherichia coli chromosome has been most studied.
There are about 4000 protein species encoded by the Escherichia coli genome [4].

11
Approximately, 10% of them or more than 400 proteins, can be classified as DNA-
binding protein. About 12 species of these DNA-binding proteins which include CbpA
(curved DNA-binding protein A), CbpB (Curved DNA-binding protein B), DnaA (DNA-
binding protein A), Dps (DNA-binding protein from starved cells), Fis (factor for inversion
stimulation), Hfq (host factor for phage Q), H-NS (heat-stable nucleiod structuring
protein), HU (heat-unstable nucleoid protein), IciA (inhibitor of chromosome initiation A),
IHF (integration host factor ), Lrp (leucine-responsive regulatory protein), and StpA
(suppressor of td mutant phenotype A), are identified as the major DNA-binding proteins,
which are also named as NAP (nucleoid-associated proteins) in Escherichia coli W3110
[4]. In 1999, Akira Ishihama’s lab managed to measure the intracellular concentrations
of these 12 proteins using the quantitative western blot method [4]. Moreover, a method
termed genomic SELEX (Systematic Evolution of Ligands by EXponential enrichment)
has been widely used in identifying the highest affinity sites of these nucleiod-
associated proteins in the bacterial genome [5]. However, the molecular mechanisms of
how these NAPs interact with chromosomal DNA are mostly unsolved, due to a lack of
knowledge about the real-time measurement of individual protein-DNA interaction and
the complexity of multiple protein-DNA interactions.
According to the numbers of bacteria, bacterial growth can be divided into four different
phases: lag phase, log phase or exponential phase, stationary phase and death phase
(Fig. 2A). In different growth phases, the conformations of bacterial chromosomal DNA
are different. For example, the chromosomal DNA of Escherichia coli becomes more
compact in the stationary phase [6]. Moreover, there is a great variation in NAP

12
intracellular abundance at different growth phases of Escherichia coli W3110 cell (Fig.
2B) [4]. In the exponential phase, the first 6 most abundant NAPs are Fis, Hfq, HU, StpA,
H-NS and IHF, in order of abundance in descending order. In the early stationary phase,
the order of abundance change to Dps, IHF, HU, Hfq, H-NS and StpA, while those in
the late stationary phase are Dps, IHF, Hfq, HU, CbpA and StpA [4]. This dramatic
difference might be an important factor in the compaction of the bacterial genome DNA
and silencing of the bacterial gene at different growth phases [4]. Furthermore, different
DNA-binding modes of these NAPs may play an important role in the organization and
compaction of the bacterial chromosomal DNA.
Figure 2. A) Bacterial growth phases.(from Wikipedia for the purpose to show bacterial
growth phases) B) NAPs intracellular abundance at different growth phases of
Escherichia coli W3110 cell [4] (with the permission of American Society for
Microbiology).

13
In vitro investigations of purified individual NAPs by both single molecule and ensemble
measurements suggest that there are four general binding modes of NAPs, which are
bending, bridging, wrapping and clustering [3]. Some of these binding modes are
showed in Fig. 3. For example, DNA bending by IHF by >160°with high affinity in a
sequence-specific manner has been observed by the X-ray IHF-DNA crystal structure
analysis [7]. Likewise, Dps, the most abundant protein in the stationary phase, which
only appears in the stationary phase [4], compacts the DNA by clustering of distal DNA
loci [4]. Interestingly, some NAPs can bind DNA in multiple modes. Take H-NS for
example, it has been well-accepted that H-NS can cause DNA bridging. However, Yan
Jie’s group demonstrated that H-NS can also cause DNA stiffening by adjusting the
divalent cations [8]. More examples and details of some major NAPs binding modes and
their genome functions will be described in the next section.

14
Figure 3 Some examples of NAP-DNA binding modes. 1) H-NS has been found to have
two DNA binding modes, which are bridging DNA at high [Mg2+] and stiffening DNA at
low [Mg2+]; 2) Fis has two binding modes: DNA-bending in low [Fis] and DNA-folding in
high [Fis]; 3) under low [HU] and high [NaCl], HU causes DNA bending; otherwise HU
causes DNA stiffening; 4) Dps and CbpA were found to cause DNA condensation; 5)
IHF has been found to bend DNA by specific DNA-binding.
.
1.3 CURRENT UNDERSTANDING OF MAJOR NAPS: HU, FIS, H-NS AND IHF
1.3.1 HU

15
Heat-unstable nucleiod protein (HU) consists of two subunits, HUα and HUβ, which
have 70% similarity in amino acid sequence [9]. HU can form either homodimer or
heterdimer at different growth phases of the Escherichia coli cell [9]. In the exponential
growth phase, there are about 30,000 to 55,000 HU in the Escherichia coli W3110,
suggesting that HU is a major nucleoid protein in the growing bacterial cell [4].
HU-DNA interactions were thought to be nonspecific; however, it was found to be more
likely to bind to the distorted DNAs, which has high superhelical density [9]. HU-DNA
crystal structure shows that HU introduces a 105° ~ 140° bending on DNA [7].
Besides this, HU reduces the DNA effective stiffness at low protein concentrations and
increases it at high protein concentrations [9]. All these HU-DNA binding properties are
consistent with its role in bacterial chromosomal genome recombination and DNA
topology arrangement. There are many data showing that HU plays an important role in
the expression of many genes in Escherichia coli, such as central metabolism and
respiration [9].
1.3.2 FIS
Factor for inversion stimulation (Fis) is the most abundant nucleiod associated proteins
in the growing Escherichia coli cell, when its intracellular concentration reaches up to
60,000 molecules per cell. However, it is almost undetectable during the stationary
phase [4].

16
Fis interacts with DNA in a number of ways, causing DNA wrapping, bridging and
bending [9]. Fis-DNA interactions seem to be specific. It binds as a homodimer to the
DNA sequence that is commonly 17bp in length and AT rich, except at positions 2 and
16, where C or G residues are usually found [9].
Consistent with its multiple DNA interaction modes, Fis takes part in many gene
regulation and genome organization processes. For example, Fis is a traditional
transcription activator, which makes physical contact with RNA polymerase [10].
Moreover, Fis can activate or deactivate promoters, relying on its binding site location
relative to that of RNA polymerase [9].
1.3.3 H-NS
Heat-stable nucleoid structuring protein (H-NS) reaches a maximum of about 20,000
copies per cell in the exponential phase, but it decreases to 40% of the maximum at the
late stationary phase [4]. It exists as a dimer or high-order oligomer [8]. H-NS
preferentially binds to A-T rich DNA [11], in that way that it forms dimer in N-terminal
domain whereas it binds DNA in C-terminal domain [8].
H-NS bridging DNA is a well-accepted mode which was thoroughly described by Remus
Dame and his coworkers [12]. However, a recent study in Yan Jie’s group shows that H-
NS can also cause DNA stiffening; and these two modes can be switched by adjusting

17
divalent metal ions [8]. The stiffening binding mode might be highly correlated with its
role in gene silencing, whereas the bridging binding mode might be most relevant to its
function in nucleoid compaction [8].
1.3.4 IHF
The integration host factor (IHF) protein is a highly conserved abundant nucleoid
associated protein (NAP) in all the growth conditions and growth phases of bacteria [13].
It was originally discovered as an essential co-factor for the site-specific recombination
of λ phage in the E.Coli genome (Fig. 4A) [14]. This function requires binding of IHF to
highly specific DNA sequences, and its role is to create a sharp bending angle (>160
degree) at its binding site (Fig. 4C) [15]. Later, it was also identified as a transcription
factor that influences global gene transcription in both E. Coli [16] and S. Typhimurium
[17, 18] (Fig. 4B). It has been suggested that its gene regulatory role is also related to
its sharp DNA bending capability, by which it can positively regulate gene transcription
in facilitating contact between regulatory proteins and RNA polymerase [19].
Analysis of IHF site-specific sequences has revealed consensus DNA-binding motif
consisting small clusters of conserved bases [20-22]. IHF binds to its specific binding
sequences with an affinity significantly stronger than its binding to non-specific
sequences [23-25]. One example is the H’ sequence in λ phage [26, 27], which has
been determined to have a dissociation constant in ~100 mM KCl in the range of 2 - 20

18
nM by earlier titration assays [23-25] and 0.01 – 0.1 nM by recent kinetic measurement
[28].
Figure 4. Specific Functions of Integration Host Factor (IHF). A) IHF is an essential co-
factor for the site-specific recombination of λ phage in the E.Coli genome (from
GeneVIII). B) IHF is a transcription factor [18] (with the permission of Nature Publishing
Group). C) Specific binding of IHF induces sharp DNA bending [15] (with the permission
of ELSEVIER LICENSE).

19
In contrast to the high affinity of IHF to its specific binding sequences, the intracellular
concentration of IHF is significantly larger than its specific KD in all the growth phases.
IHF is highly abundant, with a copy number ranged from 12,000 in the exponential
growth phase and 55,000 in the early stationary phase, which translate into a
concentration range of 12 – 55 µM [29]. Such a high concentration suggests that IHF
may also play a role beyond its site-specific recombination and specific gene
regulations through non-specific DNA binding.
1.4 DNA AND NAPS IN EXTRACELLULAR POLYMERIC SUBSTANCES (EPS) OF BIOFILMS
As illustrated before (Section 1.3), nucleoid associated proteins (NAP) play an important
role in intracellular bacterial chromosomal DNA organization and gene regulation.
Moreover, some of the NAPs, such as IHF and HU, are also found present in the
extracellular polymeric substances (EPS) of biofilms [30].
In nature, bacteria live in the form of biofilms in which many bacteria form an organized,
functional, complex community. The major component of the biofilm is the extracellular
polymeric substances (EPS) that mainly contain polysaccharides, proteins, nucleic
acids and lipids [31]. In the EPS, extracellular DNA (eDNA) is a common component
and forms a complex DNA meshwork. It has been demonstrated that the eDNA
meshwork plays an important role in stabilizing the biofilms [32].

20
Recent study shows that IHF and HU are found in the eDNA meshwork [30, 33], which
are located at both kinked DNA and crossed DNA within an NTHI biofilm (Fig. 5) [33].
This study also indicates that IHF and HU are critical for the integrity of the EPS matrix
of biofilms: removal of these proteins either leads to biofilm disassembly or biofilm
debulking [33].
However, despite the potential importance in the biofilms, very little is known about how
these NAPs, such as IHF and HU, organize DNA and how they responses to
environmental factors.
Figure 5. Extracellular DNA meshwork bound by non-specific binding of IHF and HU
[33] (for the purpose to show e-DNA meshwork with IHF and HU) (with the permission
of Creative Commons License).
1.5 QUESTIONS RAISED AND THE MOTIVATIONS
21
The effects that non-specific binding of IHF to DNA have on the mechanical properties
of DNA have been studied in a single-DNA stretching experiment for 48,502 bp of
λ−DNA [21]. It was found that addition of IHF weakly reduced DNA extension at the
saturation binding concentration of > 500 nM IHF [21]. In that experiment, the effect of
IHF binding on the force response of DNA is similar to that predicted for proteins that
can bend DNA [34, 35], suggesting that non-specific binding of IHF also bends DNA.
However, it is not clear whether the non-specific binding of IHF to DNA introduces a
sharp angle, like that induced by specific binding of IHF to the H’ sequence [15]. It
appears that at saturation binding, less DNA bending observed than expected in that
experiment [34, 35]. This observation suggests that either non-specific binding of IHF
only introduces weak DNA bending under the conditions used, or that it can introduce
sharp DNA bending, but only sparsely binds to DNA even at its saturation binding
concentration. Furthermore, many bacterial NAPs, such as H-NS and StpA, can sense
environmental changes and consequently change their DNA binding properties [8, 36].
It is unclear how IHF environmental factors influence the DNA binding properties of IHF.
In this study, the non-specific interaction between IHF and DNA was investigated by
single-DNA manipulation using magnetic tweezers and atomic force microscopy (AFM).
Our results reveal multiple non-specific DNA binding modes of IHF, resulting in complex
DNA structures, which can be altered by changes in conditions such as protein
concentration, monovalent salt concentration, and magnesium concentration.

22
CHAPTER 2: METHODS AND MATERIALS
2.1 MICROMECHANICS OF DNA AND ITS FORCE RESPONSE
2.1.1 STRUCTURE OF DNA DOUBLE HELIX
Deoxyribonucleic acid (DNA) is a long biopolymer constituted by repeating units called
nucleiotides which carries the genetic materials of all living organisms except RNA
viruses. In 1953, Watson and Crick first proposed the structure of DNA as the form of a
double helix by the X-ray diffraction data [37]. As illustrated in Fig. 6A), DNA consists of
two polynucleotide strands, with backbones constituted by 5-carbon sugars and
phosphoric acid groups joined by ester bonds. These two chains run in opposite
directions - which is named as antiparallel - connected by hydrogen bonding between
the nitrogenous bases which are attached to the 5-carbon sugars. Adenine (A) pairs
specifically with thymine (T) while guanine (G) pairs specifically with cytosine (C). The
bonding is called base pairing and the paired bases are described as complementary.
To stabilize the whole DNA structure, there are two kinds of interactions to make the
two chains twist around each other- one is the inter-chain “base-pairing” which holds the
two complementary chains together; the other is the intra-chain “stacking” which
connects between adjacent bases.

23
DNA has many possible conformations, such as A-form DNA, B-form DNA and Z-form
DNA. However, B-form of DNA is the most common conformation found in cells. The B-
form DNA double helix is right-handed as shown in Fig 6 B. The distance between two
neighboring bases is about 3.4 Å. Each base pair rotates approximately 36°; so around
10.3 base pairs make a full turn. The interwinding of the two chains forms two kinds of
grooves; the major groove, is 22Å wide and the minor groove, is 12Å wide.
It is important to realize that the B-form of DNA is a dynamic structure. The individual
base pairing energy ranges from 1kBT to 4 kBT, depending on the DNA sequence, at
room temperature. As the most important component in the cell, DNA undergoes
thermal fluctuations from its surrounding, usually in the order of several kBT at room
temperature. Consequently, its base pairs undergo open-close fluctuations all the time.

24
Figure 6. A) Schematic structure of DNA backbone (from GeneVII). B) Schematic
structure of B-form of DNA (generated by Qutemol).
2.1.2 WORM-LIKE-CHAIN (WLC) MODEL
As described in the last section, DNA is basically a very long cylinder with a very small
diameter, about 2 nm, compared to its contour length. One base-pair, the single unit of
DNA, is only 0.34 nm long, is also much smaller than its entire length. Therefore, it
might be possible that the dynamic properties of DNA may not rely on its microscopic
structure. Consequently, some simple models with a few phenomenological parameters
might be able to simplify this system, and describe this system properly.

25
One of these models is named as Freely-Jointed-Chain (FJC) model. As illustrated in
Fig.7, DNA is modeled as a chain of N concatenated rigid independent segments, each
with the length b, which is called Kuhn length. The orientations of each segment are
uncorrelated in the absence of an external force [38]. When we apply a force f �̂� on the
DNA chain, the effective energy E for the chain is shown as below
𝐸 kBT
= ∑ 𝑓𝑏𝑘𝐵𝑇
𝑁𝑖=1 𝑡𝚤� . �̂� (1)
where kB is Boltzmann’s constant, T is temperature, 𝑡𝚤� is tangent vector of the ith
segment. From (1), the end-to-end distance of the polymer can be analytically derived
[38]:
< 𝑧 > = 𝐿 �coth 𝑓𝑏 kBT
− kBT�b� (2)
where L is DNA contour length.
At low force, FJC model behaves as a simple spring, which can fit DNA elasticity very
well. However, at high force, this model predicts that the DNA end-to-end extension
scales with the force as kBT�b
, which fails to explain the experiment data of DNA. Instead,
it was found in the experiments that DNA extension scales with force as � kBT�b�12 [39, 40].

26
The DNA force-response was found to be consistent with the Worm-Like-Chain (WLC)
model that assumes DNA is a homogeneous inextensible polymer with a finite bending
stiffness. The WLC mode is actually very similar to FJC model, but changes from
independent segments to a continuous elastic medium [39, 40]. Fig. 8 is a schematic
diagram of this WLC model. The effective energy E for the chain is given by
𝐸 kBT
= ∫ �𝐴2
�𝑑 𝒕(𝒔)�
𝑑 𝑠�2− 𝑓
kBT 𝒕(𝒔)� . �̂��𝐿
0 𝑑𝑠 (3)
where s is the contour position along DNA, A is the persistence length of DNA, over
which the tangent vector correlations dies off along the DNA chain. It is also related to
the bending rigidity of DNA, B, by the relation A=B/kBT. In physiological buffer
conditions, A has been determined by single-DNA stretching experiments and DNA
looping experiments to be about 50 nm or 150 bp [39, 40].
This continuous WLC model can also be transformed into discrete form if the segment
length b is much smaller than the persistence length A:
𝐸 kBT
= ∑ � 𝐴2𝑏
(𝒕𝒊+𝟏� − 𝒕𝒊�)2 − 𝑓𝑏 kBT
𝒕𝒊� ∙ 𝒛��𝑁−1𝑖 (4)
where 𝑡𝚤� is tangent vector of the ith segment.

27
Figure 7. Schematic of FJC model. In this model, DNA is modeled as a chain of N
concatenated rigid independent segments, each with the length b, called Kuhn length.;
�̂� is tangent vector; f is the force which in the direction of �̂� .
Figure 8. Schematic of WLC model. In this model, DNA is a homogeneous inextensible
polymer with a finite bending stiffness. f is the force which in the direction of �̂�; s is the
contour position along DNA; �̂� is tangent vector.
2.1.3 FORCE-EXTENSION CURVE OF DNA

28
The analytic solution of the force-extension relation of Worm-Like-Chain model is not
available now, but the numerical solution has been figured out [39, 40]. It is called
Marko-Siggia formula, as shown below
𝑓𝐴 kBT
= 14�1 − 𝑧
𝐿�−2− 1
4+ 𝑧
𝐿 (5)
When the force is much larger than kBTA
(which is about 0.08pN) and smaller than 15pN,
this formula fits DNA experiment data very well, compared with FJC model. This can be
clearly identified in Fig. 9: squares are the experiment data for 97004 bp lambda DNA
dimmers in 10 mM Na+ buffer; solid curve is a fit by the asymptotic Marko-Siggia
formula for A=53 nm and L=32.8 um; dashed line the is a fit by FJC model for b=100 nm
and L=32.7um [39, 40]. We can see that in the small force range, both FJC and WLC
are consistent with the experimental data but in the higher force range, DNA extension
scales with force as� kBT�b�12; therefore only WLC model fits the experimental data.
However, when the force is above ~15 pN, using the WLC model becomes problematic.
This is because WLC assumes an inextensible polymer, where the entire chain length is
constant. The DNA structure is however not stable under the above condition as it is
deformed from its normal B-form DNA. An extreme example is when the force is
approximately 60 pN, DNA undergoes overstretching phase transition with its contour
length extended to 1.7 times the B-form DNA [41].

29
Figure 9. Fits of Marko-Siggia formula and FJC formula to experimental data of Smith
et al. [40] (with the permission of American Chemical Society Publications)
2.1.4 EFFECTS OF DNA-DISTORTING PROTEINS ON DNA FORCE-RESPONSE
As mentioned in Chapter 1, there are many DNA binding proteins inside the bacterial
cell which can bend, stiffen, bridge, compact or lengthen the DNA target. For example,
H-NS can introduce two kinds of interactions to DNA - bridging and stiffening [8]; while
HU and IHF both introduce large bends into DNA structure [7, 15]. To date, plenty of
experimental papers studying the effects of these DNA-distorting proteins on DNA

30
elastic response have been published. Most of them focused on the sequence-specific
interactions between these DNA binding proteins and DNA by electrophoretic gel study,
because short, defined DNA can be used and the band shift can be well-measured after
the protein binding [34]. However, most of these DNA–binding proteins can interact with
bacterial chromosomal DNA non-specifically. Single-molecule manipulation techniques
such as magnetic tweezers, optical tweezers and atomic force microscopy, have
appeared as powerful tools to study the fore-extension response of DNA-protein
composites. Therefore, we need a well-defined model to quantify these experimental
data using more lucid parameters, such as the protein bound site occupation, binding
free energy etc.
In 2003, Yan Jie and John Marko published a theoretical study of the bending, stiffening
and lengthening effects of DNA-binding proteins on DNA force-extension response [34].
They used the discrete Worm-Like-Chain (WLC) model (see Formula 4 in section 2.1.2
for details) and transfer matrix to describe the protein-DNA complex. Since their study is
very useful to calculate the protein-binding occupation of my IHF non-specific binding
experiment data, the principle and major simulation results of their research will be
discussed in the rest of this section.
EFFECTS OF DNA-BENDING PROTEINS

31
In this model, DNA is considered as a long chain of N segments with the length b,
energy 𝑬𝒊. When a protein is bound to one segment, it forces a bend by an angle 𝜑 (see
Fig. 10 for more details). The total energy is given by [34]
𝑬 = ∑ 𝑬𝒊𝑵𝒊=𝟏 (6)
where the energy of ith segment , i.e. 𝑬𝒊 is
𝑬𝒊 kBT
= 𝒂𝟐
|𝒕𝒊� − 𝒕𝒊−𝟏� |𝟐(𝟏 − 𝒏𝒊) + �𝒂′
𝟐 (𝒕𝒊� . 𝒕𝒊−𝟏� − 𝜸)𝟐 − 𝝁�𝒏𝒊 −
𝒃𝒇𝟐
(𝒕𝒊� + 𝒕𝒊−𝟏� ) . 𝒛� (7)
where μ = cos𝜑, is the binding free energy; a is the bending stiffness of bare DNA; 𝒂′ is
bending stiffness of DNA-protein composite, 𝑡𝚤� is the tangent vector of segment i; f is the
applied force which is along �̂� direction.
There are two kinds of bending described in this paper: one is called stiff bending, which
means the bound protein will leave from the DNA under large force; the other is named
as flexible bending, under which condition the protein-DNA complex will deform at large
force. Fig. 11a is the force-extension curve of the stiff 90° (𝜸 = 𝟎) bending (𝒂′ = 𝟏𝟎𝟎)
with different binding strengths
𝜇 = −∞ (𝑏𝑎𝑟𝑒 𝐷𝑁𝐴),−2.3,−1.61,−0.69respectively9, 0, 3 𝑎𝑛𝑑 6., while Fig. 11b describes
those of the 90° ( 𝜸 = 𝟎 ) flexible bending ( 𝒂′ = 𝟐 ) with different
𝜇 = −∞,−2.3,−1.61,−0.69, 0, 3 respectively. At small binding free energy, the curves of
stiff and flexible bending are similar. At large binding strength, abrupt extension

32
increases appear at large force in stiff bending cases due to the sudden unbinding of
the protein, whereas this cannot be observed in flexible bending [34].
Figure 10. Schematic of the model for DNA –bending proteins [34]. (Figures used by
courtesy of author Dr. Yan Jie)
Figure 11. a) Force-extension curve of the stiff 90°(𝜸 = 𝟎) bending (𝒂′ = 𝟏𝟎𝟎) with
different binding strengths 𝜇 = −∞,−2.3,−1.61,−0.69, 0, 3 𝑎𝑛𝑑 6.91. b) Force-extension
curve of the 90°( 𝜸 = 𝟎 ) flexible bending ( 𝒂′ = 𝟐 ) with different
𝜇 = −∞,−2.3,−1.61,−0.69, 0, 3. [34] (Figures used by courtesy of author Dr. Yan Jie)

33
EFFECTS OF DNA-STIFFENING PROTEINS
When stiffening proteins bind to DNA, they do not bend the DNA, but instead change
the bending constant of the DNA backbone. In this case, 𝑬𝒊 is given by
𝑬𝒊 kBT
= 𝒂𝟐
|𝒕𝒊� − 𝒕𝒊−𝟏� |𝟐(𝟏 − 𝒏𝒊) + �𝒂′
𝟐 |𝒕𝒊� − 𝒕𝒊−𝟏� |𝟐 − 𝝁�𝒏𝒊 −
𝒃𝒇𝟐
(𝒕𝒊� + 𝒕𝒊−𝟏� ) . 𝒛� (8)
where 𝑎′ is the bending constant after the protein binding [34].
Fig. 12 [34] shows the force-extension curves of this model when b=5nm, a=10 and
𝑎′ = 100. Compared to the rightmost curve of bare DNA (𝜇 = −∞ ), the extension of
DNA-stiffening protein complex is always larger under the same force, which is even
more obvious at small force. This is because of the effect of stiffening proteins binding
which increases the stiffness of DNA.

34
Figure 12. Force-extension curves of DNA and DNA-stiffening protein complex with
different binding strengths 𝜇 = −∞ (𝑟𝑖𝑔ℎ𝑡𝑚𝑜𝑠𝑡 𝑐𝑢𝑟𝑣𝑒, 𝑐𝑜𝑟𝑟𝑒𝑠𝑝𝑜𝑛𝑑𝑖𝑛𝑔 𝑡𝑜 𝑛𝑎𝑘𝑒𝑑 𝐷𝑁𝐴),
0, 2.3,3 𝑎𝑛𝑑 4.6 (b=5 nm, a=10; 𝑎′ = 100) [34]. (Figure used by courtesy of author Dr.
Yan Jie)
EFFECTS OF DNA-INTERCALATING PROTEINS
When DNA-intercalating proteins bind to DNA double helix, they stretch the DNA and
change the DNA bending constant without introducing any kinks. Plenty of proteins and
drugs belong to this category, such as ethidium bromide and YOYO. In this case, 𝑬𝒊 is
given by
𝑬𝒊 kBT
= 𝒂𝟐
|𝒕𝒊� − 𝒕𝒊−𝟏� |𝟐(𝟏 − 𝒏𝒊) + �𝒂′
𝟐 |𝒕𝒊� − 𝒕𝒊−𝟏� |𝟐 − 𝝁�𝒏𝒊 −
𝒃𝒇𝟐
(𝟏 + 𝛂𝒏𝒊) (𝒕𝒊� + 𝒕𝒊−𝟏� ) .𝒛� (9)

35
The force-extension curves of this model with different binding strengths is illustrated in
Fig. 13, when b=5nm, a=10,𝑎′ = 40, 𝛼 = 0.5 [30]. In this situation when intercalating
proteins are fully occupied on DNA backbone, the DNA contour length increases to 1.5
times its original contour length.
Figure 13. Force-extension curves of DNA and DNA-intercalating protein complex with
different binding strengths 𝜇 =
−∞ (𝑟𝑖𝑔ℎ𝑡𝑚𝑜𝑠𝑡 𝑐𝑢𝑟𝑣𝑒, 𝑐𝑜𝑟𝑟𝑒𝑠𝑝𝑜𝑛𝑑𝑖𝑛𝑔 𝑡𝑜 𝑛𝑎𝑘𝑒𝑑 𝐷𝑁𝐴),−1.20,−0.51, 0, 2.3 𝑎𝑛𝑑 ∞)(b=5nm,
a=10; 𝑎′ = 40,𝛼 = 0.5) [34]. (Figures used by courtesy of author Dr.Yan Jie)
2.2 SINGLE-MOLECULE MANIPULATION BY MAGNETIC TWEEZERS

36
2.2.1 SINGLE-MOLECULE MANIPULATION TECHNIQUES
Single-molecule manipulation has become increasingly important over the last 20 years.
It consists of atomic force microscopy (AFM), optical tweezers (OT), magnetic tweezers
(MT), micro-needle manipulation, flow-induced stretching and biomembrane force probe
[42]. The first three are the most widely used techniques.
Compared to the traditional bulk methods, single-molecule manipulation avoids
ensemble average measurement over all accessible molecules. Instead, it provides
real-time “single-molecule” measurement of biological events which can be captured
often enough to make sure that they are not trivial and artificial. Similarly, single-
molecule techniques are very suitable to study many complicated biological processes
which usually includes multistate and multispecies [42]. Moreover, external force which
has a crucial role in many biological processes can be accurately exerted. It can span
six orders of magnitude (from 10000pN to 0.01pN) in single-molecule manipulation [42].
In my study, transverse magnetic tweezers (TMT), which is an important member of
magnetic tweezers family, are frequently used to get real-time force-extension
spectroscopy of DNA-IHF composite. Its operating principles and practical
implementation will be discussed in section 2.2.2 and 2.2.3. Atomic force microscopy
(AFM) was used to give the 3D images of DNA-IHF complex in different buffer
conditions, which will be described in section 2.3. In the rest of this section, other major

37
single-molecule manipulations methods such as optical tweezers (OT) and vertical
magnetic tweezers (VMT) will be introduced.
OPTICAL TWEEZERS (OT)
Optical tweezers (OT) also known as single-beam gradient force trap, are able to
manipulate nanometer to micrometer sized dielectric particles by exerting a force
ranging from 0.1 piconewton to 100 piconewton via a highly focused laser beam. It can
provide three-dimensional displacement of the trapping particle down to sub-millisecond
time resolution and sub-nanometer accuracy [42]. Due to all these features, optical
tweezers have been widely used in the research of a variety of biological systems.
The operating principle of optical tweezers is illustrated in Fig. 14. The beam waist,
which is the narrowest region of the focused laser beam, creates an optical trap with an
intensive electric field gradient. Dielectric particles in this beam waist region undergo a
restoring force along the direction of the gradient. For small displacements of the
trapped particles from the trap center, the restoring force is linearly proportional to its
displacement. In this situation, this optical trap can be described as a simple spring,
which obeys Hooke’s law. Particles with size ranging from ~20nm to a few micrometers
can be trapped effectively. Accordingly, organelles, single cells, lipid vesicles and silica

38
or polystyrene beads with attached biological molecules can be manipulated by optical
tweezers [42].
However, optical tweezers have some limitations. Photodamage and sample heating
are the two major drawbacks which should be considered before and during usage.
Figure 14. Schematic diagram of optical tweezers operating principle (from wikipedia).
VERTICAL MAGNETIC TWEEZERS (VMT)

39
Magnetic tweezers are a powerful tool to study biological processes. Compared to other
single-molecule manipulation techniques, magnetic tweezers have many advantages
such as no sample heating unlike the optical tweezers; specificity compared with AFM,
and throughput and force stability compared with both AFM and optical tweezers [43,
44].
Vertical magnetic tweezers (VMT) are the traditional type of magnetic tweezers. In 1992,
Smith’s lab used a combination of hydrodynamic flow and magnets to study DNA
elasticity for the first time [38]. After that, this method was improved by Strick et.al. by
eliminating hydrodynamic flow to improve the signal-to-noise ratio [38]. In VMT
apparatus, as shown in Fig. 15, a molecule which can either be DNA or protein is
attached to a glass slide on one end and a magnetic bead on the other by some specific
interactions between the modified DNA end and the functionalized glass or bead
surface. A pair of magnets is used to create a magnetic field near the studied molecule.
Because of the linked magnetic bead, a stretching force is exerted on the molecule
which is perpendicular to the glass surface, i.e. along Z direction. The force can be
measured by the bead’s thermal fluctuations, with the formula as below
𝐹 = kBT z𝛿𝑦2
, (10)

40
where kB is Boltzmann’s constant, T is temperature, z is the extension of the tether, 𝛿𝑦2
is the variance of thermal fluctuations in the direction perpendicular to the magnetic field
lines.
Previously, vertical magnetic tweezers are only used to study long molecules (>1μm)
with the force ranging from 1pN to over 100pN because it is difficult to measure force in
high force region (>20pN) for the short tethers (<1μm). This limitation was solved in Hu
Chen’s newly published paper [44]. By analyzing the y-fluctuation of the bead and
combining to the magnetic field-to-distance exponentially decay formula, they used
magnetic tweezers to stretch DNA or protein as short as 100nm in length with accurate
force calibration over a wide range up to 100pN [44]. Therefore, the application of
vertical magnetic tweezers has been expanded to many new fields, such as short DNA
overstretching and protein unfolding/refolding.

41
Figure 15. Schematic diagram of vertical magnetic tweezers apparatus [44]. In this set-
up, a molecule which can either be DNA or protein is attached to a glass slide on one
end and a magnetic bead on the other end. A pair of magnets is used to create a
magnetic field near the studied molecule. Because of the linked magnetic bead, a
stretching force is exerted on the molecule which is perpendicular to the glass surface,
i.e. along Z direction. (with the permission of Elsevier)
2.2.2 TRANSVERSE MAGNETIC TWEEZERS USED IN THE STUDY
Conventional magnetic tweezers, i.e. vertical magnetic tweezers, stretch the molecule
perpendicular to the objective focal plane and measure the tether extension change
either by calibrations of the out-of-focus bead images or dynamic refocusing [45]. This
indirect extension measurement makes the data analysis complicated and inaccurate;

42
what’s worse, it limits the traditional magnetic tweezers to the study of short molecules
shorter than 3μm in length. In this study, long DNA molecules (~16μm λ-DNA) were
used as substrate to study the effects of Integration Host Factor (IHF) binding because
our aim focused is on non-specific interactions. Therefore, we used transverse magnetic
tweezers instead of vertical magnetic tweezers.
Transverse magnetic tweezers (TMT) setup, as illustrated in Fig. 16A, is designed to
pull a single DNA in the focal plane of the objective, making it straightforward to observe
the real-time DNA extension dynamics [45, 46]. In my experiment, the two 12-nt sticky
ends of 48.5 kb λ-DNA molecules (48,502 bp, New England Biolabs) were labeled using
biotin-oligonucleotides using ligation reaction [38] and incubated in a flow channel (as
shown in Fig. 17C) which allows for quick and easy changing of solution. The single-
DNA tethers are formed between 2.8-μm-diameter streptavidin coated paramagnetic
beads (Dynalbeads M-280 Streptavidin, Invitrogen, Singapore) and the edge of a
functionalized 0# cover glass (Paul Marienfeld GmbH & Co.KG) through streptavidin-
biotin ligand interactions [46]. A permanent magnet is fixed and controlled by micro-
manipulator (Fig. 17A - Fig. 17C) to create an adjustable magnetic field around the flow
channel. Force was applied to the DNA substrate through the attached paramagnetic
bead. A 40X microscope objective is used to image the tethered bead onto a CCD
camera (Pike F-032, Allied Vision Technologies, Germany) at ~100 frames per second.
A home-written software with LabVIEW (National Instruments, US) was used to track
the paramagnetic bead (Fig. 16B). In this setup, we can apply constant force over a
wide range from 0.01pN to 200pN. We can also get high spatial and temporal resolution

43
of 2nm and 500HZ respectively. In the next section, more details of force calibration and
single tether determination of this transverse magnetic tweezers will be further
explained.
Figure 16. A) Transverse magnetic tweezers setup B) The screenshot of the LabVIEW
control software during one of the magnetic tweezers experiments.

44
Figure 17. A) Transverse magnetic tweezers set up in my study. B) Zoom-in picture of
miro-manipulator in this set up. C) Zoom-in picture of flow channel and magnets.
2.2.3 DNA EXTENSION MEASUREMENT, FORCE-CALIBRATION AND DETERMINATION OF SINGLE TETHERS

45
As shown in Fig. 16B, one end of DNA was attached to the functionalized cover glass
edge (arrowed dark grey line), and the other end was attached to the paramagnetic
bead through streptavidin-biotin ligand interactions. The DNA extension was determined
by the distance from the centroid of the magnetic bead to the glass edge. Note that
when DNA extension is ~2 μm, the bead is very close to the glass edge, which is also
the edge of our observation window. Therefore, we don’t let the extension of the DNA
go lower than this limit.
Force applied to the DNA substrate through the attached paramagnetic bead was
measured by bead thermal fluctuations according to the formula (10), 𝐹 = kBT z𝛿𝑦2
, which
was described in section 2.2.1.
In this single-molecule manipulation, since only the micrometer-sized paramagnetic
bead is visible but the attached DNA is not visible, the possibility of multiple DNA tethers
may happen, giving inaccurate results. Therefore, before adding any proteins, we must
make sure that the attached DNA tether is a single tether. This determination is
executed as follows: the force-extension curve of bare DNA molecule was recorded and
the persistence length was calculated by fitting the Marko-Siggia formula, 𝑓𝐴 kBT
=
14�1 − 𝑧
𝐿�−2− 1
4+ 𝑧
𝐿 , when the force range is from 0.5pN to 10pN. The DNA tether
between the glass edge and the paramagnetic bead was identified as a single tether if

46
the value of its persistence length is about 44 nm~53 nm [46]. After force calibration
and single-tether determination, experiments involving proteins can be performed.
2.3 SINGLE-MOLECULE IMAGING BY ATOMIC FORCE MICROSCOPY
2.3.1 PRINCIPLES OF AFM IMAGING TECHNIQUE
In 1986, Binnig, Quate and Gerber invented the first atomic force microscopy (AFM).
From that time, AFM has become one of the most powerful tools to measure, image and
manipulate matter with nanometer resolution [47-49]. AFM has many advantages over
its predecessor, the scanning electron microscopy (SEM). First, it does not require pre-
image sample treatment, such as carbon coatings in SEM, i.e. it will not damage or
change the samples. Some AFMs even allow liquid environment imaging, which
benefits biological studies a lot. Moreover, during the AFM imaging process, tapping
mode, which is one of the major imaging modes of AFM, is commonly used to reduce
sample damage by touching the sample surface gently and discontinuously. Secondly,
the AFM images are three-dimensional while images from SEM are only two-
dimensional.
The major components of AFM are a cantilever with a sharp probe, a laser beam
deflection system, an electronic PZT scanner and a system control computer, as shown
in Fig. 18 and Fig 19. The probe of the cantilever is coated by silicon or silicon nitride
47
with a radius of nanometers curvature. A laser beam is reflected from the back of the
cantilever and onto an array of photodiodes detector. When the probe is brought near to
the sample surface, force between the probe and the sample lead to a distortion of the
cantilever, which in turn change the direction of the reflective laser beam. This
information will be translated into the sample surface three-dimensional images through
the photodiode detector and the control system.
There are two major modes in atomic force microscopy, which are contact mode and
tapping mode, according to whether the probe continuously contacts with the surface.
In contact mode, the probe is brought in contact with the sample surface. The cantilever
is deflected by the force between the probe and the sample. This deflection is used as a
feedback signal to allow the AFM to create of images of the sample. However, because
the probe has physical contact with sample all the time, it may damage fragile or soft
samples or even stick to sample surface, a problem for most biological specimens.
In tapping mode, the cantilever is driven to oscillate up and down at its resonance
frequency. The probe is close enough to the sample to make short-range forces
detectable while far enough to avoid the tip damaging or sticking to the sample. It is
very suitable for biological samples imaging because the conformation of the sample
molecules can remain unchanged for hours with good operating parameters.

48
Figure 18. Schematic diagram of Atomic Force Microscopy (from wikipedia)

49
Figure 19. Molecular Imaging 5500 AFM (Molecular Imaging, Agilent Technologies)
set-up in my lab. The left is the core part of AFM, the middle is the software and sceen,
and the right part is the AFM controller.
2.3.2 FUNCTIONALIZATION OF MICA SURFACE FOR IMAGING EXPERIMENTS
As described in the last section, atomic force microscopy with tapping mode provides a
powerful means to image biological structures. Plenty of techniques for sample
preparation have been used to optimize image effect and avoid sample damage. Some
of these techniques, which were used in my study, are described here, including fresh-
mica, AP-mica and Glu-mica.

50
AFM samples should be immobilized on a rigid support. The size of biological
specimens such as DNA, proteins and DNA-protein complex is usually in the order of
nanometers. Accordingly, these biological structures need to be bound to a very flat
substrate. Mica is a very common substrate because it is atomically flat, easy to cut to
preferred size and relatively cheap.
First, some DNAs or proteins are prepared by incubating them onto fresh cleaved mica
(Fresh-mica). However, one problem arises. When mica contacts water, it is negatively
charged. DNAs or some proteins in solution are also negatively charged. Thus DNAs or
proteins are repelled away from the fresh-mica surface by electrostatic interaction, and
cannot be incubated on the fresh-mica. Divalent cations, such as Ni2+ or Mg2+, are
added to the solution to serve as a counter ion on the negatively charged DNA or
protein backbone and also provide additional charge to bind to the fresh-mica [50].
Although divalent ions make a bridge between fresh-mica surface and DNA or protein
molecules, they may also cause unexpected condensation to DNA or protein by
neutralizing the intrinsic charges of the molecules. Moreover, adding divalent ions, such
as magnesium, which has great influence on the DNA-protein interactions, may cause
fake AFM images of the protein/DNA complex. One mica functionalization based on
silanizing fresh mica surface with 3-aminopropyltriethoxysilane (APTES) [51] is
developed to avoid adding divalent ions. The reaction is shown in Fig. 20. In AP-mica,
the amino groups of APTES are covalently bound to the fresh mica, which makes the
modified mica surface is positively charged to hold DNAs or some proteins (negatively

51
charged) tightly. The amount of APTES added is very crucial to the imaging results. It is
usually highly diluted at the concentration of 0.1% (see section 2.5.2 for details)
because high concentration APTES solution cause large surface roughness which
makes nanometer sized DNA or protein indistinguishable. Another problem of AP-mica
is that positively charged AP-mica might influence the morphology of DNA-protein
complex by repelling the proteins away from DNAs electrostatically.
Glu-mica is created to solve the DNA-protein AFM imaging issues by simply adding
another glutaraldehyde layer to AP-mica surface [51], as illustrated in Fig. 20. This
method can be utilized to covalently immobilize various proteins, DNA-protein
complexes and other molecules with free lysine residues to mica surface. Since Glu-
mica can provide stable and reliable images of DNA-protein composites, it was used in
this study to provide vivid three-dimensional pictures of DNA-IHF interactions [51, 52].
The protocol of Glu-mica modification is introduced in section 2.5.2.

52
Figure 20. Schematic diagram of mica modification process, including AP-mica and
Glu-mica.(Figure produced by modifying the protocol of CHROMATIN 1.0 by Travis
Johnson in Agilent Technologies).
2.4 EXPRESSION, PURIFICATION AND CONCENTRATION MEASUREMENT OF INTEGRATION HOST FACTOR
Purified IHF proteins used in this study are provided by our collaborator Peter Droge
from Nanyang Technological University, Singapore. The protein expression and
purification were done in Peter’s lab, which are described in his published paper [53].
Si NH2
OEtEtO
OEt
EtOH
SiO O SiSi
Si NH2
OEt
OEtO
OHOHSiOH
O O SiSi ++
Glut-Mica
APTES
Glutaraldehyde
Covalent moleculeImmobilization on Glu-Mica
Molecules with free lysine residues
H H
OO
SiO O SiSi
SiOEt
OEtO N H
OH O
OH OH
mica
+AP-mica

53
IHF protein molecular weight and purity were double-checked in our lab by gel
electrophoresis. Gel Electrophoresis is the study of molecular mobility in an electric field.
Mediums acrylamide and agarose are generally used for proteins and DNA studies
respectively. In this study, we focus on protein electrophoresis by SDS-PAGE to check
the IHF molecular weight and purity.
SDS-PAGE treats proteins under denaturating conditions, meaning that secondary,
tertiary and quaternary structures are disrupted to produce a linear polypeptide chain
coated with negatively charged SDS molecules. Then the protein migrates only
depending on its size (molecular weight) because the number of SDS molecule bound
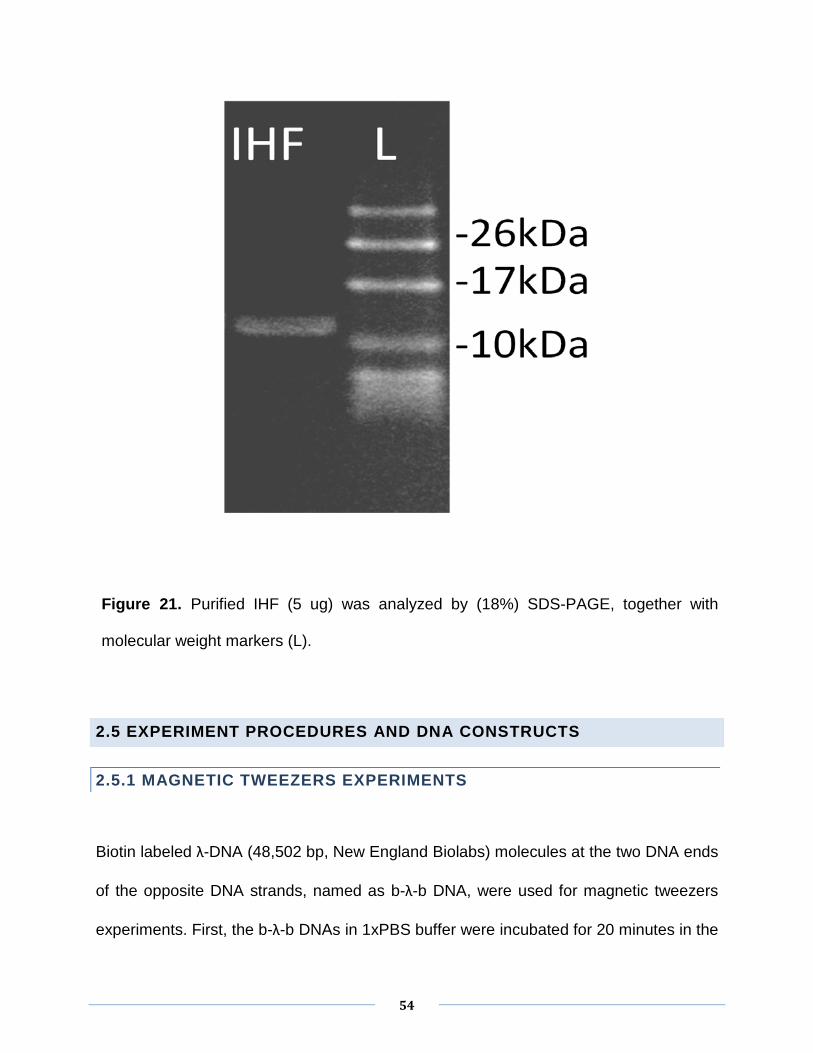
to a protein is proportional to the number of amino acids. As shown in Fig. 21, it is the
result of the SDS-PAGE of the purified integration host factor used in my study.
According to the molecular weight markers, two lines (not very clearly due to similar
size), corresponding to α and β subunits of IHF, weighted about 10KDa of each, are
observed. This result is consistent with the structure of IHF protein.
IHF protein concentration was measured by Nanodrop ND1000 (Wilmington, U.S.A).
Nanodrop ND100 calculates protein concentration by detecting purified proteins
exhibiting absorbance at 280nm in the resolution of 0.1mg/ml.
54
Figure 21. Purified IHF (5 ug) was analyzed by (18%) SDS-PAGE, together with
molecular weight markers (L).
2.5 EXPERIMENT PROCEDURES AND DNA CONSTRUCTS
2.5.1 MAGNETIC TWEEZERS EXPERIMENTS
Biotin labeled λ-DNA (48,502 bp, New England Biolabs) molecules at the two DNA ends
of the opposite DNA strands, named as b-λ-b DNA, were used for magnetic tweezers
experiments. First, the b-λ-b DNAs in 1xPBS buffer were incubated for 20 minutes in the

55
flow-channel to fix one end to the streptavidin-coated glass edge. Then 2.8μm-diameter
paramagnetic beads (Dynalbeads M-280, Invitrogen, Singapore) in 1xPBS buffer
solution were added into the channel to attach the other end of b-λ-b DNA by
streptavidin-biotin linkage. After washing away the unattached paramagnetic beads by
the reaction buffer, this flow channel was ready for use in transverse magnetic tweezers
experiment. The tweezers are capable of stretching a single DNA in the focal plane of
objective; therefore DNA structure transition dynamics can be studied directly. Before
adding proteins, the force-extension curve of dsDNA was recorded and the persistence
length was calculated by fitting the Marko-Siggia formula to identify whether the tether
studied was a single DNA (please see section 2.2.2 and 2.2.3 for more details). After
single-tether confirmation, proteins with different concentrations in reaction buffer were
flowed into the channel and the DNA extension changes under different forces were
recorded in real time. All experiments were conducted at room temperature except
illustrated specially.
2.5.2 AFM IMAGING EXPERIMENTS
ΦX174 RF I DNAs, which is circular and 5,386bp, were purchased from New England
Biolabs. These DNAs were digested with restriction enzyme PstI (New England Biolabs),
which has one cutting site along circular ΦX174 RF I DNA. After that, ΦX174-PstI DNAs,
which became linear, were used in the AFM experiments.

56
The mica was prepared by depositing 0.1 % APTES solution on a 0.5 cm x 0.5 cm piece
of mica for 10 minutes. The mica was then rinsed with deionised water, dried with
nitrogen gas before incubating in a desiccator for at least two hours. Then 1 %
glutaraldehyde solution was deposited for 10 minutes and the mica was washed and
dried as before. The Glu-mica is either used directly or stored in a desiccator (< 12hours)
for future use.
The solution of 0.2 ng/µl linearized ΦX174 DNA with an appropriate concentration of
IHF was mixed and incubated for 20 minutes. The solution was then deposited on the
mica for 20 minutes. After that the mica was washed with 3 millilitres of deionised water
and then dried with nitrogen gas slightly.
AFM imaging was performed by AC-mode in air with 60% humidity using Molecular
Imaging 5500 AFM (Molecular Imaging, Agilent Technologies). The AFM probe used in
all the measurements is silicon AFM probe (Taq300, Budget Sensors).

57
CHAPTER 3: NON-SPECIFIC BINDING OF INTEGRATION HOST FACTOR REGULATES CHROMATIN ORGANIZATION
3.1 ABSTRACT
As described in the previous chapters, the integration host factor (IHF) protein is an
abundant nucleoid protein that is involved in phage λ site-specific recombination and
gene regulation in E.coli. Introduction of a sharp DNA bend at binding sites specific for
IHF is thought to be critical for these functions. Interestingly, the intra-cellular
concentration of IHF is larger than the concentration needed for its site-specific
functions, suggesting that non-specific binding of IHF to DNA may play a role in the
physical organization of bacterial chromatin. However, it is unclear how non-specific
binding of IHF contributes to DNA organization.
Using a combination of single-DNA manipulation and atomic force microscopy imaging
methods, we show that distinct modes of non-specific binding of IHF to DNA result in
complex DNA conformations. Changes in KCl concentration, IHF concentration, and
force can change the sharpness of DNA bending. In addition, IHF can crosslink DNA
into a highly compact meshwork structure that is observed in the presence of
magnesium at low concentration of monovalent ions, and high IHF-DNA stoichiometries.
Our findings provide important insights how IHF contributes to bacterial chromatin
organization, gene regulation, and biofilm formation.

58
3.2 KCL CONCENTRATION AFFECTS THE INFLUENCE OF IHF ON THE FORCE RESPONSE OF SINGLE DNA
We first used transverse magnetic tweezers to study changes in the force-response of
single λ-DNA (48,502 bp) in response to changes in IHF and KCl concentrations at
20 oC and pH 7.4 (Fig. 22). For IHF concentrations ranging from 0–1,250 nM, the force-
extension curves were recorded in 200 mM KCl (Fig. 22A). To determine if IHF binding
reached a steady or equilibrium state, the data were recorded using a forward force
scan, during which the force was sequentially decreased from higher to lower values,
followed by a reversed force scan by increasing the force through the same set of force
values to determine if hysteresis exists. At each force, data was recorded for 30 s, and
the data obtained in the last 5 s was used to calculate the extension. No hysteresis was
observed in the reverse force scans, suggesting that IHF-DNA interactions reach
equilibrium within the experimental time scale. DNA extension monotonically decreases
as IHF concentration increases. At saturation binding concentration of IHF (> 500 nM),
IHF binding weakly reduces DNA extension. At 1,250 nM IHF [54], the DNA becomes
~20% shorter than naked DNA. Overall, our data are consistent with results of others
obtained under the same KCl concentration (Fig. 23) [54].
To understand how IHF-DNA interactions depend on the KCl concentration, we varied
the KCl concentration. We found that DNA is significantly less extended at 100 mM KCl
than at 200 mM KCl (Fig. 22A and B). Extension at 50 nM IHF in 100 mM KCl is
comparable that obtained at 1,250 nM IHF in 200 mM KCl, where saturation binding is
59
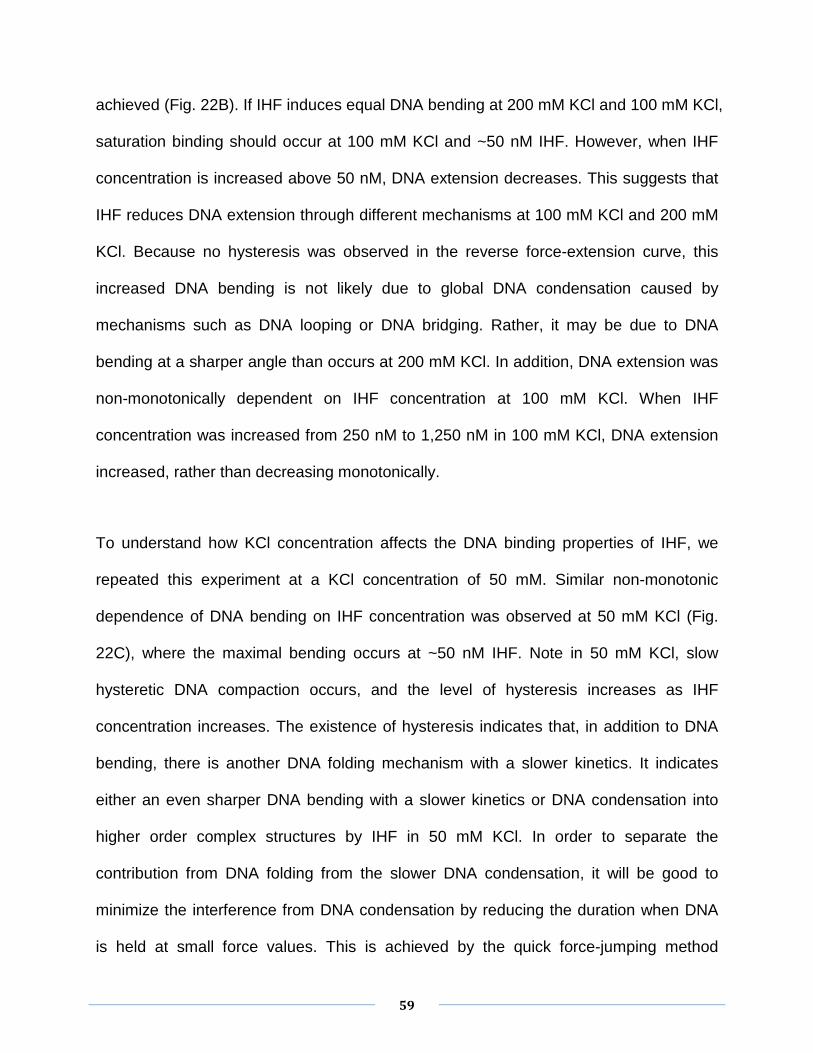
achieved (Fig. 22B). If IHF induces equal DNA bending at 200 mM KCl and 100 mM KCl,
saturation binding should occur at 100 mM KCl and ~50 nM IHF. However, when IHF
concentration is increased above 50 nM, DNA extension decreases. This suggests that
IHF reduces DNA extension through different mechanisms at 100 mM KCl and 200 mM
KCl. Because no hysteresis was observed in the reverse force-extension curve, this
increased DNA bending is not likely due to global DNA condensation caused by
mechanisms such as DNA looping or DNA bridging. Rather, it may be due to DNA
bending at a sharper angle than occurs at 200 mM KCl. In addition, DNA extension was
non-monotonically dependent on IHF concentration at 100 mM KCl. When IHF
concentration was increased from 250 nM to 1,250 nM in 100 mM KCl, DNA extension
increased, rather than decreasing monotonically.
To understand how KCl concentration affects the DNA binding properties of IHF, we
repeated this experiment at a KCl concentration of 50 mM. Similar non-monotonic
dependence of DNA bending on IHF concentration was observed at 50 mM KCl (Fig.
22C), where the maximal bending occurs at ~50 nM IHF. Note in 50 mM KCl, slow
hysteretic DNA compaction occurs, and the level of hysteresis increases as IHF
concentration increases. The existence of hysteresis indicates that, in addition to DNA
bending, there is another DNA folding mechanism with a slower kinetics. It indicates
either an even sharper DNA bending with a slower kinetics or DNA condensation into
higher order complex structures by IHF in 50 mM KCl. In order to separate the
contribution from DNA folding from the slower DNA condensation, it will be good to
minimize the interference from DNA condensation by reducing the duration when DNA
is held at small force values. This is achieved by the quick force-jumping method

60
explained below. In the force-jumping experiments, the DNA is held at > 10 pN to
prevent DNA folding during the introduction of IHF solution into the reaction channel.
Then, the force is jumped to a lower value and the DNA extension is recorded by
holding the DNA for only ~ 10 s. Then the force is jumped back to the high force to
ensure the DNA extension returned to the original value of the naked DNA. Repeating
this process for a series of other lower force values, the force-extension curve of DNA
can be obtained. In such experimental procedure, slow DNA folding occurring at a lower
force value will not accumulate to the next lower force data point; therefore, the
interference from slow DNA folding is reduced. Using the force-jumping method, the
force extension curve of another λ-DNA measured in 50 mM KCl (Fig. 22D) is very
similar to Fig. 22B obtained in 100 mM KCl, which again suggests a sharper DNA
bending than in 200 mM KCl and a non-monotonic dependence of the DNA extension
reduction on the concentration of IHF.
The non-monotonic dependence of the DNA extension on IHF concentration suggests
that the level of DNA bending is mediated by IHF concentration and that sharp DNA
bending is not favored at high IHF concentrations. To quantify this non-monotonic
dependence, the DNA extensions recorded at 200 mM KCl (Fig. 22A), 100 mM KCl (Fig.
22B), and 50 mM KCl (Fig. 22D) are plotted as functions of IHF concentration (Fig. 22E).
At 200 mM KCl, DNA extension monotonically decreases as IHF concentration
increases, whereas at 100 mM and 50 mM KCl, there appears to be a critical IHF
concentration, below which DNA extension monotonically decreases as IHF
concentration increases and above which DNA extension monotonically increases as

61
IHF concentration increases.
These results reveal non-specific interactions between IHF and DNA. Binding of IHF to
DNA, inducing a fixed bending angle, cannot explain these results. The existence of at
least two DNA bending states that depend on both KCl concentration and IHF
concentration would explain the differential force-response of the DNA-IHF complex to
these factors. In addition, the hysteresis observed in 50 mM KCl suggests that a
possible slower DNA condensation may also exist at low KCl concentration. These
hypothesized mechanisms will be investigated in details in subsequent sections.

62
Figure 22. Effects of IHF on the force response of 48,502 bp λ-DNA at varying
concentrations of KCl and pH 7.4. A) Forward and reverse force-extension curves of

63
DNA at the indicated concentrations of IHF in 200mM KCl. At saturation (1,250 nM IHF),
DNA extension is only slightly reduced, compared to the naked DNA at small force
region, implying weak DNA bending by IHF. No hysteresis was observed in the reverse
curve, suggesting that IHF-DNA interaction reached a steady state under these
conditions. B) In 100 mM KCl, a non-monotonic relation between the DNA extension
and IHF concentration is observed. At non-saturated ~250 nM IHF, maximal DNA
extension reduction occurs, which is significantly greater than in 200 mM KCl when
saturation binding occurs at 1,250 nM IHF. No hysteresis was observed in the reverse
curve, suggesting that IHF-DNA interaction reaches a steady state over the
experimental time scale. C) In 50 mM KCl, a similar non-monotonic relation between the
DNA extension and IHF concentration is observed, except that the maximal DNA
extension reduction occurs at a smaller IHF concentration (~50 nM). A difference from
100 mM KCl is that hysteresis was observed in the reverse curves, and becomes larger
at higher IHF concentrations. This suggests that in addition to DNA bending, a slower
DNA condensation may also contribute to the DNA extension reduction. D) Re-
measuring the force-extension curves in 50 mM KCl by a quick force jumping method
(see details in main text) to only probe the contribution by DNA bending to DNA
extension change. The force-extension curves obtained in this way again demonstrates
the non-monotonic relation between the DNA extension and IHF concentration. E) DNA
extension as a function of the IHF concentration at ~ 0.1 pN in different KCL
concentrations. Data at 0.1 pN were obtained from the force-extension curves at
corresponding KCl concentrations in Fig. 22A-B&D by linear interpolation using two
nearest neighboring data points adjacent to 0.1 pN.

64
Figure 23. Previous study of the force-extension curves of 48,502 bp λ-DNA in 200 mM
KCl solution at different concentrations of IHF: 0 nM IHF (full circles), 1250 nM IHF
(empty triangles) [54]. (For the purpose to compare with my result, according to
Copyright and License policy of PNAS).
3.3 KCL CONCENTRATION MEDIATES SWITCH BETWEEN WEAK AND SHARP BENDING OF IHF-DNA COMPLEX
At an IHF concentration of saturated binding (e.g. 1,250 nM), DNA is more extended in
200 mM KCl than the shortest DNA extension at 50 mM or 100 mM KCl (Fig. 22E). To

65
determine if decreasing the KCl concentration induces sharper DNA bending, a DNA
tether was incubated at varying concentrations of IHF in 200 mM KCl and then at 50
mM KCl without free IHF proteins. If most of the IHF bound to the DNA in 200 mM KCl
do not dissociate during exchanging buffer solution, one should expect to see the
response of IHF-DNA complex to the change in KCl concentration which is not impacted
by free IHF in solution.
At 200 mM KCl and the unsaturated IHF concentration of 50 nM IHF, the force-
extension curve almost overlaps with the reference curve obtained from naked DNA
before IHF was added (Fig. 24). However, at 50 mM KCl in the absence of IHF, DNA
extension was reduced slightly by ~ 600 nm at ~ 0.08 pN (Fig. 24). This decrease in
DNA extension was not caused by effects of salt on the elasticity of naked DNA, as the
force-response of DNA is almost identical in KCl concentrations ranging from 50–200
mM (Fig.25). Repeating this experiment at IHF concentration of 250 nM or the saturated
concentration of 1,250 nM, we obtained similar results but with greater DNA extension
reduction. These findings support the existence of at least two distinct DNA bending
modes of the IHF-DNA complex. Because there was no free IHF in the 50 mM KCl
solution, the reduced extension that occurred after changing the buffer should have
resulted from the response of DNA-bound IHF to the change in KCl concentration.

66
Figure 24. Decreasing KCl concentration, from 200 mM KCl to 50 mM KCl, drives a
switch from a weaker DNA bending conformation to a sharper DNA bending
conformation. Filled circles represent force-extension curves of DNA incubated in 200
mM KCl and the indicated concentration of IHF. Open circles represent force-extension
curves of DNA after lowering the KCl concentration to 50 mM and removing IHF. The
shift of the force-extension curves after lowering the KCl concentration and removing
the IHF molecules that were pre-bound to DNA at 200 mM KCl indicates the
subsequent change in DNA extension.

67
Figure 25. Force-extension curves of λ-DNA in 50 – 200 mM KCl and pH 7.4 (10 mM
Tris). It shows that the force-response of DNA is almost identical in various KCl
concentrations.
3.4 THE SHARPER DNA BENDING IS INHIBITED AT HIGH IHF CONCENTRATION
A surprising observation is the non-monotonic relationship between the DNA extension
and the concentration of IHF observed in 100 mM and 50 mM KCl, where sharper DNA

68
bending can occur (Fig. 22B-D). In these KCl concentrations, there exists a non-
saturated critical IHF concentration (~250 nM IHF in 100 mM KCl and ~50 nM IHF in 50
mM KCl), at which the DNA extension reduction is maximized (Fig. 22 E). This contrasts
with in the case of in 200 mM KCl where only the weaker DNA bending is allowed, and
where the extension monotonically decreases as IHF concentration increases (Fig. 22A
and Fig. 22E).
Such non-monotonic behavior suggests that, in low KCl concentration where the
sharper DNA bending is allowed, the sharper DNA bending will be inhibited at high IHF
concentration. Otherwise, one would expect that DNA extension monotonically
decreases as IHF concentration increases till saturation. Although the mechanism of
this IHF concentration dependent transition is not clear, a possibility is that, at high IHF
concentration, an IHF occupies less DNA by adopting the less bending conformation to
provide room to accommodate more IHF proteins. Furthermore, such overcrowded IHF
on DNA may also restrict the level of DNA bending due to expulsive interaction between
neighboring IHF proteins when DNA bends. Discussion of this hypothesis will be
elaborated in the discussion chapter.
3.5 IHF INDUCES MORE COMPACT DNA CONFORMATIONS AT LOW KCL CONCENTRATION
Although hysteresis did not occur at 100 mM KCl (Fig. 22B), it occurred significantly at
50 mM KCl, and increased with the IHF concentration (Fig. 22C). Hysteresis was

69
moderate at 50–250 nM IHF (Fig. 22C), but high at 1,250 nM IHF (Fig. 22C). The DNA
could not be unfolded to its original extension in the reverse force scan (Fig. 22C). This
hysteresis indicates that, in addition to bending, there is another DNA folding
mechanism with slower kinetics.
In order to obtain more information of the DNA organization by IHF at different KCl
concentrations, we performed AFM imaging experiments on a glutaraldehyde-coated
mica surface that is particularly useful for imaging DNA-protein complexes [51, 52]. As
the glutaraldehyde molecules are covalently bound to the surface, they do not diffuse
into the solution and therefore do not non-specifically crosslink proteins or DNA-protein
complexes. Such surface has been shown less perturbing the stability of DNA-protein
interactions and is friendly to DNA-protein complex imaging. At 50 mM KCl, naked linear
dsDNA (Φx 174, 5,386 bp), which does not contain any consensus IHF sites, assumed
an extended random coiled conformation (Fig. 26A). In contrast, addition of 50–250 nM
IHF induced more compact DNA conformations (Fig. 26B-D). However, in 50 mM KCl
and 1,250 nM IHF, the DNA conformations became significantly more extended than in
50& 250 nM IHF. Similar compact DNA conformation was also observed at 100 mM KCl
(Fig. 26 E-F), where sharp DNA bending is also prevalent. In contrast, DNA was weakly
bent in single-DNA stretching experiments at 200 mM KCl, and condensation was not
observed even at the saturation concentration of 1,250 nM IHF (Fig. 27).

70
Figure 26. Atomic force microscopy images of linearized double-stranded Φx174 DNA
(5,386 bp) incubated with varying concentrations of IHF. A) Naked DNA that was not

71
incubated with IHF in 50 mM KCl as a control. B) DNA molecules, incubated with 50 nM
IHF in 50 mM KCl. C) DNA molecules, incubated with 250 nM IHF in 50mM KCl, show
similar compact DNA conformations as Fig. 26B. D) DNA molecules, incubated with
1,250 nM IHF in 50mM KCl. Although DNA condensation still occurs, the DNA
conformations are more extended compared to those in 50 nM (B) and 250 nM IHF (C)
concentrations. This more extended conformation may be caused by IHF overcrowding
on DNA in low KCl and high IHF concentrations suggested in Fig. 22 B-E. E) DNA
molecules, incubated with 250 nM IHF in 100 mM KCl, show compact DNA
conformations. F) DNA molecules incubated with 1,250 nM IHF in 100 mM KCl, also
show compact DNA conformations.
Figure 27. Atomic force microscopy image of linearized double-stranded Φx174 DNA
(5,386 bp) incubated with the saturation concentration of 1,250 nM IHF in 200mM KCl.
Compact DNA conformations were not observed.

72
In general, these AFM imaging results are consistent with the results from single-DNA
stretching experiments: 1) DNA is more sharply bent in 100 mM and 50 mM KCl than in
200 mM KCl, and 2) in low salt concentration, the DNA bending angle non-
monotonically depends on the concentration of IHF, as demonstrated in Figure 26D. In
addition, we did not find apparent evidence that DNA can be condensed into higher
order structures in 50 mM KCl. Such DNA condensation mechanism would predict
DNA-protein complexes of varying sizes expected from inter-DNA aggregations
mediated by IHF, while the sizes of the DNA-IHF complexes found in our AFM imaging
experiments do not vary a lot.
3.6 IHF CONDENSES DNA INTO HIGHER ORDER STRUCTURES IN THE
PRESENCE OF MAGNESIUM
Magnesium is essential for many enzymatic reactions in bacteria, and is present in
bacteria at concentrations up to 4 mM [55]. It is also critical for chromosomal
condensation and DNA repair [55, 56]. Recent experiments suggest that magnesium is
also important for regulating the DNA binding properties of bacterial NAPs, such as H-
NS and StpA [8, 36, 57]. This finding suggests that binding of IHF to DNA might be
regulated by magnesium.
We used single-DNA stretching experiments to investigate the effects of magnesium on
binding of IHF to DNA. To see the effects of magnesium on sharp DNA bending and
DNA condensation, the KCl concentration was fixed at 50 mM. To minimize the
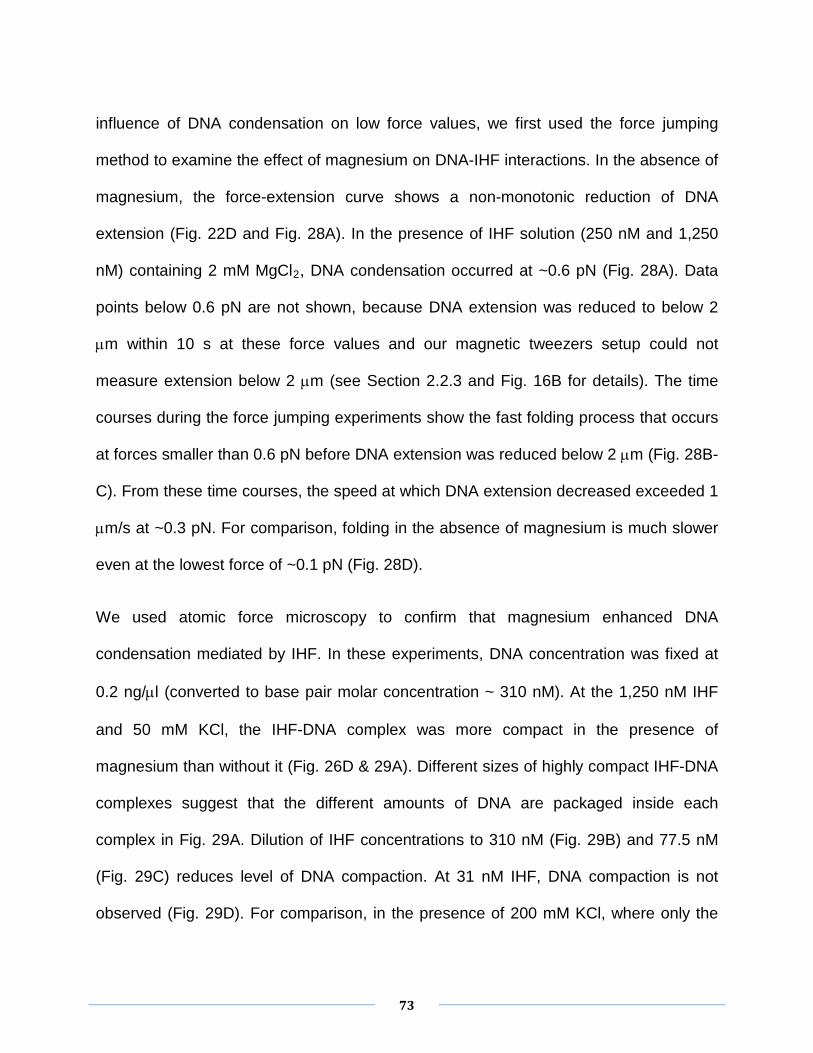
73
influence of DNA condensation on low force values, we first used the force jumping
method to examine the effect of magnesium on DNA-IHF interactions. In the absence of
magnesium, the force-extension curve shows a non-monotonic reduction of DNA
extension (Fig. 22D and Fig. 28A). In the presence of IHF solution (250 nM and 1,250
nM) containing 2 mM MgCl2, DNA condensation occurred at ~0.6 pN (Fig. 28A). Data
points below 0.6 pN are not shown, because DNA extension was reduced to below 2
µm within 10 s at these force values and our magnetic tweezers setup could not
measure extension below 2 µm (see Section 2.2.3 and Fig. 16B for details). The time
courses during the force jumping experiments show the fast folding process that occurs
at forces smaller than 0.6 pN before DNA extension was reduced below 2 µm (Fig. 28B-
C). From these time courses, the speed at which DNA extension decreased exceeded 1
µm/s at ~0.3 pN. For comparison, folding in the absence of magnesium is much slower
even at the lowest force of ~0.1 pN (Fig. 28D).
We used atomic force microscopy to confirm that magnesium enhanced DNA
condensation mediated by IHF. In these experiments, DNA concentration was fixed at
0.2 ng/µl (converted to base pair molar concentration ~ 310 nM). At the 1,250 nM IHF
and 50 mM KCl, the IHF-DNA complex was more compact in the presence of
magnesium than without it (Fig. 26D & 29A). Different sizes of highly compact IHF-DNA
complexes suggest that the different amounts of DNA are packaged inside each
complex in Fig. 29A. Dilution of IHF concentrations to 310 nM (Fig. 29B) and 77.5 nM
(Fig. 29C) reduces level of DNA compaction. At 31 nM IHF, DNA compaction is not
observed (Fig. 29D). For comparison, in the presence of 200 mM KCl, where only the

74
weak DNA bending is allowed, single-DNA stretching experiment (Fig. 30A) and atomic
force microscopy imaging (Fig. 30B-C) showed that magnesium does not influence the
interaction of DNA and IHF.
These results indicate that magnesium promotes DNA compaction at low
concentrations of KCl. Considering that IHF is an abundant NAP in all the growth
phases of E. coli and magnesium exists in vivo in the mM range, these findings imply
that the non-specific binding of IHF to bacterial DNA could be important for bacterial
DNA compaction and organization of eDNA in biofilms.

75
Figure 28. Effects of magnesium on DNA condensation in the presence of IHF by
magnetic tweezers. A) Force-extension curves obtained using the quick force jumping
method. Triangles and circles represent data obtained in the absence and presence of 2
mM MgCl2, respectively. For 250 nM IHF and 1,250 nM IHF, data are not shown for
force <0.6 pN because DNA extension was below the minimal extension (~2 µm) that
could be measured by our instrument. B-C) DNA folding time course at various values
of lower force and unfolding time course at the high force of ~12 pN in 250 nM IHF and
1,250 nM IHF, respectively. D) DNA folding time course of λ-DNA with 1250nM IHF in
50 mM KCl solution without magnesium. Folding in the absence of magnesium is much
slower even at the lowest force of ~0.1 pN. The green dot grids are used as a
comparison criterion for the DNA extension reduction.

76
Figure 29. Atomic force microscopy analysis of effects of magnesium on linearized
Φx174 DNA (5,386 bp) condensation in the presence of IHF in 50 mM KCl, 2mM MgCl2.
A) DNA molecules incubated with 1,250 nM IHF (4 IHF: 1bp). B) DNA molecules
incubated with 310 nM IHF (1 IHF: 1bp). C) DNA molecules incubated with 77 nM IHF
(1 IHF: 4bp). D) DNA molecules incubated with 31 nM IHF (1 IHF: 10bp).

77
Figure 30. Magnesium does not have an apparent influence on DNA-IHF interaction in
200mM KCl, where only the weaker DNA bending occurs. A) Forward and reverse
force-extension curves of λ-DNA at the indicated IHF concentrations in 200mMKCl
solution. These curves are similar to those obtained in 200mM KCl in the absence of
magnesium (Fig20A). B-C) AFM imaging of linearized Φx174 DNA (5,386 bp)
molecules complexed with 1,250 nM IHF in 200 mM KCl in the absence of (B) and in
the present of (C) 2 mM MgCl2. These two images show great identities, which means
that magnesium does not affect the conformation of DNA/IHF complex in 200 mM KCl.

78
CHAPTER 4: DISCUSSION AND CONCLUSION
4.1 SUMMARY OF DNA BINDING MODES OF IHF AND THEIR DEPENDENCE ON ENVIRONMENTAL FACTORS
Our results described in the last chapter indicate that the interaction between IHF and
DNA is very complex, with IHF binding DNA through different modes that induce
different DNA bending patterns. Furthermore, these different DNA binding modes are
sensitive to environmental factors including KCl concentration, magnesium
concentration, IHF concentration, and force. High concentrations of KCl induce weak
DNA bending that is mediated by IHF. At high concentrations of KCl, a saturated
concentration of IHF does not condense DNA further. At KCl concentration of 100 mM
or less and unsaturated IHF concentration, a sharper DNA bending state appears.
This sharp bending state is inhibited at higher IHF concentrations, which leads to
increased DNA extension as a function of the IHF concentration. This more extended
DNA conformation is energetically favorable at high concentrations of IHF, because it
will likely make more DNA available to accommodate more IHF proteins. Moreover, a
physiological concentration of magnesium enhanced DNA compaction, suggesting a
role of IHF in the packaging of bacterial DNA.
These DNA binding modes, their dependence on environmental factors, and the
resulting DNA deformations and organizations are summarized and explained in Fig. 31

79
and its caption.
Figure 31. Schematic of the conformational states of the DNA-IHF complex and their
dependence on force, [IHF], [KCl], and [MgCl2]. Yellow represents an IHF dimer, and
blue represents dsDNA. When binding of IHF is unsaturated, the weaker and sharper
bending conformations are regulated by the concentration of KCl or tension. At high
concentrations of IHF, DNA always adopts the weaker bending conformation regardless
of the KCl concentration and tension due to overcrowding of IHF on DNA (middle).
When overcrowding occurs at low concentrations of KCl, the exposed DNA interface
that interacts with IHF can also interact with another DNA, leading to DNA condensation
in the presence of magnesium.

80
4.2 IMPLICATIONS ON GLOBAL BACTERIAL GENE REGULATION
IHF influences global transcription in E. coli [16] and S. typhimurium [17]. It has been
suggested that IHF positively regulates gene transcription by bending DNA to facilitate
contact between regulatory proteins and RNA polymerase [19]. Our finding that IHF
induces more than one DNA bending states that are mediated by several physiological
factors suggests that gene regulation by IHF may be influenced by physiological factors
that mediate DNA bending. However, regulation of specific genes by IHF is most likely
controlled by high-affinity binding of IHF to specific DNA sequences, and the DNA
conformations induced by these specific interactions may differ from those induced by
non-specific interactions.
4.3 IMPLICATIONS ON PACKAGING OF CHROMOSOMAL DNA IN BACTERIA
IHF is the second most abundant NAP in the early stationery phase with a copy number
of ~55,000 and a concentration of ~55µM [29]. Interestingly, the nucleoid of E. coli
becomes more compact when it enters the stationary phase [6]. Because Dps is the
most abundant NAP in the early stationery phase and it condenses DNA, Dps is
believed to be responsible for the chromosomal DNA packaging in bacteria [58]. Our
results suggest that IHF may also play a major role in DNA compaction during the early
stationary phase, because it condenses DNA at physiological concentrations of
magnesium. Additional studies are needed to determine how IHF contributes to DNA
packaging in the presence of other NAPs.

81
4.4 IMPLICATIONS ON BIOFILM MAINTENANCE
In nature, bacteria form an organized, functional, and complex community called a
biofilm. It has been estimated that most bacterial infections involve biofilm formation
during the disease process [33]. Extracellular polymeric substances (EPS) that contain
polysaccharides, proteins, nucleic acids, and lipids are critical to the formation and
maintenance of biofilm [31]. The EPS provide the scaffold for the three-dimensional
architecture of the biofilm and protect the bacteria within the biofilm [31].
Extracellular DNA (eDNA) is a common component of the EPS and forms a DNA
meshwork. It has been shown that the eDNA meshwork plays an important role in
stabilizing the biofilms [32]. Interestingly, IHF and Hu have been found in the eDNA
meshwork [30, 33]. These proteins are critical for the integrity of the EPS matrix of
biofilms, as removal of these proteins leads to biofilm disassembly or biofilm debulking
[33]. Fluorescence imaging studies have shown that IHF and Hu localize to kinked DNA
and crossed DNA within the eDNA meshwork of an NTHI biofilm [33]. These results
support our finding that IHF can bend DNA and, in the presence of MgCl2, condense
DNA into a meshwork-like structure. Therefore, our results also provide insights into the
structural roles of IHF in supporting biofilm integrity.
4.5 RELEVANCE OF BENDING INDUCED BY SPECIFIC AND NON-SPECIFIC IHF BINDING

82
Binding of IHF to the 34-bp H’ sequence induces a sharp DNA bend that exceeds ~160o.
To determine if the sharper DNA bending caused by non-specific binding of IHF is
similar to the bending the H’ sequence by IHF, we simulated the reduction of DNA
extension at 0.1 pN as a function of bending angle and the density of IHF bound to DNA
using the worm-like-chain polymer model of DNA.
According to experiments, at 0.1 pN, the extension of DNA decreased the most at IHF
concentrations of 250 nM in 100 mM KCL and 50 nM in 50 nM KCl, where DNA
extension was shortened by ~50% (see Fig. 22E). To compare with the experiments, we
simulated the values of the density of IHF and the bending angles that can decrease
extension by 50% at 0.1 pN (Fig. 32). For a bending angle of 160o, low protein
occupancy around one IHF per 400 bp would be required to reduce extension by 50%.
However, in our experiments, the greatest decrease in extension occurred at critical
concentrations of IHF above which overcrowding of IHF occurs. Therefore, we expect
that the IHF occupancy should be much higher when extension is decreased maximally.
This finding suggests that in the non-specific DNA binding mode, DNA in the sharper
bending state in 100 mM KCl and 50 mM KCl is still much less bent than H’ bent by IHF
in the specific binding.
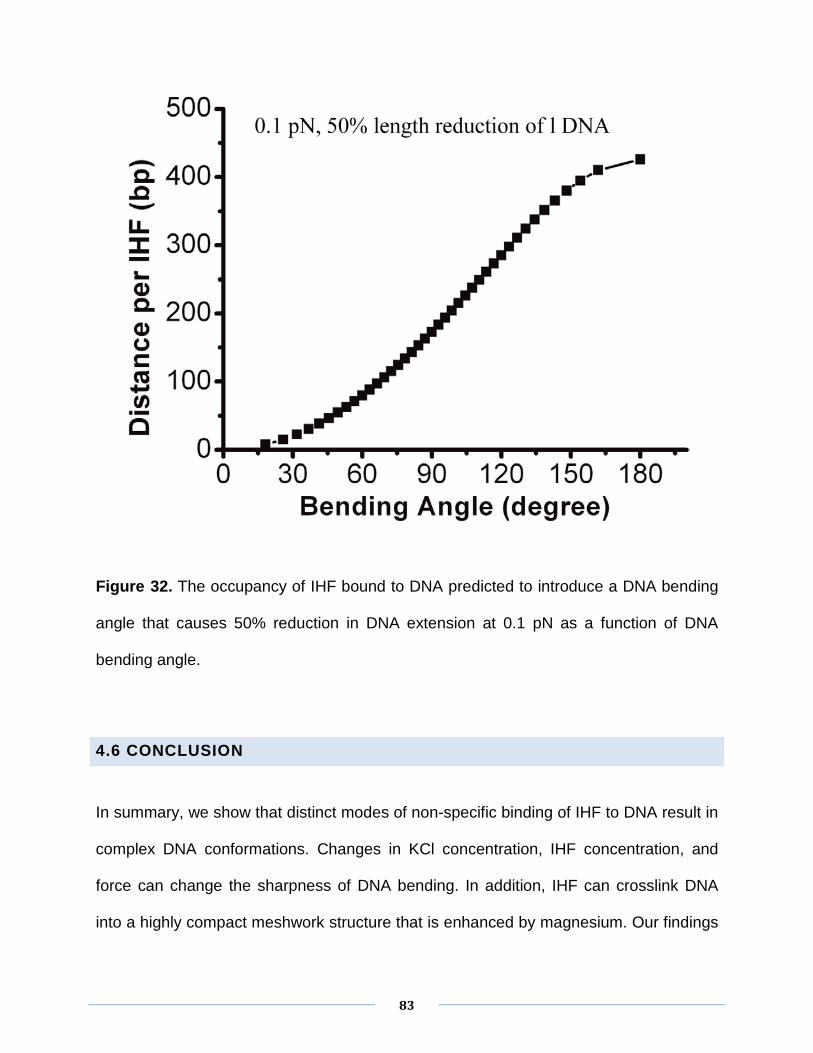
83
Figure 32. The occupancy of IHF bound to DNA predicted to introduce a DNA bending
angle that causes 50% reduction in DNA extension at 0.1 pN as a function of DNA
bending angle.
4.6 CONCLUSION
In summary, we show that distinct modes of non-specific binding of IHF to DNA result in
complex DNA conformations. Changes in KCl concentration, IHF concentration, and
force can change the sharpness of DNA bending. In addition, IHF can crosslink DNA
into a highly compact meshwork structure that is enhanced by magnesium. Our findings

84
provide insights into the interactions and functions of IHF in bacterial gene regulation,
chromosome packaging, and biofilm maintenance.

85
REFERENCE
1. KUBITSCHEK, H.E., CELL VOLUME INCREASE IN ESCHERICHIA COLI AFTER SHIFTS TO RICHER MEDIA. J. BACTERIOL., 1990. 172(1): P. 94-101.
2. CHO, B.-K. AND B.Ø. PALSSON, CAN THE PROTEIN OCCUPANCY LANDSCAPE SHOW THE TOPOLOGICALLY ISOLATED CHROMOSOMAL DOMAINS IN THE E. COLI GENOME?: AN EXCITING PROSPECT. MOLECULAR CELL, 2009. 35(3): P. 255-256.
3. BROWNING, D.F., D.C. GRAINGER, AND S.J. BUSBY, EFFECTS OF NUCLEOID-ASSOCIATED PROTEINS ON BACTERIAL CHROMOSOME STRUCTURE AND GENE EXPRESSION. CURR OPIN MICROBIOL, 2010. 13(6): P. 773-80.
4. ALI AZAM, T., ET AL., GROWTH PHASE-DEPENDENT VARIATION IN PROTEIN COMPOSITION OF THE ESCHERICHIA COLI NUCLEOID. J BACTERIOL, 1999. 181(20): P. 6361-70.
5. SINGER, B.S., ET AL., LIBRARIES FOR GENOMIC SELEX. NUCLEIC ACIDS RES, 1997. 25(4): P. 781-6.
6. FRENKIEL-KRISPIN, D., ET AL., REGULATED PHASE TRANSITIONS OF BACTERIAL CHROMATIN: A NON-ENZYMATIC PATHWAY FOR GENERIC DNA PROTECTION. EMBO J, 2001. 20(5): P. 1184-91.
7. MAURER, S., J. FRITZ, AND G. MUSKHELISHVILI, A SYSTEMATIC IN VITRO STUDY OF NUCLEOPROTEIN COMPLEXES FORMED BY BACTERIAL NUCLEOID-ASSOCIATED PROTEINS REVEALING NOVEL TYPES OF DNA ORGANIZATION. J MOL BIOL, 2009. 387(5): P. 1261-76.
8. LIU, Y., ET AL., A DIVALENT SWITCH DRIVES H-NS/DNA-BINDING CONFORMATIONS BETWEEN STIFFENING AND BRIDGING MODES. GENES DEV, 2010. 24(4): P. 339-44.
9. DILLON, S.C. AND C.J. DORMAN, BACTERIAL NUCLEOID-ASSOCIATED PROTEINS, NUCLEOID STRUCTURE AND GENE EXPRESSION. NAT REV MICROBIOL, 2010. 8(3): P. 185-95.
10. MCLEOD, S.M., ET AL., THE C-TERMINAL DOMAINS OF THE RNA POLYMERASE ALPHA SUBUNITS: CONTACT SITE WITH FIS AND LOCALIZATION DURING CO-ACTIVATION WITH CRP AT THE ESCHERICHIA COLI PROP P2 PROMOTER. J MOL BIOL, 2002. 316(3): P. 517-29.
11. GRAINGER, D.C., ET AL., ASSOCIATION OF NUCLEOID PROTEINS WITH CODING AND NON-CODING SEGMENTS OF THE ESCHERICHIA COLI GENOME. NUCLEIC ACIDS RES, 2006. 34(16): P. 4642-52.
12. WIGGINS, P.A., ET AL., PROTEIN-MEDIATED MOLECULAR BRIDGING: A KEY MECHANISM IN BIOPOLYMER ORGANIZATION. BIOPHYS J, 2009. 97(7): P. 1997-2003.
13. ISHIHAMA, A., PROKARYOTIC GENOME REGULATION: MULTIFACTOR PROMOTERS, MULTITARGET REGULATORS AND HIERARCHIC NETWORKS. FEMS MICROBIOL REV, 2010. 34(5): P. 628-45.
14. NASH, H.A. AND C.A. ROBERTSON, PURIFICATION AND PROPERTIES OF THE ESCHERICHIA COLI PROTEIN FACTOR REQUIRED FOR LAMBDA INTEGRATIVE RECOMBINATION. J BIOL CHEM, 1981. 256(17): P. 9246-53.
15. RICE, P.A., ET AL., CRYSTAL STRUCTURE OF AN IHF-DNA COMPLEX: A PROTEIN-INDUCED DNA U-TURN. CELL, 1996. 87(7): P. 1295-306.
16. ARFIN, S.M., ET AL., GLOBAL GENE EXPRESSION PROFILING IN ESCHERICHIA COLI K12. THE EFFECTS OF INTEGRATION HOST FACTOR. J BIOL CHEM, 2000. 275(38): P. 29672-84.

86
17. MANGAN, M.W., ET AL., THE INTEGRATION HOST FACTOR (IHF) INTEGRATES STATIONARY-PHASE AND VIRULENCE GENE EXPRESSION IN SALMONELLA ENTERICA SEROVAR TYPHIMURIUM. MOLECULAR MICROBIOLOGY, 2006. 59(6): P. 1831-47.
18. CASES, I. AND V. DE LORENZO, PROMOTERS IN THE ENVIRONMENT: TRANSCRIPTIONAL REGULATION IN ITS NATURAL CONTEXT. NAT REV MICROBIOL, 2005. 3(2): P. 105-18.
19. SANTERO, E., ET AL., ROLE OF INTEGRATION HOST FACTOR IN STIMULATING TRANSCRIPTION FROM THE SIGMA 54-DEPENDENT NIFH PROMOTER. J MOL BIOL, 1992. 227(3): P. 602-20.
20. GOODRICH, J.A., M.L. SCHWARTZ, AND W.R. MCCLURE, SEARCHING FOR AND PREDICTING THE ACTIVITY OF SITES FOR DNA BINDING PROTEINS: COMPILATION AND ANALYSIS OF THE BINDING SITES FOR ESCHERICHIA COLI INTEGRATION HOST FACTOR (IHF). NUCLEIC ACIDS RES, 1990. 18(17): P. 4993-5000.
21. ENGELHORN, M., ET AL., IN VIVO INTERACTION OF THE ESCHERICHIA COLI INTEGRATION HOST FACTOR WITH ITS SPECIFIC BINDING SITES. NUCLEIC ACIDS RES, 1995. 23(17): P. 2959-65.
22. USSERY, D., ET AL., GENOME ORGANISATION AND CHROMATIN STRUCTURE IN ESCHERICHIA COLI. BIOCHIMIE, 2001. 83(2): P. 201-12.
23. WANG, S., ET AL., THE SPECIFIC BINDING OF ESCHERICHIA COLI INTEGRATION HOST FACTOR INVOLVES BOTH MAJOR AND MINOR GROOVES OF DNA. BIOCHEMISTRY, 1995. 34(40): P. 13082-90.
24. YANG, S.W. AND H.A. NASH, COMPARISON OF PROTEIN BINDING TO DNA IN VIVO AND IN VITRO: DEFINING AN EFFECTIVE INTRACELLULAR TARGET. EMBO J, 1995. 14(24): P. 6292-300.
25. MURTIN, C., ET AL., A QUANTITATIVE UV LASER FOOTPRINTING ANALYSIS OF THE INTERACTION OF IHF WITH SPECIFIC BINDING SITES: RE-EVALUATION OF THE EFFECTIVE CONCENTRATION OF IHF IN THE CELL. J MOL BIOL, 1998. 284(4): P. 949-61.
26. CRAIG, N.L. AND H.A. NASH, E. COLI INTEGRATION HOST FACTOR BINDS TO SPECIFIC SITES IN DNA. CELL, 1984. 39(3 PT 2): P. 707-16.
27. NIENHUIS, A.W., ET AL., EXPRESSION OF THE HUMAN C-FMS PROTO-ONCOGENE IN HEMATOPOIETIC CELLS AND ITS DELETION IN THE 5Q- SYNDROME. CELL, 1985. 42(2): P. 421-8.
28. SUGIMURA, S. AND D.M. CROTHERS, STEPWISE BINDING AND BENDING OF DNA BY ESCHERICHIA COLI INTEGRATION HOST FACTOR. PROC NATL ACAD SCI U S A, 2006. 103(49): P. 18510-4.
29. DITTO, M.D., D. ROBERTS, AND R.A. WEISBERG, GROWTH PHASE VARIATION OF INTEGRATION HOST FACTOR LEVEL IN ESCHERICHIA COLI. J BACTERIOL, 1994. 176(12): P. 3738-48.
30. STINSON, M.W. AND E.J. BERGEY, ISOLATION OF HEART- AND KIDNEY-BINDING PROTEIN FROM GROUP A STREPTOCOCCI. INFECT IMMUN, 1982. 35(1): P. 335-42.
31. FLEMMING, H.C. AND J. WINGENDER, THE BIOFILM MATRIX. NAT REV MICROBIOL, 2010. 8(9): P. 623-33.
32. WHITCHURCH, C.B., ET AL., EXTRACELLULAR DNA REQUIRED FOR BACTERIAL BIOFILM FORMATION. SCIENCE, 2002. 295(5559): P. 1487.
33. GOODMAN, S.D., ET AL., BIOFILMS CAN BE DISPERSED BY FOCUSING THE IMMUNE SYSTEM ON A COMMON FAMILY OF BACTERIAL NUCLEOID-ASSOCIATED PROTEINS. MUCOSAL IMMUNOL, 2011. 4(6): P. 625-37.
34. YAN, J. AND J.F. MARKO, EFFECTS OF DNA-DISTORTING PROTEINS ON DNA ELASTIC RESPONSE. PHYS REV E STAT NONLIN SOFT MATTER PHYS, 2003. 68(1 PT 1): P. 011905.

87
35. YAN, J., R. KAWAMURA, AND J.F. MARKO, STATISTICS OF LOOP FORMATION ALONG DOUBLE HELIX DNAS. PHYS REV E STAT NONLIN SOFT MATTER PHYS, 2005. 71(6 PT 1): P. 061905.
36. LIM, C.J., ET AL., GENE SILENCING H-NS PARALOGUE STPA FORMS A RIGID PROTEIN FILAMENT ALONG DNA THAT BLOCKS DNA ACCESSIBILITY. NUCLEIC ACIDS RESEARCH, 2011.
37. WATSON, J.D. AND F.H. CRICK, MOLECULAR STRUCTURE OF NUCLEIC ACIDS; A STRUCTURE FOR DEOXYRIBOSE NUCLEIC ACID. NATURE, 1953. 171(4356): P. 737-8.
38. SMITH, S.B., L. FINZI, AND C. BUSTAMANTE, DIRECT MECHANICAL MEASUREMENTS OF THE ELASTICITY OF SINGLE DNA MOLECULES BY USING MAGNETIC BEADS. SCIENCE, 1992. 258(5085): P. 1122-6.
39. BUSTAMANTE, C., ET AL., ENTROPIC ELASTICITY OF LAMBDA-PHAGE DNA. SCIENCE, 1994. 265(5178): P. 1599-600.
40. SIGGIA, J.F.M.E.D., STRETCHING DNA. MACROMOLECULES 1995. 28(26): P. 8759-8770.
41. COCCO, S., ET AL., OVERSTRETCHING AND FORCE-DRIVEN STRAND SEPARATION OF DOUBLE-HELIX DNA. PHYS REV E STAT NONLIN SOFT MATTER PHYS, 2004. 70(1 PT 1): P. 011910.
42. NEUMAN, K.C. AND A. NAGY, SINGLE-MOLECULE FORCE SPECTROSCOPY: OPTICAL TWEEZERS, MAGNETIC TWEEZERS AND ATOMIC FORCE MICROSCOPY. NAT METHODS, 2008. 5(6): P. 491-505.
43. JAMES E. KATH, J.F.M., JOHN S. GRAHAM, DEVELOPMENT OF A MAGNETIC TWEEZER APPARATUS FOR THE MANIPULATION OF SINGLE DNA MOLECULES. NANOSCAPE, 2008. 5(1): P. 117-123.
44. CHEN, H., ET AL., IMPROVED HIGH-FORCE MAGNETIC TWEEZERS FOR STRETCHING AND REFOLDING OF PROTEINS AND SHORT DNA. BIOPHYS J, 2011. 100(2): P. 517-23.
45. YAN, J., D. SKOKO, AND J.F. MARKO, NEAR-FIELD-MAGNETIC-TWEEZER MANIPULATION OF SINGLE DNA MOLECULES. PHYS REV E STAT NONLIN SOFT MATTER PHYS, 2004. 70(1 PT 1): P. 011905.
46. LIU, Y., ET AL., DNA CONDENSATES ORGANIZED BY THE CAPSID PROTEIN VP15 IN WHITE SPOT SYNDROME VIRUS. VIROLOGY, 2010. 408(2): P. 197-203.
47. HANSMA, D.R.P., ATOMIC FORCE MICROSCOPY PHYSICS TODAY, 1990. 43(10): P. 23-30.
48. KE, C., ET AL., DIRECT MEASUREMENTS OF BASE STACKING INTERACTIONS IN DNA BY SINGLE-MOLECULE ATOMIC-FORCE SPECTROSCOPY. PHYS REV LETT, 2007. 99(1): P. 018302.
49. CHEN, W.S., ET AL., DIRECT OBSERVATION OF MULTIPLE PATHWAYS OF SINGLE-STRANDED DNA STRETCHING. PHYS REV LETT, 2010. 105(21): P. 218104.
50. HANSMA, H.G. AND D.E. LANEY, DNA BINDING TO MICA CORRELATES WITH CATIONIC RADIUS: ASSAY BY ATOMIC FORCE MICROSCOPY. BIOPHYS J, 1996. 70(4): P. 1933-9.
51. WANG, H., ET AL., GLUTARALDEHYDE MODIFIED MICA: A NEW SURFACE FOR ATOMIC FORCE MICROSCOPY OF CHROMATIN. BIOPHYS J, 2002. 83(6): P. 3619-25.
52. FU, H., ET AL., ATOMIC FORCE MICROSCOPE IMAGING OF CHROMATIN ASSEMBLED IN XENOPUS LAEVIS EGG EXTRACT. CHROMOSOMA, 2011. 120(3): P. 245-54.
53. BAO, Q., N. CHRIST, AND P. DROGE, SINGLE-CHAIN INTEGRATION HOST FACTORS AS PROBES FOR HIGH-PRECISION NUCLEOPROTEIN COMPLEX FORMATION. GENE, 2004. 343(1): P. 99-106.

88
54. ALI, B.M., ET AL., COMPACTION OF SINGLE DNA MOLECULES INDUCED BY BINDING OF INTEGRATION HOST FACTOR (IHF). PROC NATL ACAD SCI U S A, 2001. 98(19): P. 10658-63.
55. LUSK, J.E., R.J.P. WILLIAMS, AND E.P. KENNEDY, MAGNESIUM AND GROWTH OF ESCHERICHIA COLI. JOURNAL OF BIOLOGICAL CHEMISTRY, 1968. 243(10): P. 2618-+.
56. PAYMASTER, N.J., MAGNESIUM-METABOLISM - BRIEF REVIEW. ANNALS OF THE ROYAL COLLEGE OF SURGEONS OF ENGLAND, 1976. 58(4): P. 309-314.
57. WALTHERS, D., ET AL., SALMONELLA ENTERICA RESPONSE REGULATOR SSRB RELIEVES H-NS SILENCING BY DISPLACING H-NS BOUND IN POLYMERIZATION MODE AND DIRECTLY ACTIVATES TRANSCRIPTION. JOURNAL OF BIOLOGICAL CHEMISTRY, 2011. 286(3): P. 1895-1902.
58. AZAM, T.A., S. HIRAGA, AND A. ISHIHAMA, TWO TYPES OF LOCALIZATION OF THE DNA-BINDING PROTEINS WITHIN THE ESCHERICHIA COLI NUCLEOID. GENES CELLS, 2000. 5(8): P. 613-26.