Single-Molecule FRET Studies of HIV TAR DNA Hairpin...
10
Single-Molecule FRET Studies of HIV TAR−DNA Hairpin Unfolding Dynamics Jixin Chen, † Nitesh K. Poddar, † Lawrence J. Tauzin, † David Cooper, † Anatoly B. Kolomeisky, † and Christy F. Landes* ,†,‡ † Department of Chemistry and ‡ Department of Electrical and Computer Engineering, Rice University, Houston, Texas 77251-1892, United States * S Supporting Information ABSTRACT: We directly measure the dynamics of the HIV trans-activation response (TAR)−DNA hairpin with multiple loops using single-molecule Fö rster resonance energy transfer (smFRET) methods. Multiple FRET states are identified that correspond to intermediate melting states of the hairpin. The stability of each intermediate state is calculated from the smFRET data. The results indicate that hairpin unfolding obeys a “fraying and peeling” mechanism, and evidence for the collapse of the ends of the hairpin during folding is observed. These results suggest a possible biological function for hairpin loops serving as additional fraying centers to increase unfolding rates in otherwise stable systems. The experimental and analytical approaches developed in this article provide useful tools for studying the mechanism of multistate DNA hairpin dynamics and of other general systems with multiple parallel pathways of chemical reactions. ■ INTRODUCTION The melting and annealing of DNA hairpins are essential in many biological processes such as replication, transcription, recombi- nation, gene expression, and DNA transposition for both prokaryotic and eukaryotic systems. 1,2 Furthermore, hairpins with multiple loops are known to play specific roles in viral replication. 3 An important example is the human immunodefi- ciency virus-1 (HIV-1) trans-activation response region (TAR) hairpin. 1,4 The TAR sequence is remarkably well conserved among HIV isolates, indicating a strong selection pressure to maintain its structure. 5 Thus, the TAR hairpin is of therapeutic interest. 6−9 The TAR−RNA hairpin and its complement, TAR− DNA hairpin, are involved in several crucial steps in the viral life cycle. 10−12 The TAR hairpin has four bulges, which have been found to be critical to the biological function of the TAR sequence because they determine the hairpin unfolding/folding dynamics. 5,13−15 As a general topic, understanding hairpin dynamics is further motivated by the advent of therapeutics with aptamers, which are small RNA and DNA molecules that often form single or multiloop hairpin conformations. 16,17 In order to understand the molecular-scale dynamics of DNA/ RNA hairpins, hairpins have been studied using technologies such as temperature-jump, 18,19 optical trap, 20 single-molecule fluorescence resonance energy transfer (smFRET), 21−26 and combinations of spectroscopic techniques. 2,27−31 However, these hairpin structures usually have one single loop connecting a stem region of several base pairs (Figure 1a). It is generally understood that the unfolding/folding rates of such simple DNA hairpins are dependent on the binding energy of the hairpin, the diffusion rate of the two ends of the stem followed by nucleation, and the propagation of base pairing. 30,32−35 This process yields folding times that range from milliseconds to microseconds, depending on the sequence length and base composition. 22,27 smFRET is particularly suited to this study due to its wide applications in studying the single-molecule dynamics of nucleic acids. 36−38 For DNA melting (unfolding), a “fraying and peeling mechanism” has been predicted, 39,40 and for annealing (folding) Received: July 15, 2014 Revised: September 23, 2014 Published: September 25, 2014 Figure 1. Schematic of proposed examples of unfolding/folding routes of (a, b) model DNA hairpins and (c) the TAR−DNA hairpin with two dyes Cy3 and Cy5 labeled to the ends. Urea molecules within the solution are shown, and the double helix is not shown for easier demonstration. Article pubs.acs.org/JPCB © 2014 American Chemical Society 12130 dx.doi.org/10.1021/jp507067p | J. Phys. Chem. B 2014, 118, 12130−12139
Transcript of Single-Molecule FRET Studies of HIV TAR DNA Hairpin...

Single-Molecule FRET Studies of HIV TAR−DNA Hairpin UnfoldingDynamicsJixin Chen,† Nitesh K. Poddar,† Lawrence J. Tauzin,† David Cooper,† Anatoly B. Kolomeisky,†
and Christy F. Landes*,†,‡
†Department of Chemistry and ‡Department of Electrical and Computer Engineering, Rice University, Houston, Texas 77251-1892,United States
*S Supporting Information
ABSTRACT: We directly measure the dynamics of the HIV trans-activationresponse (TAR)−DNA hairpin with multiple loops using single-molecule Forsterresonance energy transfer (smFRET) methods. Multiple FRET states areidentified that correspond to intermediate melting states of the hairpin. Thestability of each intermediate state is calculated from the smFRET data. The resultsindicate that hairpin unfolding obeys a “fraying and peeling” mechanism, andevidence for the collapse of the ends of the hairpin during folding is observed.These results suggest a possible biological function for hairpin loops serving asadditional fraying centers to increase unfolding rates in otherwise stable systems.The experimental and analytical approaches developed in this article provide usefultools for studying the mechanism of multistate DNA hairpin dynamics and ofother general systems with multiple parallel pathways of chemical reactions.
■ INTRODUCTIONThemelting and annealing of DNA hairpins are essential in manybiological processes such as replication, transcription, recombi-nation, gene expression, and DNA transposition for bothprokaryotic and eukaryotic systems.1,2 Furthermore, hairpinswith multiple loops are known to play specific roles in viralreplication.3 An important example is the human immunodefi-ciency virus-1 (HIV-1) trans-activation response region (TAR)hairpin.1,4 The TAR sequence is remarkably well conservedamong HIV isolates, indicating a strong selection pressure tomaintain its structure.5 Thus, the TAR hairpin is of therapeuticinterest.6−9 The TAR−RNA hairpin and its complement, TAR−DNA hairpin, are involved in several crucial steps in the viral lifecycle.10−12 The TAR hairpin has four bulges, which have beenfound to be critical to the biological function of the TARsequence because they determine the hairpin unfolding/foldingdynamics.5,13−15 As a general topic, understanding hairpindynamics is further motivated by the advent of therapeuticswith aptamers, which are small RNA and DNA molecules thatoften form single or multiloop hairpin conformations.16,17
In order to understand the molecular-scale dynamics of DNA/RNA hairpins, hairpins have been studied using technologiessuch as temperature-jump,18,19 optical trap,20 single-moleculefluorescence resonance energy transfer (smFRET),21−26 andcombinations of spectroscopic techniques.2,27−31 However,these hairpin structures usually have one single loop connectinga stem region of several base pairs (Figure 1a). It is generallyunderstood that the unfolding/folding rates of such simple DNAhairpins are dependent on the binding energy of the hairpin, thediffusion rate of the two ends of the stem followed by nucleation,and the propagation of base pairing.30,32−35 This process yields
folding times that range from milliseconds to microseconds,depending on the sequence length and base composition.22,27
smFRET is particularly suited to this study due to its wideapplications in studying the single-molecule dynamics of nucleicacids.36−38
For DNA melting (unfolding), a “fraying and peelingmechanism” has been predicted,39,40 and for annealing (folding)
Received: July 15, 2014Revised: September 23, 2014Published: September 25, 2014
Figure 1. Schematic of proposed examples of unfolding/folding routesof (a, b) model DNA hairpins and (c) the TAR−DNA hairpin with twodyes Cy3 and Cy5 labeled to the ends. Urea molecules within thesolution are shown, and the double helix is not shown for easierdemonstration.
Article
pubs.acs.org/JPCB
© 2014 American Chemical Society 12130 dx.doi.org/10.1021/jp507067p | J. Phys. Chem. B 2014, 118, 12130−12139

a “collapsing mechanism” has been proposed.41 Moleculardynamics simulations of the unfolding of short double-strandedDNA have suggested that DNA is opened via untwisting andthen peeling.39 This rapid “fraying” at the end of the helix hasbeen experimentally observed for simple model DNA mole-cules.42 This mechanism suggests that the unfolding of the DNAhelix starts from one end of the stem and progresses dynamicallyto the other end of the DNA, similar to unzipping a zipper(Figure 1a). During the folding process of DNA hairpins, end-to-end contact (collapse) has been observed using temperature-jump measurements.41 This mechanism suggests that theunfolded DNA stalks are extremely flexible and end to endclosing is common (Figure 1b).35 This flexibility is consistentwith the molecular dynamics simulations where multipleintermediate states and trap states have been observed.39 Itremains an open question as to whether the general conclusionsdiscussed above can be extended to describe the dynamics ofmore complex biologically relevant DNA hairpins that includeloops and bulges.We hypothesize that a possible biological function for a hairpin
loop/bulge is to serve as an additional fraying center to increaseunfolding rates in otherwise stable systems. This has beenexplained thermodynamically using a free energy penalty inhairpin pairing, and the effect of the bulges on folding/unfoldingdynamics of the hairpin has been predicted.43 However, it hasbeen difficult to experimentally measure the stability ofintermediate states for complicated structures because of thecoexistence of multiple states. In this article, we carried outsingle-molecule FRET experiments to study the complexdynamics of HIV TAR−DNA hairpin. In order to tune thelifetime of the TAR−DNA folding/unfolding dynamics to ourmeasuring time scale, we introduced two additives, urea andpoly(ethylene glycol) (PEG), to the buffer solution. After thesmFRET data were obtained, we performed a state analysisalgorithm and derived a statistical analysis model to calculate thestabilities of the intermediate states.
■ EXPERIMENTAL SECTIONSample Preparation. Purified and labeled single-stranded
DNA (ssDNA) TAR and a mutant with the bulges removed(Figure 2) were acquired from TriLink Biotechnologies. The
ssDNAs were modified with functional groups: biotin was usedfor surface immobilization; Cy3-amidite was directly coupled tothe 5′ end andCy5-succinimidyl ester was coupled to a C6 aminolinker at the 3′ end of the DNA; dT spacers were designed at theend of the sequences to reduce unwanted photophysical effects.The ssDNAs were immobilized on glass substrates using thebiotin−streptavidin interaction. Briefly, plasma cleaned glasscoverslips were functionalized with aminosilane (Vectabond,-Vector Laboratories). The slides were then grafted in a aqueoussolution of 25% (m/m, mass fraction) methoxypoly(ethyleneglycol) 5000 propionic acid N-succinimidyl ester (>80%, Sigma-Aldrich), 0.25% (m/m) SUNBRIGHT BI-050TS (Biotin-PEG-COO-MAL,Mw 5000, NOF Corporation, Japan), and 0.8% (m/m) NaHCO3 (Sigma-Aldrich). Custom HybriWell chambers(Grace Bio-Labs) which had a volume of ∼15 μL, secure sealspacers (Grace Bio-Labs), tube connectors (Grace Bio-Labs),and Teflon tubing (Western Analytical Products) were used toconstruct a flow chamber that was attached to each biotin-PEGylated slide.44 The biotin-PEGylated slide was incubatedwith 2 mg mL−1 streptavidin (Invitrogen) in 25 mM HEPES(Sigma-Aldrich) and 40mMNaCl (Sigma) buffer solution for 10min followed by DNA (200 pM) adsorption for 20 min. Beforethe DNAs were attached to the streptavidin-labeled substrates,the DNA samples were denatured at 80 °C in buffer solution for2.5 min and annealed at 60 °C for 2.5 min, and then 2mMMgCl2(Ambion) was added and the solution was reannealed at 0 °C for5 min to homogenize the samples.
FRET Measurements. Single-molecule images were ac-quired by a home-built sample scanning confocal microscopebased on a Zeiss Axiovert 200 microscope. Raster scanning of thesample coverslip was achieved by a closed-loop xyz piezo stage(P-517.3CL; Physik Instrumente) with 100× 100× 20 μm travelrange and a minimum resolution of ∼1 nm (SPM 1000; RHKTechnology). A 532 nm diode-pumped solid-state laser(Coherent, Compass 315M-100 SL) was used as the excitationsource. The light was expanded to overfill the back aperture of aFluar 100× 1.3 NA oil immersion microscope objective lens(Carl Zeiss, GmbH) which focused the laser light to a spot with afull width at half-maximum (fwhm) beam radius and height of∼125 nm and ∼1 μm, respectively. The intensity of the laser wascontrolled with a neutral density filter to be ∼4 μW before theobjective, yielding an estimated total power density at the sampleof ∼800 W cm−2. The fluorescence signal was collected andrefocused by the same objective and was separated from theexcitation light using a dichroic mirror (z532rdc; ChromaTechnology). Scattered laser light was removed by the use ofnotch and emission long-pass filters (NHPF-532.0, KaiserOptical; ET585 and ET685, Chroma Technology). Therefocused signal was then further separated by a beam splitter(Chroma 640 DCXR) into donor emission and acceptoremission fluorescence and then finally directed to two avalanchephotodiodes detectors (SPCM-AQR-15; PerkinElmer).The smFRET experiments were carried out at room
temperature (20 ± 1 °C). Into the flow cell, a buffer solutionwas flowed at 1 μL min−1 for the duration of the measurements.The HEPES buffer solution containing an oxygen-scavengingsystem to extend the lifetime of the fluorophores was used in allexperiments, and was prepared according to an establishedprotocol:45 3% (w/w) β-D-(+)-glucose (Sigma-Aldrich), 0.1 mgmL−1 of glucose oxidase (Sigma), 0.02 mg mL−1 of catalase(Sigma-Aldrich), 40 mM NaCl, 25 mM HEPES buffer, andsaturated Trolox solution (6-hydroxy-2,5,7,8-tetramethylchro-man-2-carboxylic acid; Sigma-Aldrich). In addition, cosolute 2
Figure 2. Structures of the DNA hairpins used in the smFRET studies.Predicted secondary structure of the (a) TAR−DNA with four bulgesand a loop and (b) TAR−DNA mutant with the bulges removed. Cy3and Cy5 were used as the donor and acceptor dye molecules which werecoupled to the 5′-dT and 3′-dT of the DNA, respectively. The DNAswere attached to the surface via a biotin linker attached to a -dT in thehairpin loop region.
The Journal of Physical Chemistry B Article
dx.doi.org/10.1021/jp507067p | J. Phys. Chem. B 2014, 118, 12130−1213912131

mM MgCl2, urea (Sigma-Aldrich) and/or PEG-6000 (Sigma-Aldrich) were added to the solution from stock solutions of 10Murea and 60% PEG respectively when needed.SmFRET Analysis. All analysis programs were written in
MATLAB (R2009b) except for the hidden-Markov models(HMMs) analysis methods for FRET efficiency trajectories,which were provided by the HaMMy GUI (http://bio.physics.uiuc.edu/HaMMy.html, accessed 09/2013)46 and vbFRET(http://vbfret.sourceforge.net, accessed 09/2013).47 The emis-sion intensity trajectories were collected at 1 ms resolution andlater binned to 10 ms time steps to improve signal-to-noise ratio.The corrected fluorescence signal trajectories were used directlyto calculate the FRET efficiency (EFRET), as the fraction of thefluorescence signal of the acceptor dye over the total signal ofacceptor dye and the donor dye:17,48,49
= +E I I I/( )FRET acceptor acceptor donor (1)
where Iacceptor and Idonor correspond respectively to Cy5 and Cy3fluorescence intensity with background and crosstalk correctionand blinking removed.17,48,49 The fitting processes andalgorithms can be found in the original literature.46−52 Briefly,trajectories of all the molecules are combined into a single datafile without further modification, and then the file is fed to thetwo software packages for fitting. During the fitting, the numberof states is varied and the other fitting parameters are kept at thesoftware defaults.Simulation of Wormlike Chain (WLC) Model. The
average FRET efficiency, ⟨E⟩, within any long-enough bin timeis calculated with WLC:53,54
∫⟨ ⟩ =+ ( )
E p r r( )1
1d
rLR
0
1
6
0 (2)
where r is a unitless value representing the end-to-end distance Rover the maximum possible distance L of the ends-labeledpolymer; R0 is the constant Forster radius; and p(r) is theprobability factor:
π=−
−−
⎛⎝⎜
⎞⎠⎟p r t
Arr
tr
( , )4
(1 )exp
34(1 )
2
2 9/2 2(3)
where A is a normalization constant:
π=
+ +( )A t
t t( )
4(3 /4) exp(3 /4)
4t t
3/2
3/2 123 / 4
15(3 / 4)2 (4)
and t is related to another constant called persistence length Lp, abasic mechanical property quantifying the stiffness of a polymer: t= L/Lp.The established WLC model can be applied to our smFRET
data of TAR−DNA. Themaximum possible length of the ssDNAL = 0.63N nm, where N is the number of unpaired nucleotides(nt) between the two ends with 0.63 nm/nt length.53 TheForster radius R0 for Cy3−Cy5 dye has been measured to be ∼6nmwhen attached to DNA.53,55 The persistence length of TAR−DNA in urea is estimated from comparing the histogram ofsmFRET data and simulated FRET values.The smFRET values are simulated with Metropolis Monte
Carlo simulations of the time trajectory of the end-to-enddistance R.53,56 In every time step (10 ps), R is allowed torandomly walk between 0 and L with a Gaussian distributeddistance step centered at 0.55 nm and a standard deviation 0.2
nm according to the above probability function (representing a1D diffusion coefficient of ∼1.5 × 10⁻⁴ cm2 s−1 = (0.55 nm)2/2/0.01 ns).53 At each step, the donor will be excited at a probabilityof 1/5 ns−1, ∼5 times slower than its fluorescence decay rate. Ifthe donor is excited, then it has a decay lifetime of τD ∼ 1 ns intodonor fluorescence or (R/R0)
6τD into a nonexcited acceptormolecule. If the acceptor is excited, it has a fluorescence decaylifetime 1.3 ns as measured (1.3 ± 0.1 ns, see SupportingInformation). The total simulation time for each number ofnucleotide is 1 ms. The FRET efficiency is the fraction of thenumber of steps of acceptor emission over sum of the steps ofacceptor emission and donor emission.
■ RESULTS AND DISCUSSION
Photophysics of the Dye Molecules. Blinking andbleaching of the dyes, as well as the dye−DNA interaction,were confirmed to have little influence on our smFRETmeasurements of the hairpin dynamics. We labeled the twoends of the DNA hairpin with Cy3 and Cy5 and immobilized thehairpin on PEGylated glass slides via biotin−streptavidininteraction, as shown in Figure 2. One potential issue withsmFRET experiments is that the photophysical stability of thedyes can change depending on the solution as well as the dye−DNA interaction. These conditions can affect the quantum yieldsof the dyes and thus affect the FRET efficiency between thedonor dye and the acceptor dye.57 When covalently attached toDNA, cyanine dyes are well-known to bend and attach to DNAbasepairs with hydrophobic interactions, varying the dyes’quantum yields via conformational confinement and chargetransfer.58 The average quantum yields of the dyes are dependenton the DNA sequences they are attached to;57,59,60 however, thevariation of single-dye quantum yield is not observed during oursmFRET measurement, probably because the above-mentioneddynamics are too fast to be observed on the time scale ofmilliseconds to seconds common for single-molecule measure-ments. As each of our smFRET data points is calculated from thetotal photon counts of the two dyes during 10 ms, the variationsat shorter time scale are time-averaged. Stable photon countswith shot noise were observed for the smFRET time trajectory ofthe bulge-removed mutant DNA hairpin in HEPES buffersolution (Figure 3a), for which no unfolding dynamics areexpected at room temperature and a stable FRET value is
Figure 3. Representative photon trajectories show stable photon countsof Cy3 and Cy5 attached to the ends of mutant DNA hairpin in (a)HEPES buffer with 2 mMMg2+, (b) HEPES buffer with 2 mMMg2+ and24% PEG, (c) HEPES buffer with 2 mM Mg2+ and 6 M urea, and (d)HEPES buffer with 6 M urea (full trajectory shown in the SupportingInformation). These are raw data for typical molecules binned at 10 mswith bleaching of either dye shown as the transition point of the signals.The FRET histograms of over 50 molecules/each are shown in Figure4a−d, respectively.
The Journal of Physical Chemistry B Article
dx.doi.org/10.1021/jp507067p | J. Phys. Chem. B 2014, 118, 12130−1213912132

expected. This stability of photon counts (representing thequantum yield) confirms that any dye−DNA interactions are (1)minimal and (2) faster than the dynamics measured in ourexperiments. The single-step bleaching profile confirms that weare measuring single-molecule events. The stability of the dyesare also observed in the presence of different cosolutes (Figure3b−d), which is consistent with the unchanged lifetimes of thedyes under the different solutions (see Supporting Informationfor time-resolved fluorescence data). This stability of smFRET atthe millisecond time scale is consistent with other smFRETstudies of DNA hairpins labeled with the same two dyes.53,61,62
Tuning the Folding/Unfolding Lifetime. Two challengesarise when measuring the dynamics of the TAR−DNA hairpins:the equilibrium lies strongly toward the folded state of thehairpin, and some of the kinetic processes are too fast to beobserved by our millisecond time resolution. On the basis of thedynamics established from model hairpins,22,27 we calculate thatthe folded-state and unfolded-state lifetimes of the states ofTAR−DNA hairpin are at ∼1 ms and ∼10 μs, respectively (seeSupporting Information). These values indicate that, atequilibrium, the TAR−DNA hairpin effectively remains foldedat room temperature, with brief explorations of the unfoldedstate that are too fast to be resolved with typical smFRETexperiments carried out at the 1−100 ms time scale. Therefore,our ability to characterize even two-state folding kinetics of thehairpin is limited by the fast folding rate (or unstable unfoldedstate). In the retroviral replication process, the unfolding/foldingdynamics are altered by the nucleocapsid (NC) protein,63,64
which destabilizes the two break points near the open end of theTAR hairpin and allows for the characterization of the protein-induced hairpin unfolding/folding dynamics of the outermostbulge by smFRET, which has a minimum time resolution at ∼1ms level.45,62,64−66 In order to understand the mechanism ofmultiloop hairpin unfolding/folding dynamics, alternativemethods were pursued to shift the equilibrium toward theunfolded states and to slow down the dynamics to ourexperimental time resolution.To this effect, we introduced two additives, poly(ethylene
glycol) (PEG) and urea, to the buffer solution. It is well-knownthat crowding agents such as PEG, sucrose, and glycerol increasethe viscosity of aqueous solutions,67−69 and studies have shownthat PEG solutes can destabilize DNA at small weight values of
PEG70,71 but do not significantly affect the stability of DNA if thePEG is larger than 1 kDa.72,73 Thus, PEG-6000 is used in thisstudy. Urea, a commonly used destabilizer of DNA and proteins,was used to induce helix unfolding and to shift the hairpin foldingequilibrium away from the folded state at room temper-ature.21,24,74 Although a general consensus on the biologicalrelevance of urea as a denaturant has not been reached, there hasbeen recent evidence in support of urea to perturb conforma-tional changes of nucleic acids and proteins.74 This conclusion isconsistent with the successful application of urea in studyinghuman telomerase RNA pseudoknot folding/unfolding dynam-ics using smFRET.24
The smFRET efficiency distribution of the TAR-DNA hairpinis broadened when PEG-6000 is added to the buffer solution(Figure 4f), as the standard deviation increases to 0.12 FRETefficiency compared to 0.02 in HEPES buffer. Under the sameconditions, the standard deviation of the bulge-removed mutantonly slightly increases to 0.04 (Figure 4b). We confirmed thatPEG-6000 has negligible effects on the time-averaged secondarystructure of DNA and the dye’s photophysical response usingcircular dichroism (CD) and fluorescence anisotropy decaymeasurements for both the standard TAR−DNA and the mutantconstruct in the presence and absence of PEG (see SupportingInformation). Therefore, we consider PEG-6000 a suitablecrowding agent to slow down the dynamics of the TAR−DNAand mutant constructs and that the broadening of the smFRETdistributions depicted in Figure 4 can be attributed primarily toconformational broadening.Further analysis of the distribution of the FRET efficiencies of
the two DNA hairpins in PEG solution suggests that theunfolding of the hairpins by thermoagitation, known as“fraying”,42 stops after each loop, as long as there are sufficientbase pairs between loops to provide a barrier to further unfolding.We compared the distribution of the FRET efficiencies (Figure4) with previous reported distributions of end-labeled TAR−DNA.45,62,64 The FRET efficiency distribution of TAR−DNA isconsistent with the hairpin unfolding to the second bulge fromthe opening (Figure 2, bulge 2). This is expected because onlytwo base pairs connect bulges 1 and 2 in TAR−DNA, making itthe weakest of the bulge connecting sections. This behavior hasalso been observed previously in the presence of NCproteins.45,62,64
Figure 4.Global ensemble histogram of the mutant and TAR−DNA in (a, e) HEPES buffer with 2 mMMg2+; (b, f) HEPES buffer with 2 mMMg2+ and24% PEG; (c, g) HEPES buffer with 2 mMMg2+ and 6M urea; (d, h) HEPES buffer with 6M urea. The total counts of the histograms are normalized tounity. Insets show the mean FRET efficiency, μ, (error is the standard deviation of three independent measurements) representing the averageconformational structure of the DNA; the standard deviation, σ, of the histogram that represents the variation of the FRET distribution and thus therange of conformations; and the number of single molecules measured for each sample, #.
The Journal of Physical Chemistry B Article
dx.doi.org/10.1021/jp507067p | J. Phys. Chem. B 2014, 118, 12130−1213912133

By analyzing the dwell times for transitions between the twoobserved smFRET states of TAR−DNA with 24% PEG, asidentified by HaMMy, we can confirm that the addition of PEGslows down the unfolding/folding dynamics of the TAR−DNAhairpin. The unfolded-state and folded-state lifetimes of theTAR−DNA hairpin are 142 and 353 ms, respectively(Supporting Information Figure S6), and are slower by 3 ordersand 1 order of magnitude, respectively, when in the presence ofPEG, shifting them well within the resolvable time frame ofsmFRET observations. Slowing down the fraying dynamics,however, does not allow us access to all of the possible openhairpin states. Thus further perturbation is required toaccomplish this goal.By tuning the concentration of a denaturant, urea, we can shift
the TAR−DNA hairpin equilibrium to more opened states toobserve each of the distinct loop unfolding/folding transitions.The ensemble smFRET histograms for each condition areincluded in Figure 5, and short pieces of smFRET trajectories foreach condition are shown in Figure 6. The trajectories in Figure 6shift to more open states as the urea concentration is increased,referred to as S1, S2, S3, S4, and S5. Because fluorescencemeasurements have suggested that the photophysical propertiesof the dyes are not changed by the presence of urea (seeSupporting Information), the primary explanation for thebroadening of the FRET distribution of the FRET efficienciesin Figure 5 is urea-induced hairpin unfolding. Single-moleculetime trajectories (Figure 6) suggest that the broadening is due totransitions among newly observable FRET states. In the presenceof 1 and 2 M urea, the FRET efficiency distributions of the DNAhairpin (Figure 5a,b) are almost the same as the distributions ofthose with no urea (Figure 4), and thus only one state is observedin the time trajectories (Figure 6f). When the urea concentrationincreases to around 3 M, the FRET efficiency distribution(Figure 5c) becomes more broad and tails toward a FRETefficiency value of 0.8, in the direction of the state between 0.6and 0.8 observed in the single-molecule FRET time trajectories(Figure 6g). More states are observed at successively higher ureaconcentrations (Figures 5d,e and 6h,i), until, in the presence of 6
M urea (Figures 5f and 6j), all states become observable,including those with FRET efficiencies at ∼0.4 and ∼0.2.Qualitatively, the smFRET data change the ensemble steady-state view of urea denaturation of DNA to a more dynamicpicture. The ability of urea to control the equilibrium of theTAR−DNA hairpins is more obvious in the average values of theensemble FRET efficiency (Figure 6k). Just like the results onewould get from ensemble measurements, urea reduces theaverage FRET values. At the single-molecule level, however, thelarger the urea concentration, the longer the dwell times of moreopened states (Figure 6l).According to Figures 4−6, as well as previous studies on
smFRET of TAR−DNA,45,64 we assigned the FRET efficiency1.0−0.9 to state S1 of TAR−DNA; ∼0.8 to state S2;∼0.6 to stateS3;∼0.4 to state S4; and 0.3−0.0 to the completely unfolded stateS5, all associated with opening through the sequential bulgeregions. The assignment is consistent with our hypothesis that ahairpin with four bulges and a loop should yield five resolvablestates (Figure 7).Because the states are defined by the bulges that are connected
with the breaking points (Bpn) (Figure 7a), quantitatively, theequilibrium constant of each breaking point can be calculatedfrom the probabilities of the states (Figure 7b). According to theergodic principle, the probability of each state measured at thesingle-molecule level represents its concentration in ensembleexperiments. State S1 represents the eight microstates that haveBp1 closed but can have Bp2−4 either opened or closed (Figure7c); state S2 contains four microstates; state S3 has twomicrostates; and states S4 and S5 have only the one microstate.As such, a statistical approach is proposed to obtain theequilibrium constants Kclosed,n from the probabilities of the fiveFRET states:
← →⎯⎯⎯−
opened state closed stateF
K
F1 n
n
n
closed,
(5)
The equilibrium constant is defined by closed probability Fn:Kclosed,n = Fn/(1 − Fn), and the free energy can be calculated via
Figure 5. Insets indicate the different concentrations of urea, the mean FRET efficiency (μ), the standard deviation (σ) of the FRET efficiency, and thenumber of molecules measured (#).
The Journal of Physical Chemistry B Article
dx.doi.org/10.1021/jp507067p | J. Phys. Chem. B 2014, 118, 12130−1213912134
ΔGn = −RT ln Kclosed,n, where R is gas constant and T istemperature. The measured probability of each state can beexpressed as a function of Fn, and the following expressions canbe written:
=P F1 1 (6)
= −P F F(1 )2 1 2 (7)
= − −P F F F(1 )(1 )3 1 2 3 (8)
= − − −P F F F F(1 )(1 )(1 )4 1 2 3 4 (9)
= − − − −P F F F F(1 )(1 )(1 )(1 )5 1 2 3 4 (10)
Therefore, Fn can be calculated from the measured stateprobabilities Pn, and ΔGn can be calculated from Fn.In order to obtain the probabilities of the states Pn under 6 M
urea when all the states are observed, the hidden Markov model(HMM)26,46,50−52,75 and the wormlike chain (WLC) model53
were used to analyze and refine the FRET states of TAR−DNAin the next two sections. The rate constants of the transitions
among different FRET states are extractable from the timetrajectories, but the process is complicated by measurementnoise, state-blur induced by fast transitions within each binnedtime, variation amongmolecules, the breakdown of ergodicity forindividual molecules, and the complexity of the transitionsamong the five states. Many methods have been developed toanalyze or assist in the analysis of these kinds of complicated timetrajectories including the widely used HMM,46,48,50−52,75−79
which has recently been successfully used to analyze verycomplicated hairpin smFRET data.26
Using HHM To Obtain the Probabilities of the FiveStates. First we use HMM to fit the trajectories for FRET statesand extract the dwell-time distributions of the different statesusing two HMM packages HaMMy and vbFRET.46−52 Bothpackages are well-established programs that use the HMMprinciple but implement it differently, with HaMMy usingmaximum likelihood (ML) and vbFRET using maximumevidence (ME) as a measurement of the goodness of fit. TheML and ME scores increase with the number of states and doesnot reach the maximum even at 10 states (Figure 8a). This is
Figure 6. Proposed structures and smFRET trajectories with their FRET efficiencies showing five different states of TAR−DNA in its folded form S1 (a,f), 0−2 M urea (scheme showing as an example structure of the state); S2 (b, g), 3 M urea; S3 (c, h), 4 M urea; S4 (d, i), 5 M urea; and unfolded hairpinform S5 (e, j), 6 M urea in the absence of Mg2+ (full trajectories shown in the Supporting Information). (k) The mean FRET efficiency as a function ofurea concentration represents the denaturing (unfolding) of the DNA. Error bars are standard deviation of three measurements, >20 molecules for eachurea concentration at different days for three different samples. Relatively small error bars indicate that the number of molecules is large enough torepresent ensemble average. (l) Number of states observed under our specific experimental conditions.
The Journal of Physical Chemistry B Article
dx.doi.org/10.1021/jp507067p | J. Phys. Chem. B 2014, 118, 12130−1213912135
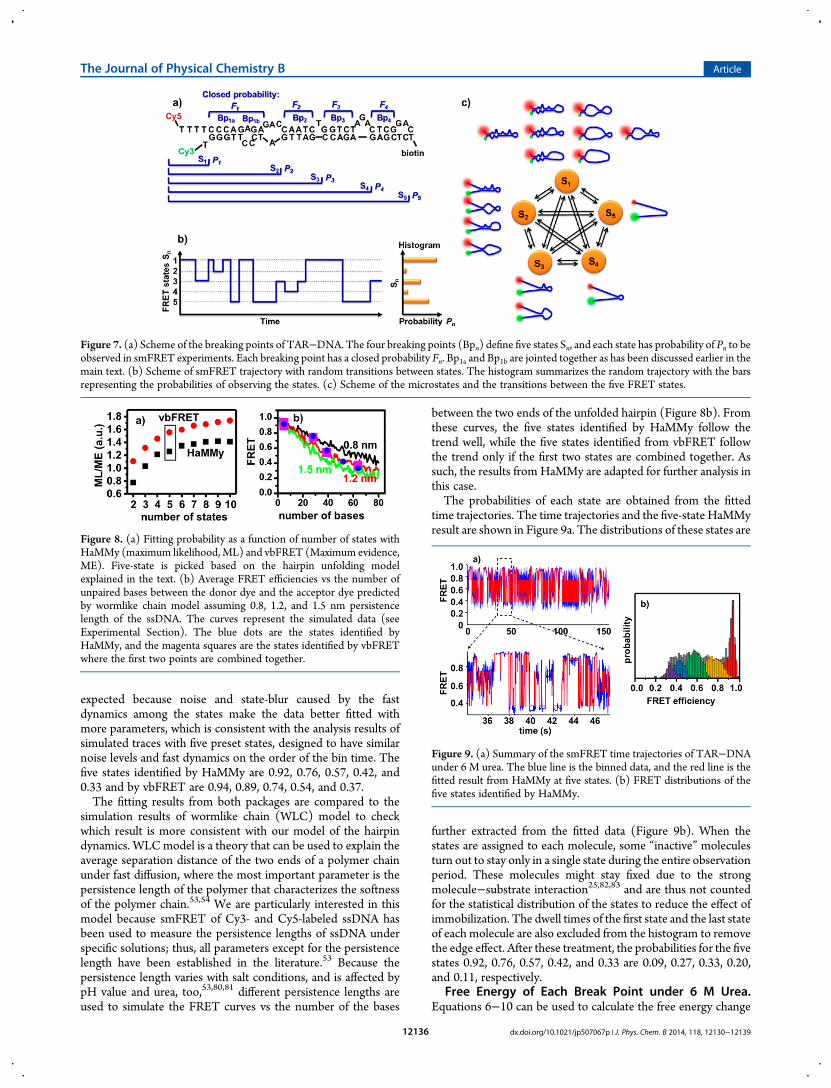
expected because noise and state-blur caused by the fastdynamics among the states make the data better fitted withmore parameters, which is consistent with the analysis results ofsimulated traces with five preset states, designed to have similarnoise levels and fast dynamics on the order of the bin time. Thefive states identified by HaMMy are 0.92, 0.76, 0.57, 0.42, and0.33 and by vbFRET are 0.94, 0.89, 0.74, 0.54, and 0.37.The fitting results from both packages are compared to the
simulation results of wormlike chain (WLC) model to checkwhich result is more consistent with our model of the hairpindynamics. WLCmodel is a theory that can be used to explain theaverage separation distance of the two ends of a polymer chainunder fast diffusion, where the most important parameter is thepersistence length of the polymer that characterizes the softnessof the polymer chain.53,54 We are particularly interested in thismodel because smFRET of Cy3- and Cy5-labeled ssDNA hasbeen used to measure the persistence lengths of ssDNA underspecific solutions; thus, all parameters except for the persistencelength have been established in the literature.53 Because thepersistence length varies with salt conditions, and is affected bypH value and urea, too,53,80,81 different persistence lengths areused to simulate the FRET curves vs the number of the bases
between the two ends of the unfolded hairpin (Figure 8b). Fromthese curves, the five states identified by HaMMy follow thetrend well, while the five states identified from vbFRET followthe trend only if the first two states are combined together. Assuch, the results from HaMMy are adapted for further analysis inthis case.The probabilities of each state are obtained from the fitted
time trajectories. The time trajectories and the five-state HaMMyresult are shown in Figure 9a. The distributions of these states are
further extracted from the fitted data (Figure 9b). When thestates are assigned to each molecule, some “inactive” moleculesturn out to stay only in a single state during the entire observationperiod. These molecules might stay fixed due to the strongmolecule−substrate interaction25,82,83 and are thus not countedfor the statistical distribution of the states to reduce the effect ofimmobilization. The dwell times of the first state and the last stateof each molecule are also excluded from the histogram to removethe edge effect. After these treatment, the probabilities for the fivestates 0.92, 0.76, 0.57, 0.42, and 0.33 are 0.09, 0.27, 0.33, 0.20,and 0.11, respectively.
Free Energy of Each Break Point under 6 M Urea.Equations 6−10 can be used to calculate the free energy change
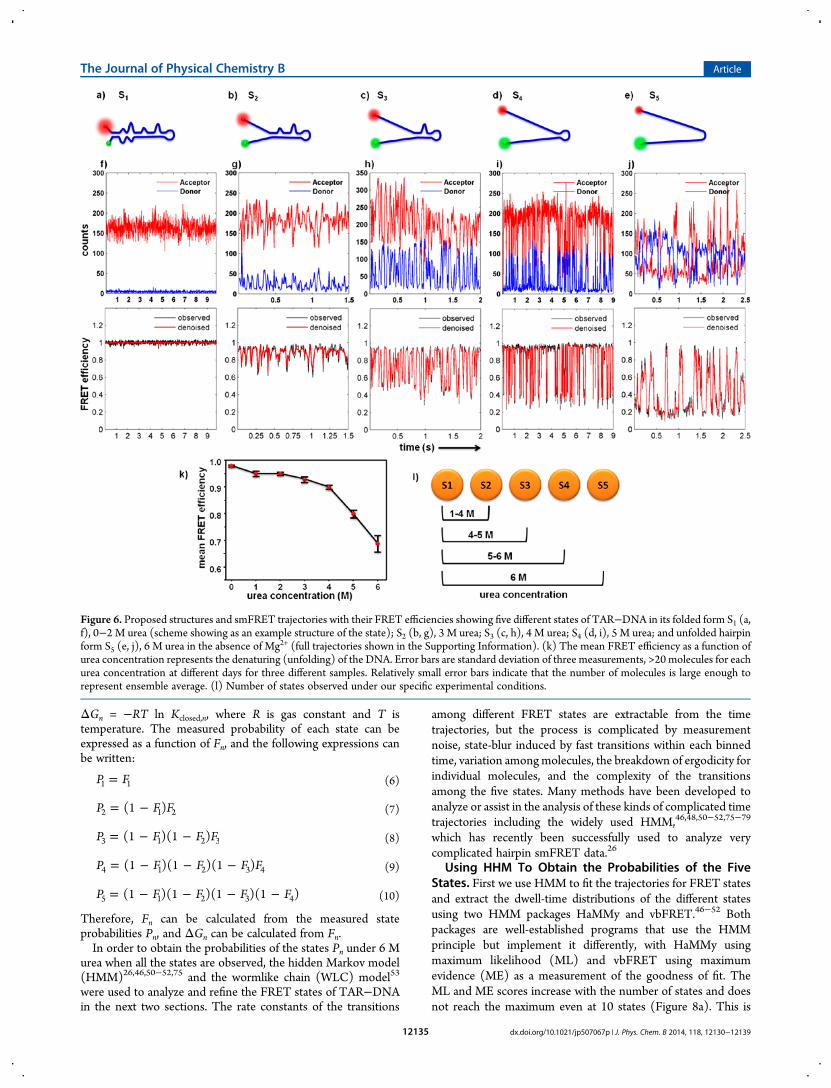
Figure 7. (a) Scheme of the breaking points of TAR−DNA. The four breaking points (Bpn) define five states Sn, and each state has probability of Pn to beobserved in smFRET experiments. Each breaking point has a closed probability Fn. Bp1a and Bp1b are jointed together as has been discussed earlier in themain text. (b) Scheme of smFRET trajectory with random transitions between states. The histogram summarizes the random trajectory with the barsrepresenting the probabilities of observing the states. (c) Scheme of the microstates and the transitions between the five FRET states.
Figure 8. (a) Fitting probability as a function of number of states withHaMMy (maximum likelihood,ML) and vbFRET (Maximum evidence,ME). Five-state is picked based on the hairpin unfolding modelexplained in the text. (b) Average FRET efficiencies vs the number ofunpaired bases between the donor dye and the acceptor dye predictedby wormlike chain model assuming 0.8, 1.2, and 1.5 nm persistencelength of the ssDNA. The curves represent the simulated data (seeExperimental Section). The blue dots are the states identified byHaMMy, and the magenta squares are the states identified by vbFRETwhere the first two points are combined together.
Figure 9. (a) Summary of the smFRET time trajectories of TAR−DNAunder 6 M urea. The blue line is the binned data, and the red line is thefitted result from HaMMy at five states. (b) FRET distributions of thefive states identified by HaMMy.
The Journal of Physical Chemistry B Article
dx.doi.org/10.1021/jp507067p | J. Phys. Chem. B 2014, 118, 12130−1213912136

of each Bpn that is independent of other breaking points and themicrostates, although the overall free energy of all the Bpn shouldbe 0. Our calculations produce the probability of the TAR−DNAhairpin staying folded F1 = 0.09, F2 = 0.30, F3 = 0.52, and F4 =0.65. The equilibrium constant Kclosed,n = Fn/(1 − Fn) yieldsKclosed,1 = 0.10, Kclosed,2 = 0.42, Kclosed,3 = 1.1, and Kclosed,4 = 1.8 forthe four Bpn. As such, the free energies, ΔGn = −RT ln(Kclosed,n),for the base pairs in the presence of 6 M urea are 5.6, 2.1, −0.15,and−1.5 kJ mol−1 for the four breaking points at 20 °C with 6 Murea. The order of the free energies is not consistent with theorder of the hybridization energy (Supporting InformationFigure S2) or the number of hydrogen bonds 14, 10, 13, and 11for Bp1 to Bp4, respectively, but rather suggests that in addition tothe hydrogen binding strength (enthalpy control), the closer abase pair is to the anchoring point at the end loop, the easier it isfor it to remain hydrogen bonded (entropy control).
■ CONCLUSIONIn summary, our experimental observations are consistent withthe hypothesis that the bulges are the fraying centers of hairpinfolding/unfolding. In addition, we developed an approach toextract the equilibrium constants of the folding/unfolding ofeach breaking point to estimate its relative stability. Exper-imentally, we have successfully demonstrated the method to slowdown the dynamics and to open more conformational states forthe zipped hairpin by using PEG and urea as cosolutes. Thequantitative data analysis is consistent with our model; however,our data analysis is based on the assumptions and models, whichwill certainly affect the results if they are further optimized. Inaddition, because the noise and the fast transitions blur ourbinned data, the existing methods have difficulties to fit the stateswithout specifying the number of states. Thus, we are developingnew methods hopefully to analyze the data more objectively oreven in a model-free fashion. The results of this study support a“fraying and peeling”mechanism for the unfolding and “collapse”mechanism for the folding of DNA hairpins. Our quantitativeanalysis of the free energy of each breaking point suggests thatthe stability of the paired region is a function of both the pairingsequence and its distances to the anchoring/loop positions. Themethod developed in this paper will be very useful to study themechanism for the inhibition of the HIV’s TAR−DNAtranscription with short DNA oligomers or RNA aptamer andfor studying other systems, such as TAR−RNA hairpin, withmultiple interconverting states that might be otherwiseunresolvable.
■ ASSOCIATED CONTENT*S Supporting InformationAdditional experimental methods, labeling strategy, theoreticalcalculation of folding/unfolding lifetimes for the DNA hairpinloops, photophysics of Cy3 and Cy5, full time trajectories, andTAR−DNA dynamics under PEG. This material is available freeof charge via the Internet at http://pubs.acs.org.
■ AUTHOR INFORMATIONCorresponding Author*Phone +1-713-348-4232; e-mail [email protected] (C.F.L.).Present AddressesJ.C.: Department of Chemistry and Biochemistry, OhioUniversity, Athens, OH 45701.N.K.P.: Department of Biotechnology, IIET, Invertis University,Bareilly 243123, India.
Author ContributionsJ.C. and N.K.P. contributed equally.
NotesThe authors declare no competing financial interest.
■ ACKNOWLEDGMENTS
C.F.L. thanks the support fromWelch Foundation (C-1787), theNational Science Foundation (CBET-1133965 and CHE-1151647), and the National Institutes of Health (GM94246-01A1). We thank Prof. Stephan Link, Dr. Wei-Shun Chang, andthe whole Link research group for helpful discussions. We alsothank PicoQuant, Germany, for the kind loan of their FluoTime300 instrument.
■ REFERENCES(1) Watts, J. M.; Dang, K. K.; Gorelick, R. J.; Leonard, C. W.; Bess, J.W., Jr.; Swanstrom, R.; Burch, C. L.; Weeks, K. M. Architecture andSecondary Structure of an Entire HIV-1 RNA Genome. Nature 2009,460, 711−716.(2) Kennedy, A. K.; Guhathakurta, A.; Kleckner, N.; Haniford, D. B.Tn10 Transposition via a DNA Hairpin Intermediate. Cell 1998, 95,125−134.(3) Enemark, E. J.; Joshua-Tor, L. Mechanism of DNA Translocationin a Replicative Hexameric Helicase. Nature 2006, 442, 270−275.(4) Feng, S.; Holland, E. C. HIV-1 tat Trans-activation Requires theLoop Sequence within tar. Nature 1988, 334, 165−167.(5) Rounseville, M.; Kumar, A. Binding of a Host Cell Nuclear Proteinto the Stem Region of Human Immunodeficiency Virus Type 1 Trans-Activation-Responsive RNA. J. Virol. 1992, 66, 1688−1694.(6) Upert, G.; Di Giorgio, A.; Upadhyay, A.; Manvar, D.; Pandey, N.;Pandey, V. N.; Patino, N. Inhibition of HIV Replication by Cyclic andHairpin PNAs Targeting the HIV-1 TAR RNA Loop. J. Nucleic Acids2012, 2012, 1−8.(7) LaFemina, R. L. Antiviral Research: Strategies in Antiviral DrugDiscovery; ASM Press: Washington, DC, 2009.(8) Landes, C. F.; Zeng, Y.; Liu, H.-W.; Musier-Forsyth, K.; Barbara, P.F. Single-Molecule Study of the Inhibition of HIV-1 TransactivationResponse Region DNA/DNA Annealing by Argininamide. J. Am. Chem.Soc. 2007, 129, 10181−10188.(9) Lee, Y.; Hyun, S.; Kim, H. J.; Yu, J. Amphiphilic Helical PeptidesContaining Two Acridine Moieties Display Picomolar Affinity towardHIV-1 RRE and TAR.Angew. Chem. 2007, 120, 140−143;Angew. Chem.,Int. Ed. 2007, 47, 134−137.(10) Das, A. T.; Klaver, B.; Berkhout, B. The 5′ and 3′ TAR Elementsof Human Immunodeficiency Virus Exert Effects at Several Points in theVirus Life Cycle. J. Virol. 1998, 72, 9217−9223.(11) Berkhout, B.; Vastenhouw, N. L.; Klasens, B. I.; Huthoff, H.Structural Features in the HIV-1 Repeat Region Facilitate StrandTransfer During Reverse Transcription. RNA 2001, 7, 1097−1114.(12) Vo, M. N.; Barany, G.; Rouzina, I.; Musier-Forsyth, K. HIV-1Nucleocapsid Protein Switches the Pathway of TransactivationResponse Element RNA/DNA Annealing from Loop-loop “Kissing”to “Zipper”. J. Mol. Biol. 2009, 386, 789−801.(13) Roy, S.; Delling, U.; Chen, C.; Rosen, C.; Sonenberg, N. A BulgeStructure in HIV-1 TAR RNA is Required for Tat Binding and Tat-Mediated Trans-activation. Genes Dev. 1990, 4, 1365−1373.(14) Harrich, D.; Mavankal, G.; Mette-Snider, A.; Gaynor, R. B.Human Immunodeficiency Virus Type 1 TAR Element RevertantViruses Define RNA Structures Required for Efficient Viral GeneExpression and Replication. J. Virol. 1995, 69, 4906−4913.(15) Lanciault, C.; Champoux, J. J. Effects of Unpaired Nucleotideswithin HIV-1 Genomic Secondary Structures on Pausing and StrandTransfer. J. Biol. Chem. 2005, 280, 2413−2423.(16) Lu, C.-H.; Yang, H.-H.; Zhu, C.-L.; Chen, X.; Chen, G.-N. AGraphene Platform for Sensing Biomolecules. Angew. Chem. 2009, 121,4879−4881; Angew. Chem., Int. Ed. 2009, 48, 4785−4787.
The Journal of Physical Chemistry B Article
dx.doi.org/10.1021/jp507067p | J. Phys. Chem. B 2014, 118, 12130−1213912137

(17) Taylor, N. J.; Darugar, Q.; Kourentzi, K.; Willson, R. C.; Landes,C. F. Dynamics of an Anti-VEGF DNA Aptamer: a Single-MoleculeStudy. Biochem. Biophys. Res. Commun. 2008, 373, 213−218.(18) Ansari, A.; Kuznetsov, S. V.; Shen, Y. Configurational Diffusiondown a Folding Funnel Describes the Dynamics of DNAHairpins. Proc.Natl. Acad. Sci. U. S. A. 2001, 98, 7771−7776.(19) Kuznetsov, S. V.; Ren, C. C.; Woodson, S. A.; Ansari, A. LoopDependence of the Stability and Dynamics of Nucleic Acid Hairpins.Nucleic Acids Res. 2008, 36, 1098−1112.(20) Woodside, M. T.; Behnke-Parks, W. M.; Larizadeh, K.; Travers,K.; Herschlag, D.; Block, S. M. Nanomechanical Measurements of theSequence-Dependent Folding Landscapes of Single Nucleic AcidHairpins. Proc. Natl. Acad. Sci. U. S. A. 2006, 103, 6190−6195.(21) Deniz, A. A.; Dahan, M.; Grunwell, J. R.; Ha, T.; Faulhaber, A. E.;Chemla, D. S.; Weiss, S.; Schultz, P. G. Single-Pair FluorescenceResonance Energy Transfer on Freely DiffusingMolecules: Observationof Forster distance Dependence and Subpopulations. Proc. Natl. Acad.Sci. U. S. A. 1999, 96, 3670−3675.(22) Grunwell, J. R.; Glass, J. L.; Lacoste, T. D.; Deniz, A. A.; Chemla,D. S.; Schultz, P. G. Monitoring the Conformational Fluctuations ofDNA Hairpins using Single-pair Fluorescence Resonance EnergyTransfer. J. Am. Chem. Soc. 2001, 123, 4295−4303.(23) Kim, J.; Doose, S.; Neuweiler, H.; Sauer, M. The Initial Step ofDNA Hairpin Folding: a Kinetic Analysis Using FluorescenceCorrelation Spectroscopy. Nucleic Acids Res. 2006, 34, 2516−2527.(24) Holmstrom, E. D.; Nesbitt, D. J. Single-Molecule FluorescenceResonance Energy Transfer Studies of the Human Telomerase RNAPseudoknot: Temperature-/Urea-Dependent Folding Kinetics andThermodynamics. J. Phys. Chem. B 2014, 118, 3853−3863.(25) Kastantin, M.; Schwartz, D. K. DNA Hairpin Stabilization on aHydrophobic Surface. Small 2013, 9, 933−941.(26) Keller, B. G.; Kobitski, A.; Jaschke, A.; Nienhaus, G. U.; Noe, F.Complex RNA Folding Kinetics Revealed by Single-Molecule FRETand Hidden Markov Models. J. Am. Chem. Soc. 2014, 136, 4534−4543.(27) Bonnet, G.; Krichevsky, O.; Libchaber, A. Kinetics of Conforma-tional Fluctuations in DNA Hairpin-loops. Proc. Natl. Acad. Sci. U. S. A.1998, 95, 8602−8606.(28) Jung, J.; Ihly, R.; Scott, E.; Yu, M.; Van Orden, A. Probing theComplete Folding Trajectory of a DNA Hairpin Using Dual BeamFluorescence Fluctuation Spectroscopy. J. Phys. Chem. B 2008, 112,127−133.(29)Wallace, M. I.; Ying, L.; Balasubramanian, S.; Klenerman, D. Non-Arrhenius Kinetics for the Loop Closure of a DNA Hairpin. Proc. Natl.Acad. Sci. U. S. A. 2001, 98, 5584−5589.(30) Wallace, M. I.; Ying, L.; Balasubramanian, S.; Klenerman, D.FRET Fluctuation Spectroscopy: Exploring the ConformationalDynamics of a DNA Hairpin Loop. J. Phys. Chem. B 2000, 104,11551−11555.(31) Long, X.; Parks, J. W.; Bagshaw, C. R.; Stone, M. D. MechanicalUnfolding of Human Telomere G-Quadruplex DNA Probed byIntegrated Fluorescence and Magnetic Tweezers Spectroscopy. NucleicAcids Res. 2013, 41, 2746−2755.(32) Yin, Y.; Zhao, X. S. Kinetics and Dynamics of DNAHybridization.Acc. Chem. Res. 2011, 44, 1172−1181.(33) Ying, L.; Wallace, M. I.; Klenerman, D. Two-State Model ofConformational Fluctuation in a DNA Hairpin-loop. Chem. Phys. Lett.2001, 334, 145−150.(34) Jung, J.; Van Orden, A. A Three-state Mechanism for DNAHairpin Folding Characterized by Multiparameter FluorescenceFluctuation Spectroscopy. J. Am. Chem. Soc. 2006, 128, 1240−1249.(35) Kuznetsov, S. V.; Ansari, A. A Kinetic Zipper Model withIntrachain Interactions Applied to Nucleic Acid Hairpin FoldingKinetics. Biophys. J. 2012, 102, 101−111.(36) Preus, S.; Wilhelmsson, L. M. Advances in Quantitative FRET-Based Methods for Studying Nucleic Acids. ChemBioChem 2012, 13,1990−2001.(37) Zhuang, X.; Bartley, L. E.; Babcock, H. P.; Russell, R.; Ha, T.;Herschlag, D.; Chu, S. A Single-Molecule Study of RNA Catalysis andFolding. Science 2000, 288, 2048−2051.
(38) Liu, S.; Abbondanzieri, E. A.; Rausch, J. W.; Grice, S. F. J. L.;Zhuang, X. Slide into Action: Dynamic Shuttling of HIV ReverseTranscriptase on Nucleic Acid Substrates. Science 2008, 322, 1092−1097.(39) Wong, K.-Y.; Pettitt, B. M. The Pathway of Oligomeric DNAMelting Investigated by Molecular Dynamics Simulations. Biophys. J.2008, 95, 5618−5626.(40) Perez, A.; Luque, F. J.; Orozco, M. Frontiers in MolecularDynamics Simulations of DNA. Acc. Chem. Res. 2012, 45, 196−205.(41)Ma, H.; Wan, C.; Wu, A.; Zewail, A. H. DNA Folding andMeltingObserved in Real Time Redefine the Energy Landscape. Proc. Natl. Acad.Sci. U. S. A. 2007, 104, 712−716.(42) Andreatta, D.; Sen, S.; Perez Lustres, J. L.; Kovalenko, S. A.;Ernsting, N. P.; Murphy, C. J.; Coleman, R. S.; Berg, M. A. UltrafastDynamics in DNA: “Fraying” at the End of the Helix. J. Am. Chem. Soc.2006, 128, 6885−6892.(43) SantaLucia, J.; Hicks, D. The Thermodynamics of Dna StructuralMotifs. Annu. Rev. Biophys. Biomol. Struct. 2004, 33, 415−440.(44) Karam, P.; Ngo, A. T.; Rouiller, I.; Cosa, G. Unraveling ElectronicEnergy Transfer in Single Conjugated Polyelectrolytes Encapsulated inLipid Vesicles. Proc. Natl. Acad. Sci. U. S. A. 2010, 107, 17480−17485.(45) Darugar, Q.; Kim, H.; Gorelick, R. J.; Landes, C. Human T-CellLymphotropic Virus Type 1 Nucleocapsid Protein-induced StructuralChanges in Transactivation Response DNA Hairpin Measured bySingle-Molecule Fluorescence Resonance Energy Transfer. J. Virol.2008, 82, 12164−12171.(46) McKinney, S. A.; Joo, C.; Ha, T. Analysis of Single-MoleculeFRET Trajectories Using Hidden Markov Modeling. Biophys. J. 2006,91, 1941−1951.(47) Bronson, J. E.; Fei, J.; Hofman, J. M.; Gonzalez, R. L., Jr.; Wiggins,C. H. Learning Rates and States from Biophysical Time Series: ABayesian Approach to Model Selection and Single-Molecule FRETData. Biophys. J. 2009, 97, 3196−3205.(48) Taylor, N. J.; Makarov, D. E.; Landes, C. F. Denoising Single-Molecule FRET Trajectories with Wavelets and Bayesian Inference.Biophys. J. 2010, 98, 164−173.(49) Landes, C. F.; Rambhadran, A.; Taylor, J. N.; Salatan, F.;Jayaraman, V. Structural Landscape of Isolated Agonist-bindingDomains from Single AMPA Receptors. Nat. Chem. Biol. 2011, 7,168−173.(50) Andrec, M.; Levy, R. M.; Talaga, D. S. Direct Determination ofKinetic Rates from Single-Molecule Photon Arrival Trajectories UsingHidden Markov Models. J. Phys. Chem. A 2003, 107, 7454−7464.(51) Talaga, D. S. Markov Processes in Single Molecule Fluorescence.Curr. Opin. Colloid Interface Sci. 2007, 12, 285−296.(52) Blanco, M.; Walter, N. G. Analysis of Complex Single-MoleculeFRET Time Trajectories. Methods Enzymol. 2010, 472, 153−178.(53) Murphy, M. C.; Rasnik, I.; Cheng, W.; Lohman, T. M.; Ha, T.Probing Single-Stranded DNA Conformational Flexibility UsingFluorescence Spectroscopy. Biophys. J. 2004, 86, 2530−2537.(54) Thirumalai, D.; Ha, B. Y. Statistical Mechanics of SemiflexibleChains. In Theoretical and Mathematical Models in Polymer Research;Grosberg, A., Ed.; Academic Press: San Diego, CA, 1998; pp 1−35.(55) Iqbal, A.; Arslan, S.; Okumus, B.; Wilson, T. J.; Giraud, G.;Norman, D. G.; Ha, T.; Lilley, D. M. J. Orientation Dependence inFluorescent Energy Transfer Between Cy3 and Cy5 TerminallyAttached to Double-Stranded Nucleic Acids. Proc. Natl. Acad. Sci. U.S. A. 2008, 105, 11176−11181.(56) Metropolis, N.; Rosenbluth, A. W.; Rosenbluth, M. N.; Teller, A.H.; Tell, E. Equation of State Calculations by Fast ComputingMachines.J. Chem. Phys. 1953, 21, 1087−1092.(57) Sanborn, M. E.; Connolly, B. K.; Gurunathan, K.; Levitus, M.Fluorescence Properties and Photophysics of the Sulfoindocyanine Cy3Linked Covalently to DNA. J. Phys. Chem. B 2007, 111, 11064−11074.(58) Ha, T.; Tinnefeld, P. Photophysics of Fluorescent Probes forSingle-Molecule Biophysics and Super-resolution Imaging. Annu. Rev.Phys. Chem. 2012, 63, 595−617.
The Journal of Physical Chemistry B Article
dx.doi.org/10.1021/jp507067p | J. Phys. Chem. B 2014, 118, 12130−1213912138
(59) Harvey, B. J.; Perez, C.; Levitus, M. DNA Sequence-DependentEnhancement of Cy3 Fluorescence. Photochem. Photobiol. Sci. 2009, 8,1105−1110.(60) Agbavwe, C.; Somoza, M. M. Sequence-Dependent Fluorescenceof Cyanine Dyes on Microarrays. PLoS One 2011, 6, e22177.(61) Tsukanov, R.; Tomov, T. E.; Masoud, R.; Drory, H.; Plavner, N.;Liber, M.; Nir, E. Detailed Study of DNA Hairpin Dynamics UsingSingle-Molecule Fluorescence Assisted by DNA Origami. J. Phys. Chem.B 2013, 117, 11932−11942.(62) Cosa, G.; Zeng, Y.; Liu, H. W.; Landes, C. F.; Makarov, D. E.;Musier-Forsyth, K.; Barbara, P. F. Evidence for Non-Two-State Kineticsin the Nucleocapsid Protein Chaperoned Opening of DNA Hairpins. J.Phys. Chem. B 2006, 110, 2419−2426.(63) Levin, J. G.; Guo, J.; Rouzina, I.; Musier−Forsyth, K.; Kivie, M.Nucleic Acid Chaperone Activity of HIV-1 Nucleocapsid Protein:Critical Role in Reverse Transcription and Molecular Mechanism. Prog.Nucleic Acid Res. Mol. Biol. 2005, 80, 217−286.(64) Cosa, G.; Harbron, E. J.; Zeng, Y.; Liu, H.-W.; O Connor, D. B.;Eta-Hosokawa, C.; Musier-Forsyth, K.; Barbara, P. F. SecondaryStructure and Secondary Structure Dynamics of DNA HairpinsComplexed with HIV-1 NC Protein. Biophys. J. 2004, 87, 2759−2767.(65) Vo, M. N.; Barany, G.; Rouzina, I.; Musier-Forsyth, K.Mechanistic Studies ofMini-TARRNA/DNAAnnealing in the Absenceand Presence of HIV-1 Nucleocapsid Protein. J. Mol. Biol. 2006, 363,244−261.(66) Liu, H. W.; Cosa, G.; Landes, C. F.; Zeng, Y.; Kovaleski, B. J.;Mullen, D. G.; Barany, G.; Musier-Forsyth, K.; Barbara, P. F. Single-Molecule FRET Studies of Important Intermediates in the Nucleocap-sid-Protein-Chaperoned Minus-Strand Transfer Step in HIV-1 ReverseTranscription. Biophys. J. 2005, 89, 3470−3479.(67) Uzawa, T.; Cheng, R. R.; Cash, K. J.; Makarov, D. E.; Plaxco, K.W.The Length and Viscosity Dependence of End-to-end Collision Rates inSingle-Stranded DNA. Biophys. J. 2009, 97, 205−210.(68) Cheng, R. R.; Uzawa, T.; Plaxco, K. W.; Makarov, D. E. The Rateof Intramolecular Loop Formation in DNA and Polypeptides: theAbsence of the Diffusion-Controlled Limit and Fractional Power-LawViscosity Dependence. J. Phys. Chem. B 2009, 113, 14026−14034.(69) Ansari, A.; Kuznetsov, S. V. Is Hairpin Formation in Single-Stranded Polynucleotide Diffusion-Controlled? J. Phys. Chem. B 2005,109, 12982−12989.(70) Lambert, D.; Draper, D. E. Effects of Osmolytes on RNASecondary and Tertiary Structure Stabilities and RNA-Mg2+ Inter-actions. J. Mol. Biol. 2007, 370, 993−1005.(71) Blose, J. M.; Pabit, S. A.; Meisburger, S. P.; Li, L.; Jones, C. D.;Pollack, L. Effects of a Protecting Osmolyte on the Ion AtmosphereSurrounding DNA Duplexes. Biochemistry 2011, 50, 8540−8547.(72) Spink, C. H.; Garbett, N.; Chaires, J. B. Enthalpies of DNAMelting in the Presence of Osmolytes. Biophys. Chem. 2007, 126, 176−185.(73) Nakano, S.; Wu, L.; Oka, H.; Karimata, H. T.; Kirihata, T.; Sato,Y.; Fujii, S.; Sakai, H.; Kuwahara, M.; Sawai, H.; Sugimoto, N.Conformation and the Sodium Ion Condensation on DNA and RNAStructures in the Presence of a Neutral Cosolute as a Mimic of theIntracellular Media. Mol. Biosyst. 2008, 4, 579−588.(74) Guinn, E. J.; Schwinefus, J. J.; Cha, H. K.; McDevitt, J. L.; Merker,W. E.; Ritzer, R.; Muth, G. W.; Engelsgjerd, S. W.; Mangold, K. E.;Thompson, P. J.; Kerins, M. J.; Record, M. T. Quantifying FunctionalGroup Interactions That Determine Urea Effects on Nucleic Acid HelixFormation. J. Am. Chem. Soc. 2013, 135, 5828−5838.(75) Rabiner, L.; Juang, B. An Introduction to HiddenMarkovModels.ASSP Mag., IEEE 1986, 3, 4−16.(76) Gilks, W. R.; Richardson, S.; Spiegelhalter, D. J. Markov ChainMonte Carlo in Practice; CRC Press: Boca Raton, FL, 1996; Vol. 2.(77) Li, C.-B.; Yang, H.; Komatsuzaki, T.Multiscale Complex Networkof Protein Conformational Fluctuations in Single-molecule Time Series.Proc. Natl. Acad. Sci. U. S. A. 2008, 105, 536−541.(78) Konig, S. L. B.; Hadzic, M.; Fiorini, E.; Borner, R.; Kowerko, D.;Blanckenhorn, W. U.; Sigel, R. K. O. BOBA FRET: Bootstrap-BasedAnalysis of Single-Molecule FRET Data. PLoS One 2013, 8, e84157.
(79) Sultana, T.; Takagi, H.; Morimatsu, M.; Teramoto, H.; Li, C.-B.;Sako, Y.; Komatsuzaki, T. Non-Markovian Properties and MultiscaleHidden Markovian Network Buried in Single Molecule Time Series. J.Chem. Phys. 2013, 139, 245101.(80) Liang, X.; Kuhn, H.; Frank-Kamenetskii, M. D. MonitoringSingle-Stranded DNA Secondary Structure Formation by Determiningthe Topological State of DNA Catenanes. Biophys. J. 2006, 90, 2877−2889.(81)McIntosh, D. B.; Saleh, O. A. Salt Species-dependent ElectrostaticEffects on ssDNA Elasticity. Macromolecules 2011, 44, 2328−2333.(82) Rasnik, I.; McKinney, S. A.; Ha, T. Surfaces and Orientations:Much to FRET about? Acc. Chem. Res. 2005, 38, 542−548.(83) Kastantin, M.; Schwartz, D. K. Connecting Rare DNAConformations and Surface Dynamics Using Single-Molecule Reso-nance Energy Transfer. ACS Nano 2011, 5, 9861−9869.
The Journal of Physical Chemistry B Article
dx.doi.org/10.1021/jp507067p | J. Phys. Chem. B 2014, 118, 12130−1213912139


![Manual: Single Molecule F orster-Resonance-Energy-Transfer€¦ · biomacromolecules. FRET is also used to study inter- and intramolecular distances [3, 4, 5]. For this application](https://static.fdocuments.us/doc/165x107/6060060efaa5f67fdb0517ad/manual-single-molecule-f-orster-resonance-energy-transfer-biomacromolecules-fret.jpg)