Single cell RNA Seq profiling of human pre …...Single-cell RNA-Seq profiling of human...
17
Single-cell RNA-Seq profiling of human pre-implantation embryos and embryonic stem cells Liying Yan 1,2,5, Mingyu Yang 1,5 , Hongshan Guo 1 , Lu Yang 1 , Jun Wu 1 , Rong Li 1,2 , Ping Liu 1 , Ying Lian 1 , Xiaoying Zheng 1 , Jie Yan 1 , Jin Huang 1 , Ming Li 1 , Xinglong Wu 1 , Lu Wen 1 , Kaiqin Lao 4 , Ruiqiang Li 1,3* , Jie Qiao 1,2* , Fuchou Tang 1* 1 Biodynamic Optical Imaging Center & Center for Reproductive Medicine, College of Life Sciences, Third Hospital, Peking University, Beijing 100871, P. R. China 2 Key Laboratory of Assisted Reproduction, Ministry of Education, Beijing 100191, P. R. China 3 Genetic Systems, Applied Biosystems, Life Technologies, Foster City, California, USA 4 Peking-Tsinghua Center for Life Sciences, College of Life Sciences, Peking University, Beijing 100871, P. R. China 5 These authors contributed equally to this work. * Correspondence should be addressed to: R. L. ([email protected]), J. Q. ([email protected]), or F. T. (tangfuchou@pku.edu.cn) Nature Structural & Molecular Biology: doi:10.1038/nsmb.2660
Transcript of Single cell RNA Seq profiling of human pre …...Single-cell RNA-Seq profiling of human...
Single-cell RNA-Seq profiling of human pre-implantation embryos and
embryonic stem cells
Liying Yan1,2,5, Mingyu Yang1,5, Hongshan Guo1, Lu Yang1, Jun Wu1, Rong Li1,2, Ping
Liu1, Ying Lian1, Xiaoying Zheng1, Jie Yan1, Jin Huang1, Ming Li 1, Xinglong Wu1,
Lu Wen1, Kaiqin Lao4, Ruiqiang Li1,3*, Jie Qiao1,2*, Fuchou Tang1*
1Biodynamic Optical Imaging Center & Center for Reproductive Medicine, College
of Life Sciences, Third Hospital, Peking University, Beijing 100871, P. R. China 2Key Laboratory of Assisted Reproduction, Ministry of Education, Beijing 100191, P.
R. China 3Genetic Systems, Applied Biosystems, Life Technologies, Foster City, California,
USA 4Peking-Tsinghua Center for Life Sciences, College of Life Sciences, Peking
University, Beijing 100871, P. R. China 5These authors contributed equally to this work. *Correspondence should be addressed to: R. L. ([email protected]), J. Q.
([email protected]), or F. T. ([email protected])
Nature Structural & Molecular Biology: doi:10.1038/nsmb.2660

Supplemental Materials
zygote 2- 4-cell 8-cell Blastocyst
oocyte253Ĺ99 Ļ
1103Ĺ491 Ļ
1595Ĺ565 Ļ
3156Ĺ1275 Ļ
2543Ĺ1254 Ļ
3177Ĺ1183Ļ
zygote28 Ĺ141Ļ
476 Ĺ232 Ļ
2686Ĺ1345Ļ
2212Ĺ1253 Ļ
2869Ĺ1147Ļ
2-cell983 Ĺ199 Ļ
3155Ĺ2421Ļ
2544Ĺ2992 Ļ
33133288 Ļ
4-cell2495Ĺ2675Ļ
2114Ĺ3009Ļ
27733171Ļ
8-cell401 Ĺ671 Ļ
20562134Ļ1606974 Ļ
Ĺ
Ĺ
Ĺ
Ĺ
cell
Morluae
Morluae
a b
c4-
cell #
2-C1
4-ce
ll #2-
C34-
cell #
2-C2
4-ce
ll #2-
C4
4-ce
ll #1-
C14-
cell #
1-C2
4-ce
ll #1-
C34-
cell #
1-C4
4-ce
ll #3-
C1
4-ce
ll #3-
C2
4-ce
ll #3-
C34-
cell #
3-C4
8-ce
ll #1-
C3
8-ce
ll #1-
C1
8-ce
ll #1-
C2
8-ce
ll #1-
C4
8-ce
ll #2-
C38-
cell #
2-C8
8-ce
ll #2-
C78-
cell #
2-C1
8-ce
ll #2-
C28-
cell #
2-C5
8-ce
ll #2-
C48-
cell #
2-C6
8-ce
ll #3-
C4
8-ce
ll #3-
C28-
cell #
3-C8
8-ce
ll #3-
C68-
cell #
3-C7
8-ce
ll #3-
C18-
cell #
3-C3
8-ce
ll #3-
C5
4-cell
8-cell
í� 40
d
Nature Structural & Molecular Biology: doi:10.1038/nsmb.2660

Supplementary Fig. 1. Expression dynamics of known RefSeq genes during human
pre-implantation development. (a) Number of RefSeq genes showing up- or
downregulation during pre-implantation development (fold change, FC>2 or <0.5, p-
value <0.01). (b) Heatmap of the genes showing differential expression between 4-
and 8-cell stage embryos. (FC>4 or <0.25, p<0.01) (c) Correlation plots for the
expression of RefSeq genes for individual blastomeres from three 2-cell-stage
embryos. The correlation coefficient between blastomeres within the same 2-cell
embryo is higher than 0.99, indicating that the technical variation is reasonably low.
(d) Correlation plots for the expression of RefSeq genes of single mature oocytes and
single blastomeres of pre-implantation embryos.
Nature Structural & Molecular Biology: doi:10.1038/nsmb.2660

a b
zygote 2- 4-cell 8-cell Blastocyst
oocyte251Ĺ197Ļ
277 Ĺ439 Ļ
49 Ĺ478 Ļ
21 Ĺ1140Ļ
26 Ĺ2007 Ļ
24 Ĺ2668Ļ
zygote48 Ĺ134 Ļ
17 Ĺ368 Ļ
18 Ĺ1192Ļ
22 Ĺ2135Ļ
22 Ĺ2822Ļ
2-cell59 Ĺ418 Ļ
80 Ĺ1174Ļ
81 Ĺ1973Ļ
352713Ļ
4-cell206 Ĺ531 Ļ
218 Ĺ882 Ļ
661839Ļ
8-cell117 Ĺ
Ļ641148Ļ37509 Ļ
Ĺ
Ĺ
Ĺ
Ĺ
cell
Morluae
Morluae
214
c
d
e
Nature Structural & Molecular Biology: doi:10.1038/nsmb.2660

Supplementary Fig. 2. Global expression profile of known and novel lncRNAs
during human pre-implantation development. (a) Correlation plots of the expression
of known lncRNA genes for individual blastomeres from three 2-cell-stage embryos.
(b) Correlation plots of the expression of known lncRNA genes for mature oocytes
and blastomeres of pre-implantation embryos. (c) Correlation plots of the expression
of novel lncRNA transcripts for individual blastomeres from three 2-cell-tage
embryos. (d) Number of novel lncRNA transcripts showing up- or downregulation
during pre-implantation development (Fold Change, FC>2 or <0.5, p<0.01). (e)
Correlation plots of the expression of novel lncRNA transcripts for mature oocytes
and blastomeres from pre-implantation embryos.
Nature Structural & Molecular Biology: doi:10.1038/nsmb.2660

RPS6
POU5F1
SOX2
NANOG
KLF4
CDX2
GDF3
FOXD3
ESRRB
PRDM14
CLDN3
FGFR4
1
10
100
1
10
100
1
10
100
1
10
100
1
10
100
1
10
100
1000
1
10
100
1000
1
10
100
1000
1
10
100
1000
1
10
100
1000
1
100
10000
1
100
10000
TE PE EPI
CLDN10
1
10
100
1000
d
F2
XK
TE #
6
TE #
7
TE #
9
TE #
12
TE #
4
TE #
14
TE #
13
TE #
15TE
#16
TE #
3
TE #
2TE
#8
TE #
5
TE #
1
TE #
10
TE #
11
TE #
17
TE #
18
EP
I #1
EP
I #3
EP
I #4
EP
I #2
EP
I #5
PE
#1
PE
#3
PE
#4
PE
#2
PE
#5
PE
#6
PE
#7
EPI
TE
PE
EPI
PE
TE
í�
í�
4
4
0
0
í� 20
EP
I #1
EP
I #2
EP
I #3
EP
I #4
EP
I #5
PE
#1
PE
#2
PE
#3
PE
#4
PE
#5
PE
#6
PE
#7
TE #
6
TE #
7TE
#9
TE #
12TE
#4
TE #
14TE
#13
TE #
15TE
#16
TE #
3
TE #
2
TE #
5TE
#1
TE #
10TE
#11
TE #
17
TE #
18
TE #
8b
a
c
Color Key
RoZ�=í6FRUH
Color Key
RoZ�=í6FRUH
Color Key
RoZ�=í6FRUH
Nature Structural & Molecular Biology: doi:10.1038/nsmb.2660

Supplementary Fig. 3. Heatmap and expression pattern of known RefSeq genes
during pre-implantation development. (a) Heatmap of the genes showing differential
expression between the epiblast and trophectoderm lineages of cells in late blastocysts.
(b) Heatmap of the genes showing differential expression between the epiblast and
primitive endoderm lineages of cells in late blastocysts. (c) Heatmap of the genes
showing differential expression between the primitive endoderm and trophectoderm
lineages of cells in late blastocysts. (d) Expression pattern of lineage specific marker
genes in individual cells of blastocysts. EPI: epiblast; PE: primitive endoderm; TE:
trophectoderm.
Nature Structural & Molecular Biology: doi:10.1038/nsmb.2660

RPS6
STELLA
SALL2
KLF5
LIN28B
LIN28A
FGFR4
CLDN10
10000
100
1
1000
100
1
100000
1000
1
10
1000
100
1
10
1000
100
1
10
100
1
10
100
1
10
10000
100
1
Exp
ressio
n L
eve
l
(
r.p
.k.m
)
Exp
ressio
n L
eve
lE
xp
ressio
n L
eve
lE
xp
ressio
n L
eve
lE
xp
ressio
n L
eve
lE
xp
ressio
n L
eve
lE
xp
ressio
n L
eve
lE
xp
ressio
n L
eve
l
RPS6
TET1
TET2
TET3
DNMT3L
DNMT3B
DNMT3A
HDAC7
10000
100
1
1000
100
1
10
1000
100
1
10
1000
100
1
10
100
1
10
10000
100
1
10000
100
1
100
1
10
Exp
ressio
n L
eve
l
Exp
ressio
n L
eve
lE
xp
ressio
n L
eve
lE
xp
ressio
n L
eve
lE
xp
ressio
n L
eve
lE
xp
ressio
n L
eve
lE
xp
ressio
n L
eve
lE
xp
ressio
n L
eve
l
a b
(r.
p.k
.m)
(
r.p
.k.m
)
(r.
p.k
.m)
(
r.p
.k.m
)
(r.
p.k
.m)
(
r.p
.k.m
)
(r.
p.k
.m)
(
r.p
.k.m
)
(r.
p.k
.m)
(
r.p
.k.m
)
(r.
p.k
.m)
(
r.p
.k.m
)
(r.
p.k
.m)
(
r.p
.k.m
)
(r.
p.k
.m)
Oocyte
Zygote
2-cell
4-cell
8-cell
Morluae
TE
PEEPI
ESC(P
0)
ESC(P
10)
Oocyte
Zygote
2-cell
4-cell
8-cell
Morluae
TE
PE
EPI
ESC(P
0)
ESC(P
10)
Nature Structural & Molecular Biology: doi:10.1038/nsmb.2660

Supplementary Fig. 4. Expression of marker genes in individual cells during human
pre-implantation development and derivation of hESCs. (a) Expression of marker
genes (including transcription factors) in individual cells during human pre-
implantation development and derivation of hESCs. (b) Expression of epigenetic
regulator genes in individual cells during human pre-implantation development and
derivation of hESCs. The housekeeping gene RPS6 was used as a control. Each
vertical bar represents the expression (RPKM) of the gene in an individual cell. Each
column represents the expression of different genes within the same cell. TE:
trophectoderm; PE: primitive endoderm; EPI: epiblast; P0: hESCs of passage #0; P10:
hESCs of passage #10.
Nature Structural & Molecular Biology: doi:10.1038/nsmb.2660

0
0.2
0.4
0.6
0.8
1
SO
X2
KIT
NO
DA
L
LEFTY1
LEFTY2
TDG
F1
OCT4
LIN
28A
FO
XD3
IFIT
M1
REST
TFCP2L
ZFP42
GBX2
GDF3
NA
NO
G
TE
PE
EPI
ESC P0
107
1083
255 455579
870
182
24
1221
88
30
200
13
199
216
Re
lative
exp
ressio
n
a
b
EP
I #
1
EP
I #
3
EP
I #
4
EP
I #
2
EP
I #
5
hE
SC
P0
#1
hE
SC
P0
#2
hE
SC
P0
#3
hE
SC
P0
#4
hE
SC
P0
#5
hE
SC
P0
#6
hE
SC
P0
#7
hE
SC
P0
#8
hE
SC
P1
0 #
1
hE
SC
P1
0 #
2
hE
SC
P1
0 #
3
hE
SC
P1
0 #
4
hE
SC
P1
0 #
5
hE
SC
P1
0 #
6
hE
SC
P1
0 #
7
hE
SC
P1
0 #
8
hE
SC
P1
0 #
9
hE
SC
P1
0 #
10
hE
SC
P1
0 #
11
hE
SC
P1
0 #
18
hE
SC
P1
0 #
16
hE
SC
P1
0 #
17
hE
SC
P1
0 #
14
hE
SC
P1
0 #
25
hE
SC
P1
0 #
22
hE
SC
P1
0 #
23
hE
SC
P1
0 #
13
hE
SC
P1
0 #
19
hE
SC
P1
0 #
20
hE
SC
P1
0 #
21
hE
SC
P1
0 #
12
hE
SC
P1
0 #
26
hE
SC
P1
0 #
24
hE
SC
P1
0 #
15
c
Nature Structural & Molecular Biology: doi:10.1038/nsmb.2660

Supplementary Fig. 5. Gene expression dynamics of blastocysts and hESCs. (a)
Expression pattern of pluripotency-related genes in human embryonic stem cells
(hESCs) and human late blastocysts. The RPKM values of the genes are labeled at the
top of the highest bar for every gene. (b) Unsupervised hierarchical clustering analysis
for single cells of EPI and hESCs. (c) Expression pattern of pluripotency-related
genes in human embryonic stem cells (hESCs) and mouse embryonic stem cells
(mESCs). The RPKM values of the genes are labeled at the top of the highest bar for
every gene.
Nature Structural & Molecular Biology: doi:10.1038/nsmb.2660
a
5’ end
020
4060
80100
%XONB51$í6HT
6PDrWí6HT2XUBVF51$í6HT
TUDQVFULSWV��)XOO�OHQJWK����.E�
TDQVFrLSW���
5HDG�Fo
verDJH��
�
020
4060
80100
%XONB51$í6HT
6PDrWí6HT2XUBVF51$í6HT
TUDQVFULSWV��)XOO�OHQJWK�!��.E�
TDQVFrLSW���
5HDG�Fo
verDJH��
�
�¶�HQG 5’ end �¶�HQG
b
Nature Structural & Molecular Biology: doi:10.1038/nsmb.2660

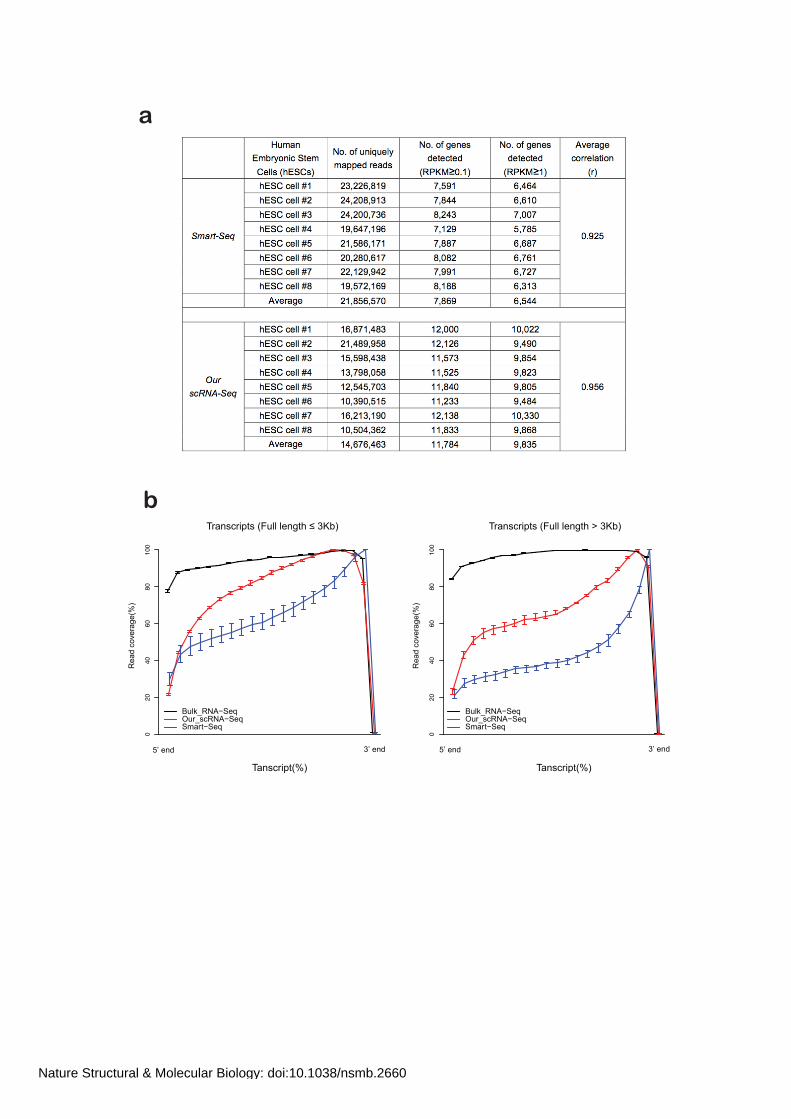
Supplementary Fig. 6. Compare between Smart-Seq and our single cell RNA-Seq
methods. (a) Number of genes detected in individual hESCs. (b) Mean read coverage
over transcripts for single cell RNA-Seq data of our technique (n=8) or Smart-Seq
technique (n=8) for human embryonic stem cells. For comparison, we included data
from standard RNA-Seq (n=2) on bulk amount of human embryonic stem cells (non-
amplified)1. Error bar: s.d.
Nature Structural & Molecular Biology: doi:10.1038/nsmb.2660

Nature Structural & Molecular Biology: doi:10.1038/nsmb.2660

Supplementary Fig. 7 Characterization of the hESC cell line and the lineage
differentiation of the blastocysts. (a) Unsupervised hierarchical clustering analysis for
single cells at morula and blastocyst stages. (b) Principal component analysis (PCA)
of the transcriptomes of single cells at morula and blastocyst stages. (c) The karyotype
(46, XY) of the hESC line used in the present study and Western blot of the
pluripotency markers OCT4, NANOG, and SOX2 in the analyzed hESCs. HeLa cells
were used as a control. (d) Immunostaining for TRA-1-60 (green) and corresponding
nuclear staining (PI staining; red) in hESCs. (e) Teratomas formed by the hESC line
analyzed in SCID mice. Ectoderm tissues (chromatophores, neuroepithelial) in
teratoma sections. Mesoderm tissues (bone) in teratoma sections. Endoderm tissues
(pseudostratified columnar epithelium) in teratoma sections. Scale bar: 20 µm.
Nature Structural & Molecular Biology: doi:10.1038/nsmb.2660

Supplementary Note
As one example, the seven transcript isoforms of RING-H2 finger protein ANAPC11,
produce two different proteins with 84 and 196 amino acids in the same hESC,
respectively. The expression level of the mRNAs for these two proteins is RPKM 181
and 16, respectively. It is known that ANAPC11 is a core component of anaphase-
promoting complex and together with E2 enzyme UBC4, it is sufficient to
ubiquitinate a wide variety of substrates during cell cycle regulation2.
We found that the DNA methyltransferases DNMT3A and DNMT3B and the histone
deacetylase HDAC7 are strongly upregulated from epiblast cells to passage #0 hESCs
(Supplementary Fig. 4b. Conversely, DNMT3L is highly expressed in epiblast cells
but is downregulated by over a hundred fold in hESCs, which implies that DNA
methylation-related factors is likely involved in the derivation of hESC cells from
epiblast cells (Supplementary Fig. 4b). In fact, of the 113 known epigenetic
regulators and chromatin remodeling factors, 21 show clear changes from epiblast
cells to passage #0 hESCs (Supplementary Table 8). Therefore, our results show that
during the derivation process of hESCs, the most dramatic changes in the expression
of epigenetic regulators occur at the earliest time point during the first ten days in
culture, which can probably be attributed to the accommodation of the cells to the
culture conditions, such as the addition of serum and cytokines.
Nature Structural & Molecular Biology: doi:10.1038/nsmb.2660

References 1. Gifford, Casey A. et al. Transcriptional and Epigenetic Dynamics during
Specification of Human Embryonic Stem Cells. Cell 153, 1149-1163 (2013). 2. Gmachl, M., Gieffers, C., Podtelejnikov, A.V., Mann, M. & Peters, J.-M. The
RING-H2 finger protein APC11 and the E2 enzyme UBC4 are sufficient to ubiquitinate substrates of the anaphase-promoting complex. Proceedings of the National Academy of Sciences 97, 8973-8978 (2000).
Nature Structural & Molecular Biology: doi:10.1038/nsmb.2660