Metatranscriptomic analyses of plant cell wall polysaccharide ...

UNIVERSITY OF CALIFORNIASANTA CRUZ
SINGLE-CELL ANALYSES OF TRANSCRIPTIONAL HETEROGENEITYDURING DRUG TOLERANCE TRANSITION IN CANCER CELLS BY
RNA SEQUENCING
A dissertation submitted in partial satisfaction of therequirements for the degree of
DOCTOR OF PHILOSOPHY
in
BIOINFORMATICS
by
Mei-Chong Wendy Lee
December 2014
The dissertation of Mei-Chong WendyLee is approved by:
Professor Nader Pourmand, Chair
Professor Kevin Karplus
Professor Rohinton Kamakaka
Dietlind L Gerloff, PhD
Dean Tyrus MillerVice Provost and Dean of Graduate Studies

Copyright c© by
Mei-Chong Wendy Lee
2014

Table of Contents
List of Figures vi
List of Tables viii
Abstract ix
Dedication xi
Acknowledgments xii
1 Introduction 1
2 Background 52.1 Single-cell RNA Sequencing . . . . . . . . . . . . . . . . . . . . . . . . . . 5
2.1.1 Single-cell RNA-Seq techniques using PCR technology . . . . . . 62.1.2 Single-cell RNA-Seq techniques with an in-vitro transcription tech-
nology . . . . . . . . . . . . . . . . . . . . . . . . . . . . . . . . . . 112.1.3 Microfluidic Single-cell Preparation for RNA-Seq . . . . . . . . . 12
2.2 Commercially Available Single-cell RNA Amplification Methods . . . . 152.2.1 NuGEN Ovation RNA-Seq System . . . . . . . . . . . . . . . . . . 152.2.2 2.2.2 Clontech SMARTer Ultra Low RNA Kit . . . . . . . . . . . . 182.2.3 Sigma Transplex WTA2-SEQ Kit . . . . . . . . . . . . . . . . . . . 182.2.4 Magnetic µMACS SuperAmp
TMKit by Miltenyi Biotec . . . . . . 20
2.3 Evaluation of cDNA Library Preparation Techniques . . . . . . . . . . . 222.4 Paclitaxel Resistance in Breast Cancer . . . . . . . . . . . . . . . . . . . . 24
3 Single Nucleotide Variants at the Single-Cell Level 263.1 Methods and Materials . . . . . . . . . . . . . . . . . . . . . . . . . . . . . 28
3.1.1 Cell culture, drug treatments and the Paclitaxel paradigm . . . . 283.1.2 Paclitaxel toxicity assays . . . . . . . . . . . . . . . . . . . . . . . . 303.1.3 Cell analysis experimental design . . . . . . . . . . . . . . . . . . 303.1.4 Isolation of single-cells and cell populations, and cDNA synthesis 31
iii

3.1.5 Quality control and mapping of the sequencing reads . . . . . . . 313.1.6 SNV identification . . . . . . . . . . . . . . . . . . . . . . . . . . . 323.1.7 Identification of common and unique SNVs amongst single-cells
and populations of cells . . . . . . . . . . . . . . . . . . . . . . . . 343.1.8 Detection of DNA-RNA variants and candidate RNA variants . . 343.1.9 PCR amplification for targeted SNV pyrosequencing . . . . . . . 363.1.10 Validating SNVs with pyrosequencing . . . . . . . . . . . . . . . . 373.1.11 Private RNA variant frequencies and SNV per mapped reads in
normal human single-cells and cancer cells . . . . . . . . . . . . . 373.1.12 Data simulation experiment for determining if RNA variants found
in three out of five drug-tolerant cells occurred by chance . . . . 383.2 Results . . . . . . . . . . . . . . . . . . . . . . . . . . . . . . . . . . . . . . 39
3.2.1 Generation of a Paclitaxel tolerance paradigm in metastatic hu-man cancer cells and isolation of single-cells . . . . . . . . . . . . 39
3.2.2 Early drug tolerance dynamics analysis at the single-cell Level . 403.2.3 The novel RNA variants in single-cells are not the major alleles
found in population . . . . . . . . . . . . . . . . . . . . . . . . . . 413.2.4 RNA variation is similar in drug tolerant cells and other cancer
cells . . . . . . . . . . . . . . . . . . . . . . . . . . . . . . . . . . . . 433.2.5 RNA variants found only in drug-tolerant cells are involved in
microtubule stabilization and organization . . . . . . . . . . . . . 533.3 Summary . . . . . . . . . . . . . . . . . . . . . . . . . . . . . . . . . . . . . 62
4 Whole-transcriptome Gene Expression Analyses at the Single-cell Level 634.1 Methods and Materials . . . . . . . . . . . . . . . . . . . . . . . . . . . . . 64
4.1.1 Whole transcriptome gene expression analysis . . . . . . . . . . . 644.1.2 Characterizing single-cells and bulk-cells using gene expression
data . . . . . . . . . . . . . . . . . . . . . . . . . . . . . . . . . . . . 664.1.3 Differential gene expression and functional classification analyses 66
4.2 Results . . . . . . . . . . . . . . . . . . . . . . . . . . . . . . . . . . . . . . 694.2.1 Stressed cells undergo a Paclitaxel-induced transcription response
that is not apparent in drug-tolerant cells . . . . . . . . . . . . . . 694.2.2 Gene expression profile of single-cells is distinct from that of the
population . . . . . . . . . . . . . . . . . . . . . . . . . . . . . . . . 714.3 Summary . . . . . . . . . . . . . . . . . . . . . . . . . . . . . . . . . . . . . 74
5 Mitochondria Specific SNV and Gene Expression Analyses 795.1 Methods . . . . . . . . . . . . . . . . . . . . . . . . . . . . . . . . . . . . . 80
5.1.1 Mapping single-cell RNA-Seq reads to the mitochondrial refer-ence genome . . . . . . . . . . . . . . . . . . . . . . . . . . . . . . 80
5.1.2 Detecting homoplasmic and heteroplasmic variants in mitochon-drial RNA . . . . . . . . . . . . . . . . . . . . . . . . . . . . . . . . 81
iv

5.1.3 Identify SNVs in nuclear-encoded genes involved in mitochon-drial functions . . . . . . . . . . . . . . . . . . . . . . . . . . . . . . 81
5.1.4 Differential expression of genes that encode for proteins involvedin mitochondrial functions . . . . . . . . . . . . . . . . . . . . . . 82
5.1.5 Knockdown experiment of BNIP3L . . . . . . . . . . . . . . . . . 835.1.6 Cell viability assay . . . . . . . . . . . . . . . . . . . . . . . . . . . 83
5.2 Results . . . . . . . . . . . . . . . . . . . . . . . . . . . . . . . . . . . . . . 845.2.1 Mitochondria-encoded gene expression profile is unique when
cells are under stress . . . . . . . . . . . . . . . . . . . . . . . . . . 845.2.2 Nuclear-encoded mitochondrial genes . . . . . . . . . . . . . . . . 855.2.3 SNVs in mitochondrial genes . . . . . . . . . . . . . . . . . . . . . 885.2.4 Recapitulate the drug-tolerant phenotype by manipulating the
expression level of BNIP3L . . . . . . . . . . . . . . . . . . . . . . 885.2.5 Heteroplasmic mitochondrial variants . . . . . . . . . . . . . . . . 89
5.3 Summary . . . . . . . . . . . . . . . . . . . . . . . . . . . . . . . . . . . . . 92
6 Discussion 94
A RNA-Seq read mapping statistics for single-cells and bulk-cells 101
B Additional Methods and Materials 106B.1 Single-cell cDNA synthesis . . . . . . . . . . . . . . . . . . . . . . . . . . 106B.2 RNA-Seq library preparation and sequencing . . . . . . . . . . . . . . . . 107B.3 Whole genome DNA sequencing of naıve MDA-MB-231 cells . . . . . . 108
Bibliography 109
v

List of Figures
2.1 Overview of the sample preparation steps using single-cell tagged re-verse transcription (STRT) . . . . . . . . . . . . . . . . . . . . . . . . . . . 10
2.2 Schematic of the single-cell whole transcriptome amplification methodused by Quartz-Seq . . . . . . . . . . . . . . . . . . . . . . . . . . . . . . . 13
2.3 The CEL-Seq DNA library preparation method with in-vitro transcription 142.4 Overview of molecular tagging using unique molecular identifiers (UMIs) 162.5 NuGEN Ovation RNA-Seq system for cDNA library preparation . . . . 192.6 Sigma Transplex
TMWTA2 Amplification . . . . . . . . . . . . . . . . . . . 21
2.7 Magnetic µMACS SuperAmpTM
Technology . . . . . . . . . . . . . . . . . 23
3.1 The response to Paclitaxel in cancer cells . . . . . . . . . . . . . . . . . . . 293.2 The majority of the novel SNVs unique to single-cells are not the major
alleles present in the population level . . . . . . . . . . . . . . . . . . . . 443.3 The number of SNVs detected in single cells and population regions cells
at various depth of read coverage . . . . . . . . . . . . . . . . . . . . . . . 453.4 Number of bases with reads at various depth of coverage . . . . . . . . . 463.5 Novel SNV rates of single-cells and population cells from different treat-
ment conditions . . . . . . . . . . . . . . . . . . . . . . . . . . . . . . . . . 473.6 The amount of novel SNVs and known SNPs shared between single-
cells of the same treatment group . . . . . . . . . . . . . . . . . . . . . . . 483.7 The fraction of novel variants shared between any two single-cells . . . 493.8 RNA variants identified at the single-cell level . . . . . . . . . . . . . . . 523.9 Comparing single-cell SNV frequencies between cells from normal hu-
man cells and cancer cell line cells . . . . . . . . . . . . . . . . . . . . . . 57
4.1 An example of uneven read coverage of single-cell RNA-Seq . . . . . . . 674.2 A new method for normalizing the number of reads aligned to transcript
for single-cell RNA-Seq data . . . . . . . . . . . . . . . . . . . . . . . . . . 684.3 Single-cell and population cells were classified using Principal Compo-
nent Analyses . . . . . . . . . . . . . . . . . . . . . . . . . . . . . . . . . . 72
vi

4.4 The gene expression profile of stressed cells is different than that of un-treated and drug-tolerant cells . . . . . . . . . . . . . . . . . . . . . . . . . 73
4.5 Paclitaxel-induced stress response at the single-cell level . . . . . . . . . 764.6 The stress response observed in stressed cells subsided in drug-tolerant
cells . . . . . . . . . . . . . . . . . . . . . . . . . . . . . . . . . . . . . . . . 774.7 Hierarchical clustering of pathway specific genes . . . . . . . . . . . . . . 78
5.1 Proportion of RNA-Seq reads mapping to rRNA, tRNA, mRNA, andother regions of the mitochondrial genome in population and single-cells 85
5.2 Stressed cells exhibit distinct mitochondrial expression pattern in genesencoded for proteins of the mitochondrial respiratory chain complex . . 87
5.3 Knockdown of Bnip3L gene appeared to enhance the cell survival againstPaclitaxel killing . . . . . . . . . . . . . . . . . . . . . . . . . . . . . . . . . 90
5.4 Proposed drug-tolerance mechanism . . . . . . . . . . . . . . . . . . . . . 915.5 Heteroplasmic and homoplasmic variants across the mitochondrial genome
at the single-cell level . . . . . . . . . . . . . . . . . . . . . . . . . . . . . . 92
6.1 Multiple drug-tolerance mechanisms regulated by the genes that wereidentified in this study . . . . . . . . . . . . . . . . . . . . . . . . . . . . . 100
vii

List of Tables
2.1 Commercially available RNA-Seq library construction kit . . . . . . . . . 17
3.1 SNV validation using pyrosequencing . . . . . . . . . . . . . . . . . . . . 583.2 RNA variants found in at least three out of five drug-tolerant single-cells
that were not present in untreated or stressed single-cells . . . . . . . . . 593.3 The number of private novel RNA variants increases with the number
of cell division . . . . . . . . . . . . . . . . . . . . . . . . . . . . . . . . . . 603.4 Comparing single-cell SNV frequencies between cell line cells and nor-
mal human cells . . . . . . . . . . . . . . . . . . . . . . . . . . . . . . . . . 613.5 A list of RNA variants present in at least three out of five of the drug-
tolerant single-cells and not found in untreated or stressed cells . . . . . 62
5.1 Differentially expressed nuclear-encoded mitochondrial genes betweenuntreated and drug-tolerant cells . . . . . . . . . . . . . . . . . . . . . . . 89
A.1 Number of sequencing reads and mapping statistics . . . . . . . . . . . . 102A.2 RNA sequencing reads of the population cells cover more genomic re-
gion than that of single cells . . . . . . . . . . . . . . . . . . . . . . . . . . 103A.3 Number of genes with RPKM>1 and adjRPKM>1 in single cells and
population cells . . . . . . . . . . . . . . . . . . . . . . . . . . . . . . . . . 104A.4 The number of common and unique SNVs detected in single-cells and
population in three different groups . . . . . . . . . . . . . . . . . . . . . 105
viii

Abstract
Single-cell analyses of transcriptional heterogeneity during drug tolerance
transition in cancer cells by RNA sequencing
by
Mei-Chong Wendy Lee
The acute cellular response to stress generates a subpopulation of reversibly stress-
tolerant cells under conditions that are lethal to the majority of the cell population.
Stress tolerance is attributed to heterogeneity of gene expression within the cell popula-
tion to ensure the survival of a minority cell population. I performed whole-transcriptome
sequencing analyses of metastatic human breast cancer cells, MDA-MB-231, subjected
to the chemotherapeutic agent Paclitaxel at the single-cell- and cell-population lev-
els. Here, I show that specific transcriptional programs are enacted within untreated,
stressed, and drug-tolerant cell groups, while generating high heterogeneity between
single-cells within and between groups. I further demonstrate that drug-tolerant cells
contain specific expressed single nucleotide variants (RNA variants) residing in genes
involved in microtubule organization and stabilization as well as cell adhesion and
cell surface signaling. Unexpectedly, drug-tolerant cells rapidly reacquire Paclitaxel-
sensitivity, high cell-to-cell transcript variability, and a gene expression profile similar
to that of the untreated cells within a few rounds of cell division. Thus, single-cell anal-
yses reveal the dynamics of the stress response in terms of cell-specific RNA variants
driving heterogeneity, the survival of a minority cell population through generation
ix

of specific RNA variants, and the efficient reconversion of stress-tolerant cells back to
normalcy.
x

I dedicate this thesis to my husband,
Dominic Abucejo,
who made all of this possible,
d
And also to my parents,
Mabel and Howard Lee,
for their unconditional love.
xi

Acknowledgments
It is with immense gratitude that I acknowledge the support and encouragement of my
advisor, Dr. Nader Pourmand. Much appreciation also goes to my thesis committee:
Dr. Kevin Karplus, Dr. Dietlind Gerloff, and Dr. Rohinton Kamakaka, for guiding my
research in the past four years. I am indebted to my colleagues in the Pourmand Lab
who are always kind and supportive, especially to Kikuye Koyano, Hana Hadiprodjo,
James Perrott, and John Collins for their technical assistance. I am very grateful to Dr.
Robert Fowler, Dr. Sami Khuri, Amie Radenbaugh, Hyunsung John Kim, and Ricardo
Leitao for their continued support and help in all situations. Last but not least, I would
like to express my deepest gratitude to my family, especially to Gregory and Martin,
for bringing so much joy and love to my life.
xii

Chapter 1
Introduction
A major barrier to successful cancer treatment is the recurrence of cancer cells
with acquired resistance to chemotherapy [10, 28, 94]. However, the molecular events
underlying cancer cell evolution towards a drug-resistant phenotype are largely un-
known. Recent studies using next generation sequencing (NGS) systems have at-
tempted to identify the genetic changes that drive tumorigenesis and resistance to
treatments [37, 61]. These studies have revealed that many of the resistance-imparting
mutations identified are different from tumor to tumor. In addition to heterogeneity
across tumors from different patients, intratumor heterogeneity adds another level of
complexity. Minor subpopulations of cancer cells can harbor aberrations that are asso-
ciated with resistance to therapy and tumor progression [27, 86, 90]. Thus, treatments
may be effective against the majority of the tumor, but a small population of resistant
cells can cause the persistence, recrudescence, or recurrence of cancer that is refractory
to further treatment. Sequencing-based studies on bulk tumor tissue can only identify
1

mutations present in subpopulations of a heterogeneous tumor in a limited capacity.
Rare mutations that are only present in a small number of cells in a cell-population
might not be detectable by the traditional bulk-cell sequencing since the rare muta-
tions can be ”drown out” by the major alleles in the population. By sequencing the
transcriptome at the single-cell level, it is more likely to identify low abundance muta-
tions that will allow us to identify the drivers of drug resistance.
Resistance of cancer cells to different chemotherapy drugs has been reported
in different types of cancer, especially in metastatic breast cancer [43, 122]. One of
the commonly used chemotherapy drug for treating solid breast tumors is Paclitaxel
(TaxolTM
) [7]. Palitaxel has been clinically shown to improve the overall and disease-
free survival of metastatic and early-stage breast cancer patients [9, 83]. This cytotoxic
agent targets microtubules to interfere with the mitotic spindle, resulting in cell cycle
arrest and, ultimately, in apoptosis. However, Paclitaxel resistance is common [65].
Paclitaxel treatment kills most tumor cells but, for the residual cancer cells, the mech-
anisms of resistance are unclear [7]. An important question is whether mutations that
drive drug resistance are common in a cell population, or arise from unique mutations
in individual cells.
Recent DNA sequencing advances have enabled the analysis of DNA and
RNA within a single-cell. The coupling of whole genome amplification and DNA se-
quencing has allowed multiple groups to study the genetics of single-cells, but not
without significant amplification biases [49, 51, 124]. Moreover, single-cell exome se-
quencing has confirmed the clonal heterogeneity of a solid tumor identifying key mu-
2

tations across much of the genome [119]. DNA sequencing can identify mutations
across the genome, but is unable to illuminate expressional differences that can con-
tribute significantly to drug resistance. Multiplexed single-cell qPCR assays allow
expression-based analysis of up to 96 targets in a single experiment [18]. Recently,
a few groups have demonstrated that mRNA sequencing (RNA-Seq) of single-cells us-
ing NGS technology is feasible, reproducible, and usable for gene expression-based
classification of cell subpopulations [14, 35, 79]. A major advantage of RNA-Seq in
single-cell studies is that the entire transcriptome can be surveyed, rather than a lim-
ited number of genes. DNA and RNA methodologies are not mutually exclusive and
can be combined to generate more biologically significant information.
Here, I leveraged the power of single-cell RNA-Seq to identify single nu-
cleotide variants (SNVs) and gene expression at the single-cell level in a drug-tolerance
experimental paradigm. I evaluated three groups of cells from the human breast car-
cinoma cell line, MDA-MB-231: untreated cells, stressed cells that had been exposed
to Paclitaxel treatment for 5 days plus 1 day drug-free, and drug-tolerant cells from
a small (n<64) clonal population of cells that resumed proliferation after Paclitaxel
treatment. In addition to sequencing the mRNA of single-cells, DNA sequencing of
a population of untreated MDA-MB-231 cells and RNA-Seq of bulk cells from each
of the three groups were performed to facilitate the identification of single nucleotide
variants (SNVs) and RNA variants. I performed differential gene expression profiling
for single-cells and population cells of the three groups to identify the transcriptional
stress response and cytotoxic effects of Paclitaxel on gene expression. Using SNV call-
3

ing methods, I performed SNV detection with two other published single-cell RNA-
Seq datasets, comparing the variants’ frequencies between the datasets from this study
and the others found in normal human single-cells and other cancer cells.
4

Chapter 2
Background
2.1 Single-cell RNA Sequencing
The classical approach in studying gene expression is to grind up tissue and
analyze the contents of large pools of cells. However, tissue is often comprised of het-
erogeneous populations of cells where much variation occurs at the single-cell level.
For example, in tumor tissue, there are heterogeneous populations of multiple clonal
expansions [5, 27, 99]. Analyzing a tumor as a whole could mask rare, but impor-
tant, characteristics of the tumor. Many research groups have developed molecular
techniques to overcome the challenges of sequencing minute amounts of messenger
RNA (mRNA) inside a single-cell. The amount of total RNA present in a single-cell
is estimated to be between 1 to 50 picograms (pg), and only 1-5 percent of this mass
is composed of mRNA [58]. Most of the current next generation sequencing (NGS)
platforms require input amounts of 50-1000 nanograms (ng) of DNA [76]. In order to
5

generate enough starting material for NGS, amplification of nucleic acid is an :essential
step for single-cell sequencing. The most commonly employed amplification method
is the polymerase chain reaction (PCR). In-vitro transcription techniques are also useful
in amplifying a cell’s RNA, and microfluidic sample preparation further improves the
efficiency of sequencing minute amount of mRNA in single-cells.
Single-cell RNA-Seq is a powerful tool for understanding the gene regulatory
network at the single-cell level. It has been applied to single-cell studies including
human preimplantation embryos, human embryonic stem cells [121], single-cells from
dissected hippocampal tissue of mouse [29], and immune cells from mouse [89]. In
this section, single-cell mRNA sequencing utilizing the two amplification methods de-
scribed above, as well as the microfluidic sample preparation technique will be cov-
ered. I will also cover a number of commercially available cDNA library preparation
kits that are capable of amplifying total RNA at the picogram level.
2.1.1 Single-cell RNA-Seq techniques using PCR technology
Polymerase chain reaction (PCR) is one of the most widely used methods in
amplifying DNA [81], commonly used in cDNA synthesis. Briefly, cDNA is first syn-
thesized from mRNA isolated from a single-cell using reverse transcriptase. A primer
site is added to the 3′ end of the first-strand cDNA by the action of a terminal trans-
ferase. After the second-strand cDNA is made, the amplification process utilizes the
added primer site in the first-strand cDNA and the poly(A) tail of the second-strand
cDNA as priming sites for PCR. In 2010, Azim Surani, Kaiqin Lao and colleagues
6

adapted a single-cell protocol developed for single-cell microarray studies for single-
cell RNA-Seq, and performed deep sequencing for single-cells of the early mouse em-
bryo on the SOLiD sequencing platform [102]. This was the first method published
for single-cell RNA-Seq. First, single-cells were lysed in a relatively mild lysis buffer.
Subsequently, cDNA synthesis was performed with two oligo(dT) primers, both con-
taining a 24-nucleotide poly(dT) tail at the 3′ end and a 24-nucleotide anchor sequence
to add a universal tail to the cDNAs that served as a universal priming site for second-
strand synthesis. Then, the cDNAs were amplified in the PCR step using a pair of
primers with an NH2-modification at their 5′ ends with a C6 linker to suppress the
contamination of primer dimers in the sequencing library. At the time this paper was
published, this technique could only amplify molecules that were no more than 3 kilo-
bases long, so about 40% of transcripts were missed. Nonetheless, the method de-
tected expression of about 12,300 genes in the early mouse embryo cells, which was
75% more than were detected by microarray techniques. But there are a few draw-
backs to this technique: it preferentially amplified the 3′ end of mRNAs, and it did not
always generate read coverage across full transcripts. In the following year, a group
from Sweden, Islam and colleagues, published another PCR-based single-cell RNA-
Seq method for Illumina sequencing [35]. This method combines oligo(dT) priming
and a template-switching technology in the cDNA synthesis step, known as single-
cell tagged reverse transcription (STRT) (Fig 2.1). The goal of template switching is to
obtain first-strand cDNAs that have reached the 5′ ends of the RNA template. Using
this technique, Islam et al. had reliably detected 1,000-6,000 of the ∼25,000 genes in
7

the mouse embryonic stem cells and 2,000-8,000 genes in the mouse embryonic fibrob-
last cells. There are a few drawbacks in this technique also. First, the majority of the
reads were found near the 5′ end of the transcripts, and endogenous transcripts often
were not sequenced to their full lengths. In 2012, another Swedish group introduced
a single-cell RNA-Seq protocol, known as Smart-Seq, with improved transcriptome
coverage by a combination of oligo(dT) priming and template switching, followed by
12-18 cycles of PCR amplification of cDNAs [79]. The cDNA synthesis and amplifi-
cation methods developed for this prococol is now commercially available, marketed
by Clontech, and is known as the SMARTer Ultra Low RNA Kit for Illumina sequenc-
ing. The cDNA synthesis steps, including the template-switching step, are identical
to the ones described by Islam et al. shown in Fig 2.1). They determined that if the
starting total RNA is below 1 ng, the detection rate of the less abundant transcripts
decreases by at least 40%. After analyzing 12 cancer line cells with this method (four
cells each from the LNCaP, PC3, and T24 cell lines), they detected about 8,000 genes
per cell with the sensitivity of gene detection similar to that achieved with ∼20 pg of
starting total RNA. They suggested that at the levels of about a million uniquely map-
pable reads per cell, the sequencing depth had little effect on transcript detection. It
appeared that the transcript detection sensitivity was mainly affected by limited start-
ing amounts of RNA and random loss of low-abundance transcripts, but the majority
of the low-abundance and highly expressed transcripts were reliably detected even at
the single-cell level. They also applied this method to determine if the global tran-
scriptome analyses of putative circulating tumor cells (CTCs) could reveal their tumor
8

of origin. They performed single-cell sequencing for six NG2+ putative melanoma
CTCs isolated from peripheral blood from a patient with recurrent melanoma, two
primary melanocytes, seven melanoma cancer cell line (SKMEL5, n=4 and UACC257,
n=3) cells and eight human embryonic stem cells. The global transcriptomes and ex-
pression patterns of melanoma-associated transcripts strongly supported a melanoma
CTC identity for the NG2+ cells. Last, they investigated if the possibilities that this
method could be used to identify single-nucleotide polymorphisms (SNPs) and other
genetic variants associated with melanomas and other cancers. They identified 4,312
high-confidence genetic variants that are supported by at least two CTCs, and 92%
of the high-confidence variant loci coincided with documented SNPs. The authors
concluded that, with only a few cells, Smart-Seq could be utilized to screen for SNPs
and mutations in transcribed regions. In 2013, Sasagawa and colleagues published
another PCR-based single-cell whole transcript amplification method for single-cell
RNA-Seq known as Quartz-Seq [85]. This method introduced improvements in three
areas: 1) suppression of byproduct synthesis during the amplification process (Fig 2.2);
2) single-tube reaction utilization of a PCR enzyme; and 3) optimized conditions of
reverse transcription and second-strand cDNA synthesis. It appeared that the Quartz-
Seq was more robust against a shorter cDNA length, able to amplify more transcript
isoforms than Smart-Seq. With Quart-Seq, it is possible to distinguish different cell
types but also different cell-cycle phases of the same cell type.
9

Figure 2.1: Overview of the sample preparation steps using single-cell tagged reversetranscription (STRT). (i) First strand cDNA is synthesized from the mRNA (brown)using a tailed oligo-dT primer (green), with 3-6 cytosines added to the 3′ end of thefirst strand cDNA; (ii) A barcode (shaded XXXXXX) is introduced through a template-switching step initiated by a helper oligo (green); (iii) An amplified product resultedfrom PCR with single-primer, followed by beads immobilization, fragmentation, andA-tailing; (iv) Ligation of the Illumina P2 adapter (blue) to the free ends; (v) Introduc-ing the P1 adapter in the library PCR step with a primer tailed with the P1 sequence(blue); (vi) Sequencing the final library with a custom primer from the P1 side of tem-plate. Each sequencing read begins with the barcode (arrow), followed by three to sixCs and the mRNA insert. Figure copied from Islam et al [35].
10

2.1.2 Single-cell RNA-Seq techniques with an in-vitro transcription tech-
nology
Hashimshony and colleagues published a single-cell RNA-Seq technique in
2012, called CEL-Seq [33]. This method utilizes barcoding and pooling of samples
before performing linear amplification of mRNA with only one round of in-vitro tran-
scription [33]. The first-strand cDNA synthesis is enabled by a reverse-transcriptase
reaction using a primer designed with an anchored polyT, a unique barcode, the 5′
Illumina sequencing adaptor, and a T7 promoter. After the second-strand cDNA syn-
thesis is performed, the cDNA samples are pooled for an in-vitro transcription reac-
tion. Next, the amplified RNA is fragmented to the appropriate size distribution for
sequencing, followed by the addition of the Illumina 3′ adaptor by ligation. The RNA
is then reverse transcribed to DNA. The DNA fragments containing both the Illumina
adaptors and a barcode are enriched for by PCR. The resulting DNA library is then
subjected to paired-end sequencing, where the first read contains the barcode, and the
second read contains the mRNA transcript (Fig. 2.3). In terms of robustness, sensitivity,
and reproducibility, CEL-Seq may have outperformed the STRT method published by
Islam and colleagues (a PCR-based method using single-cell tagged reverse transcrip-
tion), but is not without its own limitations. CEL-Seq selects for the single fragment of
each transcript closest to the 3′ end. Therefore, it has a strong 3′ bias, and is limited in
distinguishing alternative splice forms of transcripts. It is also sensitive to small copy
numbers of transcripts. By using spike-ins and dilution series, it appears that If the
11

number of copies of a transcript is less than 5, the chance that CEL-Seq will miss it is
more than 50%.
2.1.3 Microfluidic Single-cell Preparation for RNA-Seq
Many single-cell RNA-Seq techniques have two main challenges — ampli-
fication bias and capture efficiency of the mRNA transcript during cDNA synthesis.
On average, the limit of transcript detection is between five to ten mRNA molecules,
equivalent to converting between 5% and 10% of RNA molecules in a single-cell to
cDNA [33, 35, 79]. All single-cell RNA-Seq methods employ amplification. In 2013,
Islam et al. in the Karolinska Institute in Sweden, developed a single-cell RNA-Seq
preparation system that combined molecular tagging and microfluidics to reduce the
amplification bias and increase the efficiency of cDNA synthesis [36]. The molecular
tagging method uses unique molecular identifiers (UMIs), essentially the same single-
cell tagged reverse transcription (STRT) technique described in Section 2.1.1 that at-
taches short random sequences to each individual cDNA molecule (Fig. 2.4). UMIs
make each molecule in a population distinct, which allows one to measure the abso-
lute number of mRNA molecule in a single-cell prior to the amplification step. By
counting the number of UMIs, one can correct for PCR-induced artifacts and amplifi-
cation bias that are present in the sequencing data. Although, sequences that are not
amplified will not be account for. In addition, the use of a microfluidic system, the
Fluidigm C1 AutoPrep platform, allows the single-cell cDNA synthesis to take place in
an individual enclosed chamber with a reaction volume 200 times smaller than that in
12

Figure 2.2: Schematic of the single-cell whole transcriptome amplification method usedby Quartz-Seq. The entire whole transcriptome amplification process took place in asingle PCR tube. Step 1: The reverse-transcription (RT) primer that contains an oligo-dT24, a T7 promoter (T7) sequence, and a PCR target region (M) sequence was usedin the first-strand cDNA synthesis. Step 2: Exonuclease I was then used to digest themajority of the RT primer. Step 3: A poly-A tail was added to the 3′ ends of the firststrand cDNA and to any remaining RT primer. Step 4: A tagging primer was usedto synthesize the second-strand cDNA that produced double-stranded DNA productwith complementary sequences at both ends. Step 5: The byproducts from the remain-ing RT primers were eliminated through the suppression PCR. Suppression PCR uti-lizes template DNA that had complementary sequences at both ends that could bindeach other. DNA templates that became self-bound was not amplified by PCR. ThePCR primer could also binds one end of the template DNA. One end of the templateDNA competed with the binding between the PCR primer and one other end of thesame DNA template. It was more likely that a short DNA template would bind to it-self because of the close proximity of the complementary sequences at the ends of thetemplate. Longer DNA template tend to bind to the PCR primer more readily thanbinding to itself. The remaining RT primer DNA templates were short and would benot be amplified while the longer cDNA were enriched. Step 6: The amplified cDNAproduct was purified using a PCR purification column. Figure copied from Sasagawaet al [85]
13

Figure 2.3: The CEL-Seq DNA library preparation method with in-vitro transcription.First-strand cDNA synthesis was performed using a primer containing a poly-T se-quence, a unique barcode, the 5′ Illumina seqeuncing adaptor, and a T7 promoter.Then, the second-strand synthesis was performed. The double-stranded cDNA sam-ples were then pooled for the in-vitro transcription (IVT) reaction. Next, the amplifiedRNA was subjected to fragmentation to a size distribution suitable for sequencing.Then, the Illumina 3′ adaptor was ligated to the fragmented RNA. The RNA was thenreverse transcribed to DNA. Subsequently, PCR was employed to select for the DNAwith both the 5′- and 3′ Illumina adaptors. Then, the DNA library was subjected topaired-end sequencing. Figure copied from Hashimshony et al. [33]
14

a typical reaction tube. The reduction in reaction volume greatly improves the mRNA
capture efficiency from 5%-10% to 48%.
2.2 Commercially Available Single-cell RNA Amplification Meth-
ods
There are various types of RNA-Seq library construction kits available com-
mercially, depending on the input amounts and the quality of the RNA, and the reper-
toire of RNAs that one would like to enrich for in the sequencing library (Table 2.1).
For this study, I will give an overview of the RNA-Seq library construction kits that
are designed to amplify picogram amounts of total RNA, including NuGEN Ovation
RNA-Seq v2, Clontech SMARTer Ultra Low Input RNA Kit, Sigma Transplex WTA2-
SEQ Kit, and µMACS SuperAmpTM
Kit by Miltenyi Biotec.
2.2.1 NuGEN Ovation RNA-Seq System
The NuGEN Ovation RNA-Seq system is an isothermal linear nucleic acid
amplification system for whole-transcriptome sequencing with input total RNA as lit-
tle as 50 pg [104]. First, total RNA is subjected to the first strand cDNA synthesis
through the reverse transcription reaction with a combination of random hexamers and
a poly-T DNA/RNA chimeric primer. The resulting cDNA/mRNA heteroduplex con-
tains a unique sequence at the 5′ end. Then, a heating step is used to degrade the origi-
nal RNA template. The second strand cDNA is synthesized with the first-strand cDNA
15

Figure 2.4: Overview of molecular tagging using unique molecular identifiers (UMIs).Two cells containing mRNA molecules (wiggly lines) from different genes representedby distinct colors (top panel). The barcodes and UMIs (the color rectangles attachedto the wiggly lines) are attached to the mRNA molecules during reverse transcription.The transcripts that are not tagged with the UMIs (grey wiggly lines) are not reverse-transcribed (middle panel). UMIs make each molecule in a population unique, whichallows one to measure the absolute number of mRNA molecule in a single-cell priorto the amplification step. By counting the number of UMIs, one can correct for PCR-induced artifacts and amplification bias that are present in the sequencing data (bottompanel). Figure copied from Islam et al [36]. Reprinted by permission from MacmillanPublishers Ltd: Nature Methods 11:163-166, c©(2014). License number: 3373530538085.
16

Commerical RNA-Seqlibrary preparation kit
Total RNAinput RNA Quality Enrichment
Clontech SMARTerUltra Low Input RNAKit
10 ng(0.01 ng)*
Single cells, from afew to 1,000 intactcells, or very lowamounts of totalRNA
poly-A containingmRNA
Sigma TransplexWTA2-SEQ Kit
1-50 ng(0.01 ng)*
High Quality,degraded or FFPE,
mRNA and non-polyadenylatedtranscripts
µMACSSuperAmpTMKit byMiltenyi Biotec
100ng( 0.01 ng)*
Single cell, from 1cell up to 10,000cells
mRNA and non-polyadenylatedtranscripts
Epicentre ScriptSeq v2RNA-Seq LibraryPreparation Kit
25 ng(0.05 ng)*
rRNA-deleted orpoly-A selectedRNA
mRNA andncRNA
NuGEN OvationRNA-Seq v2
10 ng(0.05 ng)*
High quality,degraded or FFPE
mRNA and non-polyadenylatedtranscripts
Illumina TruSeq TotalRNA SamplePreparation Kit
500 ng(100 ng)*
High Quality,degraded orformalin-fixed,paraffin-embedded(FFPE)
mRNA andnon-coding RNA(ncRNA), longintergenicnoncoding RNA(lincRNA), smallnuclear RNA(snRNA), andsmall nucleolarRNA (snoRNA)
Illumina TruSeq RNASample Preparation Kitv2
1000-2000 ng(100 ng)*
High Quality poly-A containingmRNA
Epicentre RNASequencing Ribo-ZeroMagnetic Kit (1000 ng)*
High Quality,degraded or FFPE
mRNA andnon-coding RNA,along with otherlong intergenicnoncoding RNA(lincRNA), smallnuclear RNA(snRNA), andsmall nucleolarRNA (snoRNA)
*Minimum Assay Requirements
Table 2.1: A comparison of commercially available RNA-Seq library construction kits.The metrics being compared are input RNA quantity and quality, and the repertoire ofRNAs enriched.
17

as template, using DNA polymerase. The double-stranded cDNA is then purified and
amplified using a single-primer, isothermal, linear amplification (SPIA) process. SPIA
uses RNase H enzyme to degrade the RNA sequence that is complement to the unique
sequence at the 5′ end of the DNA/RNA heteroduplex double-stranded cDNA. This
results in the exposure of a DNA sequence for the SPIA DNA/RNA chimeric primer
to hybridize to. Subsequently, DNA polymerase initiates replication at the 3′ end of
the primer by displacement of the existing forward strand. Once again, RNase H en-
zyme degrades the RNA portion at the 5′ end of the newly synthesized ds-cDNA, and
the hybridization of the SPIA chimeric to the exposed DNA, DNA polymerization,
and strand displacement repeats. The SPIA product is then subjected to a sequencing
library preparation process (Fig. 2.5).
2.2.2 2.2.2 Clontech SMARTer Ultra Low RNA Kit
The cDNA library amplification process of the Clontech SMARTer Ultra Low
RNA Kit is based on the Smart-Seq method developed by Ramskld et al [79], and which
is described in Section 2.1.1.
2.2.3 Sigma Transplex WTA2-SEQ Kit
The Sigma Transplex WTA2-SEQ requires a two-step whole transcriptome
amplification process [113]. First, total RNA is reverse transcribed with the propri-
etary library synthesis primer. The 3′ end of this primer consist of a quasi-random,
non-self-complementary sequence while the 5′ end is a non-self-complementary, con-
18

Figure 2.5: NuGEN Ovation RNA-Seq system for cDNA library preparation. In step1, first strand cDNA is synthesized from total RNA through reverse transcription reac-tion with a combination of random hexamers and poly-T DNA/RNA chimeric primer.The resulting cDNA/mRNA heteroduplex contains a unique RNA sequence at the 5′
end. In step 2, the original RNA template (black line) is degraded by heat. Then, thesecond strand cDNA is synthesized with the first-strand cDNA as template using DNApolymerase. The double-stranded cDNA is then purified and amplified. In step 3, lin-ear amplification is performed using a single-primer, isothermal, linear amplification(SPIA) process. The SPIA process first uses the RNase H enzyme to degrade the uniqueRNA sequence at the 5′ end of the DNA/RNA heteroduplex double-stranded cDNA.Then the SPIA DNA/RNA chimeric primerc can hybridize to the exposure of a DNAsequence. DNA polymerase initiates replication at the 3′ end of the primer by displace-ment of the existing forward strand. Step 3 is repeated for 2 hours. Figure copied fromWatson et al. (2008) [115]
19

stant sequence that serves as the annealing site for the universal amplification primer
(Fig. 2.6). Then, the RNA template is degraded using RNase H enzyme. Next, the
second cDNA strand is synthesized by strand-displacement polymerization with the
library synthesis. The double-strand cDNA library is flanked by a universal end se-
quence, and is amplified by PCR using a single universal primer with WTA2 poly-
merase. A restriction enzyme (not specified in the manufacturers specification) is used
to remove the universal amplification primer sequence, which contains a type II re-
striction site, from the cDNA library prior to the downstream library preparation for
deep sequencing.
2.2.4 Magnetic µMACS SuperAmpTM Kit by Miltenyi Biotec
Magnetic µMACS SuperAmpTM
Kit is a cDNA library preparation kit de-
signed to work directly with cells. After cells are lysed, mRNA is hybridized to the
magnetically labeled µMACS Oligo(dT) MicroBeads which contains a complemen-
tary tag (Fig. 2.7). The mRNA hybridized to the oligo(dT) beads are placed in the
µ-Column. The µ-Column is then place inside the thermoMACS Separator where a
magnetic force is applied to immobilized the magnetically labeled mRNA while all
other cell components are being washed away from the mRNA. The first-strand cDNA
is then synthesized by reverse transcription with random primers. A proprietary Tail-
ing Mix is then added to attach a nucleic-acid tag to the 3′ end of the first-strand cDNA.
By removing the column from the thermoMACS Separator, the cDNA is eluted. After
elution, a single primer is annealed to the nucleic-acid tag and used for PCR amplifi-
20

Input RNA
Add primers
First Strand cDNA
Anneal and extend
Second Strand cDNA
Denature
Overlapping ds-cDNA Library
PCR
Amplified ds-cDNA
Primer Removal
Ready for Deep Sequencing Sample Preparation
(No Fragmentation Required)
Figure 2.6: Sigma TransplexTM
WTA2 Amplification. Total RNA ranging from 20pgto 1ng is used as input material for whole transcriptome amplification. In the firststep, library synthesis primer contains a quasi-random 3′ non-self-complementary se-quence that facilitates priming throughout the entire RNA template in the first andsecond strand cDNA synthesis. The 5′ end contains a constant universal, non-self-complementary sequence. RNase H enzyme degrades the RNA template after firststrand cDNA synthesis. Then, strand-displacement polymerization generates the sec-ond cDNA strand. The double stranded cDNA (ds-cDNA) is flanked by the universalsequence that is subsequently amplified by PCR using a single universal primer. Priorto the downstream sequencing library construction step, a restriction enzyme is usedto remove the universal primer sequence from the ds-cDNA. Figure copied from Wardand Heuermann (2010) [113].
21

cation of the cDNA.
2.3 Evaluation of cDNA Library Preparation Techniques
Exponential-amplification-based methods for cDNA library construction in-
clude single-cell tagged reverse transcription (STRT) [35], Smart-Seq [79], and commer-
cially available kits including Sigma TransplexTM
WTA2 [113] and Clontech SMARTer
Ultra Low RNA Kit [79]. CEL-Seq [33], NuGEN Ovation RNA-Seq system [104], and
Magnetic µMACS SuperAmpTM
are linear-amplification-based methods for mRNA am-
plification. When amplifying ultra-low amounts of mRNA, methods such as Smart-
Seq can generate a higher transcriptome coverage compared to linear-amplification
methods such as CEL-Seq. But the exponential amplification process is more likely to
produce spurious PCR products and primer-dimers, and distort the initial transcript
abundance levels due to sequence-, length-, and abundance-dependent biases [8, 91].
With about 30 million mapped mRNA-Sequencing reads per single-cell, the Clontech
SMARTer Ultra Low RNA Kit and Sigma TransplexTM
WTA2 can detect about 20% and
40% more genes, respectively, than that of the NuGEN Ovation RNA-Seq system [118].
A recent study has shown that the NuGEN Ovation RNA-Seq system has successfully
amplified femtograms to attograms of viral RNA for sequencing on the Illumina HiSeq
and MiSeq sequencing platforms [60]. The de novo assembly of viral reads generated
consensus sequence for the complete, or nearly complete, coding sequences (CDS) of
several viral genomes [60]. One of the advantages of the linear cDNA amplification
22
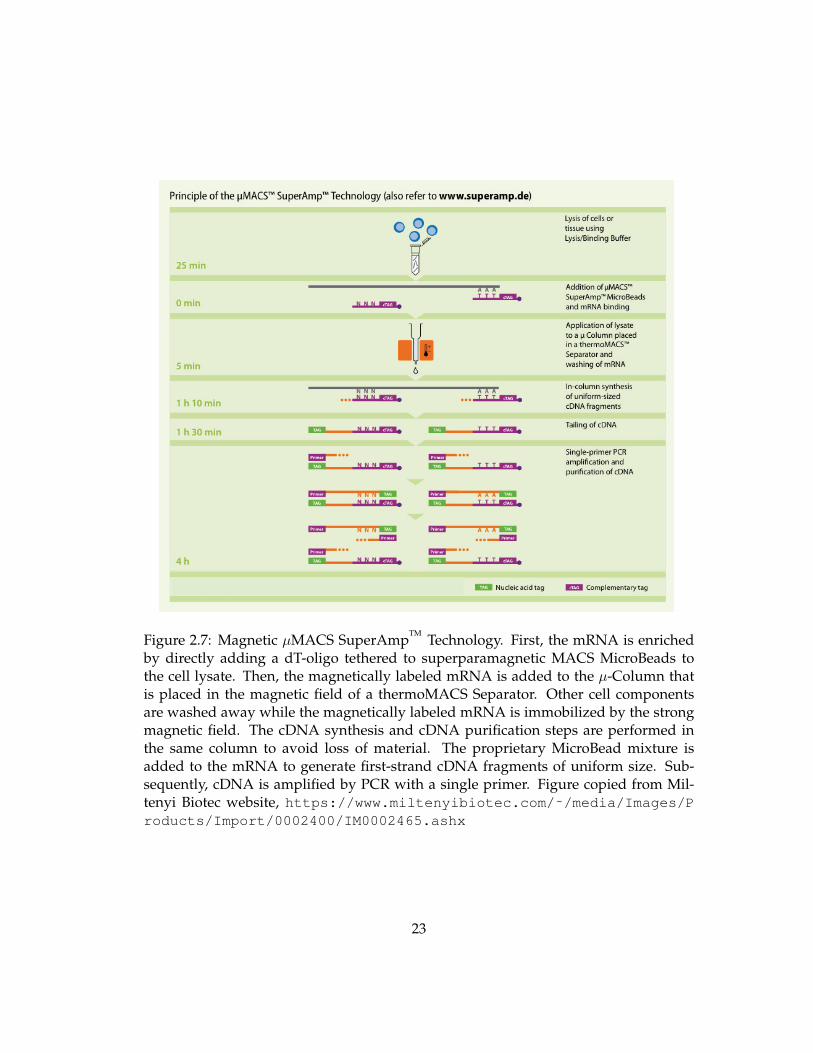
Figure 2.7: Magnetic µMACS SuperAmpTM
Technology. First, the mRNA is enrichedby directly adding a dT-oligo tethered to superparamagnetic MACS MicroBeads tothe cell lysate. Then, the magnetically labeled mRNA is added to the µ-Column thatis placed in the magnetic field of a thermoMACS Separator. Other cell componentsare washed away while the magnetically labeled mRNA is immobilized by the strongmagnetic field. The cDNA synthesis and cDNA purification steps are performed inthe same column to avoid loss of material. The proprietary MicroBead mixture isadded to the mRNA to generate first-strand cDNA fragments of uniform size. Sub-sequently, cDNA is amplified by PCR with a single primer. Figure copied from Mil-tenyi Biotec website, https://www.miltenyibiotec.com/˜/media/Images/Products/Import/0002400/IM0002465.ashx
23

system in the NuGEN Ovation RNA-Seq system is the ability to minimize the chance
of amplifying nucleotide incorporation errors in cDNA sequences introduced by DNA
polymerase during the early cycles of amplification. Only the second-strand cDNA
fragments are used in the amplification process, and none of the amplicons will be re-
amplified. Therefore, any nucleotide mis-incorporated during the early cycles of the
amplification process will not be re-amplified in the pool of cDNA.
2.4 Paclitaxel Resistance in Breast Cancer
Paclitaxel is one of the most commonly used chemotherapy drugs for treating
breast cancer, however, resistance of Paclitaxel has previously been observed in human
cancer cell line of breast origin [4]. Paclitaxel is a cytotoxic agent, originally derived
from the bark of the Pacific yew tree, Taxus bravifoliaa [1]. The substance arrests cells
at G2/M phase by interacting with the β-tubulin to promote the stabilization of the
microtubules, and prevents normal spindle assembly and cell division [23]. Despite
the benefits offered by Paclitaxel for overall and disease-free survival in early-stage
and metastatic breast cancer patients, the disease often recurs in a drug resistant man-
ner [23, 100].
A number of Paclitaxel-resistance mechanisms involving the regulation of cell
cycle and apoptosis have recently been identified. Previous work has shown the in-
volvement of genes CDK1, CDK2 [68], and the Hippo pathway component TAZ and its
downstream transcriptional targets Cyr61 and CTGF [46] in Paclitaxel resistance. These
24

genes encode for proteins which regulate cell cycle and apoptosis [34, 55], respectively.
In addition, estrogen receptor (ER) is found to play a role in Paclitaxel sensitivity in
breast cancer cells. ER-positive cell lines were found to be resistant to Paclitaxel associ-
ated with Bcl-2 expression mediated by ER [100]. Although ER-negative cell lines ap-
peared to be more sensitive to Paclitaxel than ER-positive cells, ER-negative cells were
able to slip out of Paclitaxel-induced mitotic arrest mediated by the Bcl-xL/Bak interac-
tion. Downregulation of Bak was reported to suppress Paclitaxel-induced apoptosis in
MDA-MB-231 cells, an ER-negative metastatic breast cancer cell line [126]. The proteins
encoded by Bcl-2, Bcl-xL, and Bak belong to the BCL2 protein family, in which there are
about 20 known members with either pro-apoptotic or anti-apoptotic function [87]. A
number of proteins in the BCL2 protein family that are key players in the mitochon-
drial intrinsic apoptotic pathway have been linked to Paclitaxel resistance [23, 45, 114].
Aberrant expression or mutation in these genes could enable cells to escape the damage
induced by Paclitaxel, which induces prolonged mitotic arrest and ultimately activates
the mitochondrial intrinsic apoptotic pathway [24].
25

Chapter 3
Single Nucleotide Variants at the
Single-Cell Level
High-throughput sequencing allows one to study the genetic changes across
the entire genome or transcriptome. But there is a limit of detection with this technol-
ogy where signals from rare single nucleotide variants (SNVs) in a cell population are
often drowned out by signals from the major alleles [79]. Thus far, all the previously
published single-cell RNA-Seq studies focused on single-cell gene expression. How-
ever, Ramskold et al. suggests that it is feasible to detect SNVs using the single-cell
RNA-Seq technique [79]. RNA-Seq not only can detect mutations propagated from the
DNA templates to the RNA transcripts, but can also detect all other expressed vari-
ants that could be a result of RNA editing. Although ultra-deep sequencing of the
whole genome with bulk cells can potentially improve the chance of identifying rare
variants, the cost of performing ultra-deep sequencing is very high. On average, one
26

sequencing run for the whole genome of human using the Illumina HiSeq 2000 with a
read length at 100 bp can generate roughly 30x depth of coverage, and each run cost
about $22,000 [15, 96]. In order to obtain a depth of coverage of 500x of whole genome
sequencing, it would cost more than $360,000. I hypothesize that rare variants not
detected through bulk-cells sequencing can be identified by sequencing at the single-
cell level when performing ultra-deep sequencing is not feasible. Here I leveraged the
power of single-cell RNA sequencing technology to identify SNVs in a drug-tolerance
experimental paradigm with Paclitaxel and the metastatic breast cancer cells MDA-
MB-231. A linear RNA amplification system, the NuGEN R© RNA-Seq system, was
employed in this study to preserve the transcript stoichiometry, as well as to minimize
the number of single-nucleotide mutations introduced during the cDNA amplification
step. In this chapter, I discuss the detection and comparison of SNVs within single-
cells and populations of cells. First, I validated of a set of SNVs using pyrosequencing.
To compare the single-cell variant frequencies in this study with those in normal hu-
man cells and other cancer cells, I analyzed two single-cell RNA-Seq datasets from two
previously published papers using the same methods that I employed for this single-
cell study. I also identified variants that were likely to be responsible for Paclitaxel
resistance in the MDA-MB-231 cell line.
27

3.1 Methods and Materials
3.1.1 Cell culture, drug treatments and the Paclitaxel paradigm
MDA-231 cells were obtained from the Princeton Physical Sciences Oncology
Center tissue biorepository and routinely cultured in DMEM supplemented with 10%
fetal bovine serum. Taxol (Paclitaxel, Sigma, St. Louis, MO) was prepared as a 5 mM
stock solution in ethanol and serial dilutions were prepared for toxicity assays.
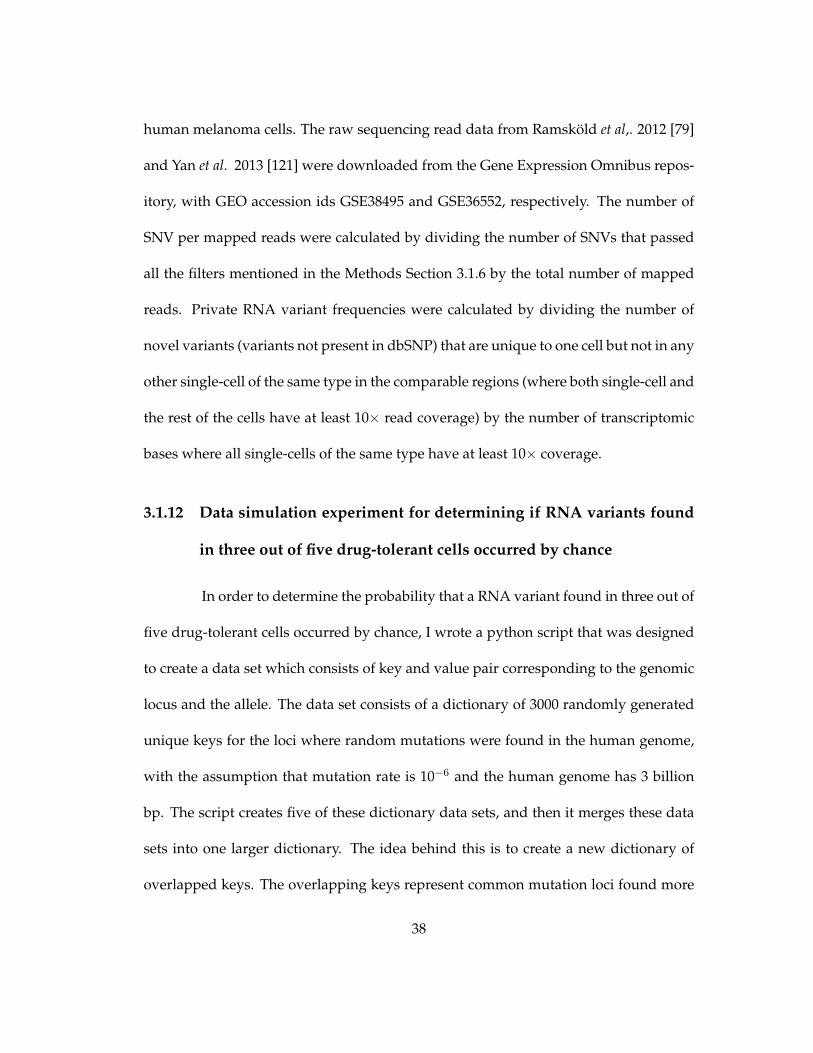
The Paclitaxel treatment paradigm was established as indicated in the dia-
gram of Fig. 3.1A. Briefly, 1×10⁶ cells were plated in 100 mm culture dishes for 24
hours, and then treated with 100 nM Paclitaxel. After 3 days, fresh 100 nM Paclitaxel-
containing media was added for another 2 days, totaling 5 days of Paclitaxel treatment.
Cells were then rinsed with PBS and maintained in drug-free culture with media re-
placement every 48 hours and clones of drug-tolerant cells were expanded by the ring
cloning technique. Cells still alive 1 day after Paclitaxel removal were considered resid-
ual cells undergoing a stress response, most of which died within the next 2-4 weeks.
The clones of cells that resumed proliferation are considered recurrent drug-tolerant
cells. The frequencies of stressed and drug-tolerant cells is calculated by dividing the
number of the counted stressed or drug-tolerant cells by the total number of cells sub-
mitted to drug treatment.
28

% c
ell
nu
mb
er
rela
tive
to
co
ntr
ol
Paclitaxel (nM)
100
75
50
25
0
MCF10A
0.0
01
0.0
1
0.1 10
10
01
C
Untreated
Stressed (5d Ptx +1day)
Drug- tolerant(5d Ptx +22d)
40X
100X
100X
200X
D MDA-MB-231-DT clone
(5d Ptx +15d)
B
MDA-MB-231
Paclitaxel (nM)
% c
ell
nu
mb
er
rela
tive
to
co
ntr
ol 100
75
50
25
0
0.0
01
0.0
1
0.1 10
10
01
IC50=0.2 nM
IC50=0.08 nM
A
5 5+1 5 +n
Ptx
Drug free
Ptx
0days
Naïve cells Ptx-Rcr cells
Single-cell (n=5-6) / populations (n>10,000) RNA- sequencing
Untreated Stressed
Drug-Tolerant(1.0±0.5e-2) (2±1e-6)
IC =0.6 nM50
IC50=7 nM
Scale Bar = 100μm
Scale Bar = 100μm
Scale Bar = 250μm
Scale Bar = 50μm
Figure 3.1: The response to Paclitaxel in cancer cells. (A) Regimen for expansion of Pa-clitaxel (Ptx) stress-tolerant cells. Highly metastatic MDA-MB-231 naıve (yellow) cellswere treated with Ptx (100nM) on Day 1 and Day 3. After 5 days, Ptx was removed andcells were left in a drug free culture. Most stressed cells arrested (red) and ultimatelydied, while rare drug-tolerant cells (orange) resumed proliferation after 10-15 daysand clones were expanded. Five single-cells per group were analyzed including beforetreatment, 1 day after Ptx removal, and from recently established (n<64) or long-termexpanded, drug-tolerant clones. Populations were analyzed from long-term expandedclones. Frequencies of surviving stressed and drug-tolerant cells observed are indi-cated between parentheses. Cell-to-cell heterogenous RNA content is indicated withvarying colors. (B) Bright field images of untreated, stressed, and drug-tolerant cells atthe indicated times after drug removal. Total magnification is indicated. (C) Paclitaxeltoxicity assays on naıve MDA-MB-231 cells (top) and MCF10A cells (bottom). GrowthInhibitory Concentrations 50% (IC50) are indicated. Data shown are the mean ± SEMfrom a quadruplicated representative experiment. (D) Bright field image of an MDA-MB-231-Ptx-tolerant clone (n<64) during single-cell collection by micromanipulation.The opening of the micropipette of roughly 20 microns is shown.
29

3.1.2 Paclitaxel toxicity assays
Cell growth of naıve or expanded recurrent drug-tolerant cells was deter-
mined as follows. Briefly, 25,000 cells were plated in each well of 12-well plates and
after 24 hour were treated with vehicle-ethanol or up to 100 nM Paclitaxel containing
media. After 4 days, cells were fixed with 10% formaldehyde and the IC50 (concen-
tration for 50% growth inhibition) was established by Giemsa staining. Cell number
was plotted as a percent of cells relative to vehicle control with standard error from 4
replicated wells used in a representative experiment.
3.1.3 Cell analysis experimental design
For the single-cells, RNA sequencing was performed for 5 naıve (untreated)
cells, 5 stressed (day 5+1 day drug free) cells, and 5 drug-tolerant cells from one clone
at early growth (5 days Ptx + 15 days drug free). Thus, the RNA-Sequencing for the
5 drug tolerant cells was from a unique clone. The drug-tolerant cells shown in the
bottom panel of Fig. 3.1B was a clone expanded from an individual cell to over 8 mil-
lion cells (>23 population cell-doublings). The population cells that were used in RNA
sequencing include 10,000 naıve MDA-MB-231 cells, 10,000 stressed cells (day 5+1
drug free, non-clonal) and 3 independent drug-tolerant clones, each with 10,000 drug-
tolerant cells. Pyrosequencing was performed for additional single-cells from different
drug-tolerant clones as well as from additional, untreated single-cells obtained as de-
scribed above.
30

3.1.4 Isolation of single-cells and cell populations, and cDNA synthesis
Five single-cells from populations of untreated, stressed, or proliferating drug-
tolerant cells obtained from single clones as indicated in Fig. 3.1A were collected as
follows. Media was removed and replaced by PBS at room temperature. Single cells
were picked within the next 10 minutes with <20 µm-diameter glass needles using
Narshige MO-188 and MN-188 hydraulic micromanipulators over an inverted micro-
scope, washed and immediately lysed in PreludeTM
Direct Lysis Module (NuGEN Tech-
nologies, Inc., San Carlos, CA) on glass-mounted microdroplets. For population anal-
yses, >10,000 cells from untreated, stressed, or drug-tolerant cells were lysed. Snap
frozen lysates were stored at -80◦C. cDNA was generated for each single-cell lysate
using the Ovation R© RNA-Seq system (NuGEN Technologies, Inc., San Carlos, CA)
per manufacturer’s recommended protocols and as described previously in Tariq et al.
[104]. For the single-cell cDNA synthesis and library preparation methods, please refer
to Appendix B.1 and Appendix B.2.
3.1.5 Quality control and mapping of the sequencing reads
The sequencing reads were subjected to a three-step quality control process.
First, the quality of the sequencing reads was evaluated with FastQC (http://ww
w.bioinformatics.babraham.ac.uk/projects/fastqc/). Then, sequencing
adapter sequences were removed from the reads using SeqPrep (https://github
.com/jstjohn/SeqPrep). In the single-cell RNA-Seq reads, the first six bases from
the 5′ appeared to have biased nucleotide usage due to the usage of random hexam-
31

ers in the first-strand cDNA synthesis. Therefore, the six bases from the 5′ end of the
sequencing reads were trimmed. No additional end-trimmings were done on sequenc-
ing reads for the population RNA-Seq and the DNA sequencing of the MDA-MB-231
cell line.
There were three types of samples for whole transcriptome analyses – single-
cells, 5-cell pooled samples, and population. The 5-cell pooled samples were gener-
ated by concatenating all the fastq files from five single-cells into one pooled sam-
ple. The preprocessed sequencing reads were aligned against the UCSC hg19 hu-
man reference genome as paired-end reads using Tophat (version 1.3.2) [108] with
default settings. Uniquely mapped reads were used for differential gene expression
analyses and SNV calling. These reads were tagged with “NH:i:1” (NH stands for
the number of reported alignments that contains the query in the current record) and
were extracted from the bam files generated by Tophat using the GNU fgrep package
(http://www.gnu.org/s/grep). PCR duplicates were removed using the rmdup
function in samtools [53]. To facilitate the identification of DNA-RNA variants, DNA
sequencing reads were mapped to the UCSC hg19 human reference genome as paired-
end reads using Bowtie2 (version 2.0.0-beta6) [47]. Read-mapping quality analysis for
5′- and 3′ read biases was performed using RSeQC (version 2.3.1) [112].
3.1.6 SNV identification
The SNVs in single-cell RNA were called using BamBam [84] with sequenc-
ing read alignment data in each BAM file format as input. Each variant was assigned
32

a confidence score according to the genotype accuracy likelihood. Variants with sup-
porting reads only in the first or last third of a read’s data were removed. Variants with
a genotype accuracy likelihood score lower than 30 were discarded, and the rest of the
variants were used in the downstream analyses only if they had passed two additonal
filters: the strand bias filter and the read alignment quality filter. A recent study had
shown that variant allele reads that were present exclusively on one strand are often
associates with false positive variant calls [50]. Therefore, I applied the strand-bias
filter to variants that had at least four supporting reads, and remove those that had
more than 90% of the supporting reads on either only the forward strand or the re-
verse strand. The read alignment quality removed variants that did not have at least
one supporting read with a base alignment quality (BAQ) score of 15. SNVs were writ-
ten in VCF (Variant Call Format) file format. The SNVs were divided into two groups:
known SNVs (those catalogued in the single nucleotide polymorphism database, db-
SNP, Build ID: 137), and novel SNVs (those not present in the dbSNP). Although the
quality of data cataloged in the dbSNP has been questioned [67] where half of the SNPs
are still candidate SNPs and have not yet been validated in a population, both novel
SNVs and dbSNP variants were analyzed in this study. Some true novel SNVs might
not be accounted for if they were mistakenly annotated as SNPs in the dbSNP.
The SNVs were filtered to find those within the exons of UCSC’s known gene
canonical transcripts, where the exon’s average mapped read coverage was greater
than 50. Each single-cell variant rate was calculated by summing the total number of
variants that pass this filter, and dividing by the total number of bases in exons with
33

average coverage greater than 50.
3.1.7 Identification of common and unique SNVs amongst single-cells and
populations of cells
To compare the SNVs between a single-cell and its corresponding popula-
tion, I first identified the comparable genomic regions where both the single-cell and
the populations of the same group have at least 10× RNA-Seq read coverage. I used
the depth function in samtools [53] to measure the read depth, extracted all the ge-
nomic locations where the read depth is at least 10, and output the results in BED file
format. I then identified the common and different SNVs between the single-cell and
the population that are within the comparable genomic regions using the --intersect
and --difference operators in BEDOPS (version 1.2.3) [69], respectively. For identify-
ing common and unique SNVs between any two single-cells, I performed all pair-wise
comparisons of single-cells in the same manner I did for comparing single-cell to pop-
ulation SNVs. I first identified comparable genomic regions where both single cells
have at least 10× RNA-Seq read coverage. Then, I identified common and different
SNVs between the two single cells that are within the comparable genomic regions.
3.1.8 Detection of DNA-RNA variants and candidate RNA variants
I used RADIA [77] to identify DNA-RNA variants and RNA-variants. DNA-
RNA variants are the SNVs that are only present in the RNA but not in the DNA. By
comparing the genomic DNA of MDA-MB-231 cell line sequencing data with RNA-Seq
34

data from single-cells, I identified the DNA-RNA variants. DNA-RNA variants were
detected for each of the three groups of single cells (untreated, stressed, and drug-
tolerant). I first identified the DNA variants that were specific to the cell line by com-
paring the cell line DNA to the human reference genome (UCSC hg19). The MDA-MB-
231 DNA data were from two sources: one from our whole genome DNA sequencing
(20×), and the other from ultra-deep exome sequencing (200×) (GEO accession num-
ber: GSE48215 [17]). Next, I identified additional DNA-RNA variants by compared
untreated RNA to human reference genome (UCSC hg19) and all the cell-line specific
variants were excluded. A subset of DNA-RNA variants were then classified as RNA
variants if there was enough read coverage in the RNA to support the variant and
enough coverage in the DNA to determine that the variant seen in the RNA was not a
DNA variant. Specifically, RNA variants must be covered by at least 10 reads, and at
least four of the reads need to support the variant. In addition, at least 10% of the RNA
reads must support the variant. I also require 10 or more reads in the cell line DNA,
and none of the reads can support the RNA variant. I identified the high-confidence
RNA variants by requiring at least 100 reads in the cell line DNA at those loci and
none of the reads can support the RNA variant. All the aforementioned parameters
were carefully selected and tested using validated DNA and RNA sequencing dataset
from tumor and matched-normal samples [77]. I continued to determine candidate
RNA variants that were newly emerged in the stressed single-cells by comparing them
to the cell line DNA, human reference, and the untreated RNA. Last, I identified RNA
variants that had only occurred in the drug-tolerant cells by comparing them to the cell
35

line DNA, human reference, untreated RNA, and stressed single-cells. I performed ad-
ditional filtering steps for all the RNA variants and removed all the RNA variants that
overlapped with SNP sites in dbSNP. I only retained RNA variants that were within the
accessible genome defined by the 1000 Genome Project Consortium [26]. To eliminate
false positive RNA variants, I used BLAT (BLAST-like alignment tool) [39] to ensure
unique mapping of reads that support any RNA variant.
3.1.9 PCR amplification for targeted SNV pyrosequencing
To validate the fidelity of sequencing platform, the Illumina HiSeq 2000, and
the mutation calling accuracy of BamBam, ten SNVs were selected for validation with
pyrosequencing using cDNA from nine different single-cells: 2 untreated cells, 2 stressed
cells, and 5 drug-tolerant cells. PCR primers and internal sequencing primers were de-
signed using PyrosequencingTM
Assay Design Software (Biotage, Uppsala, Sweden)
and were synthesized by IDT (Coralville, IA). Amplicons were designed to be 100-
200 bp long. Amplicons used in pyrosequencing were amplified from cDNA that was
used to generate the HiSeq libraries. Each PCR reaction in a 50 µL volume contained
the following: 5 ng cDNA, 0.1µM of each forward and reverse primer, 2.0 mM MgCl2,
200 µM dNTPs, 75 mM Tris-HCl (pH 8.0), and 1.5 U of Titanium R© Taq polymerase
(Clontech Laboratories, Inc., Mountain View, CA). The amplification was performed in
a Gene Amp PCR System 9700 Thermal Cycler (Applied Biosystems, Foster City, CA)
under the following conditions: 95◦C for 5 min, followed by 25 cycles of denaturing at
95◦C for 30 seconds and annealing at the primer specific annealing temperature for 30
36

seconds, and a final extension at 72◦C for 4 min.
3.1.10 Validating SNVs with pyrosequencing
Biotinylated PCR amplicons (50 µL) were immobilized onto streptavidin-coated
paramagnetic beads (Dynabeads M-280-streptavidin; Dynal AS, Oslo, Norway) in 2×
binding wash buffer (10mM Tris-HCl pH 7.5, 1mM EDTA, 2M NaCl) and incubated
at room temperature for 15 min. The immobilized PCR product was treated with 100
µL of 20 mM NaOH for 5 min to denature into single-stranded DNA. Single-stranded
DNA attached to the beads was washed twice with 1× annealing buffer (200 mM mag-
nesium acetate, 0.1 M Tris-acetate, pH 7.75). Immobilized single-stranded DNA was
resuspended in 20 µL of 1x annealing buffer and 5 µL of sequencing primer at 10 µM.
The sequencing primer was annealed to single-stranded template at 95◦C for 2 min
and then 50◦C for 8 min. Primed single-stranded template was sequenced using the
PyroMark Q24 system (Qiagen, Hilden, Germany). SNV quantification was performed
using the PyroMark Q24 1.010 software (Qiagen, Hilden, Germany).
3.1.11 Private RNA variant frequencies and SNV per mapped reads in nor-
mal human single-cells and cancer cells
To compare our RNA-Seq variant calls and variant calls using other single-
cell RNA-Seq dataset that used normal human cells and other cancer cells, I performed
SNV analysis with two other published single-cell RNA-Seq datasets, including single-
cells collected from human early embryos, human embryonic stem cells (hESCs), and
37
human melanoma cells. The raw sequencing read data from Ramskold et al,. 2012 [79]
and Yan et al. 2013 [121] were downloaded from the Gene Expression Omnibus repos-
itory, with GEO accession ids GSE38495 and GSE36552, respectively. The number of
SNV per mapped reads were calculated by dividing the number of SNVs that passed
all the filters mentioned in the Methods Section 3.1.6 by the total number of mapped
reads. Private RNA variant frequencies were calculated by dividing the number of
novel variants (variants not present in dbSNP) that are unique to one cell but not in any
other single-cell of the same type in the comparable regions (where both single-cell and
the rest of the cells have at least 10× read coverage) by the number of transcriptomic
bases where all single-cells of the same type have at least 10× coverage.
3.1.12 Data simulation experiment for determining if RNA variants found
in three out of five drug-tolerant cells occurred by chance
In order to determine the probability that a RNA variant found in three out of
five drug-tolerant cells occurred by chance, I wrote a python script that was designed
to create a data set which consists of key and value pair corresponding to the genomic
locus and the allele. The data set consists of a dictionary of 3000 randomly generated
unique keys for the loci where random mutations were found in the human genome,
with the assumption that mutation rate is 10−6 and the human genome has 3 billion
bp. The script creates five of these dictionary data sets, and then it merges these data
sets into one larger dictionary. The idea behind this is to create a new dictionary of
overlapped keys. The overlapping keys represent common mutation loci found more
38

than one cell. When an overlap happens during the merging of the five data sets, all
values that match that key will be appended, as a list of values associated with the same
key position. The length of the list indicates how many single-cells have mutation at a
particular locus. The generation of five dictionary data sets was repeated 100 times to
determine the probability that a RNA variant occurs in the same locus in three of five
single-cell.
3.2 Results
3.2.1 Generation of a Paclitaxel tolerance paradigm in metastatic human
cancer cells and isolation of single-cells
To investigate the molecular events associated with cancer cells response to
drug-treatment followed by drug withdrawal potentially associated with drug toler-
ance, cells from the Paclitaxel-sensitive (IC50 < 10nM) metastatic human breast cancer
cell line MDA-MB-231 [7] were exposed to Paclitaxel (100 nM) according to the reg-
imen diagrammed in Fig. 3.1A. After 5 days of drug exposure, most cells had died.
Residual cells alive 1 day after Paclitaxel removal were considered to be a “stressed”
cell population, and the majority of these cells underwent apoptosis within 2-4 weeks.
A small number of residual stressed cells resumed proliferation and established clones,
and such cells were considered to be “drug-tolerant” cells (Fig. 3.1B). A drug-toxicity
curve was also constructed using a range of Paclitaxel concentrations (Fig. 3.1C). The
IC50 was ∼7 nM with ∼20% of viable cells.
39

3.2.2 Early drug tolerance dynamics analysis at the single-cell Level
To better understand the early events occurring soon after the onset of pro-
liferation of the rare drug-tolerant cells, I conducted whole transcriptome sequencing
analyses at the single cell level for untreated, stressed and drug-tolerant (collected from
a proliferating clone at less than six cell divisions) populations. Five single cells were
isolated from each treatment group by picking single cells with glass needles using
micromanipulators over an inverted microscope and immediately placing each cell in
lysis buffer (Fig. 3.1D). For whole population analyses, >10,000 pooled cells were col-
lected from each group. We used a linear RNA amplification system for the whole
transcriptome sequencing [44]. The use of such a system prevents reproduction of an
error introduced in earlier amplification cycles, a concern in exponential amplification
systems.
I generated similar average numbers of sequencing reads for individual sin-
gle cells and each cell population, 77 million reads and 100 million reads, respectively
(Appendix, Table A.1). With a somewhat similar number of sequencing reads, RNA-
Seq from single cells generated a much greater sequencing depth than it did for cell
populations. On average, there were 117 times coverage for single cells and 23 times
depth of coverage for cell populations. By contrast, RNA sequencing reads of the cell
populations covered 5.4 times more genomic regions compared with that of a single
cell (Appendix, Table A.2)). This result indicates that with a comparable number of
reads generated, the single-cell RNA sequencing generates less coverage than the cell
40

population RNA sequencing, with the consideration that each individual cell may be
expressing only a fraction of the genes that are expressed in the bulk population. In-
deed, the fraction of genes expressed above 1 RPKM (or 1 adj-RPKM; Methods Section)
in single cells compared with their bulk populations is only 20%, whereas pooling and
mapping the reads from each cell within the same group resulted in a much greater ap-
proximation of the number of genes expressed above the same threshold (Appendix,
Table A.3).
3.2.3 The novel RNA variants in single-cells are not the major alleles found
in population
One of the main goals of performing single-cell sequencing is to exam the ge-
netic heterogeneity within a cell population. I suspect that each single-cell carry some
private variants that are not present in most cells in a population. The single-cell pri-
vate SNVs may consist of somatic mutations propagated from DNA or RNA variants
that are introduced by processes such as RNA editing or errors in transcription. RNA
variants in this study are supported by sufficient evidence that they are only present
in the RNA sequencing reads and not in any of the DNA sequencing reads. Novel
SNVs are variants that are not present in dbSNP (The Single Nucleotide Polymorphism
Database) [92]. Variants in dbSNP are common SNPs that are found in at least 1% of
the human population; therefore, they are not rare variants. Most of the novel SNVs
identified in single cells were not the major alleles at the cell population level, despite
the fact that there were 2-10 times more total SNVs found in cell populations than in
41

single cells (Appendix, Table A.4) and that SNVs detected in the cell populations cover
more genomic regions than those from single cells. Within comparable genomic re-
gions where there was at least 10× depth of coverage, there were about 6 times fewer
SNVs detected at the population level than in single cells. In most cases, the novel
variants in single cells were not the major variants in the cell populations whereas
most dbSNP variants were shared between single cells and population cells (Fig. 3.2).
Since the number of RNA variants called could be directly related to the depth of se-
quencing, therefore, I also compared the amount of SNVs detected in both single cells
and cell populations at various depth of read coverage thresholds (Fig. 3.3)). The num-
ber of SNVs was normalized by the number of genomic bases with the corresponding
depth of read coverage to ensure that the difference in the number of SNVs was not
due to differences in genome coverage breadth. Strikingly, many SNVs were found
at genomic regions with less than 60x read coverage, while the genomic regions with
deeper read coverage do not present more SNVs. Moreover, more novel (non-dbSNP)
variants were detected from single cells than from populations regardless of the depth
of coverage. In contrast, more dbSNP variants were detected at the population-cell
level compared to the single-cell level at all depths of coverage. Additionally, I ob-
served that with a similar number of uniquely mapped reads for single-cells vs. pop-
ulations, the latter have only slightly more transcriptomic bases with reads at lower
depth of coverage but this difference is minimal or even reverts in regions with higher
depth of coverage (Fig. 3.4). Thus with a similar amount of resources and effort RNA
sequencing from single cells has increased sensitivity to detect novel SNVs which are
42

not apparent from RNA-Seq from populations.
3.2.4 RNA variation is similar in drug tolerant cells and other cancer cells
Cells from cancer cell-line typically contain more SNVs compared to normal
cells. Here, I compared the RNA variant frequencies in single-cells in this study with
those found in single-cells with normal human single-cells and human cancer cell-line
single-cells from two recently published dataset. I also examined the amount of RNA
variants that are shared between any two single-cells of the same type to show the
degree of heterogeneity in single-cells.
To compare our RNA-Seq variant calls and variant calls using other single-cell
RNA-Seq datasets that used normal human cells and other cancer cells, I performed
SNV analysis with two other published single cell RNA-Seq datasets using the SNV
analysis method described in the Methods Section, including single cells collected from
human early embryos [121], human embryonic stem cells (hESCs) [121, 79], and human
melanoma cells [79]. To ensure that these datasets are comparable, I first examined the
number of SNV per mapped read in each sample in each dataset. The number of SNV
per mapped reads were comparable between single-cells from this study and those
from human early embryos, hESCs, and human melanoma cells (Table 3.4).
With the single-cell in this study, I measured the number of novel variants
shared between any two cells in the genomic regions where each single cell has at
least 10x read coverage. Prior to Paclitaxel treatment, untreated single cells shared
about 30% of novel variants (not present in the DNA) with any other untreated cell.
43

UNT1
UNT2
UNT3
UNT4
UNT5
S1
S2
S3
S4
S5
DT1
DT2
DT3
DT4
DT5
0 2000 4000 6000 8000 10000
Number of SNVs
SNVs only in single cell Shared b/w single cell & population SNVs only in population
Novel Novel Novel dbSNP dbSNP dbSNP
Sin
gle
ce
ll S
ing
le c
ell
Figure 3.2: The majority of novel variants in single-cells was unique to the single-cells (gray bars), and these single-cell novel variants were not the majority alleles atthe population level. Most of the common variants that were present in a single-celland its corresponding population were known variants catalogued in dbSNP (orangebars). A relatively small number of variants SNVs that were unique in the populationthat were not the alleles found in the single-cells (green bars). An insignificantly smallnumber of dbSNP variants that were unique to single-cell, which could be due to thedifferences between cell-line DNA and the normal human DNA.
44

Figure 3.3: The number of SNVs detected in single cells and population regions cellsat various depth of read coverage. The number of SNVs was normalized by the num-ber of genomic bases with the corresponding depth of read coverage to ensure thatthe difference in the number of SNVs was not due to the difference in the breadth ofgenome coverage. Many SNVs were found at genomic regions with less than 60x readcoverage, while the genomic regions with deeper read coverage do not present moreSNVs
45

Figure 3.4: Number of bases with reads at various depth of coverage. The number ofbases with reads in different genomic regions presenting low to high depth of sequenc-ing was plotted to detect biases in coverage/depth of sequencing between single cellsvs. cell population RNA-Seq data. 46

0 10 20 30 40 50
01
00
00
30
00
05
00
00
Exon coverage at >= 50x (megabases)
Hig
hco
nfid
en
ce n
on
refe
ren
ce S
NV
s
Untreated
Stressed
Drug tolerant
Single cell
Population
Hig
h-c
on
fid
en
ce
no
ve
l S
NV
s
Exon coverage at >=50x (megabases)
Figure 3.5: Novel SNV rates of single-cells and population cells from different treat-ment conditions. There were highly disparate variant rates within the different treat-ment conditions. Single cells from the stressed cell group (red circle) contained about2x more novel SNVs than did single untreated cells or single drug-tolerant cells. Drug-tolerant cells had a variant rate similar to that of untreated cells. Untreated: bluesquare, Stressed: red circle, Drug-tolerant: green triangle, Single-cell: Unfilled shapes,Population: Filled shapes.
47

0.00
0.25
0.50
0.75
1.00
Drug tolerant Stressed Untreated
tmp$V1
tmp$V2
c("green", "
Drug tolerant Stressed Untreated
tmp$V1
c("green", "
Drug-tolerant Stressed Untreated Drug-tolerant Stressed Untreated
100%
75%
50%
25%
0%
% S
NV
s s
ha
red
be
twe
en
an
y 2
ce
lls Known SNVs Novel SNVs
Figure 3.6: The amount of novel SNVs and known SNPs shared between single-cellsof the same treatment group. Novel variants are the ones that are not present in thedbSNP database. The bar plot shows the average percent of novel shared variantsbetween any two single-cells for each group. Most known variants present in one cellwere present in another cell of any different group. The bar plot shows the average per-cent of known (dbSNP) shared variants between any two single-cells for each group.
48

Figure 3.7: The fraction of novel variants shared between any two single-cells. A highheterogeneity is observed between single-cells within and between groups. UNT: un-treated cells, S: stressed cells, DT: drug-tolerant cells.
49

Upon exposing the cells to 5 days of Paclitaxel treatment, the stressed cells appeared
to have accumulated additional novel variants that were not previously present in the
untreated cells (Fig. 3.5). On average, stressed cells shared 24% of novel variants with
each other, but fewer than 20% novel variants in stressed cells were found in any single
cell in either the untreated- or drug-tolerant group (Fig. 3.6 and Fig. 3.7). Although
drug-tolerant cells were clonal, they shared similar percentages of novel SNVs among
themselves compared to untreated single cells, about 25-45%. Drug-tolerant cells and
untreated cells shared about 30% of novel variants. Overall, most novel variants in
one cell were unique (Fig. 3.6 and Fig. 3.7), and these novel variants could arise from
DNA-RNA transcription error or RNA editing. Furthermore, all single cells shared
more than 75% of the known dbSNP variants with any other cell of any of the three
groups (Fig. 3.6). This shows that those variants catalogued in the dbSNP are already
present in the DNA.
Single-cell RNA-Seq from human early embryos including oocytes, 2-cell em-
bryos, and 4-cell embyros shows that as cells go through each cell division, the num-
ber of novel variants progressively increases (Table 3.3). The polymorphism frequen-
cies from the other two datasets were 3.3e-4/bp for hES cells, 7.0e-4/bp for the cancer
cells [79]; 1.4e-4/bp for 2-cell stage human embryos and 4.7e-4/bp for 4-cell stage hu-
man embryos [121] (Fig. 3.9). Importantly, the frequency of cell-specific SNVs in this
study is about 4.7e-4/bp, which is higher than the polymorphism frequencies of nor-
mal human cells but comparable to that found in cancer cells from Ramskold et al [79]
(Table 3.4). Moreover, although neither untreated cells nor long-term stressed cells
50

are monoclonal, the frequency of cell-specific SNVs in the latter is greater, suggest-
ing either that cellular stress may increase errors in transcription such as when RNA
polymerase inserts the wrong base into the transcript or RNA editing events.
To identify the RNA-editing events, one needs to compare DNA and RNA
from the same cell. However, it is not yet possible to sequence whole genome DNA
and whole transcriptome RNA simultaneously from a single cell. To gain insight into
whether the single-cell RNA variants in this study result from RNA editing, I com-
pared the base substitution patterns between our single-cell RNA variants and other
previously published RNA editing events. A-to-G substitution is typically the most fre-
quently occurring RNA variants detected in other RNA editing studies [6, 41, 73, 75].
Curiously, I found that after T-to-C, A-to-G substitutions were the more frequent sub-
stitutions identified in our study (Fig. 3.8A). In addition, most of the A-to-G RNA
variants observed in the single cells occurred in the intronic and untranslated regions
(UTRs) (Fig. 3.8C), in agreement with previous A-to-G RNA editing studies [30, 70, 73].
One way to confirm that these A-to-G variants are indeed resulting from RNA editing
events is to conduct ADAR (adenosine deaminase acting on RNA) knockdown exper-
iment. ADAR is an enzyme that is known to mediate adenosine to inosine (A-to-I)
editing, where inosine is interpreted as guanosine (G) during translation [6].
51

B
DNA reads
RNA reads
DNA variants present in cell line DNA-RNA variants
Discard
Final List of RNA variants
UCSC hg19 reference genome
EXON
5% INTRAGENIC
1%
INTRON
59%
UTR_3_PRIME
29%
UTR_5_PRIME
6%
Untreated
EXON
2% INTRAGENIC
1%
INTRON
51%
UTR_3_PRIME
37%
UTR_5_PRIME
9%
Drug tolerant
EXON
9%
INTRAGENIC
1%
INTRON
46%
UTR_3_PRIME
31%
UTR_5_PRIME
13%
Untreated Stressed Drug tolerant
in dbSNP
in black-listed region of the 1000
genome project
at least 10 RNA reads, where at least 4
RNA reads and at least 10% of the RNA
reads support the variant
at least 10 DNA reads and none of them
support the variant
Untreated Stressed Drug-tolerant
Fraction of expressed variants in genic region
0% 10% 20% 30% 40%
Ty
pe
of
su
bs
titu
tio
n
A > C
A > G
A > T
C > A
C > G
C > T
G > A
G > C
G > T
T > A
T > C
T > G
Typ
e o
f su
bstitu
tio
n
Fraction of expressed variants in genic region
A > C
A > G
A > T
C > A
C > G
C > T
G > A
G > C
G > T
T > A
T > C
T > G
Untreated Stressed Drug-tolerant
0% 10% 20% 30% 40%
A
C
Figure 3.8: RNA variants identified at the single-cell level. (A) The distribution of the12 RNA variants at the single-cell level showed that the most abundant types of RNAvariants were A-to-G and T-to-C. (B) Multiple filters were applied to identify candi-date RNA variants. Any SNV in the DNA of the cell line that did not match the humangenome reference was considered to be a DNA variant specific to the MDA-MB-231cell line. DNA-RNA variants were those in which the base call in the single-cell RNAreads differed from that in the cell line DNA reads, and the base call in the referencegenome agreed with that in the cell line DNA. The DNA-RNA variants were first sub-jected to two filters that removed all known variants and variants that were not withinthe accessible genome defined by the 1000 Genome Project Consortium. Two filterswere applied to the rest of the DNA-RNA variants to ensure that the RNA variantshave enough sequencing reads to support an RNA variant call. (C) The distributionof A-to-G RNA variants relative to gene boundaries. The majority of the A-to-G RNAvariants were clustered in non-coding regions including introns and 5′ and 3′ untrans-lated regions (UTRs).
52

3.2.5 RNA variants found only in drug-tolerant cells are involved in micro-
tubule stabilization and organization
One of the goals of this study is to identify RNA variants that reside in genes
associated with Paclitaxel resistance. Although it is challenging to elucidate the pre-
cise role of these alterations in Paclitaxel resistance, the identification of these RNA
variants at the single-cell level provides new opportunities for understanding tumor
heterogeneity and treatment of cancer.
The DNA-RNA variants and RNA variants in this study were identified using
a somatic mutation caller, RADIA [77]. In any single-cell, there were approximately
5,000 cell-line specific SNVs that were different from the human reference genome
(hg19), and about 63,000 cell-line specific SNVs were found in the population cells
of all three groups. After removing all cell line-specific variants, the remaining DNA-
RNA variants that passed all additional filters were considered to be RNA variants
(Fig. 3.8B). One of the filters was for removing RNA variants that overlap with dbSNP.
To accurately identify RNA variants, the most ideal way is to sequence both the tran-
scriptome and the genome with great depth from the same sample and compare the se-
quence differences between the ”matched” RNA and DNA. Since it is not yet possible
to sequence both the genome and transcriptome from a single cell, therefore, I followed
a commonly used method by other studies that used only RNA-Seq to identify RNA
variants – mapping the RNA-Seq reads to a (nonmatched) genomic reference sequence,
and remove the known SNPs to eliminate potential germline variants [78, 75]. An ad-
53
ditional filter was applied to remove all the RNA variants that reside in reads that were
mapped to inaccessible sites in the genome defined by the 1000 Genomes Project [26].
The inaccessible sites mainly consist of segmental sequence duplications and high-
copy repeats. Sequencing reads are often incorrectly aligned to the inaccessible sites,
and leading to false positive variant calls [26]. The parameters being used in selecting
the RNA variants from the DNA-RNA variants (Fig. 3.8B) come from multiple param-
eter optimization experiments to achieve a maximum specificity while maintaining an
acceptable balance between specificity and sensitivity. These parameters allowed RA-
DIA to achieve a 98% specificity/84% sensitivity and a 99% specificity/85% sensitivity
balance in two independent TCGA validation experiments on data collected from over
500 patients [77].
The accuracy of the RNA variant calls was further validated through pyrose-
quencing of 10 randomly selected SNVs (Table 3.1). I validated these SNVs using a new
set of single-cells from independent groups of the untreated MDA-MB-231 cell line and
different drug tolerant clones. All the SNVs identified by pyrosequencing agreed with
the ones detected using Illumina HiSeq 2000.
Each untreated cell had an average of 526±92 RNA variants, and about 84±9
of them were high-confidence rare RNA variants where there were at least 100 DNA
reads and none of them support the RNA variants. After exposing the cells to Pacli-
taxel treatment for five days, there were 110±92 new RNA variants that were found in
stressed cells; 31±15 are high-confidence rare RNA variants, and none were detected
in any of the untreated cells. Drug-tolerant cells contained about 94±52 new RNA
54

variants that were not previously detected in untreated and stressed cells, and 29±15
were high-confidence rare RNA variants.
As described in Section 2.4, Paclitaxel blocks the G2/M phase in cells by sta-
bilizing the microtubules such that the cell cannot form the normal mitotic apparatus
for cell division. Therefore, any mutation found in genes that encode for proteins as-
sociated with microtubule functions and cell-cycle regulation is relevant and impor-
tant for understanding how it can potentially lead to Paclitaxel-resistance. There were
38 RNA variants in at least three out of five drug-tolerant cells that were not present
in any untreated or stressed cells and were not detected in the population sequenc-
ing (Table 3.2). I did a data simulation experiment and concluded that these 38 RNA
variants did not simply occur in three of the five cells by chance (see the Methods
section *** put ref). Interestingly, four of the 38 RNA variants resided in genes that
encode for proteins involved in microtubule stabilization and organization (PCM1,
NUDCD3, RAPGEF4, and KIAA1671) and two of them were located in genes that were
implicated in Paclitaxel resistance (RAPGEF4 and AMOTL1) (Table 3.5). One of the
variants present in all five drug-tolerant single-cells, was located on chromosome 8
(chr8:17885150) and represented a missense mutation in the PCM1 gene (pericentrio-
lar material 1). PCM1 encodes a protein essential for anchoring microtubules to the
centrosome [25, 19]. PCM1 is involved in microtubule stabilization and assembly of
centrosomal proteins [19]. Centrosome function is essential for completion of inter-
phase and mitosis [109] and aberrant centrosomal activity has been implicated in tu-
mor progression [56, 13]. The two other missense mutation were found in genes that
55
were involved in microtubule organization and stabilization during mitosis: RAPGEF4
and NUDCD3. RAPGEF4, Rap guanine nucleotide exchange factor 4, was previously
shown to interact with protein complexes that were involved in microtubule polymer-
ization and organization [59, 88]. RAPGEF4 protein is also known as Exchange Protein
Directly Activated by cAMP 2 (EPAC2) and is one of the binding partners of MAP1A
(microtubule-associated protein 1A) [59]. MAP1A is known to promote elongation
and nucleation of tubulin [74]. The gene NUDCD3 encodes the NudCL (nuclear dis-
tribution gene C-like) protein. NudCL has been shown to interact with the dynein
complex, a minus-end-directed microtubule motor [128], and is required for mitosis
and cytokinesis [127]. Depletion of NudCL causes loss of dynein function, which
leads to insufficient recruitment of γ-tubulin to spindle poles and mislocalization of
the dynein complex during mitosis [128]. The last mutation listed in Table3.5 resides
in the gene KIAA1671 that encodes a protein involved in mitosis and chromosome seg-
regation [71, 20]. Antibodies against this protein were found in sera of breast cancer
patients that had developed auto-antibodies [22].
The aforemented gene RAPGEF4 was also implicated in Paclitaxel resistance.
Depletion of RAPGEF4 showed a significant increase in Paclitaxel-induced microtubule
stabilization in Paclitaxel-resistant A549-T12 lung carcinoma cells and partially restored
Paclitaxel sensitivity in a previous study [3]. Another mutation was found in the
3′-UTR of AMOTL1. AMOTL1 protein was known to interact with the Hippo path-
way component TAZ, which was implicated in Paclitaxel resistance in breast cancer
cells [46, 16].
56

SmartSeq_hESC1SmartSeq_hESC2SmartSeq_hESC3SmartSeq_hESC4SmartSeq_hESC5SmartSeq_hESC6SmartSeq_hESC7SmartSeq_hESC8
SmartSeq_Melanoma_SKMEL5_cell1SmartSeq_Melanoma_SKMEL5_cell2SmartSeq_Melanoma_SKMEL5_cell3SmartSeq_Melanoma_SKMEL5_cell4SmartSeq_Melanoma_UACC257_cell1SmartSeq_Melanoma_UACC257_cell2SmartSeq_Melanoma_UACC257_cell3
Taxol_DT1Taxol_DT2Taxol_DT3Taxol_DT4Taxol_DT5Taxol_S1Taxol_S2Taxol_S3Taxol_S4Taxol_S5
Taxol_UNT1Taxol_UNT2Taxol_UNT3Taxol_UNT4Taxol_UNT5
YAN_2 cell embryo1 C1YAN_2 cell embryo1 C2YAN_2 cell embryo2 C1YAN_2 cell embryo2 C2YAN_2 cell embryo3 C1YAN_2 cell embryo3 C2YAN_4 cellembryo2 C1YAN_4 cellembryo2 C2YAN_4 cellembryo2 C3YAN_4 cellembryo2 C4YAN_4 cellembryo3 C1YAN_4 cellembryo3 C2YAN_4 cellembryo3 C3YAN_4 cellembryo3 C4
YAN_hESC1YAN_hESC2
YAN_Oocyte1 C1YAN_Oocyte1 C2YAN_Oocyte1 C3
0e+00 5e 04 1e 03
tmp$Variant_frequency
tmp$Single_cell
tmp$Cell_type
2 Cell_Embryo
4 Cell_Embryo
hESC
Melanoma_Cell_Line
Oocyte
Taxol_Drug_tolerant
Taxol_Stressed
Taxol_Untreated
Cell Type
SNV frequency
R
am
skö
ld e
t a
l., 2
01
2 M
DA
-MB
-23
1 Y
an
et a
l., 2
01
3
Figure 3.9: Comparing single-cell SNV frequencies between cells from normal humancells and cancer cell line cells. The Illumina sequencing platform is quite low (<0.4%[76]), therefore, I expect a very small number of SNVs that are due to sequencing error.However, it is the important to determine if the amount of SNVs found in the single-cells in this study are comparable to that found in other single-cell RNA-Seq studiesthat used the same sequencing platform. Here, I compared single-cell SNV frequenciesbetween cells from normal human cells and cancer cell line cells. The single-cell SNVfrequencies are calculated by dividing the number of private novel SNVs in a single-cell by the total number of novel SNVs in that cell. Private novel SNVs are uniqueSNVs only present in the single-cell and not in any other single-cell of the same typetype. I utilized the single-cell RNA-Seq data from Yan et al. 2013 [121] including threeoocytes, one pair of 2-cell embryo cells, and two sets of four single-cells from a 4-cell embryo. From Ramskold et al. 2012 [79] single-cell RNA-Seq dataset, I analyzedtwo sets of single-cells from two different melanoma cancer cell lines (UACC257 andSKMEL5), and eight human embryonic stem cells.
57

Locus Cell IDs HiSeq variantcalls
Pyrosequencingresults
chr17:33478229DT-cell #4DT-cell #9B.1DT-cell #9B.2
A-to-T A-to-T
chr3:170078232
DT-cell #1DT-cell #2DT-cell #3DT-cell #9B.2
G-to-A G-to-A
chr17:6917703DT-cell #1DT-cell #2DT-cell #9B.2
G-to-A G-to-A
chr10:27459670 DT-cell #1DT-cell #9B.1 C-to-T C-to-T
chr13:76378459S-cell #1S-cell #2DT-cell #3.1
T-to-C T-to-C
chr16:2815237DT-cell #2DT-cell #4DT-cell #9B.2
T-to-G T-to-G
chr3:196612295 DT-cell #1DT-cell #9B.1 G-to-T G-to-T
chr3:196769982
S-cell #1S-cell #2S-cell #3DT-cell #3.1
G-to-C G-to-C
chr16:33963248UNT-cell #4UNT-cell #5UNT-cell #6
T-to-C T-to-C
chr9:33625096 UNT-cell #3UNT-cell #6 T-to-C T-to-C
Table 3.1: SNV validation using pyrosequencing. Ten randomly selected SNV callswere tested in single-cells from all three groups (untreated, stressed, and drug-tolerant), and all were confirmed by pyrosequencing. The variant calls are made byusing the Allele Quantification (AQ) Pyrosequencing Assay in the PyroMark Q24 1.010software. Cells with ID number greater than 5 are from repeated drug-treatment ex-periments. DT: Drug-tolerant, S: Stressed, UNT: Untreated.
58

Locus Gene affected Mutation type Gene Ontologychr1:54232975 TMEM48 3′-UTR RNA localization and protein transportchr1:54269670 TMEM48 Missense RNA localization and protein transportchr2:128744486 SAP130 Missense Chromatin organization and regulation of transcriptionchr2:141816502 LRP1B Missense Receptor-mediated endocytosischr2:166626700 GALNT3 Missense Glycoprotein biosynthetic processchr2:173916571 RAPGEF4 Missense Ras-like GTPaseschr2:55201845 RTN4 Missense Negative regulation of anti-apoptosischr2:55200973 RTN4 Missense Negative regulation of anti-apoptosischr2:55200710 RTN4 Missense Negative regulation of anti-apoptosischr3:45007193 ZDHHC3 Intron Transition metal ion bindingchr3:63601583 SYNPR 3′-UTR cytoplasmic membrane-bounded vesiclechr3:185211018 ZDHHC3 Missense transition metal ion bindingchr4:27010057 STIM2 Misense Ion transportchr5:139908435 ANKHD1 Missense Negative regulation of translationchr6:7882933 MUTED/TXNDC5 Missense/Silent Protein-disulfide isomerasechr6:8015778 MUTED/TXNDC5 Missense/Silent Protein-disulfide isomerasechr6:76412735 SENP6 Missense Protein catabolic processchr6:122734789 HSF2 Missense Regulation of transcriptionchr7:44425714 NUDCD3 Missense Protein binding and maintain the stability of dynein intermediate chainchr7:93592725 BET1 3′-UTR Vesicle-mediated transportchr7:115894125 TES Intron Focal adhesionchr7:138822678 TTC26 Missense Cilium assemblychr8:17885150 PCM1 Missense Microtubule cytoskeleton organizationchr9:95068105 NOL8 Missense Positive regulation of cell growthchr9:95072953 NOL8 Misense Positive regulation of cell growthchr9:123555243 FBXW2 Missense Protein catabolic processchr10:12199974 SEC61A2 Missense Intracellular protein transportchr10:71977528 PPA1 Intron Phosphorus metabolic processchr11:83182669 DLG2 Missense Cytoskeletonchr11:94607183 AMOTL1 3′-UTR Cell-cell junctionchr12:27542113 ARNTL2 Missense Regulation of transcriptionchr12:42792740 PPHLN1 Stop Lost Epithelial cell differentiationchr12:69743928 LYZ Silent Lysozyme activitychr13:21044267 CRYL1 Intron Fatty acid metabolic processchr15:89021827 MRPS11 3′-UTR DNA damage responsechr17:64208161 APOH 3′-UTR Negative regulation of endothelial cell proliferationchr:19:46253959 AC074212.3 Silent Uncharacterized proteinchr22:25592835 KIAA1671 3′-UTR Uncharacterized protein
Table 3.2: This table shows the 38 novel RNA variants that are unique to the drug-tolerant single-cells, and they are found in at least three of out of the five drug-tolerantcells. These variants reside in genes with a wide variety of molecular functions, includ-ing DNA binding, catalytic activity, enzymatic regulator activity, transcription factoractivity, receptor activity, structural molecule activity, and transporter activity.
59

Cell1 and cell2 comparisonSharednovelvariants
Novelvariantsonly incell1
Novelvariantsonly incell2
%Novelsharedin cell1
%Novelsharedin cell2
%Privatevariantsin cell1
%Privatevariantsin cell2
Oocyte1-C1 & Oocyte1-C2 2441 721 565 77.20% 81.20% 22.80% 18.80%Oocyte1-C1 & Oocyte1-C3 2277 672 472 77.21% 82.83% 22.79% 17.17%Oocyte1-C2 & Oocyte1-C3 2289 566 493 80.18% 82.28% 19.82% 17.72%2-Cell-Emb1-C1 & Emb2-C1 2455 732 827 77.03% 74.80% 22.97% 25.20%2-Cell-Emb1-C1 & Emb2-C2 2580 740 953 77.71% 73.03% 22.29% 26.97%2-Cell-Emb1-C1 & Emb3-C1 2290 813 1006 73.80% 69.48% 26.20% 30.52%2-Cell-Emb2-C1 & Emb2-C2 2546 821 934 75.62% 73.16% 24.38% 26.84%2-Cell-Emb2-C1 & Emb3-C1 2242 888 1000 71.63% 69.15% 28.37% 30.85%2-Cell-Emb2-C2 & Emb3-C1 2323 1012 997 69.66% 69.97% 30.34% 30.03%4-Cell-Emb1-C1 & Emb1-C2 2747 3548 3833 43.64% 41.75% 56.36% 58.25%4-Cell-Emb1-C1 & Emb1-C4 2406 3088 3274 43.79% 42.36% 56.21% 57.64%4-Cell-Emb1-C2 & Emb1-C4 2304 3287 3075 41.21% 42.83% 58.79% 57.17%4-Cell-Emb2-C1 & Emb2-C1 2396 2759 2472 46.48% 49.22% 53.52% 50.78%4-Cell-Emb2-C1 & Emb2-C3 2395 2862 1524 45.56% 61.11% 54.44% 38.89%4-Cell-Emb2-C1 & Emb2-C4 2439 2906 2552 45.63% 48.87% 54.37% 51.13%4-Cell-Emb2-C2 & Emb2-C3 2317 2634 1627 46.80% 58.75% 53.20% 41.25%4-Cell-Emb2-C2 & Emb2-C4 2446 2791 2812 46.71% 46.52% 53.29% 53.48%4-Cell-Emb2-C3 & Emb2-C4 2373 1708 2792 58.15% 45.94% 41.85% 54.06%4-Cell-Emb3-C1 & Emb3-C2 2555 1713 2895 59.86% 46.88% 40.14% 53.12%4-Cell-Emb3-C1 & Emb3-C3 2370 1572 1514 60.12% 61.02% 39.88% 38.98%4-Cell-Emb3-C1 & Emb3-C4 2663 1872 2489 58.72% 51.69% 41.28% 48.31%4-Cell-Emb3-C2 & Emb3-C3 2333 2623 1445 47.07% 61.75% 52.93% 38.25%4-Cell-Emb3-C2 & Emb3-C4 2598 2961 2390 46.74% 52.09% 53.26% 47.91%4-Cell-Emb3-C3 & Emb3-C4 2433 1499 2160 61.88% 52.97% 38.12% 47.03%
Table 3.3: The number of private novel RNA variants increases with the number of celldivision. This table shows the novel RNA variants found in single-cells of early humanembryos from Zang et al. 2013 dataset. The number of private RNA variants found insingle-cell increases with the number of cell-division, from oocyt (1-cell stage), 2-cellstage, and 4-cell stage. Here, oocytes from the same individual are compared and thenumber of private RNA variants in a single-cell is around 600. After one round of celldivision, the number of private RNA variants in a single-cell increased by 54% to about900. After two rounds of cell division, the number of private RNA variants increasedto about 2,500 (a 328% increase from the one-cell stage). Emb: Embryo.
60

Single cell
Single-cellPrivate RNA
variantfrequency
Private RNAvariant
frequency ratio(cell-line vs
humanoocytes)
Avg. Numberof SNV per
mapped read
MD
A-M
B-23
1ce
llsPa
clit
axel
-par
adig
m
UNT1 4.30E-04 6.1UNT2 9.51E-04 13.6UNT3 6.12E-04 8.7 1.06E-04UNT4 6.80E-04 9.8UNT5 4.52E-04 6.5
S1 5.96E-04 8.5S2 7.94E-04 11.3S3 7.74E-04 11.1 1.33E-04S4 7.82E-04 11.2S5 1.31E-03 18.8
DT1 4.14E-04 5.9DT2 3.58E-04 5.1DT3 4.50E-04 6.4 8.94E-05DT4 5.97E-04 8.5DT5 5.19E-04 7.4
Earl
yhu
man
embr
yos
(Ref
:Yan
etal
.20
13[1
21])
Oocyte1-C1 1.23E-04 1.8Oocyte1-C2 9.37E-05 1.3 6.94E-04Oocyte1-C3 8.95E-05 1.3
2-cell-embryo1-C1 1.24E-04 1.82-cell-embryo1-C2 1.39E-04 2.02-cell-embryo2-C1 1.36E-04 1.92-cell-embryo2-C2 1.42E-04 2.0 6.13E-042-cell-embryo3-C1 1.42E-04 2.02-cell-embryo3-C2 1.58E-04 2.34-cell-embryo2-C1 6.91E-04 9.94-cell-embryo2-C2 5.66E-04 8.14-cell-embryo2-C3 2.48E-04 3.54-cell-embryo2-C4 4.60E-04 6.64-cell-embryo3-C1 3.28E-04 4.7 8.53E-044-cell-embryo3-C2 6.34E-04 9.14-cell-embryo3-C3 3.72E-04 5.34-cell-embryo3-C4 4.98E-04 7.1
ESCp0-1-C1 4.96E-04 7.1 7.70E-04ESCp0-1-C2 5.54E-04 7.9
Hum
anES
cells
and
canc
erce
lls(R
ef:R
amsk
old
et.a
l.,20
12[7
9])
ESC1 3.47E-04 5.0ESC2 3.33E-04 4.8ESC3 2.58E-04 3.7ESC4 3.66E-04 5.2ESC5 2.79E-04 4.0 5.96E-04ESC6 3.52E-04 5.0ESC7 2.50E-04 3.6ESC8 4.77E-04 6.8
SKMEL5 cell1 8.84E-04 12.6SKMEL5 cell2 7.77E-04 11.1SKMEL5 cell3 6.30E-04 9.0SKMEL5 cell4 9.47E-04 13.5 5.09E-04
UACC257 cell1 5.42E-04 7.7UACC257 cell2 5.11E-04 7.3UACC257 cell3 6.10E-04 8.7
Table 3.4: This table shows the SNV frequencies of single-cells in this study and single-cells from two other published datasets with normal human cells and human cancercells. The single-cell SNV frequencies found in this study are slightly higher than thosefound in normal human cells from Yan et al. and human embryonic stem cells (ESC)from Ramskold et al.The single-cells in this study are cancer cells, and the SNV fre-quencies are comparable to the ones found in the cancer cells from Ramskold et al.[79].
61

Function Gene Mutation Locus ∆aa* Ref.
Paclitaxelresistance
RAPGEF4Rap guanine
nucleotide exchangefactor (GEF) 4
Missense chr2:173916571 L1785M [3]
AMOTL1 Angiomotin like 1 3′-UTR chr11:94607183 -- [16, 46]
Microtubuleorganization
andstabilization
PCM1 Pericentriolarmaterial 1 Missense chr8:17885150 G227R [19, 25]
NUDCD3 NudC domaincontaining 3 Missense chr7:44425714 H131D [127]
RAPGEF4Rap guanine
nucleotide exchangefactor (GEF) 4
Missense chr2:173916571 L1785M [3]
KIAA1671 Uncharacterizedprotein 3′-UTR chr22:25592835 -- [20, 71]
*Amino acid change
Table 3.5: This is a subset of the RNA variants listed in Table 3.2 that reside in genesimplicated in microtubule stabilization/organization and Paclitaxel resistance. Thesemutations are useful for followup functional studies to determine if or how they areindeed associated with Paclitaxel resistance.
3.3 Summary
In this chapter, I have demonstrated that single-cell RNA-Seq can identify
many private SNVs that are not detectable in bulk cells. I have also shown that the
single-cell RNA-Seq technique in this study has produced similar base call fidelity
compared to published datasets from previous single-cell RNA-Seq studies. Between
single-cells, the majority of the share SNVs are catalogued in the dbSNP database and
are not rare variants. Only a quarter of the novel SNVs are shared between single-cells.
A number of SNVs only present in the drug-tolerant single-cells reside in genes that
are involved in Paclitaxel resistance and microtubules organization and stabilization,
and they are interesting targets for future studies for their role in Paclitaxel resistance.
62

Chapter 4
Whole-transcriptome Gene Expression
Analyses at the Single-cell Level
RNA-Seq technology not only has improved our understanding of the tran-
scriptomic landscape of humans and many other organisms, it has also provided a
higher dynamic range in the detection and quantification of gene transcripts compared
to microarray technology. Thus far, most RNA-Seq experiments were performed with
bulk cells and the gene expression levels detected were merely an average of many
cells. Aberrant gene expression that drives disease progression is often found in a rare
subpopulation of cells or even a single-cell. Therefore, there is a pressing need to study
gene expression at the single-cell level.
The aim of this chapter is to highlight the single-cell heterogeneity at the gene
expression level, and to demonstrate that the gene expression profile of a cell popula-
tion is not representative of that in a single cell. Here, I discuss the methods I used in
63
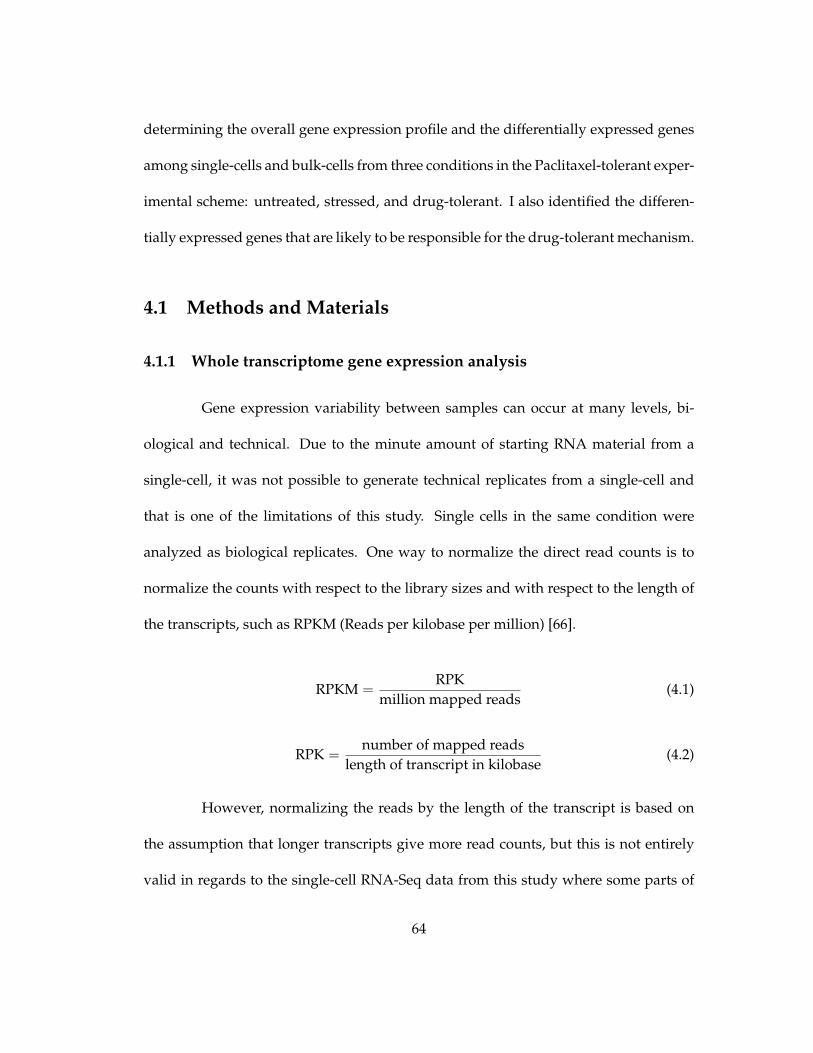
determining the overall gene expression profile and the differentially expressed genes
among single-cells and bulk-cells from three conditions in the Paclitaxel-tolerant exper-
imental scheme: untreated, stressed, and drug-tolerant. I also identified the differen-
tially expressed genes that are likely to be responsible for the drug-tolerant mechanism.
4.1 Methods and Materials
4.1.1 Whole transcriptome gene expression analysis
Gene expression variability between samples can occur at many levels, bi-
ological and technical. Due to the minute amount of starting RNA material from a
single-cell, it was not possible to generate technical replicates from a single-cell and
that is one of the limitations of this study. Single cells in the same condition were
analyzed as biological replicates. One way to normalize the direct read counts is to
normalize the counts with respect to the library sizes and with respect to the length of
the transcripts, such as RPKM (Reads per kilobase per million) [66].
RPKM =RPK
million mapped reads(4.1)
RPK =number of mapped reads
length of transcript in kilobase(4.2)
However, normalizing the reads by the length of the transcript is based on
the assumption that longer transcripts give more read counts, but this is not entirely
valid in regards to the single-cell RNA-Seq data from this study where some parts of
64

the transcript have highly uneven read coverage (Fig. 4.1). This phenomenon could
be partly due to the technical limitations in evenly amplifying a minute amount of
input genetic materials from a single cell, and it could also be due to sequence bi-
ases in the cDNA synthesis step using random hexamers. Using the typical RNA-Seq
gene expression quantification such as RPKM or FPKM with single-cell RNA-Seq data,
one could underestimate the expression level if the read coverage is highly uneven
(Fig. 4.2). Therefore, the read counts for single-cells were normalized with respect to
the library sizes and with respect to the number of bases in the transcript that has at
least 10 uniquely mapped reads. It is referred to as the adjusted-RPKM.
Adjusted-RPKM =Adjusted-RPK
million mapped reads(4.3)
Adjusted-RPK =No. of mapped reads in regions with at least 10x coverage
positions in transcript in kilobase with at least 10x coverage(4.4)
The total number of mapped reads for each transcript were obtained using the RNA-
Seq quality control package, RSeQC (version 2.3) [112], with the RPKM count.py script
using the following parameter settings: --strand=none, --skip-multi-hits, and using the
reference gene model in bed format. The reference gene model was downloaded from
the Table Browser in the UCSC Genome Browser with the following query (genome:
Human, assembly: Feb. 2009 GRCh37/hg19, track: UCSC Genes, table: knownGene,
region: genome) and the output format was set to BED (browser extensible data).
65

4.1.2 Characterizing single-cells and bulk-cells using gene expression data
The gene expression levels of 15 single-cells (5 cells from each condition), 5-
cell pooled samples, and bulk-cells from the three groups were characterized using
principal component analysis (PCA) and hierarchical clustering with 1,000 bootstrap-
ping replications. A matrix was generated with adjusted-RPKM for each gene in each
single-cell sample. Only genes with adjusted-RPKM > 0 in at least one sample were
retained for further analyses. The principal component analysis was performed using
FactoMineR [52]. PCA is more suitable in this analysis compared to factor analysis
since the main goal here is to reduce a large number of observed variables to a smaller
set of important independent composite variables without any prior assumptions or
variables model. I used the Pvclust package (version 1.2-2) in R [98] to perform the
hierarchical clustering analysis on log2 transformed adjusted-RPKM using the Ward’s
method with distance measured in Euclidean distance. Psuedo count of 1 was added
to all counts prior to log2 transform of adjusted-RPKM.
4.1.3 Differential gene expression and functional classification analyses
Differential expression analysis was performed using adjusted-RPMK for single-
cells and population cells using DEGSeq (version 1.10.0) [111]. DEGSeq uses a non-
parametric approach with re-sampling to account for the different sequencing depths.
Nonparametric methods are more robust in selecting significant features than para-
metric method when the read counts do not follow any known distribution. Based on
the statistical methods defined by Tusher et al. (2001) [110], DEGSeq assigns a score to
66

Figure 4.1: An example of uneven read coverage of single-cell RNA-Seq. The top trackcontains the RNA-Seq read coverage of a single-cell that spans the 5′-UTR, 23 exons,and the 3′-UTR. The middle track contains the RNA-Seq read coverage of populationcells that spans the same genomic regions as the single-cell read coverage track. The y-axis on the top and middle tracks shows the number of reads. The bottom track showsthe 5′-UTR, 23 exons, and the 3′-UTR that the reads are aligned to. The thin coloredvertical lines along the top two tracks indicate where SNVs are detected.
each gene based on the change in gene expression relative to the standard deviation
of repeated measurements, and it uses uses permutations of repeated measurements
from a shuffled data set to determine the percentage of differentially expressed genes
identified by chance, the False Discovery Rate (FDR). Functional classification of the
differential expressed genes was performed using the PANTHER Classification Sys-
tem, version 8 [106] (http://www.pantherdb.org/). Hierarchical clustering of dif-
ferentially expressed genes was performed using the heatmap function in R (version
2.15.1) [105].
67

43
Exon1 300bp
Exon2 400bp
Exon3 500bp D
ep
th o
f co
ve
rag
e
De
pth
of co
ve
rag
e
A
B
43
Exon1 300bp
Exon2 400bp
Exon3 500bp
Number of bp with less than 10 depth of coverage
100 bp 150 bp 200 bp
Total number of mapped reads along all three Exons
~= (300*43) + (400*43) + (500*43) = 51600 mapped reads
Number of read per kilobases of transcript (RPK) ~= 51600 reads/(0.3+0.4+0.5) kilobases transcript
= 43000 RPK
Total number of mapped reads along all three Exons
~= (200*43) + (250*43) + (300*43) + (100*5) + (150*5) + (200*5)
= 34500 mapped reads
Number of read per kilobases of transcript
~= 34500 reads/(0.3+0.4+0.5) kilobases transcript = 28750 RPK
5
C
RPK with bulk-cell RNA-Seq data
RPK with single-cell RNA-Seq data
Adjusted RPK with single-cell RNA-Seq data
43
Exon1 300bp
Exon2 400bp
Exon3 500bp
Omit regions with less than 10 depth of coverage
100 bp 150 bp 200 bp
5
De
pth
of co
ve
rag
e
Total number of mapped reads along all three Exons
~= (200*43) + (250*43) + (300*43) = 32250 mapped reads
Number of read per kilobases of transcript ~= 32250 reads/(0.2+0.25+0.3) bases
= 43000 RPK
Figure 4.2: A new method for normalizing the number of reads aligned to transcriptfor single-cell RNA-Seq data. A) RNA-Seq with bulk-cells usually generates a fairlyeven depth-of-coverage over transcriptomic regions. In order to compare gene expres-sion levels between samples, it is common to normalize the number of mapped readsby the transcript length, RPK (read per kilobase of transcript). B) Single-cell RNA-Seqoften results with uneven depth-of-coverage along the transcriptomic regions. If thenumber of mapped reads along a transcript is simply normalized by the length of thetranscript, one could potentially underestimate the actual gene expression level. C)This is a new method for normalizing the number of reads aligned to transcript forsingle-cell RNA-Seq data. To correct for the underestimation of gene expression leveldue to highly uneven depth of coverage, the kilobase of transcript length and the num-ber of reads aligned to the transcriptomic regions with less than 10× depth of coverageare excluded from the RPK calculation.
68

4.2 Results
4.2.1 Stressed cells undergo a Paclitaxel-induced transcription response that
is not apparent in drug-tolerant cells
Although acute changes in gene expression (4-24 hours) have been exten-
sively analyzed for a number of stressors including chemotherapeutic compounds,
the gene expression profiles in long-term stressed cells are largely unknown. Single
cells from our long-term stressed cell group exhibited distinct gene expression pat-
terns. I first characterized the cell type using the adjusted reads per kilobase per mil-
lion (RPKM) for 15 single-cells using principal component analysis (PCA). The first
and second PCA components explained 25% of the variation in all the single-cells,
and they separated the stressed single-cells from the untreated and drug-tolerant cells
(Fig. 4.3A). And the hierarchical clustering analysis also showed similar clustering pat-
tern (Fig. 4.4A).
To further examine the molecular functions of the differentially expressed
genes that separate the stressed cells from the unstressed cells (untreated/drug-tolerant),
I performed hierarchical clustering and functional classification of the 50 most sig-
nificantly differentially expressed genes between the stressed- and unstressed cells.
The differentially expressed genes showed a long-term stress-induced response and
the effects of Paclitaxel on microtubules and mitosis in stressed cells including down-
regulation of genes involved in maintenance of chromatin architecture, microtubule
motor activity, mitosis, DNA repair, mRNA splicing, mRNA polyadenylation, and
69

chromatin binding. In addition, gene expression was up-regulated in the following
functional areas: cell-cell adhesion and signaling, stress-induced response, apoptosis,
glycolysis, amino acid biosynthesis, translation, protein folding, and protein modifi-
cation (Fig. 4.5). The differential gene expression analysis between stressed and drug-
tolerant cells showed a reversed trend in up- and down-regulation compared with that
observed between untreated and stressed cells (Fig. 4.6).
Although the untreated and drug-tolerant cells appeared to exhibit similar
gene expression patterns, genes that were differentially expressed between these two
group could potentially explain the drug-resistance capability of the drug-tolerant cells.
Differential gene expression analysis between untreated and drug-tolerant cells showed
that microtubule motor activity, microtubule binding, and protein kinase activity were
up-regulated in drug-tolerant cells. Furthermore, genes involved in mRNA splicing,
mRNA transcription factor activity, translation, and cell adhesion were down-regulated
in drug-tolerant cells. Interestingly, I found that expression of ITGA6 (integrin alpha
6), histone demethylase KDM5A, and IGF1R (IGF1 receptor) were each up-regulated in
drug-tolerant cells but not in untreated or stressed cells (Fig. 4.6 and Fig. 4.7). Expres-
sion of these genes was observed in the majority of single cells as well as the popula-
tion. Importantly, our data are consistent with studies by Sharma et al. that implicated
IGF1R signaling and an altered chromatin state conferred, in part, by KDM5A as being
required to maintain a dynamic Palitaxel-tolerant phenotype [90]. Overexperssion of
ITGA6 has a synergistic effect on the suppression of Paclitaxel-mediated cell death via
the PI3K/AKT pathway mediated by a survival gene, Evi1 [57, 120]. In this single-cell
70
study, Evi1 expression level was 2-fold higher in the drug-tolerant cells compared to
untreated cells.
4.2.2 Gene expression profile of single-cells is distinct from that of the pop-
ulation
As one cell expand into a clonal population, it is unclear if the gene expression
profile of the population is representative of that in a single-cell from that population.
I speculate that RNA-Seq for bulk-cells can provide an average gene expression profile
of all the cells in the population. To answer this question, I performed PCA and hier-
archical clustering with the gene expression data from single cells, pooled single-cells
(combing all paired-end reads of five single-cells and treated them as one sample for
read mapping and gene expression analysis), and bulk-cells. The hierarchical cluster-
ing and PCA showed that pooled cells clustered closer to the population cells in the
untreated and drug-tolerant groups (Fig. 4.3B and Fig. 4.4B). The single cells did not
cluster with their corresponding population, except for the stressed cells. However,
each stressed cell appeared to have distinct gene expression patterns; therefore, they
did not cluster together as tightly as untreated and drug-tolerant single cells (Fig. 4.3B
and Fig. 4.4B). I also examined the expression level of the genes extracted from the
first PCA component which separated the single-cells from the bulk-cells (pooled-cells
and population). It appeared that the gene expression level of those genes fluctuates
more in single-cells (with some single-cells having zero gene expression while other
single-cells having high gene expression) compared to bulk-cells. When I examined
71

a b
0 50 100
50
05
0
Dim 1 (31.87%)
Dim
2 (
9.3
9%
)
DT_1
DT1_POP
DT_2DT2_POPDT_3
DT_4
DT_5
DT_Pooled
S_Pooled
S_1
S_2
S_3
S_4
S_5
S_POP
UNT_1UNT_2
UNT_3UNT_4
UNT_5
UNT_Pooled
UNT_POPDrug tolerant
Stressed
Untreated
Drug tolerantStressedUntreated
40 20 0 20 40 60
40
20
02
04
0
Dim 1 (13.48%)
Dim
2 (
11
.67
%)
DT_1
DT_2DT_3 DT_4
DT_5 S_1
S_2
S_3
S_4
S_5
UNT_1 UNT_2
UNT_3
UNT_4
UNT_5
Drug tolerant
Stressed
Untreated
Drug tolerantStressedUntreated
Figure 4.3: Single-cell and population cells were classified using Principal ComponentAnalyses. (A) Principal components analysis plot of adjusted-RPKM for 15 single-cell samples from the untreated, stressed, and drug-tolerant group showed that geneexpression profiles of stressed cells (red) were much different from those of untreated(blue) and drug-tolerant cells (green). (B) Clustering gene expression data in adjusted-RPKM from single cells, pooled cells and population cells using PCA showed thatsingle-cells clustered closer to their corresponding pooled-cells than the populationsample. The round dots represent each sample (single-cell, pooled-cell or population).The unfilled squares depict the barycenter of each cluster categorized by the cell type(untreated, stressed, or drug-tolerant). Dim: Principal component dimension. POP:population cells, Pooled: 5-cell-pooled sample.
72

S_
5
S_
2
S_
3
S_
1
S_
4 DT
_3
DT
_5
UN
T_
4
UN
T_
2
UN
T_
1
DT
_2 D
T_
1
DT
_4
UN
T_
3
UN
T_
5
05
00
01
00
00
15
00
0
He
igh
t
100
98
9778
81 9168
77
96
96
95
90
91
au
100
90
6950
30 5435
31
80
49
35
46
65
bp
1
2
34
5 67
8
9
10
11
12
13
edge #A
B
PO
P_
SS
_1
S_
4U
NT
_3
DT
_3
DT
_4
DT
_5
UN
T_
5U
NT
_2
UN
T_
4D
T_
1U
NT
_1
DT
_2
S_
6S
_p
oo
led
S_
2S
_3
PO
P_
DT
1P
OP
_D
T2
DT
_p
oo
led
PO
P_
UN
TU
NT
_p
oo
led
05
00
01
00
00
15
00
02
00
00
He
igh
t
7199
96 647353 9854
5378 969789
7799 9073
8896
98
au
6499
81 34339 8024
516 777330
2256 5046
3932
29
bp
12
3 456 78
910 111213
1415 1617
1819
20
edge #
Figure 4.4: The gene expression profile of stressed single-cells is different than that ofuntreated and drug-tolerant cells. A) Hierarchical clustering of log2-transformed ofadjusted RPKM for single-cells for all genes in Euclidean distance with 1,000 bootstrapreplications. B) Hierarchical clustering of log2-transformed of adjusted RPKM for sin-gle cells, pooled cells, and population cells in Euclidean distance with 1,000 bootstrapreplications. Values at branches are approximately unbiased (au) p-values (left, red),bootstrap probability (bp) values (right, green), and sample labels (bottom). The edgenumber is in gray at each branch.
73

the drug-tolerant single-cells, which were collected from a single clonal population, a
divergence of gene expression was found between any drug-tolerant single cell and
the averaged expression of the five-cell group. These results indicated that gene ex-
pression in a single cell is not reflected by the average expression found in the five-cell
group or in a large population of cells (Fig. 4.3B and Fig. 4.4B). These results underscore
the value of single-cell RNA-Seq to enhance the resolution of gene expression analysis
otherwise masked by averaged values of gene expression in a bulk population.
The higher variability of single-cell gene expression compared with bulk mea-
surements makes it more difficult to find clear patterns of differential gene expression
in single cells, particularly for those that are highly variable, as has been recently
described when performing RNA-Seq from normal single nuclei from human neu-
rons [82]. Moreover, a much larger sample size would empower a better examination
for those transcripts that are consistently highly variable.
4.3 Summary
In this chapter, I have shown that single-cell gene expression profiles are dif-
ferent than those of bulk cells. The 50 most significant differentially expressed genes
between untreated cells and stressed cells were those involved in the stress response.
Genes that are up-regulated in stressed cells are involved in apoptosis, glycolysis, pro-
tein synthesis, cell-to-cell adhesion and signaling. Genes required for chromatin ar-
chitecture, DNA repair, DNA replication, mRNA splicing, mRNA polyadenylation,
74

microtubule motor activity, and mitosis are down-regulated in stressed cells, and their
expression levels are similar between untreated and drug-tolerant cells. The differ-
ential gene expression analysis between untreated and drug-tolerant cells suggested
multiple drug-tolerant mechanisms including altering the chromatin state, switching
Integrin signals, and shifting the balance of pro- and anti-apoptotic signals in the intrin-
sic apoptotic pathway. Thus, a single molecular mechanism for drug tolerance might
not be needed since the diversity will ensure at any time that a given cancer cell con-
taining the right gene expression will be able to overcome massive stress.
75

UNT_3
UNT_5
UNT_1
UNT_4
UNT_2
S_5
S_2
S_3
S_4
S_1
ATF7IPCENPEhCAP CCHD3TLK1NGRNFI58GUSP7BPTFKIAA1369UCA1TFPI2PLATEHD1GSK3AasnSLAMC2FOSL1LOC100008587BC078172FAM65APKM2S100A6P4HBRPLP2FLNARPS11hCG_1994130OK/SW cl.82RPS15AFTLVIMGAPDHCALRRPL7AH2AFZUACAHMGB2SFRS5MIPOL1MARCH6DDX46RPL26AF079515FLJ44635TPT1HNRPDHNRNPDNAP1L1CALM2
log2(adj.rpkm)
0 13
Untreated cells Stressed cells
- mRNA splicing
- mRNA polyadenylation
- Chromatin binding
- Translation
- Protein folding
- Protein modification
- Glycolysis
- Cell-cell adhesion & signaling
- Stress induced response
- Amino acid biosynthesis
- Apoptosis
- Maintenance of chromatin
architecture
- DNA replication
- Microtubule motor activity
- Mitosis
- DNA repair
- Maintenance of chromatin
architecture
Gene expression in stressed cells
50 most significantly
differentially expressed genes (p-value < 0.001, FDR < 0.025)
Figure 4.5: Paclitaxel-induced stress response at the single-cell level. Hierarchical clus-tering of gene expression data for the 50 most significantly differentially expressedgenes between untreated and stressed single cells. These differentially expressed genesshowed the Paclitaxel-induced effects of Paclitaxel on microtubules and mitosis instressed cells including down-regulation of genes involved in maintenance of chro-matin architecture, microtubule motor activity, mitosis, DNA repair, mRNA splicing,mRNA polyadenylation, and chromatin binding. In addition, gene expression was up-regulated in stressed cells in the following functional areas: cell-cell adhesion and sig-naling, stress-induced response, apoptosis, glycolysis, amino acid biosynthesis, trans-lation, protein folding, and protein modification.
76

DT_3
DT_2
DT_5
DT_4
DT_1
S_2
S_3
S_5
S_4
S_1
UCA1SOD2EHD1GPR116LAMC2MAP4BC078172LOC100008587P4HBPATL1S100A6IGF1RSLC25A37KDM5ATFPI2ZNF445PDE4DIPDKFZp547H118ASXL2MARCH6hCAP CZC3H13CENPEMAT2APCM1DKFZp667K1925KIF14ATMAURKAMKI67SLKODC1CALM2HNRNPA3ITGA6HNRNPDTPX2H2AFZHNRNPA1FTLLENG7RPL18BC015662CALRRPL7AGAPDHRPLP2FLNAOK/SW cl.82RPS15AFOSL1SRRM2
Gene expression in drug-tolerant cells
- Translation
- Protein folding
- Protein modification
- Glycolysis
- Calcium ion binding
- Response to stress
- Microtubule motor activity
- Microtubule binding
- Mitosis
- Nucleic acid binding
- mRNA splicing
- mRNA polyadneylation
- Integrin alpha 6
- Histone demethylase
- Transmembrane receptor
protein kinase activity
- Response to stress
- Cell adhesion & signaling
- Protein modification
- Translation
- Apoptosis
18
925
log2(adj.rpkm)
0 11
Drug-tolerant cells Stressed cells
50 most significantly
differentially expressed genes (p-value < 0.001, FDR < 0.025)
Figure 4.6: The stress response observed in stressed cells subsided in drug-tolerantcells. Hierarchical clustering of gene expression data of the 50 most significantly dif-ferentially expressed genes between stressed and drug-tolerant cells showed that thePaclitaxel-induced effect observed in stressed cells did not linger in the drug-tolerantsurviving cells after the drug was removed.
77

UNT_3
UNT_1
UNT_4
UNT_2
UNT_5
DT_4
DT_5
DT_3
DT_2
DT_1
asnSZC3H13C9orf78NARSCKAP5NGRNBC015662KIF14ODC1FLJ44635TPT1SRRM2UACATUBA1CARF3PCGF2LOH11CR1LIGF1RDERL1SLC25A37AGAP3CSTF1MCM3APCCDC88AKDM5AITSN2NUP153DICER1GPR116VAMP2LMNAMCM3KIAA0597ITSNITSN1ZNF445ELOVL5SUPT16HALMS1BUB1CHD3KIAA1369ZFP36UBR4SYMPKGNL2NIXBNIP3LEIF3Aderp7CASTSFRS5 - Proteolysis
- Intracellular signaling cascade
- MAPKKK cascade
- Translation
- Cell adhesion
- Signal transduction
Gene expression in drug-tolerant cells
- Transcription factor activity
- Mitotic checkpoint serine/threonine-
protein kinase activity
- Microtubule motor activity
- Microtubule binding
- RNA binding activity
- Carboxy-lyase activity
- Aminoacyl-tRNA ligase activity
- Histone demethylase
- Transmembrane receptor protein
kinase activity
log2(adj.rpkm)
0 13
Untreated cells Drug-tolerant cells
50 most significantly
differentially expressed genes (p-value < 0.001, FDR < 0.025)
Figure 4.7: Differential gene expression between untreated and drug-tolerant cells. Hi-erarchical clustering of the 50 most significant differential expressed genes betweenuntreated and drug-tolerant cells (p-value < 0.001, FDR < 0.025).
78

Chapter 5
Mitochondria Specific SNV and Gene
Expression Analyses
Altered mitochondrial metabolism can stimulate cancer cell proliferation. Mi-
tochondria also play a critical role in regulating apoptosis and necrotic cell death. Tian
and colleagues [107] had previously shown that tubulin and mitochondrial proteins
were the major cellular components exhibiting changes associated with Paclitaxel treat-
ment, and suggested that mitochondria may play a role in Paclitaxel resistance. Al-
though the regulation, transcription, and posttranscriptional processing of the human
mitochondrial genome had been extensively studied, very little is known about the
extent and distribution of sequence variation in the mitochrondrial transcriptome at
the single cell level. In this chapter, I discuss the single-cell transcriptomic mutations
and gene expression analyses of mitochondrial genes and nuclear genes that encode
proteins involved in mitochondrial functions that could be implicated in Paclitaxel re-
79

sistance.
5.1 Methods
5.1.1 Mapping single-cell RNA-Seq reads to the mitochondrial reference
genome
For mitochondria-specific analyses, I first custom-built a Bowtie index us-
ing the bowtie-build function in Bowtie (version 0.12.8) [48] with the UCSC hg19 hu-
man reference genome where the DNA sequence for chromosome M was replaced by
the Revised Cambridge Reference Sequence (rCRS) of the human mitochondrial DNA
(NCBI reference sequence: NC 012920.1). Then, the pre-processed paired-end single-
cell and population RNA-Seq reads were mapped against this custom-built Bowtie
index with Tophat (version 1.3.2) with default settings [108]. Aligning the reads to
the rCRS reference allows for easy comparison with MITOMAP gene annotation [80].
Uniquely mapped reads were used for differential gene expression analyses and SNV
calling. These reads were tagged with “NH:i:1” (NH stands for the number of reported
alignments that contain the query in the current record) and were extracted from the
bam files generated by Tophat using GNU fgrep package (http://www.gnu.org/
s/grep). PCR duplicates were removed using the rmdup function in samtools [53].
80

5.1.2 Detecting homoplasmic and heteroplasmic variants in mitochondrial
RNA
Uniquely mapped reads against the rCRS human mitochondrial reference
in BAM file format were used for the identification of mitochondria homoplasmic
(mtDNA sites that only carry one allele for all mitochondrial genomes in an individual)
and heteroplasmic (sites that carry more than one allele in an individual) variants us-
ing loFreq (version 0.6.0) with default settings [117]. SNVs that are supported by reads
with extreme strand bias, especially for novel non-synonymous variants, are more
likely to be due to false positive variant calls [31]. Therefore, I used the lofreq filter.py
program to remove variants with significant strand bias (Holm-Bonferroni-corrected
p-value<0.05). To identify heteroplasmic variants with high confidence, at least 100×
read coverage is needed [123], therefore, I removed variants that were not supported
by at least 100× depth of coverage prior to subsequent analyses.
5.1.3 Identify SNVs in nuclear-encoded genes involved in mitochondrial
functions
A list of 933 nuclear-encoded mitochondrial genes was compiled by querying
two databases, the Human Mitochondrial Protein Database (HMPDb, http://bioi
nfo.nist.gov) and the MitoCarta database [72]. SNVs found in these genes were
extracted from the filtered VCF files generated by the BamBam as described in the
SNVs Identification section in the previous chapter.
81

5.1.4 Differential expression of genes that encode for proteins involved in
mitochondrial functions
The differential gene expression analyses for mitochondria-encoded genes
and nuclear-encoded genes were performed independently since these two groups
of genes are mapped to two different genomes, rCRS human mitochondrial refer-
ence genome and the UCSC hg19 human reference genome, respectively. The gene
expression level is measured in adjusted-RPKM and is calculated by first getting the
read counts per transcript using the RPKM count.py script in the RNA-Seq quality
control package, RSeQC (version 2.3) [112], using the following parameter settings: --
strand=none, --skip-multi-hits, and using the reference gene model in bed format. The
read counts for single-cells were normalized with respect to the library sizes and with
respect to the number of positions in the transcript that has at least 10 uniquely mapped
reads. This is referred to as the adjusted-RPKM (Equation 4.3 in section 4.1.1). The
UCSC hg19 human reference gene model was downloaded from the Table Browser [38]
in the UCSC Genome Browser [40] with the following query (genome: Human, assem-
bly: Feb. 2009 GRCh37/hg19, track: UCSC Genes, table: knownGene, region: genome)
and the output format was set to BED (browser extensible data). The rCRS human mi-
tochondrial gene model was downloaded from the MITOMAP (http://www.mito
map.org/bin/view.pl/MITOMAP/GenomeLoci) [80]. Differential expression anal-
ysis was performed using adjusted-RPMK for single-cells and population cells using
DEGSeq (version 1.10.0) [111]. Based on the statistical methods defined by Tusher et
82

al. (2001) [110], DEGSeq assigns a score to each gene based on the change in gene ex-
pression relative to the standard deviation of repeated measurements from a shuffled
data set, and it uses uses permutations of repeated measurements to determine the
percentage of differentially expressed genes identified by chance, the False Discovery
Rate (FDR). Hierarchical clustering of differentially expressed genes was performed
using the heatmap function in R (version 2.15.1) [105].
5.1.5 Knockdown experiment of BNIP3L
RNAi of BNIP3L for the knock-down experiment was expressed from bac-
teria that carry the plasmid with the RNAi sequence and ampicillin resistance genes,
Bnip3L RNAi pSuper (Addgene, Cambridge, MA). The plasmid carrying bacteria were
streaked onto LB-ampicillin-agar plates, from which individual colonies were inocu-
lated into 5 mL LB broth cultures and grown overnight at 37◦C shaking. Overnight
cultures were pelleted and resuspended in 250µL resuspension buffer with RNase A.
The plasmid DNA was then extracted and purified using the Invitrogen Mini kit (Life
technologies, Foster City, CA) and the QIAGEN Plasmid Midi kit (QIAGEN, Venlo,
Limburg), respectively. The purified Bnip3L RNAi plasmids was then transfected into
the untreated MDA-MB-231 cells that were cultured to >90% confluency.
5.1.6 Cell viability assay
Cells were seeded in six well plates to 90% confluency and transfected using
either the Bnip3L RNAi plasmids with Lipofectamine 2000r(Life technologies, Fos-
83

ter City, CA) or using only Lipofectamine without expression vector (negative control)
for 72 hours. Paclitaxel (100 nM, the same concentration that was used throughout
this study) was subsequently administered and cells were grown for 48-72 hours. The
viability of each well was measured by combining the suspended media with the corre-
sponding trypsinized adherent cells per individual well and the percentage of live cells
was counted using Bio-Rad TC-10 Automated Cell Counter (Bio-Rad, Hercules, CA).
The viable-cell-count between Paclitaxel-treated and untreated cells was compared to
determine if BNIP3L knockdown could increase survival rate of Palitaxel-treated.
5.2 Results
5.2.1 Mitochondria-encoded gene expression profile is unique when cells
are under stress
The mitochondrial genome contains 37 genes which encode for 2 ribosomal
RNAs (rRNAs), 22 transfer RNAs (tRNAs), and 13 subunits of the respiratory chain [21].
Single-cell and population RNA-Seq data in this study show that the majority of the se-
quencing reads that did not mapped to the nuclear transcriptome aligned to rRNA and
mRNA in the mitochondrial transcriptome (Fig. 5.1). The small mitochondrial genome
produced a very high depth of read coverage. The average read coverage of the mi-
tochondria genome is about 3650× per single cell, and is about 7270× per cell popu-
lation. A number of mitochondria-encoded genes were up-regulated in the stressed
single-cells, including cytochrome c oxidase, and 12S and 16S ribosomal RNAs.
84

mRNA 50%
tRNA 2%
rRNA 47%
Other 1%
mRNA
52%
tRNA
1%
rRNA
41%
Other
6%
Population Single-cell
Figure 5.1: Proportion of RNA-Seq reads (that did not map to the nuclear genome)aligning to rRNA, tRNA, mRNA, and other regions (including integenic and antisenseregions) of the mitochondrial genome. The majority of the RNA-Seq reads aligned tothe rRNA and mRNA regions of the mitochondrial genome. The pie chart on the leftshows the proportion of RNA-Seq reads from population cells aligning to the mito-chondrial genome. The pie chart on the right shows the fraction of RNA-Seq readsfrom single-cells to the mitochondrial transcriptome.
Mitochondrial genes encoding NADH dehydrogenase and ATPase are down-
regulated in stressed cells (Fig. 5.2), compared to untreated cells and drug-tolerant
cells, which share similar gene expression profiles. Paclitaxel did not have a significant
effect on tRNA production.
5.2.2 Nuclear-encoded mitochondrial genes
Since the majority of the mitochondrial proteins (more than 99%) are syn-
thesized in the cytosol of the cell and are imported into the mitochondria [11], it is
important to study the expression level of the nuclear-encoded mitochondrial genes
to get a complete picture of the overall mitochondrial gene expression profile in the
Paclitaxel-resistance experimental scheme. A number of nuclear-encoded mitochon-
85

drial genes were significantly differentially expressed in drug-tolerant cells compared
to untreated cells and were implicated in the cell death mechanisms (Table 5.1). Two
genes involved in the intrinsic apoptotic pathway were down-regulated in the drug-
tolerant cells, BNIP3L and BCL2L1. The intrinsic apoptotic pathway is regulated by
the mitochondria. BNIP3L, also known as NIX, is a pro-apoptotic protein that has
been shown to interact with adenovirus E1B19kD protein and the anti-apoptotic pro-
tein BCL2 [63]. BNIP3L protein was found to be down-regulated in lung cancer and
erythroleukemia cells[2, 97]. BCL2L1 has two known splice variants, BCL-xL and BCL-
xS [95]. BCL-xL is the longer isoform that encodes for an anti-apoptotic protein, 233
amino acids in length. BCL-xS is 63 amino acids shorter than BCL-xL and is has pro-
apoptotic effects. Chemotherapeutic drugs are found to induce apoptosis by shift-
ing the splicing of BCL2L1 pre-mRNA in favor of pro-apoptotic Bcl-xS [93]. Cytotoxic
agents, such as Paclitaxel, can shift the balance of the pro- and anti-apoptotic pro-
teins in favor of pro-apoptotic proteins, which increase the permeability of the mito-
condrial membrane, resulting in the release of cytochrome c from the mitochondrion.
Cytochrome c, pro-caspase-9, and Apaf-1 form the apoptosome complex that activates
pro-caspase-9 by changing its conformation. The activated caspase-9 then triggers the
downstream caspase cascade which executes apoptosis [95]. The down-regulation of
pro-apoptotic genes could potentially shift the balance of pro- and anti-apoptotic pro-
teins and enhance the anti-apoptotic effects in the cells.
86

Stressed Drug-tolerant Untreated
12 19
(log2 adj.RPKM)
Mitochondria
encoded
non-tRNA genes
Figure 5.2: Stressed cells exhibit distinct mitochondrial expression pattern in genes en-coded for proteins of the mitochondrial respiratory chain complex. Hierarchical clus-tering of mitochondrial mRNAs and rRNAs expression across 15 single-cells. Genesthat encode for rRNAs (RNR1 and RNR2) and cytochrome c oxidase (CO1, CO2, andCO3) were up-regulated whereas ATPase (ATPase6 and ATPase8) and NADH dehy-drogenases (ND3, ND4, ND5, and ND6) were down-regulated in the stressed cellscompared to untreated and drug-tolerant cells.
87

5.2.3 SNVs in mitochondrial genes
Mutations present in genes encoding for mitochondrial proteins can poten-
tially affect mitochondrial functions, including energy production through cellular res-
piration, maintenance of the proper cellular calcium ions concentration, and regulation
of intrinsic apoptosis. Three different missense mutations were detected in the RTN4
gene in three different drug-tolerant cells. RTN4 protein was previously shown to se-
quester the anti-apoptotic proteins BCL2 and BCL-xL in the endoplasmic reticulum
and prevent them from entering mitochondria [101]. The missense mutations in RTN
can potentially alter its binding affinity for BCL2 and BCL-xL, and increase the concen-
tration of the anti-apoptotic proteins in the mitochondria. With the down-regulation
of pro-apoptotic genes, it is possible that the shift in balance of pro-apoptotic proteins
and anti-apoptotic proteins is the cellular mechanism for drug-tolerance (Fig. 5.4).
5.2.4 Recapitulate the drug-tolerant phenotype by manipulating the expres-
sion level of BNIP3L
The genes that encode for the pro-apoptotic proteins BNIP3L was found down-
regulated significantly in the drug-tolerant single cells compared to untreated and
stressed cells, which were discussed in Section 5.2.2. To further understand the role of
BNIP3L protein in the drug-tolerant experimental scheme, I designed and performed a
knockdown experiment of this pro-apoptotic gene. I speculated that if BNIP3L was not
expressed, then the pro-apoptotic effect in the cell would decrease and fewer Paclitaxel-
88

Gene Up-regulated Down-regulated log2Fold∆ Function Ref.BNIP3L Untreated Drug-tolerant 3.3 A pro-apoptotic protein [63]
BCL2L1 Untreated Drug-tolerant 3.8
It has both pro-survival, Bcl-XL,and pro-apoptotic, Bcl-XS , geneproducts through alternativesplicing
[116]
C1QBP Drug-tolerant Untreated 1.5Promotes cell proliferation,migration and resistance to celldeath
[64]
TMABADH(ALDH9A1) Drug-tolerant Untreated 2.3
Aldehyde dehydrogenase familyof proteins. ALDH-positivebreast cancer cells are resistantto Paclitaxel
[54]
MRPS27 Drug-tolerant Untreated 4.7
It encodes a 28S subunit proteinthat may be a functional partnerof the death associated protein 3(DAP3 - a positive mediator ofcell death)
[103]
Table 5.1: Nuclear-encoded mitochondrial genes involved in cell death and were signif-icantly differentially expressed when compared between untreated and drug-tolerantsingle-cells.
treated cells would undergo Paclitaxel-induced apoptosis. Knockdown of Bnip3L gene
appeared to enhance the cell survival against Paclitaxel killing from three independent
knockdown experiments (Fig. 5.3).
5.2.5 Heteroplasmic mitochondrial variants
Heteroplasmic mitochondrial mutations (present in only a fraction of the mi-
tochondrial DNA) are often disease related and have been associated with tumor ac-
tivity and cancer progression [12, 42]. I examined the extent of heteroplasmic variants
present at the single-cell level (Fig5.5). There were heteroplasmic sites along the mito-
chondrial genome, but no unique heteroplamsic variant arise from Paclitaxel-induced
stress.
89

Bnip
3L-K
D
Contr
ol 0.0
0.2
0.4
0.6
0.8
1.0
% s
urv
iva
l re
lativ
e to
un
tre
ate
d
p=0.0456
Figure 5.3: Knockdown of Bnip3L gene appeared to enhance the cell survival againstPaclitaxel killing. The percent survival relative to untreated was calculated by divid-ing the number of viable cells of the Paclitaxel-treated samples by that of the untreatedsamples. Bnip3L-KD samples were cells that had been transfected with the Bnip3LRNAi plasmids using Lipofectamine. The Control samples were the negative con-trol that had undergone the mock transfection using Lipofectamine alone, without theBnip3L RNAi plasmids. This result was obtained from three independent knockdownexperiments.
90

Bcl-xS
BNIP3L
cytochrome c release
Apaf-1
Apoptosome
Caspase-9
Anti-apoptotic proteins
Pro-apoptotic proteins Apoptotic activator proteins
Effector
caspases
Apoptosis
Anti-apoptotic proteins
Pro-apoptotic proteins Apoptotic activator proteins
RTN4
RTN4
ytoc
Activator
BH3-only protein
Bcl-xL
/ Bcl-2
BNIP3L
Figure 5.4: Proposed drug-tolerance mechanism. The missense mutations found inRTN4 gene can potentially reduce the ability of RTN4 to keep the anti-apoptoticproteins, BCL-2 and BCL-xL, in the endoplasmic reticulum (ER), and allow moreanti-apoptotic proteins to localize in the mitochondria. If the pro-apoptotic pro-tein (BNIP3L) and the apoptotic activtor (BCL-xS) are both down-regulated in drug-tolerant cells, then it is possible that the anti-apoptotic signal will become stronger thanthe apoptotic signal in the mitochondria, preventing the cell from entering apoptosis.
91

Figure 5.5: Heteroplasmic and homoplasmic variants across the mitochondrial genomeat the single-cell level. The variants in each single-cell are plotted along the mitochon-dria genome (along the x-axis) as a circle (a heteroplasmic variant, where the biggerthe circle, the higher the frequency of that variant at the locus) or a vertical line (ho-moplasmic variant). The color of the circle/vertical line represents the alternative basecompared to the reference.
5.3 Summary
Mitochondria are not only the powerhouses of cells, they also determine if
cells should live or die through the instrinsic apoptotic pathway. Paclitaxel inhibits
the microtubules in achieving the metaphase spindle configuration, and ultimately,
activates the intrinsic apoptotic signal by prolonging the activation of mitotic check-
point. From the single-cell RNA-Seq data in this study, I observed that stressed cells
had elevated gene expression for 12S and 16S ribosomal RNAs and cytochrome c ox-
idase while NADH dehydrogenase and ATPase were down-regulated compared to
untreated and drug-tolerant cells. Paclitaxel-induced stress did not appear to alter the
level of tRNA transcript production and the frequency of heteroplasmy. I have dis-
covered three different nonsense mutations in the gene encoding the RTN4 protein in
three different drug-tolerant cells that are not present in untreated or stressed cells.
92

RTN4 is known to sequester anti-apoptotic proteins, BCL2 and BCL-xL, in the endo-
plasmic reticulum, hence, reduces the anti-apoptotic components in the mitochondria.
Mutations in RTN4 could affect the binding affinity between RTN4 and anti-apoptotic
proteins, BCL2 and BCL-xL. In addition, two genes involved in the intrinsic apoptotic
pathways were down-regulated in the drug-tolerant cells compared to the untreated
cells: BNIP3L and BCL2L1. Aberrant and down-regulation of the pro-apoptotic genes
can affect the balance of the pro- and anti-apoptotic proteins and allow cells to escape
from apoptosis.
93

Chapter 6
Discussion
It has become technically and economically feasible to sequence RNA from
single-cells, which enables highly sensitive detection of rare single-nucleotide variants
(SNVs). Such technologies will be critical for examining individual cells from tissue
biopsies of heterogenous cell populations. Although not all rare variants are relevant
to personalized cancer treatment, some have the potential to drive drug resistance or
serve as biomarkers of therapeutic success. Thus, the ability to detect rare SNVs and
specific gene expression profiles distinguishing drug-terminally-arrested versus drug-
tolerant single-cells at the very early onset of recurrence offers extremely valuable in-
formation as this may potentially provide diagnostic/prognostic value to assess suc-
cess or failure of cancer chemotherapies shortly after administration, and guide the
selection of appropriate treatments that will ultimately increase therapeutic efficacy.
Here, by using a single-cell RNA sequencing approach, I interrogated both
the single-nucleotide variants and the expression levels present at very early onset of
94

the evolution of a monoclonal population of drug-tolerant cells. I demonstrated that
the majority of novel RNA variants in a single-cell were unique to that cell. Most of the
RNA variants shared among single cells or between cell populations were SNPs cata-
logued in the dbSNP database. There were more SNVs detected in stressed cells than
in untreated and drug-tolerant cells. This could be the result of Paclitaxel-associated
down regulation of DNA repair that was detected in the differential gene expression
analysis. I identified drug-tolerant-specific RNA variants residing in genes that were
involved in Paclitaxel resistance and microtubule stabilization and organization.
Although it would be more rigorous to measure SNV frequency at the DNA
level, my data provides an indirect approximate estimation of the maximum effec-
tive SNV rate of cancer cells from individual cells at the RNA level. Furthermore,
the cell-specific SNV frequencies I found in the previously published single-cell RNA-
Seq datasets by Ramskold et al. [79] and Yan et al. [121] were very similar to ours
and among themselves, regardless whether the cells were normal or cancerous, and
despite the different protocols used in each study. This suggests that our single-cell
RNA-Sequencing appears to show equivalent base call fidelity to those previously pub-
lished.
Classifying cells using gene expression data could be valuable in predicting
the clinical significance of residual cancer cells after chemotherapy. In this study, I
was able to apply Principal Component Analysis (PCA) and hierarchical clustering
analysis to the gene expression data to differentiate the distinct gene expression pro-
files of stressed cells from that of untreated and drug-tolerant cells. Drug-tolerant cells
95

presented gene expression profiles more similar to untreated cells than to long-term
stressed cells. These drug-tolerant cells could be either cells that became stressed and
then resolved the stress, or cells that had been in a pre-existing condition and were
never engaged in a stress response. Some SNVs in the drug-tolerant cells reside in
genes related to tubulin metabolism, showing a cellular memory of the damage pre-
viously encountered. This would suggest that these cells have been stressed, but ob-
viously they enacted a rare program that ensured survival. Drug-tolerant cells might
originate from stressed cells. I identified SNVs in different subset of drug-tolerant
cells that reside in genes associated to a wide variety of molecular functions, including
DNA binding, enzymatic regulator activity, transcription factor activity, receptor ac-
tivity, structural molecule activity, transporter activity, intrinsic apoptosis, microtubule
stability and organization, and regulation of cell growth 3.2. I speculate that a single
molecular mechanism for drug tolerance might not be needed since the diversity will
ensure at any time that a given cancer cell containing the right gene expression and/or
RNA variant will be able to evade killing by cytotoxic agents.
Paclitaxel acts on cells by stabilizing the microtubules that leads to a mitotic
arrest in the late G2/M-phase of the cell cycle. Prolonged mitotic arrest will trigger
the activation of intrinsic apoptosis, which is regulated by the mitochondria. Inter-
estingly, I identified differentially expressed genes involved in the intrinsic apoptotic
pathway between untreated and drug-tolerant cells. Two of these genes, BNIP3L and
BCL2L1, encode for pro-apoptotic proteins that have not been previously implicated
in Paclitaxel resistance in cells under normal physiological oxygenation condition. The
96

gene knockdown experiment in this study showed that the downregulation of BNIP3L
appeared to enhance the survival rate of the Paclitaxel-treated cells.
RTN4 is another protein that controls the concentration and the balance of
pro- and anti-apoptotic proteins in the mitochondria, which is known to interact with
the pro-apoptotic proteins BCL-2 and BCL-xL in the endoplasmic reticulum, prevent-
ing them from entering the mitochondria to enhance cell survival. Interestingly, three
different missense mutations were found in the gene RTN4 in three different drug-
tolerant single-cells but not in any untreated or stressed cell. These missense mutations
can potentially affect the binding affinity between RTN4 and BCL-2 and/or BCL-xL
and promote anti-apoptotic responses in the cell. Further studies will be needed to
confirm the localization of BCL-2 and BCL-xL in cells with these mutations in RTN4.
Drug-resistance can be a result of aberrant gene expression or genetic muta-
tions, but the phosphorylation states of proteins also play an important role in reg-
ulating the intrinsic apoptosis. One of the major pro-apoptotic proteins in the in-
trinsic apoptotic pathway is the Bcl-2-associated death promoter (BAD), which inac-
tivates anti-apoptotic proteins BCL-2 and BCL-xL when it is in its dephosphorylated
form [125]. In this study, the Insulin-like growth factor receptor (IGF1R) is upregulated
in the drug-tolerant cells. IGF1R can activate phosphatidylinositol 3-kinase (PI3K) sig-
naling cascade, and ultimately, inactivates BAD by phosphorylating it [32]. The inacti-
vation of BAD will lead to the activation of anti-apoptotic proteins BCL-2 and BCL-xL,
which can promote cell survival. In another study, Sharma et al. found that activation
IGF1R signaling, together with the histone demethylase KDM5A activity, can alter the
97

chromatin state in a subpopulation of cells, and provides those cells with a reversible
Paclitaxel resistance capability [90].
In sum, drug-tolerant mechanisms can arise from genetic, transcriptomic, and
epigenetic alterations. Figure 6.1 provides a summary of the genes I have identified,
from the single-cell RNA-Seq data in this study, that are involved in various drug-
tolerance mechanisms. I believe that many of the drug-tolerant mechanisms can also
be identified using population RNA-Seq data (but I cannot be sure since I did not have
biological replicates for most of the population RNA-Seq data due to the experimental
resource constraints). But what makes single-cell RNA-Seq unique and worthwhile, is
that it allows us to detect cell-to-cell transcript heterogeneity at the single-nucleotide
level, and it can also identify gene expression heterogeneity among single cells.
Analyzing cell populations only generates an averaged gene expression level
in all cells. Interestingly, Marinov and colleagues have recently reported the stochastic
gene expression heterogeneity found between single cells. They were able to reconsti-
tute the averaged gene expression given by an entire population of cells by pooling the
single-cell RNA sequencing results from 30 to 100 single cells [62]. In this study, the
5-cell-pooled samples did cluster closer to their corresponding populations compared
to single-cells. The data in this study suggest that pooling five cells from the same bi-
ological conditions is not sufficient to accurately reconstitute the averaged expression
of the populations.
Here I demonstrated that single-cell gene expression profiles differ from pro-
files of their corresponding populations in significant and illuminating ways. Single-
98

cell RNA-Seq allows one to study gene expression and single-nucleotide variants at a
higher resolution which can help identify genes that are not yet implicated in cancer,
cancer treatment, or other disease states.
99

IGF-1R
PI3K KDM5A
Histone H3K4 demethylation
Transient chromatin
state mediates the
reversible drug
tolerance phenotype
BAD
Apoptosis
BCL-xS BCL-xL
RTN4
BNIP3L
phosphorylate
The balance between the pro-
and anti-apoptotic regulatory
components controls the
decision of whether a cell
survives or dies
PTEN
Evi1
ITGA6
BCL-2
AKT
Figure 6.1: Multiple drug-tolerance mechanisms regulated by the genes that were iden-tified in this study. IGF-1R was found to be up-regulated the drug-tolerant cells. Uponactivation of IGF-1R, it phosphorylates and activates phosphoinositol-3-kinase (PI3K).Phosphorylated PI3K, in turn, phosphorylates and activates protein kinase B, alsoknown as AKT. The activated AKT can then phosphorylate and inhibit pro-apoptoticprotein BAD from binding to anti-apoptotic proteins BCL-2 and BCL-xL. BAD inhibitsthe anti-apoptotic proteins only when it is in its non-phosphorylated form. RTN4, alsoknown as Reticulon 4, has been shown to interact with BCL-2 and BCL-xL and reducestheir anti-apoptotic activities by keeping them in the endoplasmic reticulum. Pro-apoptotic genes, BNIP3L and BCL-xS , were both down-regulated in the drug-tolerantcells. IGF1R signaling and the histone demethylase KDM5A activity, together, alterthe chromatin state and provide cells with a reversible Paclitaxel resistance capability.Another gene that was found to be up-regulated in the drug-tolerant cells is Integrinalpha-6 (ITGA6). Increased expression of ITGA6, together with a high expression levelof Evi1, is known to enhance Paclitaxel resistance. Evi1 activates the PI3K pathway byrepressing PTEN expression (PTEN expression was not detected in any single-cell orpopulation in this study). PTEN suppresses PI3K activity by dephosphorylating PIP3,an important signaling component of the PI3K.
100
Appendix A
RNA-Seq read mapping statistics for
single-cells and bulk-cells
101

SamplesTotal number ofpaired-end readssequenced
Total number ofproperly pairedmapped-reads withoutPCR duplicates
UNT 1 72,398,342 42,429,918UNT 2 97,896,104 69,651,740UNT 3 32,434,019 25,731,672UNT 4 86,764,133 62,280,876UNT 5 55,056,490 22,804,666UNT Pop 94,393,218 80,834,490S 1 93,752,892 89,363,318S 2 77,374,749 59,347,478S 3 57,117,251 27,832,072S 4 76,309,928 56,447,554S 5 63,019,868 46,954,348S Pop 89,785,654 73,548,017DT 1 94,547,328 47,021,098DT 2 86,555,396 46,399,478DT 3 69,507,808 43,944,268DT 4 86,185,154 66,641,812DT 5 105,928,132 61,132,450DT Pop1 110,801,220 85,512,326DT Pop2 106,855,138 70,235,819
Table A.1: Number of sequencing reads and mapping statistics. This table shows thetotal number of paired-end reads that were sequenced for each single-cell and bulk-cells, as well as the total number of mapped reads that both paired-end reads are prop-erly paired after removing PCR duplicates. We generated similar number of sequenc-ing reads for individual single-cells and each cell population. Pop: population, UNT:untreated, S: stressed, DT: drug-tolerant.
102

Samples % Genomic coverage
Sing
lece
lls
UNT 1 6.5%UNT 2 7.1%UNT 3 2.3%UNT 4 6.5%UNT 5 11.0%
S 1 20.9%S 2 14.2%S 3 12.1%S 4 5.1%S 5 5.1%
DT 1 9.9%DT 2 6.1%DT 3 3.9%DT 4 5.5%DT 5 5.8%
Popu
lati
on UNT Pop 49.5%S Pop 48.2%
DT Pop 1 36.7%DT Pop 2 41.9%
Table A.2: RNA sequencing reads of the population cells cover more genomic regionthan that of single cells. For each sample, the percent genomic coverage is calculatedby dividing the total number of transcriptomic-bases with at least 1x read coverage bythe total number of transcriptomic bases.
103

Samples Number of geneswith RPKM>1
% detectedgenescompared topopulation
Number of geneswith adj-RPKM>1
% detectedgenescompared topopulation
UNT 1 2484 20% 2212 17%UNT 2 2431 19% 2172 17%UNT 3 1266 10% 959 7%UNT 4 2288 18% 2040 16%UNT 5 3635 29% 3070 24%UNT Pooled 5cells 8175 65% 10146 79%UNT Pop 12541 - 12854 -S 1 4442 32% 4565 38%S 2 3992 29% 3835 32%S 3 3869 28% 3383 28%S 4 2011 15% 1665 14%S 5 1909 14% 1644 14%S Pooled 5cells 10209 74% 12855 107%S Pop 13796 - 12007 -DT 1 3261 24% 2927 25%DT 2 2641 20% 2137 18%DT 3 2091 15% 1564 13%DT 4 2247 17% 1902 16%DT 5 2310 17% 1879 16%DT Pooled 5cell 8175 60% 9760 82%DT Pop 1 12443 - 11981 -DT Pop 2 14609 - 11795 -
Table A.3: Number of genes with RPKM>1 and adjRPKM>1 in single cells and popu-lation cells. Pop: population, UNT: untreated, S: stressed, DT: drug-tolerant.
104

Cell Type
All SNVsin
populationpassed all
filters
Single-cellID
All SNVsin
single-cellpassed all
filters
ComparableSNVs in
single-cell
ComparableSNVs in
population
NovelSNVs
only insingle-cell
NovelSNVs
only inpopula-
tion
NovelSNVsin both
single-celland
population
dbSNPvariantsonly insingle-
cell
dbSNPvariantsonly inpopula-
tion
dbSNPvariants in
bothsingle-cell
andpopulation
Untreated 63578
1 6284 2109 2411 1356 470 760 28 93 6632 8382 3097 2809 2270 516 834 36 104 7153 2267 784 451 644 107 142 15 17 1164 7595 2257 2155 1602 402 658 35 108 5665 4000 2292 2919 1292 545 1003 33 144 877
Stressed 35227
1 13756 5278 5439 3211 824 2071 59 309 18972 8886 4832 2967 3641 392 1196 34 127 10863 6152 2902 2000 2217 336 687 23 142 6234 4342 1850 1025 1464 152 392 31 58 3515 5748 2873 1021 2442 139 435 30 42 390
Drug-tolerant 11857
1 8100 2112 1913 1343 363 773 31 98 6832 3684 1280 1248 780 251 503 14 63 4423 2688 965 728 677 137 289 11 28 2514 6933 1630 977 1233 186 401 18 43 3495 4315 1336 955 992 199 348 11 50 305
Table A.4: The number of common and unique SNVs detected in single-cells and pop-ulation in three different groups. Related to Fig. 3.2. Comparable SNVs are the variantslocated in genomic regions where there is at least 10× RNA read coverage in both thesingle-cell and the population. SNVs variants in single-cell and/or in population areparts of the comparable SNVs. SNVs consist of novel and dbSNP variants.
105

Appendix B
Additional Methods and Materials
B.1 Single-cell cDNA synthesis
Total RNA of cell lysate was reverse-transcribed to first-strand cDNA using
a combination of random hexamers and poly-T chimeric primers and then converted
to double-stranded (ds) DNA using fragmentation and RNA-dependent DNA poly-
merase. Finally, the ds cDNA was amplified linearly using a SPIA process and puri-
fied by using MyOneTM
carboxilic acid-coated superparamagnetic beads (Invitrogen,
Carlsbad, CA). The cDNA was prepared for fifteen individual single-cells for library
preparation. The quality and quantity of single-cell cDNA were evaluated using the
Agilent Bioanalyzer 2100 DNA High Sensitivity chip (Agilent, Palo Alto).
106

B.2 RNA-Seq library preparation and sequencing
For paired-end whole transcriptome library preparation, ∼0.5-1.0 µg cDNA
of each sample was sheared to a size ranging between 200-300 bp using the Covaris-S2
sonicator (Covaris, Woburn, MA) according to the manufacturer’s recommended pro-
tocols. Fragmented cDNA samples were used for the preparation of RNA-Seq libraries
using TruSeq v1 Multiplex Sample Preparation kit (Illumina, San Diego, CA). Briefly,
cDNA fragments were end-repaired, dA-tailed and ligated to multiplex adapters ac-
cording to manufacturer’s instructions. After ligation, DNA fragments smaller than
150 bp were removed with AmPure XP beads (Beckman Coulter Genomics, Danvers,
MA). The purified adapter ligated products were enriched using polymerase chain re-
action (14 cycles). The final amplified libraries were resolved on 2.0% agarose gel and
manually size-selected in the range of 350-380 bp. The final RNA-Seq libraries were
quantitated using the Agilent bioanalyzer 2100 and pooled together in equal concen-
tration for sequencing. The pooled multiplexed libraries of single-cells were sequenced
in four independent sequencing runs, with eight flow cell lanes per run which gener-
ated 2×50 bp paired-end reads on HiSeq 2000 (Illumina, Inc; San Diego, CA). On the
same sequencing platform, population RNA-Seq was performed in two flow cell lanes
in one run, generating 2×100 bp paired-end reads. Due the timing and the cost of
sequencing, the sequencing read-length generated for single-cells and population are
not the same. However, since both single-cell and population sequencing generated
paired-end reads, the read-length difference should have a minimal impact on the read
107

alignment accuracy.
B.3 Whole genome DNA sequencing of naıve MDA-MB-231
cells
For high-throughput sequencing, high-molecular weight genomic DNA (gDNA)
was obtained from MDA-MB-231 cells (Princeton PSOC). For the DNA library prep,
1µg of gDNA was first sheared down to 200-300 bp using the Covaris S2 (Woburn,
Massachusetts) per manufacture recommendations. A target insert size of 200-250 bp
was then size-selected using the automated electrophoretic DNA fractionation system,
known as LabChip XT (Caliper Life Sciences, Hopkinton, Massachusetts). Paired-end
sequencing libraries were prepared using Illumina’s TruSeq DNA Sample Preparation
Kit (San Diego, CA). Following DNA library construction, samples were quantified
using the Agilent Bioanalyzer per manufacturer’s protocol (Santa Clara, CA). DNA
libraries were sequenced using the Illumina HiSeq 2000 in two flow cell lanes with
sequencing paired-end read lengths of 2×100 bp. Reads were de-multiplexed using
CASAVA (version 1.8.2).
108

Bibliography
[1] J. D. Adams, K. P. Flora, B. R. Goldspiel, J. W. Wilson, S. G. Arbuck, and R. Fin-ley. Taxol: a history of pharmaceutical development and current pharmaceuticalconcerns. J Natl Cancer Inst Monogr, (15):141–7, Jan 1993.
[2] W. Aerbajinai, M. Giattina, Y. T. Lee, M. Raffeld, and J. L. Miller. The proapoptoticfactor Nix is coexpressed with Bcl-xL during terminal erythroid differentiation.Blood, 102(2):712–7, Mar 2003.
[3] A. A. Ahmed, X. Wang, Z. Lu, J. Goldsmith, X. F. Le, G. Grandjean,G. Bartholomeusz, B. Broo m, and Jr. Bast, R. C. Modulating microtubule sta-bility enhances the cytotoxic response of cancer cells to Paclitaxel. Cancer Res,71(17):5806–17, Sep 2011.
[4] G. M. Ajabnoor, T. Crook, and H. M. Coley. Paclitaxel resistance is associatedwith switch from apoptotic to autophagic cell death in MCF-7 breast cancer cells.Cell Death Dis, 3:e260, Jan 2012.
[5] V. Almendro, A. Marusyk, and K. Polyak. Cellular heterogeneity and molecularevolution in cancer. Annu Rev Pathol, 8:277–302, Jan 2013.
[6] J. H. Bahn, J. H. Lee, G. Li, C. Greer, G. Peng, and X. Xiao. Accurate identifica-tion of A-to-I RNA editing in human by transcriptome sequencing. Genome Res,22(1):142–50, Jan 2012.
[7] J. A. Bauer, F. Ye, C. B. Marshall, B. D. Lehmann, C. S. Pendleton, Y. Shyr, andJ. A. Arteaga, C. L. a nd Pietenpol. RNA interference (RNAi) screening approachidentifies agents that enhance paclitaxel activity in breast cancer cells. BreastCancer Res, 12(3):R41, Jun 2010.
[8] V. Bhargava, S. R. Head, P. Ordoukhanian, M. Mercola, and S. Subramaniam.Technical variations in low-input RNA-seq methodologies. Sci Rep, 4:3678, Jan2014.
[9] J. F. Bishop, J. Dewar, G. C. Toner, J. Smith, M. H. Tattersall, I. N. Olver, S. Ack-land, I. Kennedy, D. Goldstein, H. Gurney, E. Walpole, J. Levi, J. Stephenson, and
109

R. Canetta. Initial paclitaxel improves outcome compared with CMFP combina-tion chemotherapy as front-line therapy in untreated metastatic breast cancer. JClin Oncol, 17(8):2355–64, Aug 1999.
[10] C. Bock and T. Lengauer. Managing drug resistance in cancer: lessons from hivtherapy. Nat Rev Cancer, 12(7):494–501, Jun 2012.
[11] Boengler, K. and Heusch, G. and Schulz, R. Nuclear-encoded mitochondrial pro-teins and their role in cardioprotection. Biochim Biophys Acta, 1813(7):1286–94, Jul2011.
[12] M. Brandon, P. Baldi, and D. C. Wallace. Mitochondrial mutations in cancer.Oncogene, 25(34):4647–62, Aug 2006.
[13] B. R. Brinkley and T. M. Goepfert. Supernumerary centrosomes and cancer:Boveri’s hypothesis resurrected. Cell Motil Cytoskeleton, 41(4):281–8, Dec 1998.
[14] G. M. Cann, Z. G. Gulzar, S. Cooper, R. Li, S. Luo, M. Tat, S. Stuart, G. Schroth,S. Sr inivas, M. Ronaghi, J. D. Brooks, and A. H. Talasaz. mRNA-Seq of singleprostate cancer circulating tumor cells reveals recapitulation of gene expressionand pathways foun d in prostate cancer. PLoS One, 7(11):e49144, Nov 2012.
[15] J. G. Caporaso, C. L. Lauber, W. A. Walters, D. Berg-Lyons, J. Huntley, N. Fierer,S. M. Owens, J. Betley, L. Fraser, M. Bauer, N. Gormley, J. A. Gilbert, G. Smith,and R. Knight. Ultra-high-throughput microbial community analysis on the Il-lumina Hiseq and Miseq platforms. ISME J, 6(8):1621–4, Mar 2012.
[16] S. W. Chan, C. J. Lim, Y. F. Chong, A. V. Pobbati, C. Huang, and W. Hong. Hippopathway-independent restriction of TAZ and YAP by angiomotin. J Biol Chem,286(9):7018–26, Mar 2011.
[17] A. Daemen, O. L. Griffith, L. M. Heiser, N. J. Wang, O. M. Enache, Z. Sanborn,F. Pepin, S. Durinck, J. E. Korkola, M. Griffith, J. S. Hur, N. Huh, J. Chung,L. Cope, M. J. Fackler, C. Umbricht, S. Sukumar, P. Seth, V. P. Sukhatme, L. R.Jakkula, Y. Lu, G. B. Mills, R. J. Cho, E. A. Collisson, L. J. van’t Veer, P. T. Spell-man, and J. W. Gray. Modeling precision treatment of breast cancer. Genome Biol,14(10):R110, Oct 2013.
[18] P. Dalerba, T. Kalisky, D. Sahoo, P. S. Rajendran, M. E. Rothenberg, A. A. Leyrat,J. Sim, S. an d Okamoto, D. M. Johnston, D. Qian, M. Zabala, J. Bueno, N. F. Neff,J. Wang, A. A. Shelton, B. Visser, S. Hisamori, Y. Shimono, M. van de Wetering,H. Clevers, M. F. Clarke, and S. R. Quake. Single-cell dissection of transcriptionalheterogeneity in human colon tumors. Nat Biotechnol, 29(12):1120–7, Nov 2011.
[19] A. Dammermann and A. Merdes. Assembly of centrosomal proteins and micro-tubule organization depends on PCM-1. J Cell Biol, 159(2):255–66, Oct 2002.
110

[20] N. Dephoure, C. Zhou, J. Villen, S. A. Beausoleil, C. E. Bakalarski, S. J. Elledge,and S. P. Gygi. A quantitative atlas of mitotic phosphorylation. Proc Natl AcadSci U S A, 105(31):10762–7, Aug 2008.
[21] S. DiMauro and E. A. Schon. Mitochondrial respiratory-chain diseases. N Engl JMed, 348(26):2656–68, Jun 2003.
[22] F. Fernandez-Madrid, N. Tang, H. Alansari, J. L. Granda, L. Tait, K. C. Amirikia,M . Moroianu, X. Wang, and R. L. Karvonen. Autoantibodies to AnnexinXI-A and Other Autoantigens in the Diagnosis of Breast Cancer. Cancer Res,64(15):5089–96, Aug 2004.
[23] M. L. Flores, C. Castilla, R. Avila, M. Ruiz-Borrego, C. Saez, and M. A. Japon.Paclitaxel sensitivity of breast cancer cells requires efficient mitotic arrest anddisruption of Bcl-xl/Bak interaction. Breast Cancer Res Treat, 133(3):917–28, Jun2012.
[24] C. Friesen, A. Lubatschofski, G. Glatting, K. M. Debatin, and S. N. Reske. Ac-tivation of intrinsic apoptotic pathway by re-188 irradiation and paclitaxel incoronary artery smooth muscle cells. Q J Nucl Med Mol Imaging, 52(3):289–95,Sep 2008.
[25] X. Ge, C. L. Frank, F. Calderon de Anda, and L. H. Tsai. Hook3 interacts withPCM1 to regulate pericentriolar material assembly and the timing of neurogen-esis. Neuron, 65(2):191–203, 2010.
[26] Consortium Genomes Project, G. R. Abecasis, D. Altshuler, A. Auton, L. D.Brooks, R. A. Durbin, R. M. a nd Gibbs, M. E. Hurles, and G. A. McVean. Amap of human genome variation from population-scale sequencing. Nature,467(7319):1061–73, Oct 2010.
[27] M. Gerlinger, A. J. Rowan, S. Horswell, J. Larkin, D. Endesfelder, E. Gronroos,P. Martinez, N. Matthews, A. Stewart, P. Tarpey, I. Varela, B. Phillimore, S. Be-gum, N. Q. McDonald, A. Butler, D. Jones, K. Raine, C. Latimer, C. R. Santos,M. Nohadani, A. C. Eklund, B. Spencer-Dene, G. Cla rk, L. Pickering, G. Stamp,M. Gore, Z. Szallasi, J. Downward, P. A. Futreal, and C. Swanton. Intratumorheterogeneity and branched evolution revealed by multiregion sequencing. NEngl J Med, 366(10), Mar 2012.
[28] M. M. Gottesman. Mechanisms of cancer drug resistance. Annu Rev Med, 53:615–27, Jan 2002.
[29] R. V. Grindberg, J. L. Yee-Greenbaum, M. J. McConnell, M. Novotny, A. L.O’Shaughnessy, G. M. Lambert, M. J. Arauzo-Bravo, J. Lee, M. Fishman, G. E.Robbins, X. Lin, P. Venepally, J. H. Badger, D. W. Galbraith, F. H. Gage, andR. S. Lasken. Rna-sequencing from single nuclei. Proc Natl Acad Sci U S A,110(49):19802–7, Dec 2013.
111

[30] T. Gu, F. W. Buaas, A. K. Simons, C. L. Ackert-Bicknell, R. E. Braun, and M. A.Hibbs. Canonical A-to-I and C-to-U RNA editing is enriched at 3’UTRs andmicroRNA target sites in multiple mouse tissues. PLoS One, 7(3):e33720, Mar2012.
[31] Guo, Y. and Li, J. and Li, C. I. and Long, J. and Samuels, D. C. and Shyr, Y.The effect of strand bias in Illumina short-read sequencing data. BMC Genomics,13:666, Nov 2012.
[32] H. Harada, J. S. Andersen, M. Mann, N. Terada, and S. J. Korsmeyer. p70s6 kinasesignals cell survival as well as growth, inactivating the pro-apoptotic moleculeBAD. Proc Natl Acad Sci U S A, 98(17):9666–70, Aug 2001.
[33] T. Hashimshony, F. Wagner, N. Sher, and I. Yanai. CEL-Seq: single-cell RNA-Seqby multiplexed linear amplification. Cell Rep, 2(3):666–73, Sep 2012.
[34] K. Hishikawa, B. S. Oemar, F. C. Tanner, T. Nakaki, T. F. Luscher, and T. Fujii.Connective tissue growth factor induces apoptosis in human breast cancer cellline MCF-7. J Biol Chem, 274(52):37461–6, Dec 1999.
[35] S. Islam, U. Kjallquist, A. Moliner, P. Zajac, J. B. Fan, P. Lonnerberg, and S. Lin-narsson. Characterization of the single-cell transcriptional landscape by highlymultiplex RNA-seq. Genome Res, 21(7):1160–7, Jul 2011.
[36] S. Islam, A. Zeisel, S. Joost, G. La Manno, P. Zajac, M. Kasper, P. Lonnerberg, andS. Linnarsson. Quantitative single-cell RNA-seq with unique molecular identi-fiers. Nat Methods, 11(2):163–6, Feb 2014.
[37] Z. Kan, B. S. Jaiswal, J. Stinson, V. Janakiraman, D. Bhatt, H. M. Stern, P. Yue, P. M.Haverty, R. Bourgon, J. Zheng, M. Moorhead, S. Chaudhuri, L. P. Tomsho, B. A.Peters, K. Pujara, S. Cordes, D. P. Davis, V. E. Carlton, W. Yuan, L. Li, W. Wang,C. Eigenbrot, J. S. Kaminker, D. A. Eb erhard, P. Waring, S. C. Schuster, Z. Mod-rusan, Z. Zhang, D. Stokoe, F. J. de Sauvage, M. Faham, and S. Seshagiri. Diversesomatic mutation patterns and pathway alterations in human cancers. Nature,466(7308):869–73, Aug 2010.
[38] D. Karolchik, A. S. Hinrichs, T. S. Furey, K. M. Roskin, C. W. Sugnet, D. Haussler,and W. J. Kent. The UCSC Table Browser data retrieval tool. Nucleic Acids Res,32(Database issue):D493–6, Jan 2004.
[39] W. J. Kent. BLAT–the BLAST-like alignment tool. Genome Res, 12(4):656–64, Apr2002.
[40] W. J. Kent, C. W. Sugnet, T. S. Furey, K. M. Roskin, T. H. Pringle, A. M. Zahler, andD. Haussler. The human genome browser at UCSC. Genome Res, 12(6):996–1006,Jun 2002.
112

[41] C. L. Kleinman, V. Adoue, and J. Majewski. RNA editing of protein sequences: arare event in human transcriptomes. RNA, 18(9):1586–96, Sep 2012.
[42] A. Kloss-Brandstatter, G. Schafer, G. Erhart, A. Huttenhofer, S. Coassin, C. Sei-farth, M. Summerer, J. Bektic, H. Klocker, and F. Kronenberg. Somatic mutationsthroughout the entire mitochondrial genome are associated with elevated PSAlevels in prostate cancer patients. Am J Hum Genet, 87(6):802–12, Dec 2010.
[43] R. Kumar, K. Chaudhary, S. Gupta, H. Singh, S. Kumar, A. Gautam, P. Kapoor,and G. P. Raghava. CancerDR: cancer drug resistance database. Sci Rep, 3:1445,March 2013.
[44] N. Kurn, P. Chen, J. D. Heath, A. Kopf-Sill, K. M. Stephens, and S. Wang. Novelisothermal, linear nucleic acid amplification systems for highly multiplexed ap-plications. Clin Chem, 51(10):1973–81, Oct 2005.
[45] O. Kutuk and A. Letai. Alteration of the mitochondrial apoptotic pathway is keyto acquired paclitaxel resistance and can be reversed by ABT-737. Cancer Res,68(19):7985–94, Oct 2008.
[46] D. Lai, K. C. Ho, Y. Hao, and X. Yang. Taxol resistance in breast cancer cells ismediated by the hippo pathway component TAZ and its downstream transcrip-tional targets Cyr61 and CTGF. Cancer Res, 71(7):2728–38, Apr 2011.
[47] B. Langmead and S. L. Salzberg. Fast gapped-read alignment with Bowtie 2. NatMethods, 9(4):357–9, Mar 2012.
[48] B. Langmead, C. Trapnell, M. Pop, and S. L. Salzberg. Ultrafast and memory-efficient alignment of short DNA sequences to the human genome. Genome Biol,10(3):R25, Mar 2009.
[49] K. Lao, N. L. Xu, and N. A. Straus. Whole genome amplification using single-primer PCR. Biotechnol J, 3(3):378–82, Mar 2008.
[50] D. E. Larson, C. C. Harris, K. Chen, D. C. Koboldt, T. E. Abbott, D. J. Dooling,T. J. Ley, E. R. Mardis, R. K. Wilson, and L. Ding. SomaticSniper: identificationof somatic point mutations in whole genome sequencing data. Bioinformatics,28(3):311–7, Feb 2012.
[51] A. Lauri, G. Lazzari, C. Galli, I. Lagutina, E. Genzini, F. Braga, P. Mariani, and J. L.Williams. Assessment of MDA efficiency for genotyping using cloned embryobiopsies. Genomics, 101(1):24–9, Jan 2013.
[52] S. Le, J. Josse, and F. Husson. FactoMineR: An R package for multivariate analy-sis. J Stat Softw, 25(1):1–18, Mar 2008.
113

[53] H. Li, B. Handsaker, A. Wysoker, T. Fennell, J. Ruan, N. Homer, G. Marth,G. Abecasis, R. Durbin, and Subgroup Genome Project Data Processing. TheSequence Alignment/Map format and SAMtools. Bioinformatics, 25(16):2078–9,Aug 2009.
[54] L. Lin, B. Hutzen, H. F. Lee, Z. Peng, W. Wang, C. Zhao, H. J. Lin, D. Sun, P. K.Li, C. Li, H. Korkaya, M. S. Wicha, and J. Lin. Evaluation of STAT3 signalingin ALDH+ and ALDH+/CD44+/CD24- Subpopulations of Breast Cancer Cells.PLoS One, 8(12):e82821, Dec 2013.
[55] M. T. Lin, C. C. Chang, S. T. Chen, H. L. Chang, J. L. Su, Y. P. Chau, and M. L.Kuo. Cyr61 expression confers resistance to apoptosis in breast cancer MCF-7cells by a mechanism of NF-kappaB-dependent XIAP up-regulation. J Biol Chem,279(23):24015–23, Jun 2004.
[56] W. L. Lingle, W. H. Lutz, J. N. Ingle, N. J. Maihle, and J. L. Salisbury. Centrosomehypertrophy in human breast tumors: implications for genomic stability and cellpolarity. Proc Natl Acad Sci U S A, 95(6):2950–5, Mar 1998.
[57] Y. Liu, L. Chen, T. C. Ko, A. P. Fields, and E. A. Thompson. Evi1 is a survivalfactor which conveys resistance to both TGFbeta- and taxol-mediated cell deathvia PI3K/AKT. Oncogene, 25(25):3565–75, Feb 2006.
[58] F. J. Livesey. Strategies for microarray analysis of limiting amounts of RNA. BriefFunct Genomic Proteomic, 2(1):31–6, Apr 2003.
[59] M. M. Magiera, M. Gupta, C. J. Rundell, N. Satish, I. Ernens, and S. J. Yarwood.Exchange protein directly activated by cAMP (EPAC) interacts with the lightchain (LC) 2 of MAP1A. Biochem J, 382(Pt 3):803–10, Sep 2004.
[60] C. M. Malboeuf, X. Yang, P. Charlebois, J. Qu, A. M. Berlin, M. Casali, K. N.Pesko, C. L. Bout well, J. P. DeVincenzo, G. D. Ebel, T. M. Allen, M. C. Zody,M. R. Henn, and J. Z. Levin. Complete viral RNA genome sequencing of ultra-low copy samples by sequence-independent amplification. Nucleic Acids Res,41(1):e13, Jan 2013.
[61] E. R. Mardis. A decade’s perspective on DNA sequencing technology. Nature,470(7333):198–203, Feb 2011.
[62] Marinov, G. K. and Williams, B. A. and McCue, K. and Schroth, G. P. and Gertz,J. and Myers, R. M. and Wold, B. J. From single-cell to cell-pool transcriptomes:stochasticity in gene expression and RNA splicing. Genome Res, 24(3):496–510,Mar 2014.
[63] M. Matsushima, T. Fujiwara, E. Takahashi, T. Minaguchi, Y. Eguchi, Y. Tsujimoto,K. Suzumori, and Y. Nakamura. Isolation, mapping, and functional analysis of a
114

novel human cDNA (BNIP3L) encoding a protein homologous to human NIP3.Genes Chromosomes Cancer, 21(3):230–5, Mar 1998.
[64] A. M. McGee, D. L. Douglas, Y. Liang, S. M. Hyder, and C. P. Baines. The mito-chondrial protein C1qbp promotes cell proliferation, migration and resistance tocell death. Cell Cycle, 10(23):4119–27, Dec 2011.
[65] B. T. McGrogan, B. Gilmartin, D. N. Carney, and A. McCann. Taxanes, micro-tubules and chemoresistant breast cancer. Biochim Biophys Acta, 1785(2):96–132,Nov 2008.
[66] A. Mortazavi, B. A. Williams, K. McCue, L. Schaeffer, and B. Wold. Mapping andquantifying mammalian transcriptomes by RNA-Seq. Nat Methods, 5(7):621–8,Jul 2008.
[67] L. Musumeci, J. W. Arthur, F. S. Cheung, A. Hoque, S. Lippman, and J. K. Re-ichardt. Single nucleotide differences (SNDs) in the dbSNP database may lead toerrors in genotyping and haplotyping studies. Hum Mutat, 31(1):67–73, Jan 2010.
[68] S. Nakayama, Y. Torikoshi, T. Takahashi, T. Yoshida, T. Sudo, T. Matsushima,Y. Kawasaki, A. Katayama, K. Gohda, G. N. Hortobagyi, S. Noguchi, T. Sakai,H. Ishihara, and N. T. Ueno. Prediction of paclitaxel sensitivity by CDK1 andCDK2 activity in human breast cancer cells. Breast Cancer Res, 11(1):R12, Feb2009.
[69] S. Neph, M. S. Kuehn, A. P. Reynolds, E. Haugen, R. E. Thurman, A. K. Johnson,E. Rynes, M. T. Maurano, J. Vierstra, S. Thomas, R. Sandstrom, R. Humbert, andJ. A. Stamatoyannopoulos. BEDOPS: high-performance genomic feature opera-tions. Bioinformatics, 28(14):1919–20, Jul 2012.
[70] K. Nishikura. Functions and regulation of RNA editing by ADAR deaminases.Annu Rev Biochem, 79:321–49, Mar 2010.
[71] J. V. Olsen, M. Vermeulen, A. Santamaria, C. Kumar, M. L. Miller, L. J. Jensen,F. Gnad, J. Cox, T. S. Jensen, E. A. Nigg, S. Brunak, and M. Mann. Quantita-tive phosphoproteomics reveals widespread full phosphorylation site occupancyduring mitosis. Sci Signal, 3(104):ra3, Jan 2010.
[72] D. J. Pagliarini, S. E. Calvo, B. Chang, S. A. Sheth, S. B. Vafai, S. E. Ong, G. A.Walford, C. Sugiana, A. Boneh, W. K. Chen, D. E. Hill, M. Vidal, J. G. Evans, D. R.Thorburn, S. A. Carr, and V. K. Mootha. A mitochondrial protein compendiumelucidates complex I disease biology. Cell, 134(1):112–23, Jul 2008.
[73] E. Park, B. Williams, B. J. Wold, and A. Mortazavi. RNA editing in the humanENCODE RNA-seq data. Genome Res, 22(9):1626–33, Sep 2012.
115

[74] B. Pedrotti and K. Islam. Purified native microtubule associated protein MAP1A:kinetics of microtubule assembly and MAP1A/tubulin stoichiometry. Biochem-istry, 33(41):12463–70, Oct 1994.
[75] Z. Peng, Y. Cheng, B. C. Tan, L. Kang, Z. Tian, Y. Zhu, W. Zhang, Y. Liang, X. Hu,X. an d Tan, J. Guo, Z. Dong, Y. Liang, L. Bao, and J. Wang. Comprehensive anal-ysis of RNA-Seq data reveals extensive RNA editing in a human transcriptome.Nat Biotechnol, 30(3):253–60, Feb 2012.
[76] Quail, M. A. and Smith, M. and Coupland, P. and Otto, T. D. and Harris, S. R. andConnor, T. R. and Bertoni, A. and Swerdlow, H. P. and Gu, Y. A tale of three nextgeneration sequencing platforms: comparison of Ion Torrent, Pacific Biosciencesand Illumina MiSeq sequencers. BMC Genomics, 13:341, Jul 2012.
[77] A. J. Radenbaugh, S. Ma, A. Ewing, J. Stuart, E.A. Collisson, J. Zhu, and D. Haus-sler. RADIA: RNA and DNA Integrated Analysis for Somatic Mutation Detec-tion. PLoS One, Nov 2014. (Accepted: Oct 2014).
[78] G. Ramaswami, R. Zhang, R. Piskol, L. P. Keegan, P. Deng, M. A. O’Connell, andJ. B. Li. Identifying RNA editing sites using RNA sequencing data alone. NatMethods, 10(2):128–32, Jan 2013.
[79] D. Ramskold, S. Luo, Y. C. Wang, R. Li, Q. Deng, O. R. Faridani, G. A. Daniels,I. Khrebtuko va, J. F. Loring, L. C. Laurent, G. P. Schroth, and R. Sandberg. Full-length mRNA-Seq from single-cell levels of RNA and individual circulating tu-mor cells. Nat Biotechnol, 30(8):777–82, Aug 2012.
[80] E. Ruiz-Pesini, M. T. Lott, V. Procaccio, J. C. Poole, M. C. Brandon, D. Mish-mar, C. Yi, J. Kreuziger, P. Baldi, and D. C. Wallace. An enhanced MITOMAPwith a global mtDNA mutational phylogeny. Nucleic Acids Res, 35(Databaseissue):D823–8, Jan 2007.
[81] R. K. Saiki, S. Scharf, F. Faloona, K. B. Mullis, G. T. Horn, H. A. Erlich, and N. Arn-heim. Enzymatic amplification of beta-globin genomic sequences and restrictionsite analysis for diagnosis of sickle cell anemia. Science, 230(4732):1350–4, Dec1985.
[82] Saliba, A. E. and Westermann, A. J. and Gorski, S. A. and Vogel, J. Single-cellRNA-seq: advances and future challenges. Nucleic Acids Res, 42(14):8845–60, Jul2014.
[83] N. Samadi, C. Gaetano, I. S. Goping, and D. N. Brindley. Autotaxin protectsMCF-7 breast cancer and MDA-MB-435 melanoma cells against taxol-inducedapoptosis. Oncogene, 28(7):1028–39, Dec 2009.
[84] J. Z. Sanborn. Tumor versus Matched-Normal Sequencing Analysis and DataIntegration, 2012. PhD dissertation (California Digital Library, Santa Cruz, CA).
116

[85] Y. Sasagawa, I. Nikaido, T. Hayashi, H. Danno, K. D. Uno, T. Imai, and H. R.Ueda. Quartz-Seq: a highly reproducible and sensitive single-cell RNA sequenc-ing method, reveals non-genetic gene-expression heterogeneity. Genome Biol,14(4):R31, 2013.
[86] N. A. Saunders, F. Simpson, E. W. Thompson, M. M. Hill, L. Endo-Munoz,G. Leggatt, R . F. Minchin, and A. Guminski. Role of intratumoural heterogeneityin cancer drug resistance: molecular and clinical perspectives. EMBO Mol Med,4(8):675–84, Aug 2012.
[87] Roberto Scatena, Patrizia Bottoni, and Bruno Giardina. Advances in MitochondrialMedicine, volume 942 of Advances in Experimental Medicine and Biology. Springer,2012.
[88] S. Sehrawat, X. Cullere, S. Patel, Jr. Italiano, J., and T. N. Mayadas. Role of Epac1,an exchange factor for Rap GTPases, in endothelial microtubule dynamics andbarrier function. Mol Biol Cell, 19(3):1261–70, Mar 2008.
[89] A. K. Shalek, R. Satija, X. Adiconis, R. S. Gertner, J. T. Gaublomme, R. Raychowd-hury, S. Schwartz, N. Yosef, C. Malboeuf, D. Lu, J. J. Trombetta, D. Gennert,A. Gnirke, A. Goren, N. Hacohen, J. Z. Levin, H. Park, and A. Regev. Single-celltranscriptomics reveals bimodality in expression and splicing in immune cells.Nature, 498(7453):236–40, Jun 2013.
[90] S. V. Sharma, D. Y. Lee, B. Li, M. P. Quinlan, F. Takahashi, S. Maheswaran, U. Mc-Dermott, N. Azizian, L. Zou, M. A. Fischbach, K. K. Wong, K. Brandstetter,B. Wittner, S. Ramaswamy, M. Classon, and J. Settleman. A chromatin-mediatedreversible drug-tolerant state in cancer cell subpopulations. Cell, 141(1):69–80,Apr 2010.
[91] J. R. Shearstone, N. E. Allaire, J. Campos-Rivera, S. Rao, and S. Perrin. Accurateand precise transcriptional profiles from 50 pg of total RNA or 100 flow-sortedprimary lymphocytes. Genomics, 88(1):111–21, Jul 2006.
[92] S. T. Sherry, M. Ward, and K. Sirotkin. dbSNP-database for single nucleotidepolymorphisms and other classes of minor genetic variation. Genome Res,9(8):677–9, Aug 1999.
[93] L. Shkreta, U. Froehlich, E. R. Paquet, J. Toutant, S. A. Elela, and B. Chabot. An-ticancer drugs affect the alternative splicing of Bcl-x and other human apoptoticgenes. Mol Cancer Ther, 7(6):1398–409, Jun 2008.
[94] R. Siegel, D. Naishadham, and A. Jemal. Cancer statistics, 2012. CA Cancer J Clin,62(1):10–29, Jan 2012.
117

[95] A. H. Sillars-Hardebol, B. Carvalho, J. A. Belien, M. de Wit, P. M. Delis-vanDiemen, M. Tijssen, M. A. van de Wiel, F. Ponten, R. J. Fijneman, and G. A. Mei-jer. BCL2L1 has a functional role in colorectal cancer and its protein expressionis associated with chromosome 20q gain. J Pathol, 226(3):442–50, Feb 2012.
[96] D. Sims, I. Sudbery, N. E. Ilott, A. Heger, and C. P. Ponting. Sequencing depthand coverage: key considerations in genomic analyses. Nat Rev Genet, 15(2):121–32, Feb 2014.
[97] J. L. Sun, X. S. He, Y. H. Yu, and Z. C. Chen. Expression and structure of BNIP3Lin lung cancer. Ai Zheng, 23(1):8–14, Jan 2004.
[98] R. Suzuki and H. Shimodaira. Pvclust: an R package for assessing the uncer-tainty in hierarchical clustering. Bioinformatics, 22(12):1540–2, Apr 2006.
[99] C. Swanton. Intratumor heterogeneity: evolution through space and time. CancerRes, 72(19), Oct 2012.
[100] Y. Tabuchi, J. Matsuoka, M. Gunduz, T. Imada, R. Ono, M. Ito, T. Motoki, Y. Ya-matsuji, T. an d Shirakawa, M. Takaoka, M. Haisa, N. Tanaka, J. Kurebayashi,V. C. Jordan, and Y. Naomoto. Resistance to paclitaxel therapy is related withBcl-2 expression through an estrogen receptor mediated pathway in breast can-cer. Int J Oncol, 34(2):313–9, Feb 2009.
[101] S. Tagami, Y. Eguchi, M. Kinoshita, M. Takeda, and Y. Tsujimoto. A novel pro-tein, RTN-XS, interacts with both Bcl-XL and Bcl-2 on endoplasmic reticulumand reduces their anti-apoptotic activity. Oncogene, 19(50):5736–46, Nov 2000.
[102] F. Tang, C. Barbacioru, E. Nordman, B. Li, N. Xu, V. I. Bashkirov, K. Lao, andM. A. Surani. RNA-Seq analysis to capture the transcriptome landscape of asingle cell. Nat Protoc, 5(3):516–35, Mar 2010.
[103] T. Tang, B. Zheng, S. H. Chen, A. N. Murphy, K. Kudlicka, H. Zhou, and M. G.Farquhar. hNOA1 interacts with complex I and DAP3 and regulates mitochon-drial respiration and apoptosis. J Biol Chem, 284(8):5414–24, Feb 2009.
[104] M. A. Tariq, H. J. Kim, O. Jejelowo, and N. Pourmand. Whole-transcriptomeRNAseq analysis from minute amount of total rna. Nucleic Acids Res, 39(18):e120,2011.
[105] R Core Team. R: A Language and Environment for Statistical Computing. R Founda-tion for Statistical Computing, Vienna, Austria, 2012.
[106] P. D. Thomas, M. J. Campbell, A. Kejariwal, H. Mi, B. Karlak, R. Daverman,K. Diemer, A. Muruganujan, and A. Narechania. PANTHER: a library of proteinfamilies and subfamilies indexed by function. Genome Res, 13(9):2129–41, Sep2003.
118

[107] Y. Tian, A. C. Tan, X. Sun, M. T. Olson, Z. Xie, N. Jinawath, D. W. Chan, M. Shih Ie,Z. Zhang, and H. Zhang. Quantitative proteomic analysis of ovarian cancercells identified mitochondrial proteins associated with Paclitaxel resistance. Pro-teomics Clin Appl, 3(11):1288–95, Nov 2009.
[108] C. Trapnell, L. Pachter, and S. L. Salzberg. TopHat: discovering splice junctionswith RNA-Seq. Bioinformatics, 25(9):1105–11, May 2009.
[109] S. Tugendreich, J. Tomkiel, W. Earnshaw, and P. Hieter. CDC27Hs colocalizeswith CDC16Hs to the centrosome and mitotic spindle and is essential for themetaphase to anaphase transition. Cell, 81(2):261–8, Apr 1995.
[110] Tusher, V. G. and Tibshirani, R. and Chu, G. Significance analysis of microarraysapplied to the ionizing radiation response. Proc Natl Acad Sci U S A, 98(9):5116–21, Apr 2001.
[111] L. Wang, Z. Feng, X. Wang, X. Wang, and X. Zhang. DEGseq: an R packagefor identifying differentially expressed genes from RNA-seq data. Bioinformatics,26(1):136–8, Jan 2010.
[112] L. Wang, S. Wang, and W. Li. RSeQC: quality control of RNA-seq experiments.Bioinformatics, 28(16):2184–5, Aug 2012.
[113] B Ward and K Heuermann. TransplexTM
whole transcriptome amplification ofRNA from low cell-number samples. Journal of biomolecular techniques: JBT, 21(3Suppl):S30, 2010.
[114] A. Watanabe, S. Yasuhira, T. Inoue, S. Kasai, M. Shibazaki, K. Takahashi,T. Akasaka, T. Mas uda, and C. Maesawa. BCL2 and BCLxL are key determinantsof resistance to antitubulin chemotherapeutics in melanoma cells. Exp Dermatol,22(8):518–23, Aug 2013.
[115] J. D. Watson, S. Wang, S. E. Von Stetina, W. C. Spencer, S. Levy, P. J. Dexheimer,J. D. Kurn, N. a nd Heath, and 3rd Miller, D. M. Complementary RNA amplifi-cation methods enhance microarray identification of transcripts expressed in theC. elegans n ervous system. BMC Genomics, 9:84, Feb 2008.
[116] S. Willimott, T. Merriam, and S. D. Wagner. Apoptosis induces Bcl-XS andcleaved Bcl-XL in chronic lymphocytic leukaemia. Biochem Biophys Res Commun,405(3):480–5, Feb 2011.
[117] A. Wilm, P. P. Aw, D. Bertrand, G. H. Yeo, S. H. Ong, C. H. Wong, C. C. Khor,R. Petric, M. L. Hibberd, and N. Nagarajan. LoFreq: a sequence-quality aware,ultra-sensitive variant caller for uncovering cell-population heterogeneity fromhigh-throughput sequencing datasets. Nucleic Acids Res, 40(22):11189–201, Dec2012.
119

[118] A. R. Wu, N. F. Neff, T. Kalisky, P. Dalerba, B. Treutlein, M. E. Rothenberg, F. M.Mburu, G. L. Mantalas, S. Sim, M. F. Clarke, and S. R. Quake. Quantitative as-sessment of single-cell RNA-sequencing methods. Nat Methods, 11(1):41–6, Jan2014.
[119] X. Xu, Y. Hou, X. Yin, L. Bao, A. Tang, L. Song, F. Li, S. Tsang, K. Wu, H. Wu,W. He, L. Zeng, M. Xing, R. Wu, H. Jiang, X. Liu, D. Cao, G. Guo, X. Hu, Y. Gui,Z. Li, W. Xie, X. Sun, M. Shi, Z. Cai, B. Wang, M. Zhong, J. Li, Z. Lu, N. Gu,X. Zhang, L. Goodman, L. Bolund, J. Wang, H. Yang, K. Kristiansen, M. Dean,and Y. Li. Single-cell exome sequencing reveals single-nucleotide mutation char-acteristics of a kidney tumor. Cell, 148(5):886–95, 2012.
[120] N. Yamakawa, K. Kaneda, Y. Saito, E. Ichihara, and K. Morishita. The increasedexpression of integrin alpha6 (ITGA6) enhances drug resistance in EVI1(high)leukemia. PLoS One, 7(1):e30706, Jan 2012.
[121] L. Yan, M. Yang, H. Guo, L. Yang, J. Wu, R. Li, P. Liu, Y. Lian, X. Zheng, J .Yan, J. Huang, M. Li, X. Wu, L. Wen, K. Lao, R. Li, J. Qiao, and F. Tang. Single-cell RNA-Seq profiling of human preimplantation embryos and embryonic stemcells. Nat Struct Mol Biol, 20(9):1131–9, Sep 2013.
[122] D. A. Yardley. Drug resistance and the role of combination chemotherapy inimproving patient outcomes. Int J Breast Cancer, 2013:137414, June 2013.
[123] Ye, K. and Lu, J. and Ma, F. and Keinan, A. and Gu, Z. Extensive pathogenicityof mitochondrial heteroplasmy in healthy human individuals. Proc Natl Acad SciU S A, 111(29):10654–9, Jul 2014.
[124] H. G. Zhou and C. Zhang. Study on application of the whole genome amplifica-tion in LCN. Fa Yi Xue Za Zhi, 22(1):43–4, 47, Feb 2006.
[125] L. Zhou, X. Cai, X. Han, N. Xu, and D. C. Chang. CDK1 switches mitotic arrest toapoptosis by phosphorylating Bcl-2/Bax family proteins during treatment withmicrotubule interfering agents. Cell Biol Int, Feb 2014.
[126] M. Zhou, Z. Liu, Y. Zhao, Y. Ding, H. Liu, Y. Xi, W. Xiong, G. Li, J. Lu, O. Fodstad,A. I. Riker, and M. Tan. MicroRNA-125b confers the resistance of breast cancercells to paclitaxel through suppression of pro-apoptotic Bcl-2 antagonist killer 1(Bak1) expression. J Biol Chem, 285(28):21496–507, Jul 2010.
[127] T. Zhou, J. P. Aumais, X. Liu, L. Y. Yu-Lee, and R. L. Erikson. A role for Plk1phosphorylation of NudC in cytokinesis. Dev Cell, 5(1):127–38, Jul 2003.
[128] T. Zhou, W. Zimmerman, X. Liu, and R. L. Erikson. A mammalian NudC-likeprotein essential for dynein stability and cell viability. Proc Natl Acad Sci U S A,103(24):9039–44, Jun 2006.
120