Single and Competitive Protein Sorption at Soft Polymeric ...
96
Single and Competitive Protein Sorption at Soft Polymeric Interfaces vorgelegt von Diplom-Chemiker Michael Oberle geb. in Frankfurt am Main von der Fakultät II - Mathematik und Naturwissenschaften der Technischen Universität Berlin zur Erlangung des akademischen Grades Doktor der Naturwissenschaften - Dr. rer. nat. - genehmigte Dissertation Promotionsausschuss: Vorsitzender: Prof. Dr. Thorsten Ressler Berichter/Gutachter: Prof. Dr. Matthias Ballauff Berichter/Gutachter: Prof. Dr. Regine von Klitzing Berichter/Gutachter: Prof. Dr. Gerhard H. Findenegg Tag der wissenschaftlichen Aussprache: 6. Juni 2016 Berlin 2016
Transcript of Single and Competitive Protein Sorption at Soft Polymeric ...

Single and Competitive Protein Sorption at SoftPolymeric Interfaces
vorgelegt von
Diplom-Chemiker
Michael Oberle
geb. in Frankfurt am Main
von der Fakultät II - Mathematik und Naturwissenschaften
der Technischen Universität Berlin
zur Erlangung des akademischen Grades
Doktor der Naturwissenschaften
- Dr. rer. nat. -
genehmigte Dissertation
Promotionsausschuss:
Vorsitzender: Prof. Dr. Thorsten Ressler
Berichter/Gutachter: Prof. Dr. Matthias Ballauff
Berichter/Gutachter: Prof. Dr. Regine von Klitzing
Berichter/Gutachter: Prof. Dr. Gerhard H. Findenegg
Tag der wissenschaftlichen Aussprache: 6. Juni 2016
Berlin 2016


«Die Fragen sind es, aus denen das, was bleibt, entsteht»Erich Kästner


Meiner Mutter


Spherical nanoparticles with polymer coatings or entirely composed of polymers have their own techno-
logical importance as drug carriers. These nanostructures can be constructed as stimuli-responsive de-
vices that deliver a drug in spatial-, temporal- and dosage-controlled fashion. The nanoparticles rapidly
form a protein corona as soon as they get immersed in biological fluids like blood or plasma. Ultimately,
the composition of the protein corona will modify the physical/chemical properties of the nanoparticle
and will determine its biological fate. The fact is that competitive and cooperative adsorption of different
proteins play a pivotal role in this process.
In this thesis charged and uncharged core-shell microgels were used as model systems to study single
and competitive protein adsorptions. The microgels consist of a solid polystyrene core, a highly swollen
poly-(N-isopropylacrylamide) shell and defined amounts of acrylic acid to introduce charge. Experi-
mental data for the adsorption of single type proteins were obtained by Isothermal Titration Calorimetry
(ITC). The challenges of using ITC as a method to characterize protein nanoparticle interactions are dis-
cussed. Finally, the evaluation of ITC data with the Langmuir model and a cooperative binding model
are compared. In contrast to the Langmuir model this model offers a more quantitative interpretation of
binding isotherms with the advantage to show more details regarding the driving forces contributing to
the adsorption process. In a second part experimental data for the competitive adsorption from binary
mixtures were obtained by fluorescence spectroscopy and compared to the predictions from the coopera-
tive binding model. It was demonstrated that for the proteins lysozyme, papain, RNase and cytochrome c
the experimental data are in good agreement with the predictions and the expansion to multi-component
mixtures is possible.
The remaining parts of the thesis are concerned with the structural properties of the core-shell micro-
gels. For this purpose the polymers were investigated by Atomic Force Microscopy (AFM) and Anoma-
lous Small Angle X-ray Scattering (ASAXS). The AFM images in air revealed a strongly collapsed
structure on a silicon surface. Moreover, the adsorption of lysozyme onto the shell of the microgel
changed the phase of the AFM signal indicating a change in the mechanical properties. For the mea-
surements in liquid it was shown that the microgels can be attached via electrostatic interactions with a
functionalized silicon surface. Upon protein adsorption the shell of the surface-attached microgels began
to shrink. For the ASAXS part the Fe-containing protein cytochrome c was adsorbed onto the microgel
and analyzed in the energy range of the K-absorption edge of Fe at three different energies. From the
pure-resonant scattering contribution the thickness of the protein layer is determined and correlated with
the corresponding protein concentration.


Sphärische Nanopartikel mit Polymerbeschichtungen oder vollständig aus Polymeren zusammengesetzte
Nanopartikel haben eine große technologische Bedeutung als Trägermaterialien für Medikamente. Diese
Nanostrukturen können so konstruiert werden, dass durch einen äußeren Reiz die Wirkstofffreisetzung
zeitlich und räumlich kontrolliert erfolgen kann. Ebenso kann über diesen Weg die Dosierung kontrolliert
werden. Sobald Nanopartikel mit biologischen Flüssigkeiten wie Blut oder Plasmaplasma in Kontakt
kommen, bildet sich um diese eine Protein Korona. Die Zusammensetzung der Protein Korona bestimmt
jetzt die physikalischen- und chemischen Eigenschaften der Nanopartikel und die Wechselwirkungen mit
einem Organismus. In diesem Prozess spielt die kompetitive und kooperative Adsorption verschiedener
Proteine eine wichtige Rolle.
In dieser Arbeit wurde die Adsorption von einzelnen Proteinsorten und die kompetitive Adsorption aus
Proteinmischungen auf geladene Kern-Schale Mikrogele untersucht. Die Mikrogele bestehen aus einem
festen Polystyrolkern, einer stark gequollenen Schale aus Poly-(N-isopropylacrylamide) und definierten
Mengen des Copolymers Acrylsäure, welches eine geladene Carboxylgruppe in das Mikrogel einführt.
Die Adsorptionsisothermen einzelner Proteinsorten wurden mit der Isothermalen Titrationskalorimetrie
(ITC) gemessen. In diesem Zusammenhang wurden die Herausforderungen dieser Methode zur Charak-
terisierung von Protein-Nanopartikel-Wechselwirkungen diskutiert. Ferner wurde die Auswertung der
ITC-Daten mit dem Langmuir-Modell und einem "kooperativen"Bindungsmodell verglichen. Im Ge-
gensatz zum Langmuir-Modell bietet dieses Bindungsmodell eine quantitative Analyse der Bindungs-
isothermen, mit der Möglichkeit mehr Details zu den treibenden Kräften, die zur Adsorption beitra-
gen, zu verarbeiten. In einem weiteren Teil der Arbeit wurde die kompetitive Adsorption aus binären
Proteinmischungen mit Fluoreszenzspektroskopie gemessen und mit Vorhersagen durch das "kooperati-
ve"Bindungsmodell verglichen. Es wurde gezeigt, dass die die experimentellen Daten für die Proteine
Lysozym, Papain, RNase und Cytochrome c in guter Übereinstimmung mit den Vorhersagen sind.
Die weiteren Teile der Dissertation beschäftigen sich mit den strukturellen Eigenschaften der Kern-
Schale Mikrogele. Zu diesem Zweck wurden die Polymere mit Rasterkraftmikroskopie (AFM) und an-
omaler Kleinwinkelröntgenstreuung (ASAXS) untersucht. Die AFM-Bilder in Luft zeigten eine stark
zusammengeschrumpfte Struktur auf einer Siliziumoberfläche. Darüber hinaus konnte bei der Adsorpti-
on von Lysozym auf die Schale des Mikrogels eine Phasenänderung des AFM-Signals festgestellt wer-
den, welches auf eine Änderung der mechanischen Eigenschaften des Polymers hinweist. Für die AFM
Messungen in Flüssigkeit wurde gezeigt, dass die Mikrogele über elektrostatische Wechselwirkungen
auf einer funktionalisierten Siliziumoberfläche immobilisiert werden können. Zusätzliche konnte gezeigt
werden, dass die Proteinadsorption zu einem Schrumpfen des auf der Oberfläche gebundenen Mikrogels
führt.
Für die ASAXS Messungen wurden das eisenhaltige Protein Cytochrom c auf das Mikrogel adsorbiert
und die Probe wurde bei drei verschiedenen Energien am Rand der K-Kante von Eisen gemessen. Aus
dem Betrag der rein resonanten Streuung der eisenhaltigen Proteins konnte sowohl die Dicke der Prote-
inschicht ermittelt werden als auch die entsprechende Proteinkonzentration pro Nanopartikel.

Contents
1 Introduction 1
1.1 Protein Material Interactions . . . . . . . . . . . . . . . . . . . . . . . . . . . . . . . . 1
1.2 Competitive Protein Adsorption and the Protein Corona . . . . . . . . . . . . . . . . . . 2
1.3 Non-Competitive Protein Adsorption: The Langmuir Model . . . . . . . . . . . . . . . 5
1.4 Competitive Protein Adsorptions: Models . . . . . . . . . . . . . . . . . . . . . . . . . 7
2 Objective of this Thesis 8
3 Fundamentals and Theory 9
3.1 Stimuli-Sensitive Microgels - Model Systems for Protein Material Interactions . . . . . . 9
3.1.1 Introduction . . . . . . . . . . . . . . . . . . . . . . . . . . . . . . . . . . . . . 9
3.1.2 Poly-NIPAM based Core-Shell Microgels . . . . . . . . . . . . . . . . . . . . . 10
3.1.3 Interactions of Proteins with Poly-NIPAM based Core-Shell Microgels . . . . . 11
3.1.4 Swelling behaviour of Poly-NIPAM based Core-Shell Microgels . . . . . . . . . 14
3.1.5 Interactions of Microgels with Surfaces . . . . . . . . . . . . . . . . . . . . . . 14
3.2 Characterization of Single Protein Adsorptions to Core-Shell Microgels . . . . . . . . . 15
3.2.1 Isothermal Titration Calorimetry (ITC) . . . . . . . . . . . . . . . . . . . . . . 15
3.2.2 Evaluation of ITC data . . . . . . . . . . . . . . . . . . . . . . . . . . . . . . . 17
3.2.3 Problems of ITC . . . . . . . . . . . . . . . . . . . . . . . . . . . . . . . . . . 19
3.2.4 Small Angle Scattering (SAS) . . . . . . . . . . . . . . . . . . . . . . . . . . . 22
3.2.4.1 Theory of SAS . . . . . . . . . . . . . . . . . . . . . . . . . . . . . . 23
3.2.4.2 ASAXS . . . . . . . . . . . . . . . . . . . . . . . . . . . . . . . . . 25
3.3 Characterization of Competitive Protein Adsorptions to Microgels . . . . . . . . . . . . 26
3.3.1 Fluorescence Spectroscopy . . . . . . . . . . . . . . . . . . . . . . . . . . . . . 26
3.4 The Cooperative Binding Model (CB-model) . . . . . . . . . . . . . . . . . . . . . . . 27
3.4.1 Derivation of the Cooperative Binding Model . . . . . . . . . . . . . . . . . . . 28
3.4.1.1 Electrostatic Interactions . . . . . . . . . . . . . . . . . . . . . . . . 30
3.4.1.2 Pair Interactions . . . . . . . . . . . . . . . . . . . . . . . . . . . . . 32
3.4.1.3 Volume Effects . . . . . . . . . . . . . . . . . . . . . . . . . . . . . . 32
4 Results and Discussion 34
4.1 Binding Isotherms of Core-Shell Microgels to Single Proteins (ITC) . . . . . . . . . . . 34
4.1.1 Langmuir Fits . . . . . . . . . . . . . . . . . . . . . . . . . . . . . . . . . . . . 34

4.1.2 Cooperative Binding Model Fits . . . . . . . . . . . . . . . . . . . . . . . . . . 40
4.2 Competitive Adsorption . . . . . . . . . . . . . . . . . . . . . . . . . . . . . . . . . . . 43
4.3 Cytochrome c Adsorption as measured by Anomalous Small Angle X-ray Scattering
(ASAXS) . . . . . . . . . . . . . . . . . . . . . . . . . . . . . . . . . . . . . . . . . . 46
4.4 Adsorption of Lysozyme as measured by AFM . . . . . . . . . . . . . . . . . . . . . . 50
5 Summary and Outlook 53
6 Materials and Methods 55
6.1 Materials . . . . . . . . . . . . . . . . . . . . . . . . . . . . . . . . . . . . . . . . . . 55
6.2 Proteins . . . . . . . . . . . . . . . . . . . . . . . . . . . . . . . . . . . . . . . . . . . 55
6.3 Synthesis and Characterization of Core-Shell Microgels . . . . . . . . . . . . . . . . . . 55
6.3.1 Synthesis of the Polystyrene Cores . . . . . . . . . . . . . . . . . . . . . . . . . 55
6.3.2 Synthesis of the Shell . . . . . . . . . . . . . . . . . . . . . . . . . . . . . . . . 56
6.3.3 Transmission Electron Microscopy (TEM) . . . . . . . . . . . . . . . . . . . . 57
6.3.4 Conductometric and Potentiometric Titrations . . . . . . . . . . . . . . . . . . . 58
6.3.5 Dynamic Light Scattering (DLS) . . . . . . . . . . . . . . . . . . . . . . . . . . 58
6.4 Isothermal Titration Calorimetry . . . . . . . . . . . . . . . . . . . . . . . . . . . . . . 59
6.5 Fluorescence Spectroscopy . . . . . . . . . . . . . . . . . . . . . . . . . . . . . . . . . 60
6.5.1 Labeling with Fluorescein isothiocyanate . . . . . . . . . . . . . . . . . . . . . 60
6.5.1.1 Experimental Setup for a Binary Protein Mixture . . . . . . . . . . . . 62
6.6 Atomic Force Microscopy . . . . . . . . . . . . . . . . . . . . . . . . . . . . . . . . . 62
6.6.1 Substrate Preparation . . . . . . . . . . . . . . . . . . . . . . . . . . . . . . . . 62
6.6.2 AFM Measurements and Analysis . . . . . . . . . . . . . . . . . . . . . . . . . 63
6.7 SAXS . . . . . . . . . . . . . . . . . . . . . . . . . . . . . . . . . . . . . . . . . . . . 63
6.8 ASAXS . . . . . . . . . . . . . . . . . . . . . . . . . . . . . . . . . . . . . . . . . . . 63
6.8.1 Sample Preparation . . . . . . . . . . . . . . . . . . . . . . . . . . . . . . . . . 63
6.8.2 Technical Details . . . . . . . . . . . . . . . . . . . . . . . . . . . . . . . . . . 63
7 Appendix 64
7.1 Frequently used variables for the derivation of the Cooperative Binding Model . . . . . . 64
8 Bibliography 65
9 List of Abbreviations 77
10 List of Figures 79
11 List of Tables 81
12 List of Publications and Presentations 82

13 Danksagung 83
1 Introduction
1.1 Protein Material Interactions
The effects of protein material interactions are of central importance in different fields of nanotechnology.
The design of non-fouling surfaces, for example, is equally interesting for maritime industries and the
development of new nano-scaled laboratory devices (see Figure 1.1 a and Figure 1.1 b). In nanomedicine
controlled drug release by nanoparticles requires no or little interference by unspecific protein interac-
tions (see Figure 1.1 c). There are also not fewer important applications where a defined protein material
interaction is necessary like the immobilization of proteins as catalysts or the purification of proteins by
chromatography.1 The goal of this section is to give a brief overview into this topic always keeping in
mind how protein material interactions affect previously mentioned fields and that it remains a challenge
to understand and control these interactions better.
Biofouling is defined as an undesirable accumulation of microorganisms on wetted artificial surfaces
and represents a major economic issue regarding maritime industries.2 In general, biofouling will in-
crease the roughness of a surface leading to a higher frictional resistance. Thus, considering ships bio-
fouling causes speed reduction, higher fuel consumption and maintenance costs. A common practice
to suppress biofouling involves the use of toxic biocides. However, they are also different strategies to
develop surface modifications, which are more environmentally friendly.3 It is assumed, that in the first
stage of biofouling a conditioning film mainly comprised of proteins adsorbs to the surface and catalyzes
the attachment of microorganisms, which finally cause macrofouling of the surface.4
In the health sector advances in nanotechnology had opened a variety of nanomaterials to improve
diagnosis, prevention and treatment of diseases. These nanomaterial have at least one dimension in the
range of 1 to 100 nm and can be considered as intermediates between small molecules and bulk materials.
Compared to their bulk material counterparts, the physio-chemical properties like size, surface charge,
stability and solubility are crucial for their physiological interactions. Biomaterials, coated medical
devices, and nanoparticles have enormous potential to improve medical treatments, but can cause adverse
or even toxic side effects. It is a well-known fact, that implanted and blood-contacted biomaterials can
induce adverse side effects like inflammation,5,6 thrombosis7 and infections.8 These effects can be traced
back to a quickly forming protein layer on the biomaterial. Furthermore, it is known that phagocytes
interact with the adsorbed proteins rather than with the material itself.9 It was also shown that formation
of such a layer can limit the performance of so called protein micro-arrays.10 These micro-arrays are
supposed to detect analytes in very low concentrations from complex mixtures, such as serum or blood.
Adsorption of other proteins than the antibodies used for detection will limit the sensitivity of such
1

a)
a)
b)
c)
Figure 1.1: Protein adsorptions occuring in different technological fields: a) Ship hull covered with a biofilm.
Here the biofilm is removed by an ultra-high pressure water jet. b) A lab on chip device us-
ing microfluidic technology. c) Scheme of a spherical nanoparticle loaded with a drug. In
comparison to drugs in tablet form, nanoparticles offer the possibility of controlled and targeted
drug release. Pictures reprinted from http://www.hydroblasting.co.uk/hydroblasting-services/anti-fouling.html
https://chemeng.adelaide.edu.au/losic-group/research/nanomedicine/ http://www.bioprocessonline.com
micro-arrays and are one of the key factors that control the limit-of-detection of the analyte. Thus, a
better understanding of the protein adsorption process will help to improve diagnostics with such micro-
arrays.
1.2 Competitive Protein Adsorption and the Protein Corona
The field of competitive protein adsorption has emerged in the 1960s by seminal contributions by Vroman
and Adam, who investigated the adsorption of plasma proteins onto metal oxides, silicon, and polymer
surfaces.11–14
It was found that fibrinogen adsorbs preferentially at short to intermediate contact time and then is
replaced by a number of different proteins from blood serum like kinogen or factor XII sequentially.
Sequential adsorption is not limited to fibrinogen and can be regarded as a general trend for many other
proteins.15,16 In general, under equilibrium conditions proteins with higher mobility arrive first at the sur-
face and are later sequentially replaced by less mobile proteins that have a higher affinity for the surface.
2

Figure 1.2: a) Illustration of the Vroman effect. Proteins which are present in high concentrations in the medium adsorb first
on the surface and get replaced over time by proteins with lower abundance in the medium but higher affinity to the
surface. b) Illustration of orientation and conformational changes of proteins which can occur during adsorption.
In Figure 1.2 a the sequential replacement of proteins over time, commonly termed as "Vroman effect",
is illustrated. Figure 1.2 b illustrates how proteins adsorbed at surfaces can undergo conformational and
orientational changes. The structural perturbations are dependent on the nature of the surface. For ex-
ample, Norde and Giacomelli showed that BSA completely regains its native structure and stability after
being replaced from a hydrophilic surface but not in the case of a hydrophobic surface.17 On the other
hand, lysozyme seems to be able to regain its native configuration even after desorption from hydropho-
bic teflon surfaces.18 These results show that the mechanisms behind competitive proteins adsorption are
not fully understood yet.
Competitive protein adsorption can be measured by different techniques including surface plasmon
resonance,19 atomic force microscopy,20 quartz crystal microbalance,21 ellipsometry,20,22 reflectometric
interference spectroscopy, and total internal reflection fluorescence spectroscopy.22,23 Malmsten et al.
investigated the adsorption of single proteins and the competitive adsorption of ternary protein mixtures
on polymer surfaces.22 For hydrophobic surfaces the protein layer was dominated by human serum al-
bumin (HSA) and human IgG and no or little exchange was found. In contrast on charged hydrophilic
surfaces human fibrinogen (Fgn) was preferentially adsorbed. Huang et al. investigated the adsorption of
ternary solutions composed of the same plasma proteins on planar surfaces composed of poly-(carbonate-
urethane) and polystyrene (PS).24 They found that poly-(carbonate-urethane) has a preferential adsorp-
tion for HSA compared to PS. Riedel et al. looked into the anti-fouling properties of functionalized
poly(ethylene glycol)-based (PEG) surfaces against human blood plasma proteins using LC-MS/MS
analysis.25 It was found that only a few plasma proteins including HSA were ubiquitous on the PEG
surfaces. Furthermore, HSA was not adsorbed from single protein solutions but adsorption takes place
from blood plasma, which indicates that HSA adsorption is mediated by some other plasma proteins.
Mohr et al. analyzed the aggregation of polystyrene-based spherical nanoparticles and their interaction
3
with blood plasma by dynamic light-scattering techniques and LC-MS. Their experiments indicate that
the composition of the protein layer determines their aggregation behaviour and their organ distribution
in vivo.26
Up to now, much work has been devoted to the synthesis of nanomaterials and to their interaction
with single protein types. However, biological media are multicomponent mixtures i.e. they usually
contain more than one type of protein. For example, in human serum the most abundant proteins, albu-
min (70%), IgG (14%), transferrin (5.7%), fibrinogen (2.8%), and α-antitrypsin (0.7%), cover 93% of
the whole protein mass. In addition to these other proteins which function as enzymes and hormones
are present. In such a complex mixture competitive and/or cooperative adsorption necessarily need to
be considered. For spherical nanoparticles the competitive and/or cooperative adsorptions of different
protein types will lead to the formation of a protein corona. The composition of the protein corona
will determine the physical and chemical properties of the nanoparticle and in a biological medium will
determine its biological fate in terms of cellular response, biodistribution, clearance and toxicity.9,26–34
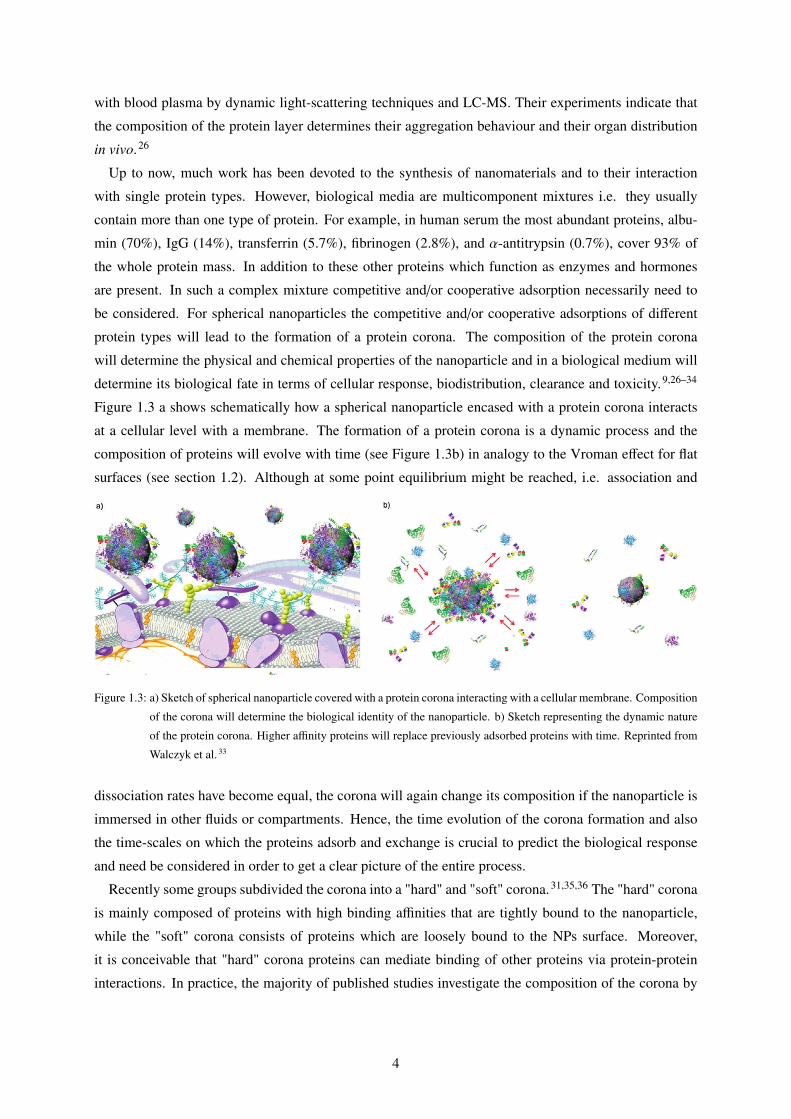
Figure 1.3 a shows schematically how a spherical nanoparticle encased with a protein corona interacts
at a cellular level with a membrane. The formation of a protein corona is a dynamic process and the
composition of proteins will evolve with time (see Figure 1.3b) in analogy to the Vroman effect for flat
surfaces (see section 1.2). Although at some point equilibrium might be reached, i.e. association and
Figure 1.3: a) Sketch of spherical nanoparticle covered with a protein corona interacting with a cellular membrane. Composition
of the corona will determine the biological identity of the nanoparticle. b) Sketch representing the dynamic nature
of the protein corona. Higher affinity proteins will replace previously adsorbed proteins with time. Reprinted from
Walczyk et al. 33
dissociation rates have become equal, the corona will again change its composition if the nanoparticle is
immersed in other fluids or compartments. Hence, the time evolution of the corona formation and also
the time-scales on which the proteins adsorb and exchange is crucial to predict the biological response
and need be considered in order to get a clear picture of the entire process.
Recently some groups subdivided the corona into a "hard" and "soft" corona.31,35,36 The "hard" corona
is mainly composed of proteins with high binding affinities that are tightly bound to the nanoparticle,
while the "soft" corona consists of proteins which are loosely bound to the NPs surface. Moreover,
it is conceivable that "hard" corona proteins can mediate binding of other proteins via protein-protein
interactions. In practice, the majority of published studies investigate the composition of the corona by
4

employing washing or centrifugation steps and analyzing the residual protein concentration (solution
depletion technique). With this technique only tightly and rather irreversibly bound proteins can be
detected. Up to now, there are only few a analytical methods like dynamic light scattering (DLS) or
fluorescence correlation spectroscopy (FCS) which can measure the dynamic nature of the protein corona
especially in a complex biological medium.26,37,38 Therefore, the detection and discrimination of "hard"
and "soft" corona proteins is a difficult task.
Nanoparticles can induce conformational changes to the adsorbed protein molecules which may affect
its function. Deng et al. recently showed that negatively charged poly(acrylic acid)-conjugated gold
nanoparticles bind to fibrinogen.39 By unfolding the protein an entire signal cascade is triggered, which
ultimately releases cytokines and promotes the inflammatory reaction. Hoshino et al. synthesized poly-
mer nanoparticles that bind venomous molecules and neutralize their function.40 However, the specificity
and intended performance of these particles in vivo was suppressed by formation of an unspecific protein
layer composed of plasma proteins. Salvati et al. showed that the targeting ability of a transferrin func-
tionalized nanoparticle is lost as soon as the particle is immersed in a complex biological environment
due to the interaction with the host proteins.41 As a consequence, many ways have been investigated to
prevent the formation of a protein corona in order to maintain the nanoparticles "bare" identity. One clas-
sical approach is the use of a non charged poly(ethylene glycol) (PEG) polymer.42,43 However, it has been
reported that PEG-functionalized NPs can interact with certain plasma proteins.44 Another approach to
suppress corona formation is the incorporation of zwitterion functionalities onto the NPs surface.45,46
Moyano et al. demonstrated that sulfobetaine headgroups engineered with a short oligo(ethylene gly-
col) spacer on a Au NP do not adsorb proteins at moderate serum protein concentrations nor do they
form a corona at physiological serum conditions.47 The examples illustrate that engineering such poly-
mer coated NPs protein repellent requires an in depth understanding of the driving forces of competitive
and/or cooperative adsorptions. Driving forces, for instance, can be hydrophobic and electrostatic in
nature and strongly depend on external conditions like pH, ionic strength and temperature.
1.3 Non-Competitive Protein Adsorption: The Langmuir Model
The analysis of protein adsorption usually begins by measuring the adsorption isotherm. To construct
such an isotherm, the amount of protein adsorbed on a surface or onto a NP is plotted as a function
of the equilibrium concentration. To obtain the amount of adsorbed protein different techniques like
ellipsometry, surface plasmon resonance, fluorescence spectroscopy and isothermal titration calorimetry
are available. The solution depletion technique was already described in previous section 1.2 and is one
of the simplest methods to study protein adsorption. Ideally, the shape of the adsorption isotherm can then
provide information on the thermodynamics of the protein adsorption process by fitting an appropriate
adsorption model to the isotherm plot, from which thermodynamic parameters can be derived. There are
several models including Langmuir, Freundlich, and Brunauer-Emmett-Teller (BET), each of which is
based on a different physical principles and prerequisites to fit the isotherm. Among these models the
Langmuir adsorption isotherm provides the simplest and most direct methods to quantify an adsorption
5

process. The Langmuir model states, that for a a binary reaction A + B → AB with the equilibrium
binding constant K = [AB][A][B] all adsorption sites are equivalent in terms of their adsorption free energies,
which can be calculated from its relationship to K. The Langmuir equation then relates the fraction of
occupied adsorption sites Θ to the binding constant K given by48
(1.1) K =Θ
(1 − Θ)cp
with cp corresponding to the equilibrium concentration of protein in solution. For a microgel containing
N adsorption sites, Θ is defined as Ni/N, with Ni defined as the number of proteins bound per microgel.
The Langmuir model assumes no interactions among the adsorbed molecules and most important equi-
librium conditions between the amount of protein adsorbed on the surface or nanoparticle and the protein
that is free in solution. Figure 1.4 a shows the typical shape of a Langmuir shaped isotherm. Even if
Figure 1.4: a) Scheme of a typical protein adsorption isotherm. b) Protein adsorption to fixed binding sites. See further expla-
nation in the text.
protein adsorption isotherms often give the appearance of having the shape of a Langmuir isotherm, ap-
plying a Langmuir fit might often not be the best choice.49 The parameters obtained from a Langmuir fit
are only reliable under equilibrium conditions. However, most experimentally measured protein adsorp-
tion isotherms may not represent equilibrium conditions. As a consequence, the equilibrium constant,
K, should rather be interpreted as an "effective" parameter that characterizes the shape of the isotherm
and is not necessarily related to the free energy of protein adsorption.49 Another drawback is the as-
sumption of single, independent binding sites as depicted in Figure 1.4 b. The proteins are confined
within their lattice position which is rather not fulfilled in most cases of protein adsorption. Actually, in
multi-component mixtures the number of adsorbants (proteins) will vary in size and composition and the
binding sites are difficult to define clearly. Moreover, mutual interactions between proteins can induce
cooperative adsorption that cannot be treated in terms of single independent binding sites. Thus, with
6

the Langmuir model is not easy to include cooperative adsorption effects. These effects become very
important in protein mixtures where competetive adsorption occurs. Therefore, there are present in all
biological fluids.
1.4 Competitive Protein Adsorptions: Models
To overcome the limitations of the Langmuir model regarding the inclusion of cooperative effects and
the expansion to competitive adsorption from protein mixtures various models have been developed.
The currently existing models can be divided into three different approaches. Le Duc et al. developed
a kinetic approach to describe the surface deposition of plasma proteins on a glass slide.50 Very re-
cently, Dell’Orco et al. devised a theory following a kinetic model to describe the corona formation on
N-iso-propylacrylamide/N-tert-butylacrylamide nanoparticles.51,52 Each of these models requires differ-
ent adsorption and desorption rate constants which need to be determined experimentally. Furthermore,
the authors need to make approximations, which not reflect the correct situation, e.g. proteins cannot
diffuse on the surface. Brooks and Cramer devised a theory on competitive binding in ion-exchange sys-
tems based on mass action equilibria where the electroneutrality on the stationary phase is maintained.53
Vogler et al. followed this approach with mass action equilibria to reproduce the Vroman effect. They
stated that protein adsorption is mainly based on protein size discrimination and is only partially related
to protein biochemistry or protein adsorption kinetics.54,55 There are also models treating competitive ad-
sorption more explicitly.56–58 Fang and Szleifer used a molecular mean field theory explicitly including
the size, shape and charge distributions in all molecular species adsorbed on charged planar surfaces.57
Su et al. studied the adsorption of binary mixtures of bovine hemoglobin and serum albumin onto an
anion exchanger.56 Adsorption isotherms were fitted using a statistical thermodynamics approach based
on model parameters. These parameters represent the interaction of the proteins and the surface and
between two proteins. The proteins in this model are regarded as hard spheres which undergo short
range interactions including lateral protein-protein interactions. Additional adjustable parameter had to
be introduced to describe the interaction of a binary mixture of proteins with the anion exchanger. More
recently, Vilaseca et al. modelled the competitive adsorption of HSA, Fgn and kininogen on a hydropho-
bic surface through coarse-grained molecular dynamics simulations.58 Their results could reproduce the
general trend of the Vroman effect.
To summarize, despite various experiments there is no general model describing the competitive ad-
sorption of proteins onto nanoparticles and nanosurfaces and the results are not always independent of
the underlying experiment.
7

2 Objective of this Thesis
The work of this thesis focuses on the analysis and interpretation of protein adsorption isotherms as
obtained by ITC measurements. In the field of protein nanoparticle interactions ITC has emerged as
a very common method to obtain the adsorption isotherm. In this thesis the adsorption isotherms of
different globular proteins adsorbed onto well-defined core-shell microgels are measured with ITC. On
this basis, ITC as a method to determined protein nanoparticle interactions, is discussed critically and
pitfalls are described.
At the same time, the evaluation of the ITC data is discussed. Here, the analysis of the adsorption
isotherm by the Langmuir model provides one of the simplest and most direct methods to quantify an
adsorption process. However, as discussed in the introduction part 1.3 the thermodynamic information
from the Langmuir isotherm is not quantitative. In a set of experiments the adsorption isotherms are fitted
with the Langmuir Model and a cooperative binding model (CB-model) as developed by Yigit et al.59 A
detailed description of the cooperative binding model will follow in the next chapter. The results from
both analysis are compared to each other with the aim to elucidate the limits of the Langmuir model.
Another main goal of this work was to test the predictive power of the cooperative binding model for
the competitive adsorption from binary mixtures. As discussed in the introduction competitive protein
adsorption and desorption processes play a pivotal role in the formation of the protein corona. In this case
the Langmuir model assuming identical as well as independent binding sites is not applicable anymore.
In another part of this thesis the question of the spatial distribution of the protein in a core-shell mi-
crogel is addressed. For this purpose anomalous small angle X-Ray scattering on cytochrome c adsorbed
on the microgels shell are performed. By analyzing the resonant scattering contribution the distribution
of these within the shell can be derived. In addition, the amount of adsorbed protein can be quantified by
this method.
In the last part the interactions of core-shell microgels immobilized on a surface are investigated. In-
teractions of stimuli-responsive microgels and surfaces are becoming more important for the applications
of such particles as sensors or actuators. In this context it is also necessary to understand how the adsorp-
tion of protein affects the structure of the microgels on a surface. For this purpose AFM measurements
of the protein loaded core-shell microgels in air and liquid were performed.
8

3 Fundamentals and Theory
3.1 Stimuli-Sensitive Microgels - Model Systems for Protein Material
Interactions
3.1.1 Introduction
In nanotechnology micron-sized and nano-sized hydrogels represent a versatile class of "smart" respon-
sive materials. Hydrogels consist of an intramolecular cross-linked polymeric network which can absorb
large amounts of solvent. Hydrogels have dimensions ranging from 10 to 1000 nm with gels in the lower
range being termed nanogels and gels in the upper range being termed microgels. However, there is no
clear definition and sometimes hydrogels having sizes in the micron regime are also referred as micro-
gels. In this thesis the term microgel will be used for hydrogels with dimensions up to 600 nm. Due
to their size and high surface area microgels are able to interact with cellular and subcellular domains.
In addition, microgels show very distinct properties compared to their macroscopic counterparts. It is
commonly accepted that microgels will react faster to chemically and/or physically changes caused by
external stimuli. The characteristic time of swelling is proportional to the square of the linear dimension
of the gel.60
Microgels are used for the regulated transport of (bio)molecules, switchable catalysts and for sensing
applications.61,62 Microgels also show interesting mechanical properties because their stiffness can be
matched to natural tissues.63 Adjustment of the cross-linker concentration is the most straightforward
method to modulate the microgel stiffness. In general, increasing the amount of cross-linker will lead
to a decreasing network flexibility and less pronounced swelling.64 External stimuli like pH,65 light,66
temperature and ionic strength67,68 can affect relative chain–chain and chain–solvent interactions, result-
ing in a reorganization of the polymer and solvent which finally induce a swelling or deswelling of the
microgel.
Figure 3.1 depicts a core-shell microgel which responds to different stimuli by undergoing a volume
phase transition in a shrunken more compact structure. Among the class of stimuli-responsive micro-
gels thermoresponsive ones have been studied the most. The most prominent class of thermosensitive
microgels is composed of N-isopropyl-acrylamide (NIPAM). At ≈ 31 °C poly-NIPAM undergoes an
endothermic, entropically driven phase transition to a collapsed and deswollen state.69,70 The transition
occurs at a discrete temperature called lower critical solution temperature (LCST) or volume phase-
transition temperature (VPTT). Below the VPTT poly-NIPAM interacts with water molecules primary
through hydrogen bonding. By increasing the temperature over the VPTT chain-chain interactions are
9

Figure 3.1: Scheme of stimuli responsive core-shell microgel with a solid core structure. The outer shell can rearrange to a
more compact deswollen network under the influence of temperature and light or by adjusting solution conditions
like ionic strength and pH. Furthermore, core-shell microgels can be designed to be stimuli-sensitive in the presence
(bio)molecules.
favoured and water becomes a poor solvent for the microgel. Consequently, water is repelled from the
inside of the microgel and the system rearranges to a more compact structure.71
3.1.2 Poly-NIPAM based Core-Shell Microgels
Core-Shell microgels are either composed of a hydrogel shell and a non-hydrogel core (mostly inert
polystyrene or silica cores), or entirely of hydrogel compounds in both the core and shell.72
Figure 3.2: Cryo-TEM image of a 0.2 wt% aqueous sus-
pension a negatively charged poly(NIPAM)
core-shell microgel.
These colloidal particles can be analyzed by several
techniques, including dynamic light scattering (DLS),
cryogenic transmission electron microscopy (Cryo-
TEM),73,74 small angle x-ray scattering (SAXS),64,75,76
small angle neutron scattering (SANS),64,77 1H-NMR as
well as rheology.78
Moreover, core–shell microgels present a class of
model colloids with high potential for versatile applica-
tions. For instance, Lu et al. used core–shell microgels
as "nanoreactors" by embedding metallic and catalyti-
cally active nanoparticles (such as Au, Rh and Pt) into
the shell structure.79 It was shown that the catalytic ac-
tivity can be tuned by the volume transition of microgel
particles. Similar results have been also found for enzy-
matic activities as shown by Welsch et al.68 Figure 3.2
shows a cryo-TEM image. The core-shell structure is
clearly visible. In this thesis responsive core-shell microgels have been synthesized and used as model
systems to investigate the driving forces contributing to protein absorption. The microgel is composed
10
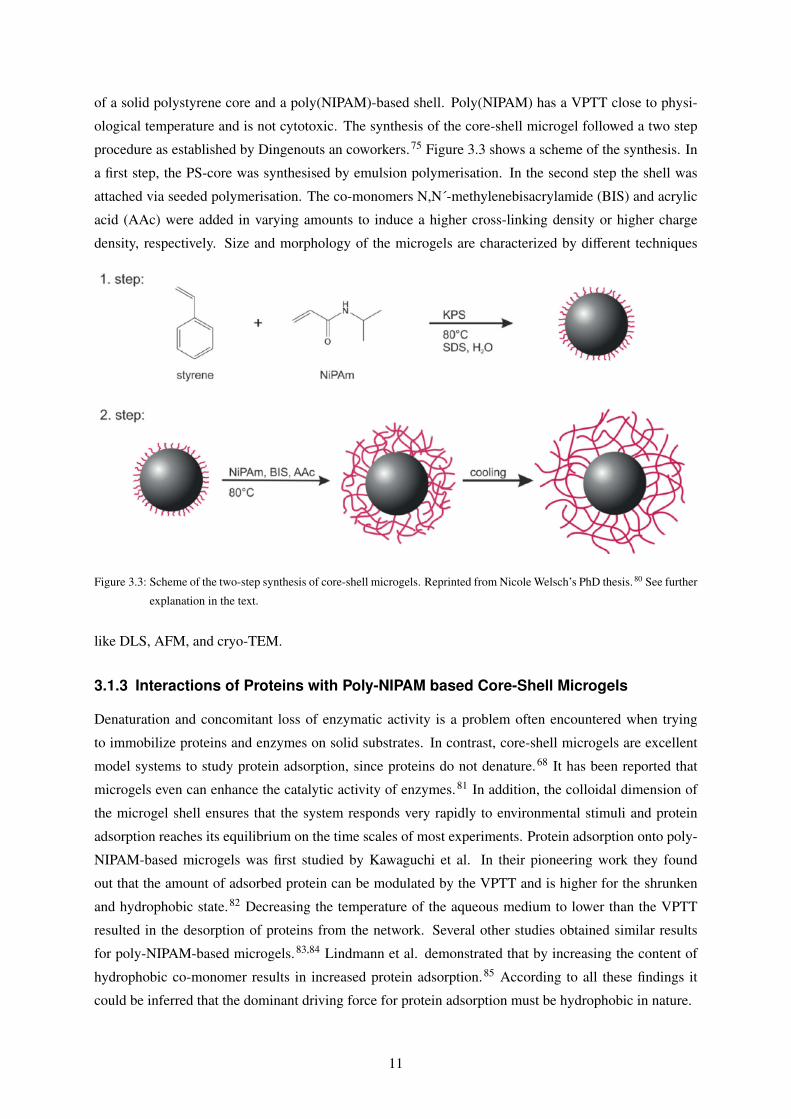
of a solid polystyrene core and a poly(NIPAM)-based shell. Poly(NIPAM) has a VPTT close to physi-
ological temperature and is not cytotoxic. The synthesis of the core-shell microgel followed a two step
procedure as established by Dingenouts an coworkers.75 Figure 3.3 shows a scheme of the synthesis. In
a first step, the PS-core was synthesised by emulsion polymerisation. In the second step the shell was
attached via seeded polymerisation. The co-monomers N,N´-methylenebisacrylamide (BIS) and acrylic
acid (AAc) were added in varying amounts to induce a higher cross-linking density or higher charge
density, respectively. Size and morphology of the microgels are characterized by different techniques
Figure 3.3: Scheme of the two-step synthesis of core-shell microgels. Reprinted from Nicole Welsch’s PhD thesis. 80 See further
explanation in the text.
like DLS, AFM, and cryo-TEM.
3.1.3 Interactions of Proteins with Poly-NIPAM based Core-Shell Microgels
Denaturation and concomitant loss of enzymatic activity is a problem often encountered when trying
to immobilize proteins and enzymes on solid substrates. In contrast, core-shell microgels are excellent
model systems to study protein adsorption, since proteins do not denature.68 It has been reported that
microgels even can enhance the catalytic activity of enzymes.81 In addition, the colloidal dimension of
the microgel shell ensures that the system responds very rapidly to environmental stimuli and protein
adsorption reaches its equilibrium on the time scales of most experiments. Protein adsorption onto poly-
NIPAM-based microgels was first studied by Kawaguchi et al. In their pioneering work they found
out that the amount of adsorbed protein can be modulated by the VPTT and is higher for the shrunken
and hydrophobic state.82 Decreasing the temperature of the aqueous medium to lower than the VPTT
resulted in the desorption of proteins from the network. Several other studies obtained similar results
for poly-NIPAM-based microgels.83,84 Lindmann et al. demonstrated that by increasing the content of
hydrophobic co-monomer results in increased protein adsorption.85 According to all these findings it
could be inferred that the dominant driving force for protein adsorption must be hydrophobic in nature.
11

However, the situation changes if the network contains charged units, which will shift the VPTT to
higher temperatures and will lead to electrostatic interactions between the network and the protein. For
lysozyme it was shown that the binding isotherms to charged core-shell microgels substantially depend
on ionic strength.59,86 In particular, the uptake capacity decreases with increasing ionic strength due to
charge screening effects. Smith and Lyon revealed that protein loading correlates with microgel charge.
Under low ionic strength conditions the microgel with the highest amount of incorporated charges could
uptake most proteins.87 These findings again support the strong influence of electrostatic interactions on
protein adsorption to charged microgels.
The attraction of a positively charged protein towards a negatively charged microgel is determined
by the electrostatic potential difference described by a modified Donnan potential.48,59 This potential
originates from the phase boundary between the charged microgel and the bulk solution which leads to an
unequal distribution of ions and causes the electric potential across the boundary. Under the assumption
of electroneutrality the Donnan potential for monovalent ions can be expressed as follows:48,59
(3.1) ∆ϕ ≡ eβ∆ϕ = ln[y +
√y2 + 1
]with y = zgcg/2cs being defined as the charge ratio between gel and bulk charge densities. ∆ϕ is the
dimensionless Donnan potential scaled by eβ. The Donnan potential leads to an osmotic pressure dif-
ference πion(y) between gel and bulk ions. In the ideal gas limit the osmotic pressure is given by the
difference of internal and external ionic concentrations and can be expressed through:88
(3.2) βπion = cs exp−∆ϕ +cs exp∆ϕ −2cs = 2cs
[y +
√y2 + 1
]Figure 3.4 a shows a plot of the Donnan potential as a function distance (z) from the surface. The
potential is highest close to the phase boundary and rapidly decays towards the bulk solution and is only
attractive if microgel and protein have opposite net charge. A closer look at equation 3.1 reveals that ∆ϕ
Figure 3.4: a) Local electrostatic potential difference ϕ(z) of a negatively charged gel network with a gel thickness l of 100 nm
as function of the distance z from the solid surface. b) Schematic representation of the charge regulation of a protein
in proximity to a charged gel network. Reprinted from. 80
12
decreases with an increase in salt concentration. By this means, the electrostatic interaction strength with
the protein can be tuned. In case proteins adsorb to the microgel network the Donnan Potential defined
in equation 3.1 needs to account for the change in total net charge by correcting y with the number of
bound proteins Ni
(3.3) y =
cgzg +∑
i
ziNi/V
/2cs
with i being the i-th type of protein in a mixture. It has been reported that negatively charged network
can also adsorb proteins with negative net charge i.e. adsorption of a protein on the “wrong side” of
the isoelectric point.68,89,90 There are several driving forces which explain these like charge interactions.
Counterion release, for instance, can play a major role in highly charged polyelectrolytes like spheri-
cal polyelectrolyte brushes, in which counterion condensation is favoured.91,92 This is the case when
Coulomb interactions dominate over the thermal interactions or more specifically for Γ = lB/lcharge > 1
with Γ defined as dimensionless Coulomb coupling strength with the lB being the Bjerrum length and
lcharge being the average distance between neighbouring charged monomers.
Adsorption of "wrong side" proteins is also facilitated by effects like charge regulation. In most cases
the protein’s charge distribution is set as fixed or treated as a single point net charge. This is a reasonable
approach for proteins carrying a significant net charge, but when an approximately neutral protein, pH≈pI, is approaching a charged surface, its charge distribution can be perturbed due to the local electrostatic
potential on the interface.93,94 For charged microgels another effect comes into play. The uneven ion
distribution between the network and the bulk, as described by the Donnan potential, causes a local
pH difference between the microgel network and the bulk solution.95 As a consequence, proteins in
proximity of the microgel network will adjust their charge according to the local pH value. In case
of a negatively charged protein, the net charge can be even reversed upon adsorption if the local pH
value is lower than the isoelectric point. This effect was already described for spherical polyelectrolyte
brushes.92,96 On the other hand, positively charged proteins can even increase their positive net charge
upon binding leading to an even stronger adsorption to the microgel. Figure 3.4 b shows the mechanism
of charge regulation for proteins adsorbing on a negatively charged microgel network. Counterion release
and charge regulation strongly depend on ionic strength and might not be the most dominant driving
forces at high salt concentrations. In addition, Bysell et al. observed the highest protein uptake in
a charged microgel for the least charged peptide.97 From these experiments it can be concluded that
hydrophobic interactions can also be a driving force for protein adsorption.
Microgels are also useful materials to study the dynamics of protein adsorption. For the poly(NIPAM)-
based core-shell microgels used in this thesis the binding kinetics have already been elucidated. Using
fluorescence spectroscopy Welsch et al. were able to proof that the protein uptake in these microgels is
a true equilibrium process with equilibration times in the millisecond regime and is fully reversible.98
For the binding a two-step process was suggested, a fast diffusion limited step (time constant: ca. 0.6 s)
and a second slower step of several hundred of seconds. It was observed that nearly 90% of the proteins
are bound in the first step. Simulations were able to reproduce the kinetics of protein uptake in the
milliseconds regime in agreement with the first binding step.99 However, the second step could not be
13
observed in the simulations and is probably caused by some collective rearrangements of the proteins
within the network.
3.1.4 Swelling behaviour of Poly-NIPAM based Core-Shell Microgels
The volume of a microgel Vg strongly depends on swelling and deswelling effects. In general, swelling
of a polymer network is determined by the balance of osmotic and elastic pressure πelastic and πosm,
respectively.88,100
(3.4) π = πosm + πelastic = 0
The elastic pressure term can be represented by the shear modulus G using the theory of rubber elasticity.
For weakly charged polymeric networks the powerlaw πel ∝ V−m with m = 1/3 is found.100–104 The
osmotic term has two different contributions. The first one emerges from the mixing entropy of polymer
chains with solvent molecules that can be expressed by Flory-Rehner theory105,106 or by using following
powerlaw:101,107 πmix ∝ V−n. Below the VPTT water is a good solvent for NIPAM based gels and
n = 9/4, but for gels above the VPTT and highly charged ones corrections may arise. The latter term is
the osmotic ideal gas pressure πion resulting from the inhomogeneous ion distribution between bulk and
gel and is expressed via equation 3.2
The expression for the total pressure then is:59
(3.5) π = AV−n + BV−m + πion(y)
with A and B being volume independent constants. In the limit of high bulk salt concentration cs the ionic
contribution can be neglected and πion(y) = 0. The balance between osmotic and elastic pressure also
determines the mechanical properties of the microgel in terms of the modulus Kcomp defined as inverse
compressibility Kcomp = −V(∂βπ/∂V). By fitting equation 3.5 to various salt concentrations the values
for A, B and Kcomp are obtained. Generally, equation 3.5 is valid in the ideal gas limit, monovalent salts,
and does not consider important contributions from adsorbed proteins. In principle, addition of proteins
will lower the total net charge and inhomogenize the charge distribution in the network.59 However, there
is no general theory covering these effects.
3.1.5 Interactions of Microgels with Surfaces
Most published literature on stimuli-responsive microgels investigated the properties of microgels in bulk
solution. However, for applications of such particles as sensors or for actuators it is necessary to attach
the particles on a surface. For this reason, interactions of stimuli-responsive microgels and surfaces are
becoming more important. Lu and Drechsler, for example, investigated the selforganization processes
of monosized poly(NIPAM)-based microgels on a gold surface. It was found that the electrostatic in-
teractions between the mircogel particle and charged substrate surface dictate the pattern formation.108
In particular, particles deposited under water evaporation onto a surface with opposite surface charges
will form an ordered 2-D array, while particles deposited onto a surface with same charge will destroy
14

Figure 3.5: Field-emission scanning electron microscope images of positive microgel particles (a) and negative microgel par-
ticles (b) assembled on mica substrates. The dashed circles indicate the size of microgel particles in the wet state.
Reprinted from Lu et al. 108
the ordered structure due to strong electrostatic repulsion (see Figure 3.5) Adsorption to a surface also
influences the volume phase transition of poly(NIPAM)-based microgels. AFM experiments could proof
that adsorbed poly(NIPAM)-co-vinylacetic acid microgels are still thermo-sensitive with the same tran-
sition temperature, but the swelling capacity decreases by up to one order of magnitude compared to the
swelling ratio in bulk solution.109 In the collapsed state the microgel flattens considerably due to addi-
tional adhesive bonds to the surface. Thus, the adsorbed microgels capture the heterogeneity of chain
deformations that occur when surfaces with sub-micrometer roughness interact. Duner et al. studied the
mechanical properties of microgel particles attached to a silicon surface. They found a non-monotonic
behaviour of the elastic modulus measured by AFM, exhibiting a softening through the transition and
then a stiffening above the transition.110
In this context it is interesting to find out how protein loading affects the modulus of the microgel
particles, because the microgel changes from a highly-swollen network, to a condensed, protein-rich
material. Up until now, there are just a few published experiments which investigated the interactions
and mechanical properties of stimuli-responsive microgels being attached to a surface and loaded with
protein. Huo et al., for example, were able to show that microgel particles attached to a a glass substrate
underwent bridging aggregation when being loaded with BSA.89
3.2 Characterization of Single Protein Adsorptions to Core-Shell
Microgels
3.2.1 Isothermal Titration Calorimetry (ITC)
Isothermal titration calorimetry (ITC) is a fast, precise and widely used technique for measuring bind-
ing thermodynamics of a chemical or biochemical ligand binding in solution. ITC is applicable to any
reaction involving a heat change and due to its simplicity in operation it is used in different fields like
biochemistry, drug design or material sciences. The technique is also sensitive to conformational re-
15

arrangements in macromolecules like DNA or proteins and can detect changes in protonation in these
macromolecules. Moreover, it emerged as a reliable method determining the thermodynamics of protein
nanoparticle interactions.
Figure 3.6 a shows the general setup of an ITC instrument. The instrument consists of a sample cell
and a reference cell. The former one is usually filled with the nanoparticle suspension and the latter one
is filled with ultrapure water. Before each titration the two cells need to be equilibrated in such a way that
the temperature difference ∆T between the cells approaches zero and the applied reference power dP of
the feedback system shows a stable baseline. After this equilibration period a defined amount of protein
Figure 3.6: a) Schematic representation of an isothermal titration calorimeter. The instrument is made of a reference cell and a
sample cell which are surrounded by an adiabatic jacket. Both cells consist of an efficient thermally conducting and
chemically inert material. The sample cell is filled with the nanoparticle solution. Under constant stirring defined
amounts of the ligand (in this case the protein solution) are injected with an automated syringe. Injection of the
ligand will cause some heat difference between the sample cell and the reference cell. Depending on the nature of
the reaction (i.e., exothermic or endothermic) in the sample cell the feedback power will either increase or decrease
to maintain an equal temperature between the two cells. The output signal has the form of an incremental heat
change per injection dQ/dx = Q′(x). b) Scheme of a nanoparticle adsorbing proteins. Fitting of the ITC data with
the Langmuir model reveals the thermodynamic parameters ∆H, ∆S , K and N.
solution is titrated into the sample cell and sensitive thermocouple circuits are used to detect temperature
differences ∆T between the cells. Depending on the type of reaction i.e exothermic or endothermic the
feedback system will either decrease or increase the applied power dP in order to maintain the baseline.
The output signal has the form of a differential heat change per injection dQ/dx = Q′(x). The quantity
x is defined as molar ratio x = ctotp Fitting of Q′(x) with an appropriate binding model e.g. Langmuir
model reveals the thermodynamic parameters ∆H, ∆S , K and N for the binding of the protein onto the
NP (Figure 3.6 b).
Table 3.1 summarizes recent experiments using ITC to investigate protein adsorption onto nanoparti-
cles. Dawson et al., for example, investigated the adsorption of β2-microglobulin, a protein playing a
key role in amyloid diseases, onto N-isopropylacrylamide (NIPAM) and N-tert-butylacrylamide (BAM).
16
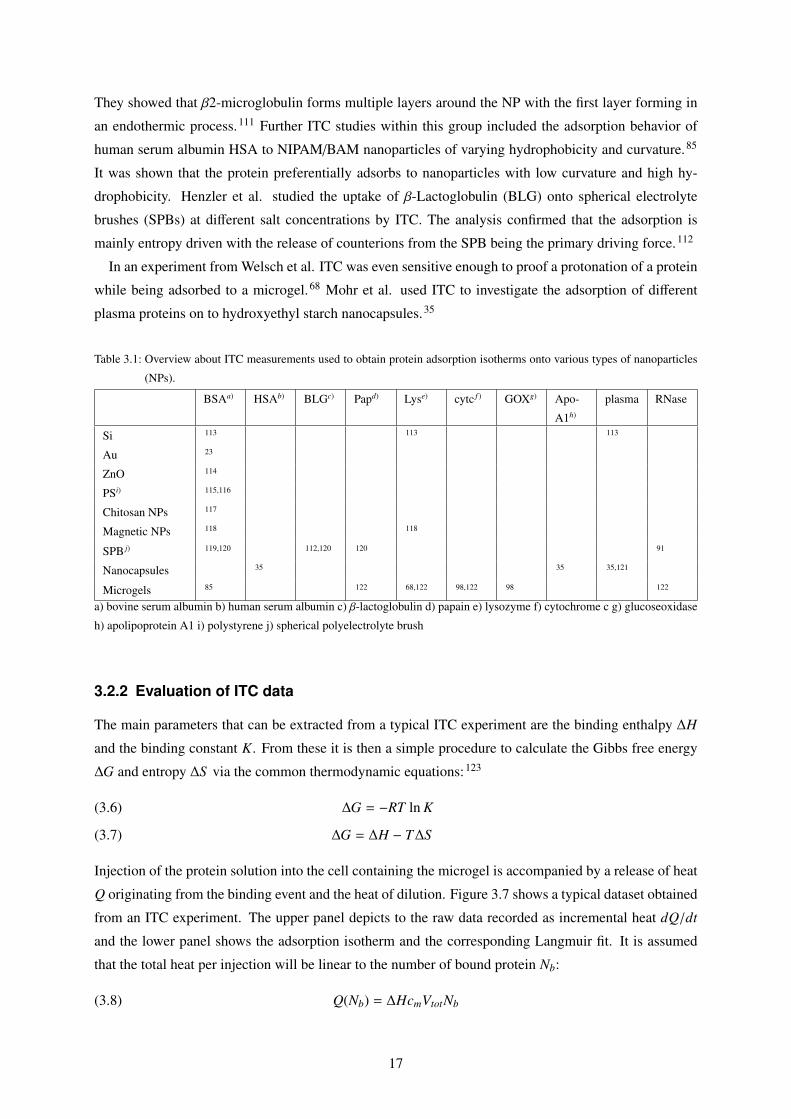
They showed that β2-microglobulin forms multiple layers around the NP with the first layer forming in
an endothermic process.111 Further ITC studies within this group included the adsorption behavior of
human serum albumin HSA to NIPAM/BAM nanoparticles of varying hydrophobicity and curvature.85
It was shown that the protein preferentially adsorbs to nanoparticles with low curvature and high hy-
drophobicity. Henzler et al. studied the uptake of β-Lactoglobulin (BLG) onto spherical electrolyte
brushes (SPBs) at different salt concentrations by ITC. The analysis confirmed that the adsorption is
mainly entropy driven with the release of counterions from the SPB being the primary driving force.112
In an experiment from Welsch et al. ITC was even sensitive enough to proof a protonation of a protein
while being adsorbed to a microgel.68 Mohr et al. used ITC to investigate the adsorption of different
plasma proteins on to hydroxyethyl starch nanocapsules.35
Table 3.1: Overview about ITC measurements used to obtain protein adsorption isotherms onto various types of nanoparticles
(NPs).
BSAa) HSAb) BLGc) Papd) Lyse) cytc f ) GOXg) Apo-
A1h)
plasma RNase
Si 113 113 113
Au 23
ZnO 114
PSi) 115,116
Chitosan NPs 117
Magnetic NPs 118 118
SPB j) 119,120 112,120 120 91
Nanocapsules 35 35 35,121
Microgels 85 122 68,122 98,122 98 122
a) bovine serum albumin b) human serum albumin c) β-lactoglobulin d) papain e) lysozyme f) cytochrome c g) glucoseoxidase
h) apolipoprotein A1 i) polystyrene j) spherical polyelectrolyte brush
3.2.2 Evaluation of ITC data
The main parameters that can be extracted from a typical ITC experiment are the binding enthalpy ∆H
and the binding constant K. From these it is then a simple procedure to calculate the Gibbs free energy
∆G and entropy ∆S via the common thermodynamic equations:123
∆G = −RT ln K(3.6)
∆G = ∆H − T∆S(3.7)
Injection of the protein solution into the cell containing the microgel is accompanied by a release of heat
Q originating from the binding event and the heat of dilution. Figure 3.7 shows a typical dataset obtained
from an ITC experiment. The upper panel depicts to the raw data recorded as incremental heat dQ/dt
and the lower panel shows the adsorption isotherm and the corresponding Langmuir fit. It is assumed
that the total heat per injection will be linear to the number of bound protein Nb:
(3.8) Q(Nb) = ∆HcmVtotNb
17

Figure 3.7: ITC titration of lysozyme binding to microgel NW15 in 10 mM MOPS buffer at pH = 7.2 and 298 K. The upper
panel shows the ITC raw data for each injection with the differential heat dQ/dt emerging as the red peaks. The
blue circles in the lower panel show the integrated peaks/signal, which correspond to the differential heat per mol of
injectant dQ/dx. The red line is the Langmuir fit. Values have been corrected for the heat of dilution by subtraction
from the overall heat.
After correcting the raw signal for the heat of dilution it is more convenient to extract ∆H, N and K by
fitting the incremental heat Q′(x) = ∂Q/∂x to a binding model:
(3.9) Q′(x)/(Vtotctotp ) = ∆HNb(x)/x
The manufacturer microcal offers an analysis tool which is based on the Langmuir framework called
model of single independent binding sites (SSNI model) and is compatible with the Originr7.0 software.
As already discussed in section 1.3 the Langmuir equation is often applied, if the assumption of N
independent and identical binding sites is valid to a considerable degree. The binding constant in the
Langmuir model is defined as (see section 1.3):
(3.10) K =Θ
(1 − Θ)cp
The concentration of the unbound protein outside the gel cp is not known, but can be expressed by the
total protein concentration ctotp and the binding fraction θ through
(3.11) cp = ctotp − NΘcp
18

With this definition cp in equation 3.10 can be substituted leading to a quadratic equation for Θ which
can be solved leading to
(3.12) Θ =12
1 + xN+
1NKcm
−
√(1 − x
N+
1NKcm
)2
− 4xN
If we assume ∆H, N and K being independent of the protein concentrations equation 3.8 and 3.12 can
be combined to give the total heat Q(x)
(3.13) Q(x) =12
Nb∆HcmVtot
[ξ −
√ξ2 − 4x/N
]with ξ = 1 + x
N +1
NKcm. Fitting of the differential heat Q′(x)/(Vtotctot
p ) with respect to the molar ratio
finally reveals the values for N, ∆H and K. Typically, a curve of Q′(x) resembles a sigmoidal form.
In general, for small x a plateau is observed and the intersection with the y axis determines ∆H. N is
defined as the inflection point where the molar ratio equals the number of binding sites and K is the
sharpness of the transition at the inflection point for x = N. In particular, for the first injections Q′(x) is
constant and proteins enter the network immediately and continuously. With N(x) ≃ x here the fitting is
not very sensitive to the binding constant. For high values of x the number of binding sites saturates and
Q′(x) = 0. Hence, the fitting procedure is most sensitive at the inflection point.
3.2.3 Problems of ITC
ITC is a sensitive method to obtain the adsorption isotherm of proteins adsorbing to a nanoparticle.
However, the shape and the quality of the ITC isotherms can be strongly influenced by different con-
ditions and in order to avoid pitfalls there are certain prerequisites which need to be considered. First
of all the protein needs to be available in high concentrations so that the heat of the adsorption process
is sufficient enough to produce a detectable signal higher than the background noise. Experience shows
that in most experiments protein concentrations in the mg range were used.35,81,91
It is also necessary to check, if the protein and the nanoparticle under investigation have stable struc-
tures under experimental conditions where pH, temperature or salt strength are varied. In particular, high
molecular weight proteins can exist as monomers, dimers or higher oligomers and their structure can
vary depending on the external conditions. As a consequence, a mixture of different protein structures
can be present and the underlying adsorption isotherm reflects the average adsorption of the different
protein structures. Furthermore, it need to checked, whether the proteins and the nanoparticles do not
form aggregates.
Another pitfall is the heat of dilution which needs to be measured carefully and subtracted from the
measurement of protein and nanoparticle. The heat of dilution is defined as the change in enthalpy when
an infinitesimal amount of solvent or solute is added to a solution at constant pressure. For an ideal
solution the heat of dilution is zero, but in a non ideal case the heat of dilution depends on activity
coefficient of the i-th solute, γi, and can be written as:124
(3.14) ∆Hdil =∑
i
νiRT ln γi
(1 +
Tϵ
∂ϵ
∂T
)
19

Here, νi is the stoichiometric coefficient and ϵ is the relative permittivity. In an ideal case the heat of
dilution is constant, i.e. the amount of heat generated or consumed after each injection of the solute is
the same. However, the activity coefficients for already dissolved ions can change since the ionic strength
increases with the addition of proteins. Moreover, water-mediated effects between the protein and salt
molecules come into play and reorganize solvent structures. Both effects can lead to a heat of dilution
which is not constant, but varies with the amount of injected protein. After subtraction of the heat of
dilution the adsorption isotherm in the saturation regime should approach zero as depicted in Figure 3.8
a (green curve), i.e. the ITC signal in this regime is equal to the heat of dilution. The experiment should
be repeated carefully , if this is not the case. Especially, the fitting will be difficult and care needs to be
taken in the interpretation of the thermodynamic parameters.
To obtain a good shaped adsorption isotherm by ITC the concentration of the protein and the nanopar-
ticle should be in a certain range. The optimal concentration of the microgel cm to be titrated depends
on the binding constant K and the number of binding sites N and is calculated from the dimensionless
parameter C also referred as C-value or Weitzmann parameter125,126 defined as
(3.15) C = K · cm · N
In Figure 3.8 b simulated isotherms for a 1:1 binding stoichiometry for different binding constants deter-
mining the C-value are depicted. Two conclusions can be drawn from this simulation: First, very large
C-values lead to very tight binding and the binding enthalpy ∆HITC is determined accurately, but for
C-values > 500 the isotherm shape is invariant with K. Secondly, when C < 10, the titration isotherm
Figure 3.8: The shape of ITC curves: Problems and Pitfalls: a) Normalized ITC titration curves for i) a sigmoidal curve with
pronounced plateau (green line), ii) sigmoidal curve with pronounced plateau, but with no saturation regime (blue
line) and iii) curve without plateau (red line) b) Simulated ITC titration curves for varying values of C and for N=1.
Graph reprinted from reference 126
becomes less confident in the fitting of K and especially in the fitting of ∆HITC . Thus, the most ideal
range for measuring a reliable adsorption isotherm is for 20 < C < 500.
However, in case of the adsorption of proteins to (polymer-coated) nanoparticles C-values in the right
20

range do not guarantee a sigmoidal isotherm and isotherms with rather exponential shapes (see Figure
3.8 a (green and red curve, respectively) have been measured.35,116,127 As a consequence, fitting of
∆HITC becomes difficult since there is no plateau in the isotherm and values of ∆HITC can become
unrealistically high. In general, for the plateau region of the isotherm the incremental heat per injection
Q′(x) is constant. In other words, the injected proteins are immediately adsorbed from the nanoparticle
with a contant heat Q = constant. Thus, the missing plateau can originate from strong cooperative effects
which change Q′(x).
In summary, ITC is a reliable method to study the interactions of proteins and nanoparticles if certain
prerequisites are fulfilled. These include: i) a sufficiently high protein concentration to obtain a good
ITC signal ii) a concentration of the nanoparticle lying in a reliable range of the C-value and iii) a careful
subtraction of the heat of dilution.
21
3.2.4 Small Angle Scattering (SAS)
Small-angle scattering experiments are either carried out with X-rays (SAXS) or neutrons (SANS) and
are a powerful and widely used method to gain insight in nanostructure and structural dynamics of biolog-
ical macromolecules, polymers and nanocomposite materials. SAS has become also the method of choice
to investigate the spatial distribution of proteins on functionalized and non-functionalized nanoparticles.
At the same time the total amount of bound protein to the NP can be determined and compared to results
from ITC or ultrafiltration.
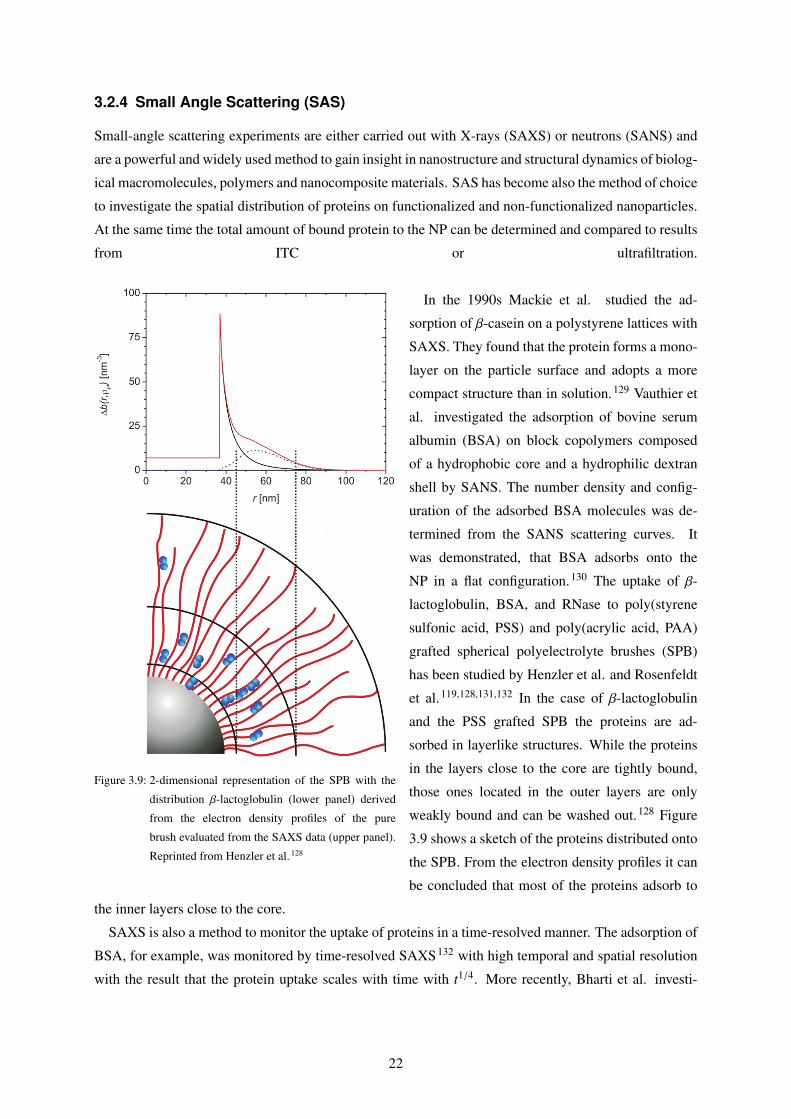
Figure 3.9: 2-dimensional representation of the SPB with the
distribution β-lactoglobulin (lower panel) derived
from the electron density profiles of the pure
brush evaluated from the SAXS data (upper panel).
Reprinted from Henzler et al. 128
In the 1990s Mackie et al. studied the ad-
sorption of β-casein on a polystyrene lattices with
SAXS. They found that the protein forms a mono-
layer on the particle surface and adopts a more
compact structure than in solution.129 Vauthier et
al. investigated the adsorption of bovine serum
albumin (BSA) on block copolymers composed
of a hydrophobic core and a hydrophilic dextran
shell by SANS. The number density and config-
uration of the adsorbed BSA molecules was de-
termined from the SANS scattering curves. It
was demonstrated, that BSA adsorbs onto the
NP in a flat configuration.130 The uptake of β-
lactoglobulin, BSA, and RNase to poly(styrene
sulfonic acid, PSS) and poly(acrylic acid, PAA)
grafted spherical polyelectrolyte brushes (SPB)
has been studied by Henzler et al. and Rosenfeldt
et al.119,128,131,132 In the case of β-lactoglobulin
and the PSS grafted SPB the proteins are ad-
sorbed in layerlike structures. While the proteins
in the layers close to the core are tightly bound,
those ones located in the outer layers are only
weakly bound and can be washed out.128 Figure
3.9 shows a sketch of the proteins distributed onto
the SPB. From the electron density profiles it can
be concluded that most of the proteins adsorb to
the inner layers close to the core.
SAXS is also a method to monitor the uptake of proteins in a time-resolved manner. The adsorption of
BSA, for example, was monitored by time-resolved SAXS132 with high temporal and spatial resolution
with the result that the protein uptake scales with time with t1/4. More recently, Bharti et al. investi-
22
gated β-lactoglobulin and lysozyme onto negatively charged silica particles as a function of pH.133 The
study provided strong evidence that lysozyme can promote bridging of the silica particles which cause
aggregation.
3.2.4.1 Theory of SAS
In the following section the basic concepts of SAS are illustrated briefly. The interpretation of scattering
data is based on the general relation between the measured scattering intensity as a function of momen-
tum transfer q = 4πsinΘ/λ with λ being the wavelength of the X-ray radiation and 2θ the scattering
angle.
(3.16) I(q) = N(∆ρ)2F(q)S (q)
Here, N are the number of particles in the scattering volume, ∆ρ = ρp − ρs is the contrast between the
particle (p) and the solvent (s), F(q) is the form factor, and S (q) is defined as the structure factor. For
small angle X-Ray scattering the contrast originates from the electron scattering length densities while
for small angle neutron scattering the contrast depends on the nuclei’s characteristics; i.e. the scattering
length density of the nuclei. Thus, both techniques can be treated within the same theoretical framework.
The scattering intensity can be expressed via the amplitude square averaged over the solid angles Ω
(3.17) I(q) = ⟨I(q)⟩Ω = ⟨A(q)A∗(q)⟩Ω
Here the scattering amplitude A(q) is defined as
(3.18) A(q) =∫ ∞
0ρ(r) · exp[−iqr]d3r
and averaging over all orientations in a two-phase system leads to
(3.19) A(q) = 4π∫ ∞
0∆ρ
sinqrqr
r2dr
An easy and straight forward way of analysis of the scattering which is often applied in small angle
scattering is the Guinier analysis. The general Guinier relation states that
(3.20) I(q) = I(0) · exp(−1
3R2
gq2)
where the radius of gyration and the forward scattering intensity are defined as Rg and I(0), respectively.
The latter one is related to the molecular mass of the macromolecule. The values Rg and I(0) are usually
obtained by plotting ln[I(q)] vs. q2, whereby the slope of the Guinier plot corresponds to −R2g/3 and the
intersection with the ordinate to I(0). The Guinier analysis is only valid for small angles, i.e. qRG ≪1 and requires monodisperse particles. If the particles in the sample have different sizes the sizes of
the smaller particles will be difficult to determine since the scattering will be dominated by the larger
particles.
23
A method to analyze the adsorption of proteins onto core-shell nanoparticles like brushes and micro-
gels was devised from Breininger and Rosenfeldt et al.131 In their analysis the scattering intensity for
core-shell systems can be split into three terms131
(3.21) I(q) = ICS (q) + I f luc(q) + IPS
The first term ICS (q) originates from the overall structure of the core-shell microgel. Usually the
polystyrene core has a small SAXS contrast while the shell has a higher contrast. The term I f luc(q)
accounts for the fluctuations of the polyelectrolyte layer on the surface and can be expressed via131
(3.22) I f luc(q) =I f luc(0)
1 + ξ2q2
where ξ denotes the spatial extent of the fluctuations. The fluctuation term contributes mainly at high
scattering vectors and is rather negligible if the low q-part is chosen for the analysis.128,131 I f luc(0)
determines the contribution at the vanishing scattering vector. The term IPS accounts for differences of
the electron density in the solid polystyrene core. Its contribution to the overall scattering intensity is
negligibly small.
At this point it is necessary to discuss how the adsorption of protein will change the overall scattering
intensity as defined in equation 3.21. At high q there is no visible fine structure of the shell and adsorbed
proteins will simply increase the electron density. However, at low and intermediate q a different theoreti-
cal approach is necessary.
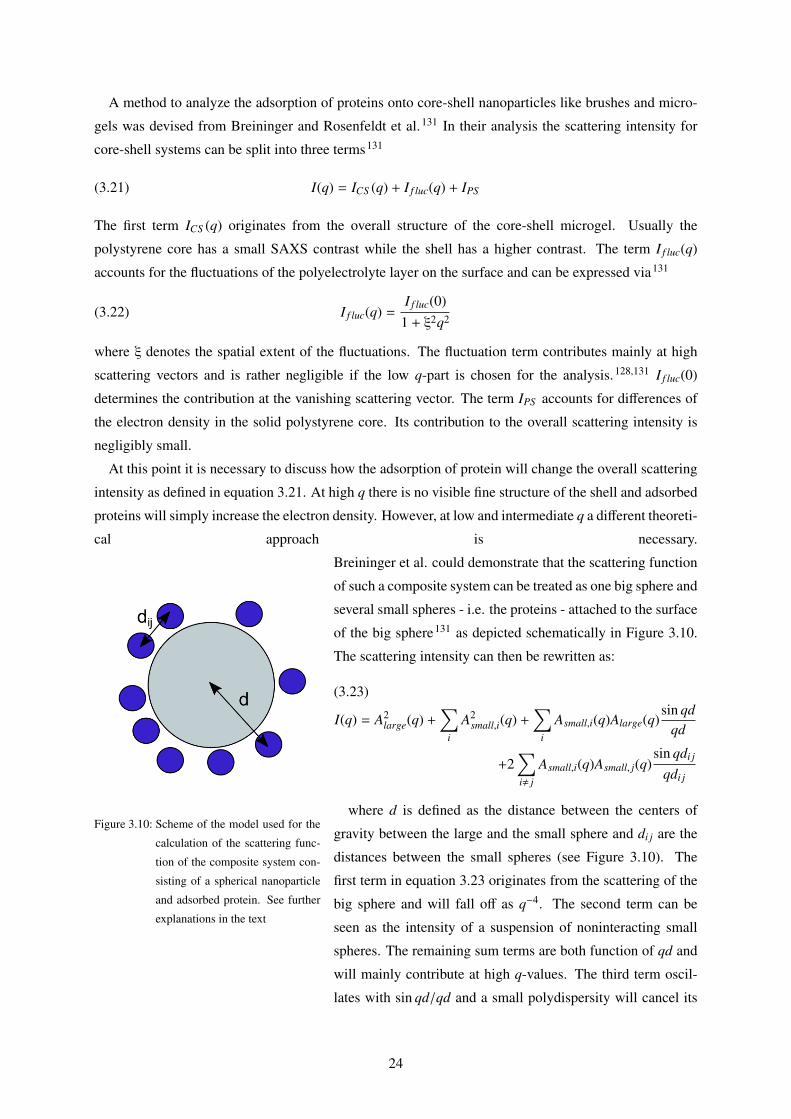
Figure 3.10: Scheme of the model used for the
calculation of the scattering func-
tion of the composite system con-
sisting of a spherical nanoparticle
and adsorbed protein. See further
explanations in the text
Breininger et al. could demonstrate that the scattering function
of such a composite system can be treated as one big sphere and
several small spheres - i.e. the proteins - attached to the surface
of the big sphere131 as depicted schematically in Figure 3.10.
The scattering intensity can then be rewritten as:
I(q) = A2large(q) +
∑i
A2small,i(q) +
∑i
Asmall,i(q)Alarge(q)sin qd
qd
+2∑i, j
Asmall,i(q)Asmall, j(q)sin qdi j
qdi j
(3.23)
where d is defined as the distance between the centers of
gravity between the large and the small sphere and di j are the
distances between the small spheres (see Figure 3.10). The
first term in equation 3.23 originates from the scattering of the
big sphere and will fall off as q−4. The second term can be
seen as the intensity of a suspension of noninteracting small
spheres. The remaining sum terms are both function of qd and
will mainly contribute at high q-values. The third term oscil-
lates with sin qd/qd and a small polydispersity will cancel its
24

contribution for sufficiently high q. The second sum in equation 3.23 will vanish as well if the small
spheres (proteins) are assumed to be distributed randomly around the big sphere with the distance di j.
Consequently, for intermediate and low q-values the intensities of the big spheres (core-shell) and small
spheres (proteins) simply add up.
3.2.4.2 ASAXS
Anomalous small-angle X-ray scattering (ASAXS) serves as an additional method of contrast variation.
The method utilizes the dependence of the atomic scattering factor f if the energy of the incident radiation
is near the absorption edge of an atom or ion.
(3.24) fz(E) = f0,Z + f ′Z(E) + i f ′′Z (E)
The first term f0 corresponds to the nonresonant term. The second and third terms in are the real and
imaginary part of the so-called anomalous dispersion corrections of the atomic scattering factors which
show dramatic changes in the vicinity of the absorption edges. The scattering amplitude for an ASAXS
experiment writes
(3.25) A(q) =∫
Vp
∆ρ(r) · exp[−iqr]d3r +∫
Vp
∆ρion(r) · exp[−iqr]d3r
Here ∆ρ and ∆ρion are the excess electron densities of the macromolecule and the ions and Vp is the
particle volume. Calculating the scattering intensity I(q) = |A(q)| = A(q) · A∗(q) and averaging over
all orientations of the macromolecule yields a to sum a of three contributions with the three partial
intensities:134
|A(q)|2 = ∆ f 20
∫Vp
∫u(r)u(r′)
sin(q|r − r′)|)q|r − r′|
|Amix(q, E)|2 = 2∆ f0 · ( f0,ion − ρmVion + f ′(E))∫
Vp
∫u(r)v(r′)
sin(q|r − r′)|)q|r − r′|
|Aion(q, E)|2 = |∆ fion(E)|2∫
Vp
∫v(r)v(r′)
sin(q|r − r′)|)q|r − r′|
(3.26)
Here |A(q)|2 is the non-resonant scattering originating from the macromolecule, the crossterm |Amix(q, E)|2
or mixed-resonant scattering originating from the superposition of the scattering amplitudes of the macro-
molecule and ions, and |Aion(q, E)|2 the pure-resonant scattering term which just includes contributions
from the ions. The quantities u(r) and v(r) are the particle densities of the macromolecule and the ions,
respectively, and ρm is the electron density of the solvent; Vion is the volume of the ion; ∆ f0 and ∆ f0,ion
are the contrast of the polymer and ion with respect to the solvent. By measuring the scattering curves
at at least three energies (E1, E2 and E3) in the vicinity of the absorption edge of the present ion it is
25
possible to extract the pure-resonant scattering term |Aion(q, E)|2.134
|Aion(q)|2 =∫
Vp
∫v(r)v(r′)
sin(q|r − r′)|)q|r − r′
=(3.27) I(q, E1) − I(q, E2)f ′ion(E1) − f ′ion(E2)
− I(q, E1) − I(q, E3)f ′Fe(E1) − f ′Fe(E3)
· 1F(E1, E2, E3)
with
F(E1, E2, E3) = f′ion(E2) − f
′ion(E3) +
f′′2ion(E1) − f
′′2ion(E2)
f ′ion(E1) − f ′ion(E2)−
f′′2ion(E1) − f
′′2ion(E3)
f ′ion(E1) − f ′ion(E3)
Equation 3.27 is an analytical solution to extract the pure-resonant scattering contribution from an
ASAXS experiment measured at three energies. Structural information of the ions like their distribu-
tion can be obtained from the analysis of the form factor. Hence, the separation of the resonant scatterer
makes ASAXS an effective tool for the analysis of polyelectrolytes. In particular, ASAXS has been ap-
plied in numerous publications to study the distribution of counterions around a polyelectrolyte.134–136
Additionally, it was shown that ASAXS can quantify the amount of resonant scatterers i.e the ions in the
scattering volume by utilizing the following integral
(3.28) Qion = |∆ fion(E)|2∫
Q|Aion(q)|2d3q
Here Qion is the resonant invariant and is related to the number density of the ions νion defined as:137
(3.29) νion =1
2Vion±
√1
4Vion2− 1
(2π)3r20
∫Q|Aion(q)|2d3q
where Vion =4π3 R3
ion is the volume of the ion and r0 is the classical electron radius.
3.3 Characterization of Competitive Protein Adsorptions to Microgels
3.3.1 Fluorescence Spectroscopy
Fluorescence based methods are commonly applied to determine protein nanoparticle interactions. Bou-
los et al. used static fluorescence quenching to study the adsorption of BSA on differently functionalized
gold nanoparticles.138 They found similar binding constants for all NPs independent of the surface func-
tionalization, which indicates the stickiness of the protein. Following this approach, Bunz et al. used the
quenching effect to study the exchange of green fluorescent protein by serum proteins in gold nanopar-
ticle based sensor platforms.139 Röcker et al. have quantitatively analysed the adsorption of HSA onto
polymer-coated FePt and CdSe/ZnS nanoparticles by using fluorescence correlation spectroscopy.37 It
was shown, that HSA binds by forming a monolayer of a few nm thickness. Moreover, time-resolved
fluorescence quenching experiments revealed, that HSA binds the NP for ≈ 100s. With the same method
Maffre et al. investigated the adsorption of three plasma proteins onto polymer-coated FePt nanoparti-
cles. For all three proteins, a step-wise increase in hydrodynamic radius with protein concentration was
observed in accordance with their molecular shapes.38
26

In this thesis the quenching of a pH sensitive protein label - fluorescein - is used to determine the
amount of adsorbed proteins onto the negatively charged microgel. The method was developed by
Welsch et al.98 and was already used to determine the adsorption isotherms of lysozyme adsorbing on
negatively charged core-shell microgels. The compound shows high fluorescence at neutral and alkaline
conditions whereas the fluorescence intensity drops in more acidic solutions due to different protonation
states. Because of its high quantum yield and sensitivity fluorescein is frequently used to measure the pH
of intracellular compartments.140 The addition of fluorescein-labelled protein to the microgel strongly
decreases the fluorescence signal. The decrease is probably a combination of two major effects. The first
one is a quenching effect, which is due to a local pH difference between the microgel network and the
bulk solution. In particular, the concentration of protons located in the microgel is expected to be higher
and the environment becomes more acidic. This leads to a fast protonation of fluorescein as soon as the
labelled protein approaches the surface layer of the particle. The second effect can be traced back to
self-quenching of fluorescein due to a resonance energy transfer (homo RET). This effect will be more
pronounced at higher protein load, because the Förster distance for homo RET between the fluorescein
molecules is in the order of the protein diameter (42-56 Å).141,142 In general, labeling a protein can
change its conformation, which may lead to reduced function and activity. It was previously determined
that a 1:1 labeling ratio between fluorescein and lysozyme is sufficient and keeps its activity around
70%.98
In summary, a combination of two quenching effects will decrease the fluorescence signal for adsorb-
ing proteins, while desorbing proteins, which compete for binding sites on the microgel, will increase
the signal. By this means the amount of adsorbed protein can be monitored over time. Figure 3.11 b
shows a general scheme of the fluorescence experiment in the case of a binary protein mixture. In a time-
dependent fluorescence experiment it was already shown, that a 1:1 mixture of labelled and unlabelled
lysozyme and vice versa will lead to the same intensity.98 It can therefore be concluded, that protein
binding to the charged microgel is a reversible process and all components are in equilibrium.
3.4 The Cooperative Binding Model (CB-model)
Yigit et al. developed a coarse-grained model, hereafter referred as cooperative binding model (CB-
model), to describe the protein adsorption to charged, polymer-coated nanoparticles.59 It was already
demonstrated that under equilibrium conditions the model is able to rationalize the adsorption thermody-
namics of lysozyme onto PNIPAM coated NPs and separate interactions into non-specific, global elec-
trostatic and protein specific.59 The proteins and the NPs are treated as charged spheres. In this case the
global electrostatic interactions can be tackled with a Poisson-Boltzmann approach. Protein interactions
are described as pair interactions on the level of the second virial coefficient. The non-specific inter-
actions are represented as a free energy ∆G0 which is extracted from the adsorption isotherm obtained
by isothermal titration calorimetry. It was shown that ∆G0 is virtually salt-independent and includes
contributions from hydrophobic forces.59 In case of multi-component adsorption the model by Yigit et
al. uses ∆G0 as the only fit parameter. In addition, this model can also describe the adsorption kinetics
27

Figure 3.11: General scheme of the fluorescence-based competitive adsorption experiment in the case of a binary protein mix-
ture. a) The Core-shell microgel is depicted with the radius of the polystyrene core Rcore and with the hydrodynamic
radius Rh of the entire colloid. The size of the colloid specifically depends on external conditions like salt concen-
tration and the protein load. The system maintains its overall charge neutrality by a Donnan equilibrium. Basically,
for all fluorescence experiments the microgel NW15 was used with Rh ≃ 70nm and Rh ≃ 180nm as determined
by DLS in 10 mM MOPS, 2 mM NaN3 solution at pH = 7.2 and at 298K. b) The fluorescence of the labeled
proteinFITC (blue spheres) shows a significant decrease in intensity as it enters the microgel network. Sequential
adsorption of a second competing protein (red rectangles) will increase the fluorescence signal proportional to the
number of released proteinFITC in solution.
of globular proteins onto poly(NIPAM) coated NPs on the basis of Dynamic Density Functional Theory
(DDFT).99
Figure 3.12 shows the simplified procedure how the cooperative binding model for one protein type
(one-component case) and for more than one protein type (multi-component case) is applied. In the one-
component case the calculation needs the protein specific values, radius Rp, charge zp and the second
virial coefficient B2, which are either known from literature or are accessible by scattering techniques.
Providing microgel properties and bulk properties are known, the number of bound protein Ni, ∆Gel,i
and βµ can be calculated with the CB-model using ∆G0 as the only fit parameter. The principle in the
multi-component case is similar except that ∆G0 for every single protein type needs to be determined.
3.4.1 Derivation of the Cooperative Binding Model
In the model the distribution of proteins between microgel and bulk solution is described by the central
equation
(3.30)Ni
Vg= ci · exp[−β∆Gel,i(Ni) − β∆G0,i] exp[−βµi(Ni)] = ci · exp[−β∆Gtot,i]
where Ni/Vg is the number density of the i-th type protein from a multicomponent protein mixture with
Vg being the volume of the microgel. The number density is calculated from the total free energy ∆Gtot,i
28
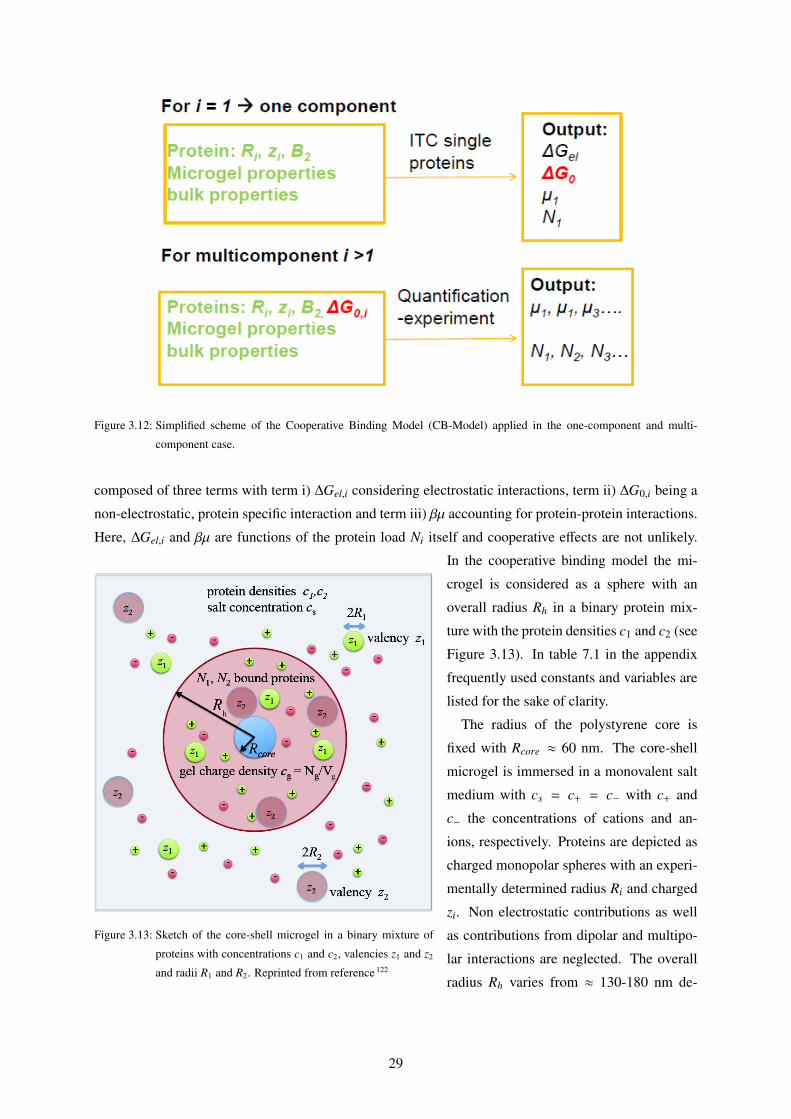
Figure 3.12: Simplified scheme of the Cooperative Binding Model (CB-Model) applied in the one-component and multi-
component case.
composed of three terms with term i) ∆Gel,i considering electrostatic interactions, term ii) ∆G0,i being a
non-electrostatic, protein specific interaction and term iii) βµ accounting for protein-protein interactions.
Here, ∆Gel,i and βµ are functions of the protein load Ni itself and cooperative effects are not unlikely.
Figure 3.13: Sketch of the core-shell microgel in a binary mixture of
proteins with concentrations c1 and c2, valencies z1 and z2
and radii R1 and R2. Reprinted from reference 122
In the cooperative binding model the mi-
crogel is considered as a sphere with an
overall radius Rh in a binary protein mix-
ture with the protein densities c1 and c2 (see
Figure 3.13). In table 7.1 in the appendix
frequently used constants and variables are
listed for the sake of clarity.
The radius of the polystyrene core is
fixed with Rcore ≈ 60 nm. The core-shell
microgel is immersed in a monovalent salt
medium with cs = c+ = c− with c+ and
c− the concentrations of cations and an-
ions, respectively. Proteins are depicted as
charged monopolar spheres with an experi-
mentally determined radius Ri and charged
zi. Non electrostatic contributions as well
as contributions from dipolar and multipo-
lar interactions are neglected. The overall
radius Rh varies from ≈ 130-180 nm de-
29

pending on salt and/or protein concentra-
tions. The charged polymeric network of the shell has a volume of Vg = 4π(R3h − R3
core) and is the
only part accessible for the protein uptake. By incorporating units of acrylic acid the network is weakly
negatively charged at neutral pH (weakly dissociated polyelectrolyte). Conductometric and potentiomet-
ric measurements revealed an incorporation of Ng = 4.9 · 105 charged units per microgel.
The Bjerrum length lB =e2
4πϵϵ0kBT is defined as the separation distance of two elementary charges where
the electrostatic energy is the thermal energy. In this system lB = 0.7 nm , i.e. the Bjerrum length of
water. The mean separation between two charged monomers on the same polymer within the microgel
is estimated about 2.2 nm. Thus, charge regulation effects in term of counterion condensation play a
minor role and the charge valency of the monomers is zg = −1. This leads to a total charge density
of zgcg = zgNg/Vg. Furthermore, in agreement with small angle scattering data it is assumed that the
charged units are homogeneously distributed in the network. The remaining parts of the microgel and
buffers are treated as a continuum background with fixed dielectric, elastic and osmotic properties.
3.4.1.1 Electrostatic Interactions
Electrostatic interactions can not be neglected in the adsorption of proteins to a charged microgel net-
work and are the most dominant contributions. The transfer of a charged protein in a salt bath with
concentration cs into the gel with the charge cg is associated with a transfer in free energy of the particle.
If we consider the proteins as polyelectrolytes with spherical symmetry the difference in free energy can
be described through59
(3.31) β∆Gel,i = zi∆ϕ(y) −z2
i lB
2Ri
(κgRi
1 + κgRi− κbRi
1 + κbRi
)with κg and κb defined as the inverse Debye Screening length. The first term accounts for the energy
needed to transfer a charged protein against the difference in the electrostatic potential (Donnan potential)
between the gel and bulk solution. The second term, the Born energy, relates to the difference in the
energy of charging the sphere of radius Ri in bulk and gel because of the different screening properties
in both media.
For weak perturbations i.e low salt concentration, low protein loading and not too high protein net
charge the electrostatic interactions can be treated by the Poisson-Boltzmann cell model. In the cell
model, the proteins are treated as homogeneously charged spheres with radius Ri and valency zp. The
proteins occupy a spherical cell with radius Rc and volume Vc and the dimension of the cell in terms of
Rc is determined by the number of proteins Ni by the following relation:
(3.32) Rc =
(3Vc
4π
)1/3
=
(3Vc
4πNi
)1/3
∝ N1/3i
Each cell has a fixed number of charges Nc defined by the number of monomer charges and proteins
Nc = Ng/Ni. Furthermore, each cell is in contact with the bulk solution containing a monovalent salt
with the concentration cs. Thus, on average the electroneutrality condition must be fulfilled by every
cell.
(3.33) cs exp(−∆ϕ) − cs exp(∆ϕ) + zgcg + zpNi/V = 0
30
If we neglect the small protein concentration outside the gel the solution for δϕ is the modified Donnan
potential as defined already defined in equation 3.3. The Donnan potential originates from an unequal
distribution of ions between bulk and microgel which causes a mean electrostatic potential compared
to the bulk reference state ϕ = 0. For the proteins inside the cell we assume, that the gel network
behaves fluid-like and the charge entities are comparable to mobile counterions to the proteins. Hence,
the Poisson-Boltzmann equation in spherical coordinates can be applied to these system written as
(3.34)1r
(rϕ)′′ = −4πlB[(zgc exp(−zgϕ1) − cs exp(∆ϕ + ϕ1) + cs exp(−∆ϕ − ϕ1)
]where ∆ϕ is the modified Donnan potential defined in equation 3.3 and ϕ1 is a perturbation caused by the
adsorbing proteins. The constant c is defined via the overall charge number Nc
(3.35) Nc =
∫Vc
d3r exp(−zgϕ1)
For small perturbations ϕ1 ≪ 1 as it is the case for a weakly charged protein equation (3.34) can be
linearized.
(3.36)1r
(rϕ)′′ = 4πlBziNi/Vg + κ2(ϕ − ∆ϕ)
We define κ =√
4πlbcin as the internal inverse screening length with cin = cg+cs exp(−∆ϕ)+cs exp(∆ϕ).
The final solution of equation (3.36) is:
(3.37) ϕ(r) = ∆ϕ − ziNi/(Vcin) + Aexp−κr
r+ B
exp−κrr
with the constants:
A =zilB exp κRi
1 + κRi
[1 − exp−2κ(Rc − Ri)
(κRi − 1)(κRi + 1)
(κRc − 1)(κRc + 1)
)]
B =zilB
1 + κRi
[exp κ(2Rc − Ri)
(κRi − 1)(κRi + 1)
(κRc − 1)(κRc + 1)
]Since we assume a large cell size (Rc → ∞) or a low protein load (Ni → 0), respectively, it follows that
B→ 0, and A→ zilB exp(κRi)/(1 + κRi). Thus, equation 3.37 can be simplified to
(3.38) ϕ(r) = ∆ϕ − ziNi/(Vcin) +zilB
1 + κRi
exp−κ(r − Ri)r
With the co-ion concentration in the microgel expected to be rather small, that is cin ≃ cg, a further
simplification to equation 3.38 is made leading to
(3.39) ϕ(r) =zilB
1 + κbRi
exp−κ(r − Ri)r
where κb is the inverse screening length in the gel κb =√
8πlBcg. Following this theoretical framework
the free energy or Gibbs energy ∆G is simply the difference of work needed to transfer a sphere charged
zi from bulk solution to the gel against different surface potentials.
(3.40) β∆G =∫ zi
0dzi
[ϕg(Ri) − ϕb(Ri)
]
31

In the low salt and low protein load limit the leading order contributions can be summarized to:
(3.41) β∆Gel,i = zi∆ϕ −z2
i Ni
2cgVg−
z2i lB
2Ri
(κgRi
1 + κgRi− κbRi
1 + κbRi
)So far the free energy only considers ionic contributions to fixed lattices. However, the proteins are not
confined and behave fluid-like. The free energy needs to be corrected for protein-protein interactions in
terms of an excess chemical potential µ.
3.4.1.2 Pair Interactions
The third term in equation 3.30, namely µi, considers excluded volume interactions (pair interaction)
between the densely packed hard spheres (proteins). In contrast, to the Langmuir model the proteins are
not condensed to fixed binding sites and are allowed to move translational within the microgel under the
restraint of pair interactions. For a one-component hard sphere system with i = 1 the excluded volume
term can be accurately expressed by the Carnahan-Starling potential143
(3.42) βµCS =8η − 9η2 + 3η3
(1 − η)3
with the following definition of η = (Ni/Vg)πσ3i /6. The quantity σi = 2Ri is an effective hard sphere
diameter. In the CB model it makes sense to replace the effective diameter by the diameter of gyration
or hydrodynamic diameter, which are either known from literature or can be measured by scattering
techniques. An expansion of the Carnahan-Starling potential to multi-component systems is not easy to
obtain. However, in the limit of low protein loading µi or µCS can be expressed in terms of the second
virial coefficient,59 which can be calculated from σi via
(3.43) B2 =23πσ3
i
in the case of one component or via
(3.44) Bi j2 =
23π[σi + σ j
2
]3
the second coefficient in case of two interacting proteins i and j. With this approximation we end up with
the general equation:
Ni
Vg= ci · exp[−β∆Gel,i(Ni) − β∆G0,i] exp[−βµi(Ni)](3.45)
= ci · exp[−β∆Gel,i(Ni) − β∆G0,i
)(1 − 2B2
Ni
Vg)
3.4.1.3 Volume Effects
As already described in detail in section 3.1.4 the volume of the microgel Vg is determined by the balance
of osmotic and elastic pressure (see equation 3.4). However, it does not include contributions from the
proteins being adsorbed. Addition of proteins will lower the total net charge and inhomogenize the charge
distribution in the network. On the other side, the monomer charge density cg = Ng/V increases with
32
shrinking and contributions from ∆Gel,i will be affected. It is also conceivable that protein adsorption
can swell the network again. Nevertheless, a theory covering the volume effects caused by protein
adsorption was out of scope in this thesis and the protein specific volume shrinkage was described using
the empirical formula
(3.46) Rh(x) =Rmax − Rmin
2
[1 − tanh
x − x0
∆
]+ Rmin
with Rh(x), the hydrodynamic radius measured precisely in a DLS experiment.
In the multicomponent case the situation becomes even more challenging - e.g. the shrinkage might
deviate compared to the one -component case - and the gel volume becomes a function the molar ratios
of i-th proteins Vg = Vg(xi). In the case of a binary mixture the volumes are estimated by a linear
interpolation of the form, which describes the measured data sufficiently.
(3.47) Vg(x1, x2) =Vg(x1) · N1 + Vg(x2) · N2
N1 + N2
33

4 Results and Discussion
4.1 Binding Isotherms of Core-Shell Microgels to Single Proteins (ITC)
In Table 4.2 the main properties of the microgels are summarized. The microgels vary in size, the content
of the charged copolymer acrylic acid and in the number of absolute charges per microgel particle. The
synthesis for all microgels followed a two step procedure.75 First the polystyrene core was synthesized
by emulsion polymerisation. In a second step the shell is grafted on by seeded emulsion polymerisation
(see further explanation in chapter 6). The microgels were cleaned by ultrafiltration and characterized
by DLS, TEM and conductometric measurements as described in detail in chapter 6. Table 4.2 gives
Table 4.1: Microgels Overview
microgel AAc [mol-%] Mw [g/mol] Rcore Rh [nm] Ng
NW15 10 1.18 · 109
62.2 ±0.7 185 ±10 4.9 · 105
OM5UF 0 1.21 · 108 34 ±5 90 ±5 0
OM6UF 7.5 5.79 · 109
100 ±7 284 ±7 2.66 · 106
Rcore= Hydrodynamic radius of PS-core, Rh= Hydrodynamic radius of microgel, Ng = number of charged units
an overview on the protein-microgel combinations for which ITC experiments were carried out. For
microgel NW15 the adsorption isotherms were fitted by the Langmuir model and by the CB-model. For
microgels OM5UF and OM6UF fitting with the Langmuir model was sufficient due to the fact that these
microgels were not used for competitive adsorption experiments.
Table 4.2: Overview: Protein-microgel combinations for ITC Experiments
microgel Langmuir Model Cooperative Binding Model
NW15 Lysozyme, RNase A, Papain,
Glucosidase, Cytochrome c
Lysozyme, RNase A, Papain,
Cytochrome c
OM5UF Cytochrome c -
OM6UF Lysozyme -
4.1.1 Langmuir Fits
Figure 4.1 shows the adsorption isotherms for cytochrome c binding to microgels NW15 and OM5UF
at varying temperature. The binding isotherms were fitted with the Langmuir model. Thermodynamic
parameters are listed in Table 4.3. The number of binding sites are all within the margin of error and
34
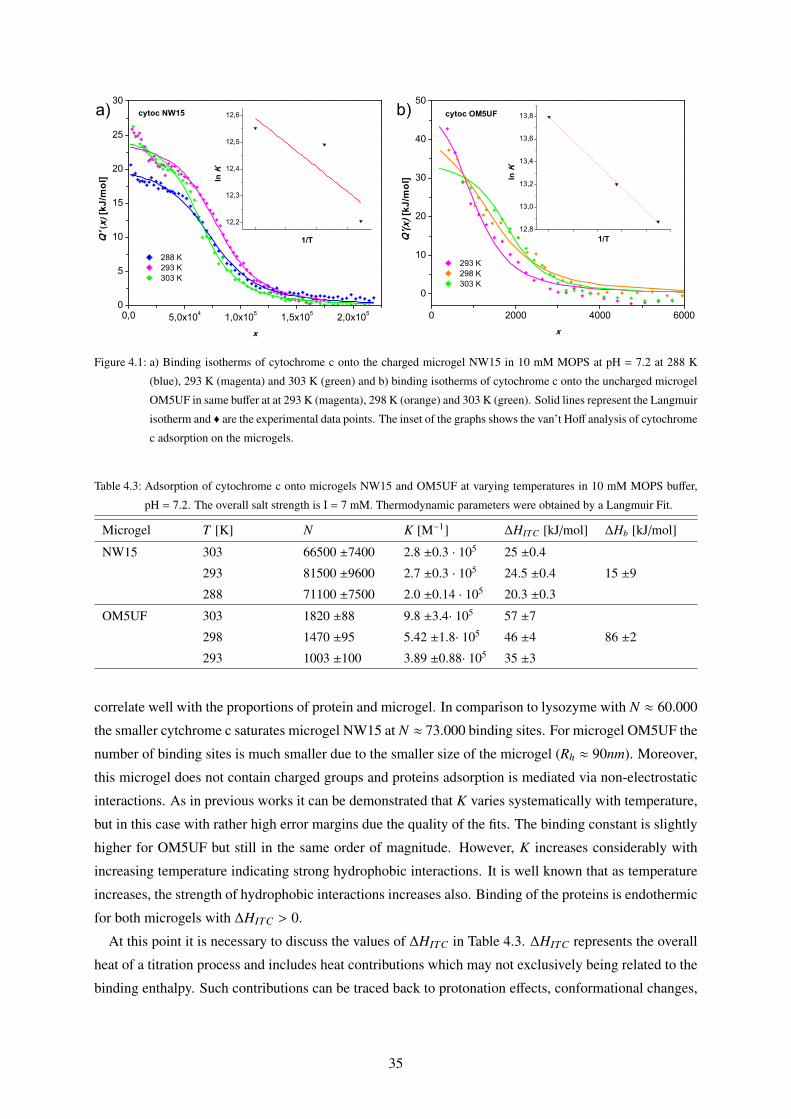
0,0 5,0x10⁴ 1,0x10⁵ 1,5x10⁵ 2,0x1050
5
10
15
20
25
30
0 2000 4000 6000
0
10
20
30
40
50cytoc OM5UF
288 K 293 K 303 K
Q' (
x) [k
J/m
ol]
x
cytoc NW15
12,2
12,3
12,4
12,5
12,6
ln K
1/T
293 K 298 K 303 K
Q'(x
) [kJ
/mol
]
x
12,8
13,0
13,2
13,4
13,6
13,8a)
ln K
1/T
b)
Figure 4.1: a) Binding isotherms of cytochrome c onto the charged microgel NW15 in 10 mM MOPS at pH = 7.2 at 288 K
(blue), 293 K (magenta) and 303 K (green) and b) binding isotherms of cytochrome c onto the uncharged microgel
OM5UF in same buffer at at 293 K (magenta), 298 K (orange) and 303 K (green). Solid lines represent the Langmuir
isotherm and q are the experimental data points. The inset of the graphs shows the van’t Hoff analysis of cytochrome
c adsorption on the microgels.
Table 4.3: Adsorption of cytochrome c onto microgels NW15 and OM5UF at varying temperatures in 10 mM MOPS buffer,
pH = 7.2. The overall salt strength is I = 7 mM. Thermodynamic parameters were obtained by a Langmuir Fit.
Microgel T [K] N K [M−1] ∆HITC [kJ/mol] ∆Hb [kJ/mol]
NW15 303 66500 ±7400 2.8 ±0.3 · 105 25 ±0.4
293 81500 ±9600 2.7 ±0.3 · 105 24.5 ±0.4 15 ±9
288 71100 ±7500 2.0 ±0.14 · 105 20.3 ±0.3
OM5UF 303 1820 ±88 9.8 ±3.4· 105 57 ±7
298 1470 ±95 5.42 ±1.8· 105 46 ±4 86 ±2
293 1003 ±100 3.89 ±0.88· 105 35 ±3
correlate well with the proportions of protein and microgel. In comparison to lysozyme with N ≈ 60.000
the smaller cytchrome c saturates microgel NW15 at N ≈ 73.000 binding sites. For microgel OM5UF the
number of binding sites is much smaller due to the smaller size of the microgel (Rh ≈ 90nm). Moreover,
this microgel does not contain charged groups and proteins adsorption is mediated via non-electrostatic
interactions. As in previous works it can be demonstrated that K varies systematically with temperature,
but in this case with rather high error margins due the quality of the fits. The binding constant is slightly
higher for OM5UF but still in the same order of magnitude. However, K increases considerably with
increasing temperature indicating strong hydrophobic interactions. It is well known that as temperature
increases, the strength of hydrophobic interactions increases also. Binding of the proteins is endothermic
for both microgels with ∆HITC > 0.
At this point it is necessary to discuss the values of ∆HITC in Table 4.3. ∆HITC represents the overall
heat of a titration process and includes heat contributions which may not exclusively being related to the
binding enthalpy. Such contributions can be traced back to protonation effects, conformational changes,
35

and possible side contributions other than "pure" protein binding. Consequently, the enthalpy measured
by ITC can be expressed as a sum of the binding enthalpy ∆Hb and some residual enthalpy ∆Hres which
accounts for all effects not related to the "pure" protein binding.68
(4.1) ∆HITC = ∆Hb + ∆Hres
The binding enthalpy ∆Hb can be extracted from the van’t Hoff relation, i.e. the temperature dependence
of K defined as
(4.2)(d(lnK)dT−1
)p= −∆Hb
R
The difference between ∆HITC and van’t Hoff enthalpy is system-specific. In some cases they do not
differ from each other significantly, while in other cases the differences can be large. For example, the
adsorption of RNase A onto a spherical electrolyte brush was endothermic with ∆HITC > 0 while ∆Hb
was negligibly small, i.e. K is temperature-invariant. This led to the conclusion that ∆HITC and K were
not related to the same equilibrium process91 and ∆HITC originated from processes other than protein
binding. Similarly, by analysis of both enthalpies Welsch et al. could proof an additional protonation
reaction of the adsorbed lysozyme which contributed to ∆HITC (see section 3.2.1).68 The van’t Hoff plots
of cytochrome c adsorbing onto NW15 and OM5UF are shown in the insets of Figure 4.1. From the slope
of the regression line ∆Hb was calculated with 15 ±9 kJ/mol for NW15 and 86 ±2 kJ/mol for OM5UF
(see Table 4.3). In this case ∆Hb differs about a factor of 6 indicating a strong binding of cytochrome c to
microgel OM5UF. In this case, the adsorption probably is accompanied by a strong exothermic reaction
like a deprotonation step or unfolding of the protein because ∆Hb is higher than ∆HITC .
Besides temperature the adsorption of proteins to charged microgels strongly depend on the salt con-
centration. Figure 4.2 shows the adsorption isotherms for cytochrome c and glucosidase binding to
microgel NW15 at varying salt strength. The inset of the graph shows the shrinkage of the microgel with
respect to the molar ratio x. Experimental values for Rh for both proteins (H) at 7 mM ionic strength and
298 K as measured by DLS. The solid line is a fit according to equation 3.46. Experimental values (q)
from ITC measurements were fitted with a Langmuir isotherm and the values for N, K, and ∆HITC are
listed in Table 4.4 Cytochrome c is a small rather globular protein with a positive netcharge at pH = 7.2.
Table 4.4: Adsorption of cytochrome c and glucosidase onto NW15 microgel at varying ionic strength in 10 mM MOPS buffer,
pH = 7.2 and at T = 298 K. Thermodynamic parameters were obtained by a Langmuir Fit.
Protein Ionic strength [mM] N K [M−1] ∆HITC [kJ/mol]
Cytochrome c 7 68900 ±640 2.8 ±0.2· 105 25 ±1
17 35100 ±830 1.44 ±0.14· 105 31 ±1
32 9240 ±3900 5.6 ±1.1· 104 60 ±27
Glucosidase 7 10200 ±91 3.5 ±0.3· 106 113 ±2
17 8340 ±320 6.4 ±1· 105 157 ±9
32 11100±210 1.0 ±0.1· 106 163 ±4
36

0,0 5,0x10⁴ 1,0x10⁵ 1,5x10⁵ 2,0x1050
5
10
15
20
25
0,0 5,0x10³ 1,0x10⁴ 1,5x10⁴ 2,0x1040
20
40
60
80
100
120
140
160
180
200b)GLU
7 mM 17 mM 32 mM
7 mM 17 mM 32 mM
Q' (
x) [k
J/m
ol]
x
cytoca)
0,0 5,0x10⁴ 1,0x10⁵ 1,5x10⁵ 2,0x105150
160
170
180
Rh
[nm
]
x
Q(x
) [kJ
/mol
]
x
0,0 5,0x10³ 1,0x10⁴ 1,5x10⁴ 2,0x104120
130
140
150
160
170
180
Rn
[nm
]
x
Figure 4.2: Adsorption isotherms of a) Cytochrome c and b) Glucosidase. The differential heat Q(x) (kJ/mol) is plotted versus
the molar ratio x of the protein measured at 7 mM (blue), 17 mM (magenta) and 32 mM (green) ionic strength and
298 K. See further explanation in the text.
At 7 mM ionic strength the number of binding sites N is ≈ 70.000. This packing density correlates well
with the size of the protein. Increasing the ionic strength leads to a significant decrease in the number
of binding sites and the binding strength K. The same trend can also be observed for lysozyme which
has been studied extensively in previous works.68,81 This effect can be traced back to screening inter-
actions which finally lower the Donnan potential and reduce the electrostatic attraction between protein
and microgel (see section 3.1.3). Despite the fact that lysozyme and cytochrome c have roughly the
same size and netcharge the binding strength is about one order of magnitude lower for cytochrome c
(K(Lysozyme) = 2.6 · 106 [M−1] and K(cytochrome c) = 2.8 · 105 at 298 K and 7 mM ionic strength).
Consequently, non electrostatic effects like the charge distribution on the protein surface as well as spe-
cific interactions, such as hydrophobic binding, are also decisive for the thermodynamics of adsorption.
However, the incorporation of such contributions is not possible within Langmuir model and a detailed
analysis including a quantitative assignment of different driving forces using another model will follow
in the next section.
Glucosidase binds endothermic to the microgel with ∆H > 0 for all salt strengths (I = 7,17,32 mM).
37
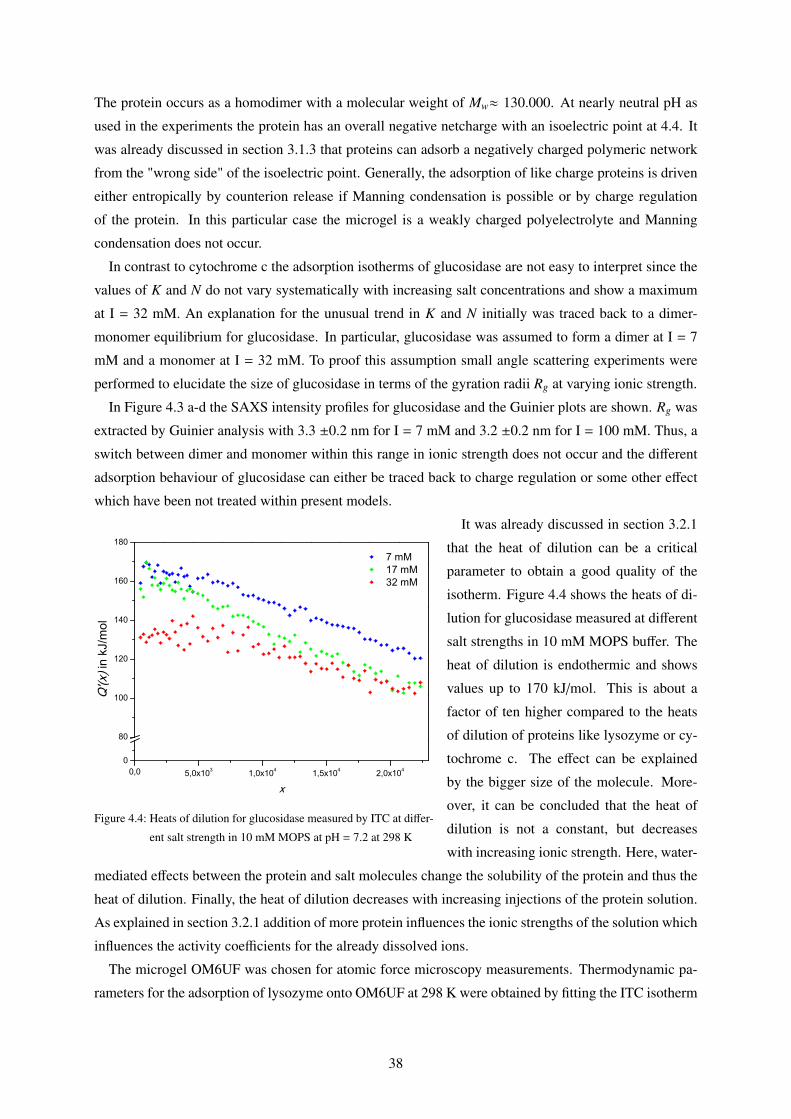
The protein occurs as a homodimer with a molecular weight of Mw≈ 130.000. At nearly neutral pH as
used in the experiments the protein has an overall negative netcharge with an isoelectric point at 4.4. It
was already discussed in section 3.1.3 that proteins can adsorb a negatively charged polymeric network
from the "wrong side" of the isoelectric point. Generally, the adsorption of like charge proteins is driven
either entropically by counterion release if Manning condensation is possible or by charge regulation
of the protein. In this particular case the microgel is a weakly charged polyelectrolyte and Manning
condensation does not occur.
In contrast to cytochrome c the adsorption isotherms of glucosidase are not easy to interpret since the
values of K and N do not vary systematically with increasing salt concentrations and show a maximum
at I = 32 mM. An explanation for the unusual trend in K and N initially was traced back to a dimer-
monomer equilibrium for glucosidase. In particular, glucosidase was assumed to form a dimer at I = 7
mM and a monomer at I = 32 mM. To proof this assumption small angle scattering experiments were
performed to elucidate the size of glucosidase in terms of the gyration radii Rg at varying ionic strength.
In Figure 4.3 a-d the SAXS intensity profiles for glucosidase and the Guinier plots are shown. Rg was
extracted by Guinier analysis with 3.3 ±0.2 nm for I = 7 mM and 3.2 ±0.2 nm for I = 100 mM. Thus, a
switch between dimer and monomer within this range in ionic strength does not occur and the different
adsorption behaviour of glucosidase can either be traced back to charge regulation or some other effect
which have been not treated within present models.
0,0 5,0x10³ 1,0x10⁴ 1,5x10⁴ 2,0x1040
80
100
120
140
160
180
7 mM 17 mM 32 mM
Q'(x
) in
kJ/m
ol
x
Figure 4.4: Heats of dilution for glucosidase measured by ITC at differ-
ent salt strength in 10 mM MOPS at pH = 7.2 at 298 K
It was already discussed in section 3.2.1
that the heat of dilution can be a critical
parameter to obtain a good quality of the
isotherm. Figure 4.4 shows the heats of di-
lution for glucosidase measured at different
salt strengths in 10 mM MOPS buffer. The
heat of dilution is endothermic and shows
values up to 170 kJ/mol. This is about a
factor of ten higher compared to the heats
of dilution of proteins like lysozyme or cy-
tochrome c. The effect can be explained
by the bigger size of the molecule. More-
over, it can be concluded that the heat of
dilution is not a constant, but decreases
with increasing ionic strength. Here, water-
mediated effects between the protein and salt molecules change the solubility of the protein and thus the
heat of dilution. Finally, the heat of dilution decreases with increasing injections of the protein solution.
As explained in section 3.2.1 addition of more protein influences the ionic strengths of the solution which
influences the activity coefficients for the already dissolved ions.
The microgel OM6UF was chosen for atomic force microscopy measurements. Thermodynamic pa-
rameters for the adsorption of lysozyme onto OM6UF at 298 K were obtained by fitting the ITC isotherm
38
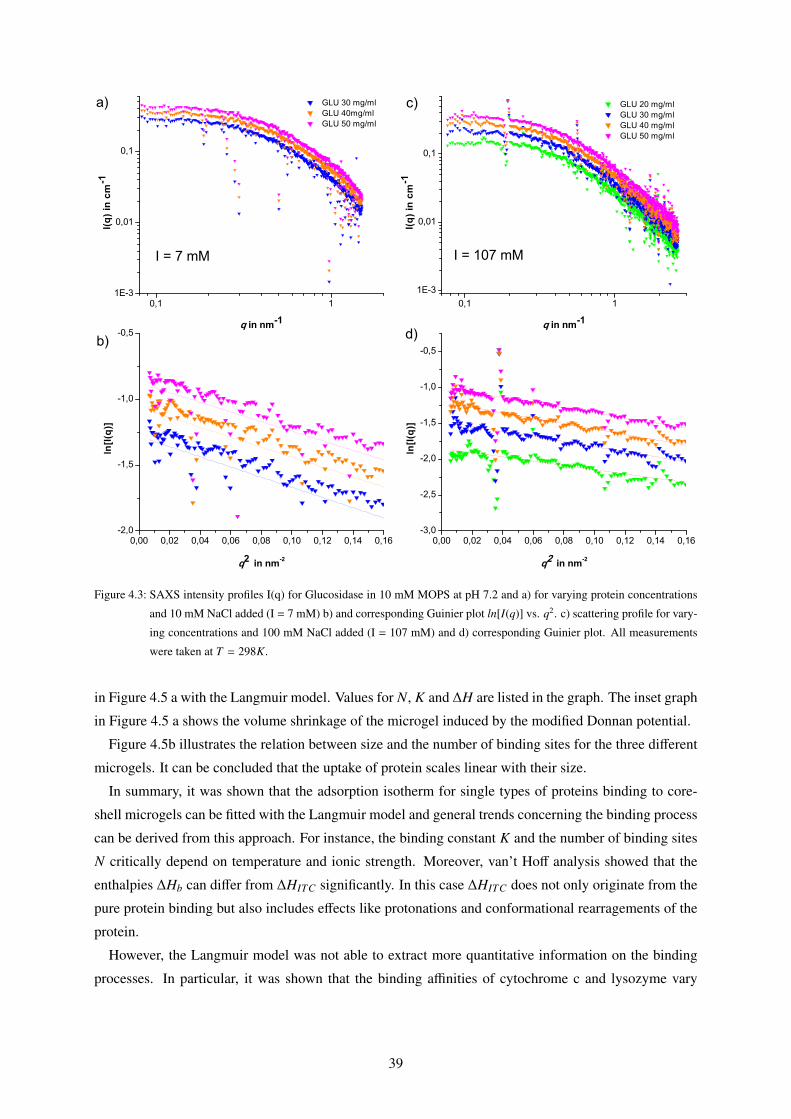
0,1 11E-3
0,01
0,1
0,1 11E-3
0,01
0,1
0,00 0,02 0,04 0,06 0,08 0,10 0,12 0,14 0,16-2,0
-1,5
-1,0
-0,5
0,00 0,02 0,04 0,06 0,08 0,10 0,12 0,14 0,16-3,0
-2,5
-2,0
-1,5
-1,0
-0,5b)
c)
d)
I = 107 mM
GLU 30 mg/ml GLU 40mg/ml GLU 50 mg/ml
I(q) i
n cm
-1
q in nm-1
I = 7 mM
a) GLU 20 mg/ml GLU 30 mg/ml GLU 40 mg/ml GLU 50 mg/ml
I(q) i
n cm
-1
q in nm-1
ln[I(
q)]
q2 in nm-2
ln[I(
q)]
q2 in nm-2
Figure 4.3: SAXS intensity profiles I(q) for Glucosidase in 10 mM MOPS at pH 7.2 and a) for varying protein concentrations
and 10 mM NaCl added (I = 7 mM) b) and corresponding Guinier plot ln[I(q)] vs. q2. c) scattering profile for vary-
ing concentrations and 100 mM NaCl added (I = 107 mM) and d) corresponding Guinier plot. All measurements
were taken at T = 298K.
in Figure 4.5 a with the Langmuir model. Values for N, K and ∆H are listed in the graph. The inset graph
in Figure 4.5 a shows the volume shrinkage of the microgel induced by the modified Donnan potential.
Figure 4.5b illustrates the relation between size and the number of binding sites for the three different
microgels. It can be concluded that the uptake of protein scales linear with their size.
In summary, it was shown that the adsorption isotherm for single types of proteins binding to core-
shell microgels can be fitted with the Langmuir model and general trends concerning the binding process
can be derived from this approach. For instance, the binding constant K and the number of binding sites
N critically depend on temperature and ionic strength. Moreover, van’t Hoff analysis showed that the
enthalpies ∆Hb can differ from ∆HITC significantly. In this case ∆HITC does not only originate from the
pure protein binding but also includes effects like protonations and conformational rearragements of the
protein.
However, the Langmuir model was not able to extract more quantitative information on the binding
processes. In particular, it was shown that the binding affinities of cytochrome c and lysozyme vary
39
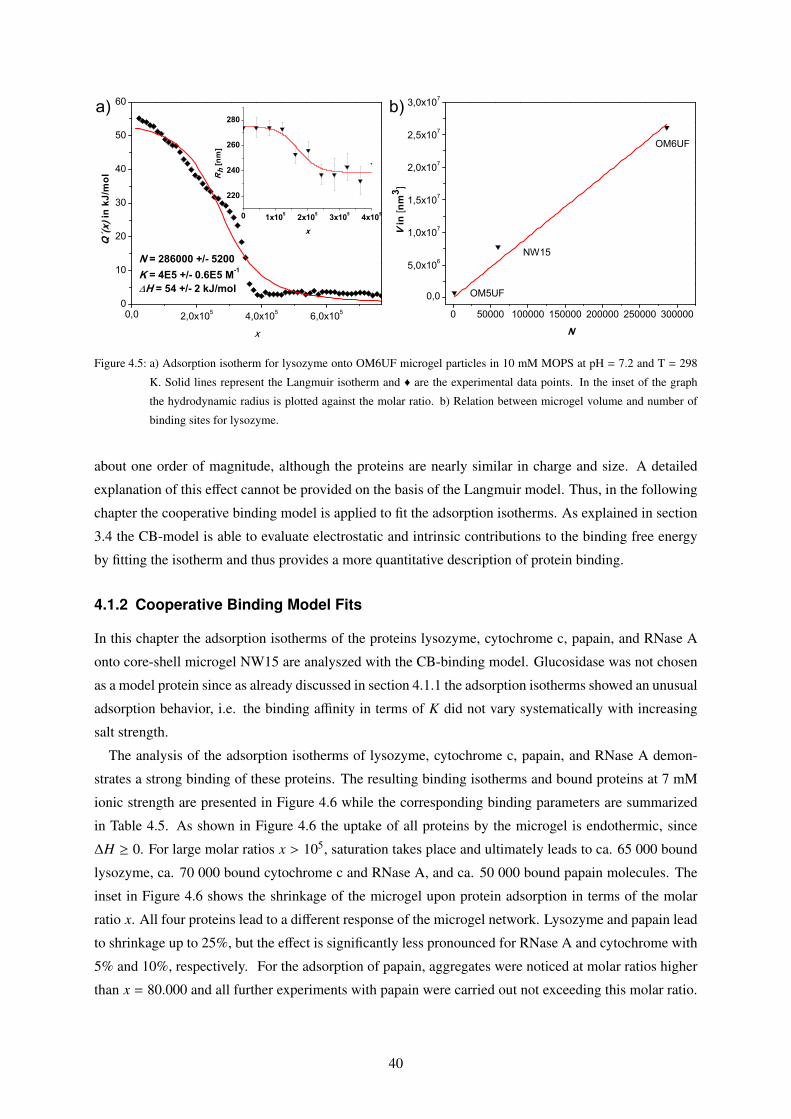
0,0 2,0x10⁵ 4,0x10⁵ 6,0x1050
10
20
30
40
50
60
0 50000 100000 150000 200000 250000 300000
0,0
5,0x10⁶
1,0x10⁷
1,5x10⁷
2,0x10⁷
2,5x10⁷
3,0x10⁷Q
´(x)
in k
J/m
ol
x
N = 286000 +/- 5200K = 4E5 +/- 0.6E5 M-1
H = 54 +/- 2 kJ/mol
0 1x10⁵ 2x10⁵ 3x10⁵ 4x10⁵
220
240
260
280
Rh
[nm
]
x
b)
OM6UF
NW15
V in
[nm
3 ]
N
OM5UF
a)
Figure 4.5: a) Adsorption isotherm for lysozyme onto OM6UF microgel particles in 10 mM MOPS at pH = 7.2 and T = 298
K. Solid lines represent the Langmuir isotherm and q are the experimental data points. In the inset of the graph
the hydrodynamic radius is plotted against the molar ratio. b) Relation between microgel volume and number of
binding sites for lysozyme.
about one order of magnitude, although the proteins are nearly similar in charge and size. A detailed
explanation of this effect cannot be provided on the basis of the Langmuir model. Thus, in the following
chapter the cooperative binding model is applied to fit the adsorption isotherms. As explained in section
3.4 the CB-model is able to evaluate electrostatic and intrinsic contributions to the binding free energy
by fitting the isotherm and thus provides a more quantitative description of protein binding.
4.1.2 Cooperative Binding Model Fits
In this chapter the adsorption isotherms of the proteins lysozyme, cytochrome c, papain, and RNase A
onto core-shell microgel NW15 are analyszed with the CB-binding model. Glucosidase was not chosen
as a model protein since as already discussed in section 4.1.1 the adsorption isotherms showed an unusual
adsorption behavior, i.e. the binding affinity in terms of K did not vary systematically with increasing
salt strength.
The analysis of the adsorption isotherms of lysozyme, cytochrome c, papain, and RNase A demon-
strates a strong binding of these proteins. The resulting binding isotherms and bound proteins at 7 mM
ionic strength are presented in Figure 4.6 while the corresponding binding parameters are summarized
in Table 4.5. As shown in Figure 4.6 the uptake of all proteins by the microgel is endothermic, since
∆H ≥ 0. For large molar ratios x > 105, saturation takes place and ultimately leads to ca. 65 000 bound
lysozyme, ca. 70 000 bound cytochrome c and RNase A, and ca. 50 000 bound papain molecules. The
inset in Figure 4.6 shows the shrinkage of the microgel upon protein adsorption in terms of the molar
ratio x. All four proteins lead to a different response of the microgel network. Lysozyme and papain lead
to shrinkage up to 25%, but the effect is significantly less pronounced for RNase A and cytochrome with
5% and 10%, respectively. For the adsorption of papain, aggregates were noticed at molar ratios higher
than x = 80.000 and all further experiments with papain were carried out not exceeding this molar ratio.
40
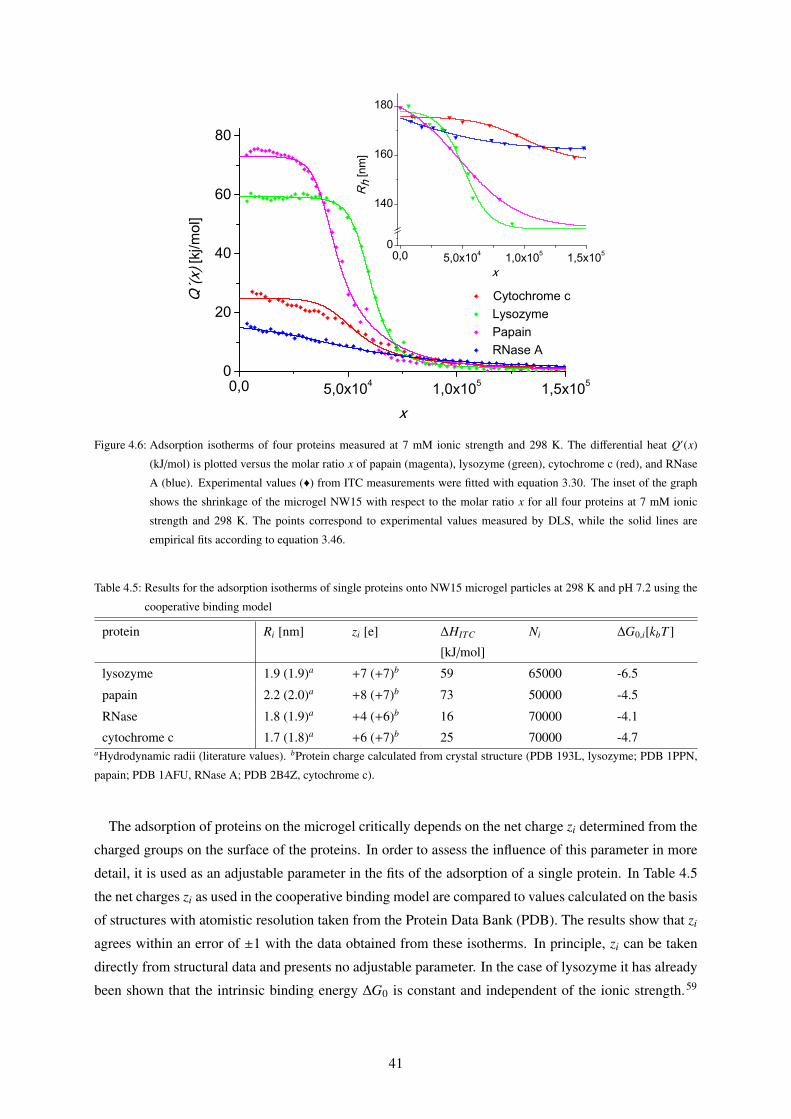
0,0 5,0x10⁴ 1,0x10⁵ 1,5x1050
20
40
60
80
Cytochrome c Lysozyme Papain RNase A
Q´(x
) [kj
/mol
]
x
0,0 5,0x10⁴ 1,0x10⁵ 1,5x1050
140
160
180
Rh
[nm
]
x
Figure 4.6: Adsorption isotherms of four proteins measured at 7 mM ionic strength and 298 K. The differential heat Q′(x)
(kJ/mol) is plotted versus the molar ratio x of papain (magenta), lysozyme (green), cytochrome c (red), and RNase
A (blue). Experimental values (q) from ITC measurements were fitted with equation 3.30. The inset of the graph
shows the shrinkage of the microgel NW15 with respect to the molar ratio x for all four proteins at 7 mM ionic
strength and 298 K. The points correspond to experimental values measured by DLS, while the solid lines are
empirical fits according to equation 3.46.
Table 4.5: Results for the adsorption isotherms of single proteins onto NW15 microgel particles at 298 K and pH 7.2 using the
cooperative binding model
protein Ri [nm] zi [e] ∆HITC
[kJ/mol]
Ni ∆G0,i[kbT ]
lysozyme 1.9 (1.9)a +7 (+7)b 59 65000 -6.5
papain 2.2 (2.0)a +8 (+7)b 73 50000 -4.5
RNase 1.8 (1.9)a +4 (+6)b 16 70000 -4.1
cytochrome c 1.7 (1.8)a +6 (+7)b 25 70000 -4.7aHydrodynamic radii (literature values). bProtein charge calculated from crystal structure (PDB 193L, lysozyme; PDB 1PPN,
papain; PDB 1AFU, RNase A; PDB 2B4Z, cytochrome c).
The adsorption of proteins on the microgel critically depends on the net charge zi determined from the
charged groups on the surface of the proteins. In order to assess the influence of this parameter in more
detail, it is used as an adjustable parameter in the fits of the adsorption of a single protein. In Table 4.5
the net charges zi as used in the cooperative binding model are compared to values calculated on the basis
of structures with atomistic resolution taken from the Protein Data Bank (PDB). The results show that zi
agrees within an error of ±1 with the data obtained from these isotherms. In principle, zi can be taken
directly from structural data and presents no adjustable parameter. In the case of lysozyme it has already
been shown that the intrinsic binding energy ∆G0 is constant and independent of the ionic strength.59
41
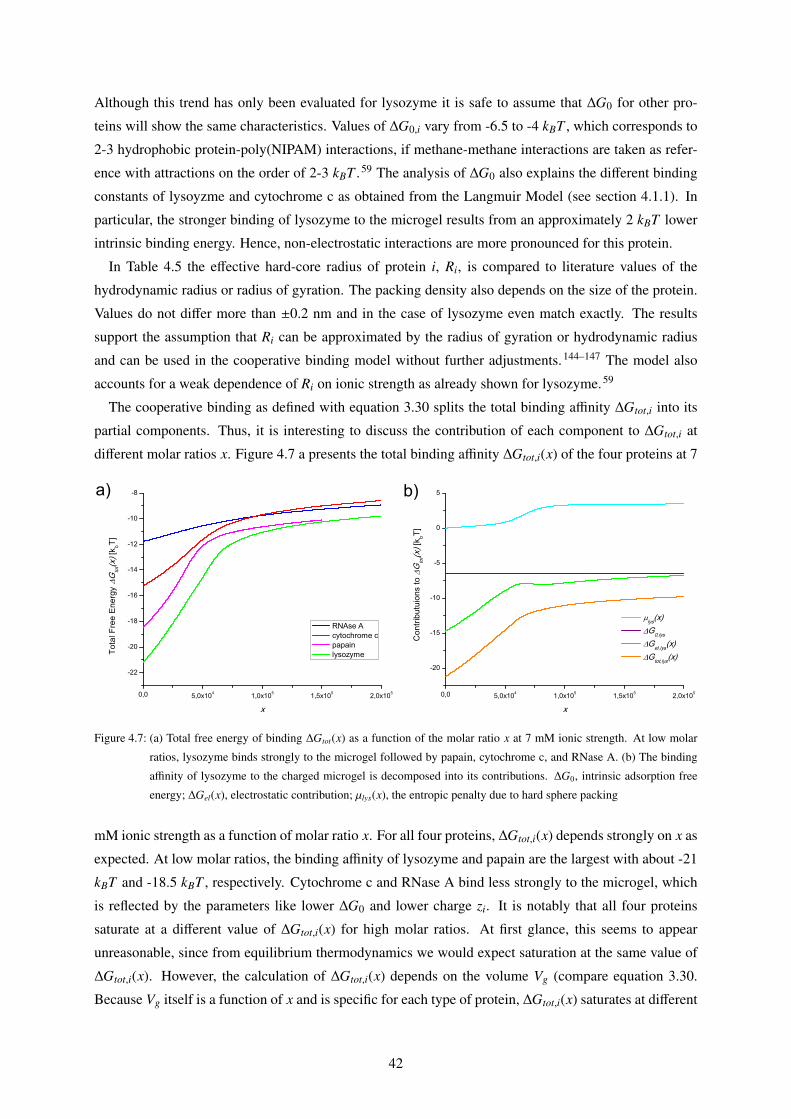
Although this trend has only been evaluated for lysozyme it is safe to assume that ∆G0 for other pro-
teins will show the same characteristics. Values of ∆G0,i vary from -6.5 to -4 kBT , which corresponds to
2-3 hydrophobic protein-poly(NIPAM) interactions, if methane-methane interactions are taken as refer-
ence with attractions on the order of 2-3 kBT .59 The analysis of ∆G0 also explains the different binding
constants of lysoyzme and cytochrome c as obtained from the Langmuir Model (see section 4.1.1). In
particular, the stronger binding of lysozyme to the microgel results from an approximately 2 kBT lower
intrinsic binding energy. Hence, non-electrostatic interactions are more pronounced for this protein.
In Table 4.5 the effective hard-core radius of protein i, Ri, is compared to literature values of the
hydrodynamic radius or radius of gyration. The packing density also depends on the size of the protein.
Values do not differ more than ±0.2 nm and in the case of lysozyme even match exactly. The results
support the assumption that Ri can be approximated by the radius of gyration or hydrodynamic radius
and can be used in the cooperative binding model without further adjustments.144–147 The model also
accounts for a weak dependence of Ri on ionic strength as already shown for lysozyme.59
The cooperative binding as defined with equation 3.30 splits the total binding affinity ∆Gtot,i into its
partial components. Thus, it is interesting to discuss the contribution of each component to ∆Gtot,i at
different molar ratios x. Figure 4.7 a presents the total binding affinity ∆Gtot,i(x) of the four proteins at 7
0,0 5,0x10⁴ 1,0x10⁵ 1,5x10⁵ 2,0x10⁵
-22
-20
-18
-16
-14
-12
-10
-8
0,0 5,0x10⁴ 1,0x10⁵ 1,5x10⁵ 2,0x10⁵
-20
-15
-10
-5
0
5b)
Tota
l Fre
e E
nerg
y G
tot(x
) [k bT]
x
RNAse A cytochrome c papain lysozyme
a)
lys(x) G0,lys
Gel,lys(x) Gtot,lys(x)
Con
tribu
tuio
ns to
G
tot(x
) [k bT]
x
Figure 4.7: (a) Total free energy of binding ∆Gtot(x) as a function of the molar ratio x at 7 mM ionic strength. At low molar
ratios, lysozyme binds strongly to the microgel followed by papain, cytochrome c, and RNase A. (b) The binding
affinity of lysozyme to the charged microgel is decomposed into its contributions. ∆G0, intrinsic adsorption free
energy; ∆Gel(x), electrostatic contribution; µlys(x), the entropic penalty due to hard sphere packing
mM ionic strength as a function of molar ratio x. For all four proteins, ∆Gtot,i(x) depends strongly on x as
expected. At low molar ratios, the binding affinity of lysozyme and papain are the largest with about -21
kBT and -18.5 kBT , respectively. Cytochrome c and RNase A bind less strongly to the microgel, which
is reflected by the parameters like lower ∆G0 and lower charge zi. It is notably that all four proteins
saturate at a different value of ∆Gtot,i(x) for high molar ratios. At first glance, this seems to appear
unreasonable, since from equilibrium thermodynamics we would expect saturation at the same value of
∆Gtot,i(x). However, the calculation of ∆Gtot,i(x) depends on the volume Vg (compare equation 3.30.
Because Vg itself is a function of x and is specific for each type of protein, ∆Gtot,i(x) saturates at different
42
values.
Figure 4.7 b shows the different contributions to the binding affinity done for lysozyme. By definition,
the intrinsic adsorption free energy ∆G0 is a constant contribution and incorporates local interactions,
while the electrostatic ∆Gel,i(x) and excluded-volume contributions depend explicitly on the molar ratio
x. The excluded-volume contribution is negligible at low molar ratios but increases to approximately 3
kBT at higher x. Thus, it is clear that the electrostatic contribution is the main contributor to the binding
affinity.
In summary, the CB-model showed a good performance to fit the adsorption isotherms of single type
proteins obtained by ITC measurements. In contrast, to the Langmuir Model it was possible to get a
more quantitative description of the adsorption process and the driving forces. In the CB-model the total
adsorption free energy ∆Gtot,i(x) originates from three different contributions, an electrostatic contribu-
tion ∆Gel,i(x), an intrinsic contribution ∆G0 and µ(x), a contribution from packing effects. Moreover,
the CB-model showed that ∆Gtot,i(x) depends on the protein load expressed as molar ratio x. This is
a marked contrast to the Langmuir model, in which the binding energy is calculated from the binging
constant K being independent of the protein load.
4.2 Competitive Adsorption
So far only the adsorption of one component - i.e, only one type of protein was present in solution -
was considered. However, adsorptions of one component adsorptions will not reflect a realistic scenario
for a nanoparticle immersed in a biological fluid. Here, a multi-component mixture is present and the
formation of a protein corona will depend on competitive and cooperative adsorptions. At this point the
Langmuir model is definitely reaches its limits and the assumption of single and independent binding
sites is not reasonable anymore.
In contrast, the CB-model is easily expandable to multi-component mixtures providing protein spe-
cific parameter like size as well as charge are known and the intrinsic binding energy ∆G0 has been
determined for each type of protein in the mixture. .The theoretical framework of the CB-model includ-
ing its expansion to multi-component mixtures has already been explained in section 3.4.
In Figure 4.8 the results of the competitive adsorption experiments for the proteins lysozyme, cy-
tochrome c, papain and RNAse A are shown. Experimental data were obtained by fluorescence spec-
troscopy. The details of the experiment have been already described in section 3.3.1.
Briefly described, the fluorescence of labeled lysozyme is quenched by binding to the microgel with a
concomitant decrease in the fluorescence intensity. When a second protein is bound, a certain amount of
labeled lysozyme is released into the bulk again, which can be seen from an increase of the intensity of
the fluorescence. For the experiments labeled lysozyme (lysozymeFITC) is adsorbed onto the microgel
in solution with a binding fraction of Θ1 ≈ 0.6. The binding fraction for lysozymeFITC was calculated
with the values from the Langmuir fit with Nmax = 65 000. For the binding fraction of the other proteins
Θ2, a mean value for the number of binding sites Nmax = (N1 + N2)/2 is assumed (compare Table 4.5
for the number of binding sites). First the competitive adsorption of unlabeled lysozyme to a microgel
43

0 2 4 6 8 10
0,0
0,1
0,2
0,3
0,4
0,5
0,6
0,7
0,8
0,9
1,0
0 2 4 6 8 10 120,0
0,1
0,2
0,3
0,4
0,5
0,6
0,7
0,8
0,9
1,0
0 2 4 6 8 10 120,0
0,1
0,2
0,3
0,4
0,5
0,6
0,7
0,8
0,9
1,0
0 2 4 6 8 10 120,0
0,1
0,2
0,3
0,4
0,5
0,6
0,7
0,8
0,9
1,0d)c)
b) x lysozymeFITC (exp.) x lysozymeFITC y lysozyme
bind
ing
frac
tion
c (Lysozyme) [µM]
a) x lysozymeFITC (exp.) x lysozymeFITC y cytochrome c
bin
ding
frac
tion
c (cytochrome c) [µM]
x lysozymeFITC (exp.) x lysozymeFITC y RNAse A
bind
ing
frac
tion
c (RNAse A) [µM]
G0 = 6.0 kbT
x lysozymeFITC (exp.) x lysozymeFITC y papain
bind
ing
frac
tion
c (papain) [µM]
G0 = 4.5 kbT
Figure 4.8: Competitive protein adsorption measured with fluorescence spectroscopy of (a) lysozymeFITC vs lysozyme, (b)
lysozymeFITC vs cytochrome c, (c) lysozymeFITC vs RNase A, and (d) lysozymeFITC vs papain. Solid and dotted
lines predict the competitive adsorption based on the cooperative binding model (equation 3.30).
loaded previously with lysozymeFITC was investigated (see Figure 4.8 a). In this case, Nmax = N1 = N2
and there is no change of the gel volume. Thus, this experiment presents a sensitive check of whether
equilibrium is reached or not. Figure 4.8 a shows that the lysozyme-lysozyme exchange exhibits the ex-
pected intersection point at nearly half the initial binding fraction at Θ1 = Θ2 = 0.38. This unequivocally
shows that protein adsorption to charged microgels is an equilibrium process which can be treated within
the cooperative binding model.
For the other proteins, the fraction of liberated lysozyme is monitored and compared to the calculated
value. In this case changes in the volume Vg are considered using the interpolation as defined in equation
3.47. Figure 4.8 shows that the predictions by theory are quantitative, and in the case of cytochrome c
and RNase A within the limits of error. For papain, the theory is not fully quantitative but gets the correct
trend. The comparison of these data with the parameters gathered in Table 4.5 now gives quantitative
insight into the process of competitive adsorption: RNase A which has the lowest binding constant
replaces the bound lysozymeFITC (Figure 4.8 c) less strongly than cytochrome c (Figure 4.8 b). In the
case of papain having a similar binding constant as lysozyme, the replacement is strong (Figure 4.8 d).
Here the prediction with ∆G0 = 4.5kBT as obtained from the ITC single adsorption isotherm does not
work fully quantitatively, but full agreement can be reached by adjusting ∆G0 = 6.0kBT . The reasons for
44

this discrepancy are not yet fully understood but could be traced back to a strong mutual attraction of the
bound proteins within the network not treatable by the present model.
To conclude, the Cooperative Binding Model showed a good performance in the prediction of the
competitive adsorption from binary mixtures. The proteins lysozyme, cytochrome c, papain and RNase
A were chosen because of their robust and characterized structures and their availability. In contrast to
the Langmuir model the CB-model is very general and can be used for all globular proteins, providing
their radii and charges can be determined and if ∆G0 is available from an ITC experiment.
45

4.3 Cytochrome c Adsorption as measured by Anomalous Small
Angle X-ray Scattering (ASAXS)
Small-angle X-ray scattering (SAXS) is a suitable method to investigate the spatial distribution of the
proteins within polymer coated nanoparticles and can be used as an additional method to quantify the
amount of adsorbed protein. In this work the adsorption of cytochrome c was measured by anomalous
X-Ray small angle scattering in the vicinity of the adsorption edge of Fe3+. The resonant scattering con-
tribution to the overall scattering intensity allows to extract the formfactor and locate the distribution of
the cytochrome c within the shell of microgel OM5UF. Moreover, the intensity of the resonant scattering
part can be correlated with the concentration of Fe3+ ions and ultimately with the number of bound pro-
teins per colloid. Cytochrome c is a small globular protein of ≈ 12.300 Da molecular weight and contains
a porphyrin macrocycle with an iron atom, a complex called heme group. The heme group of cytochrome
c can exist in an oxidized and reduced state. Figure 4.9 a shows the 3D structure of the protein with the
porphyrin macrocycle containing the iron highlighted in the middle. The iron atoms in cytochrome c
Figure 4.9: a) Crystal structure of cytochrome c shown here from PDB entry 3cyt. b) Comparison of the normalized adsorption
spectrum of an iron foil and for cytochrome c. 148 See further explanation in the text.
is ionic and can exist as Fe3+ or Fe2+ referring to the oxidized and reduced state, respectively. In the
ASAXS experiments there was no reducing species present and cytochrome c is in its oxidized state.
Because of the overall low concentration of Fe3+ in the protein the ASAXS instrument is not sensitive
enough to measure the adsorption spectrum and adsorption data were taken from literature.148
Figure 4.9 b shows the absorption spectrum of an iron foil (right axis) compared with the normalized
absorption spectrum of the ionic iron in cytochrome C (left axis).148 The K-absorption edge of the ionic
iron in the protein complex is shifted (chemical shift) by nearly +10 eV when compared to the absorption
edge of metallic Fe located at 7112 eV.
In anomalous X-ray scattering the scattering factor of an ion becomes a complex function of the energy
46

E of the incoming radiation near the absorption edge
(4.3) fion = f0 + f′(E) + i f
′′(E)
Figure 4.10: Anomalous dispersion corrections of Fe3+ based
on the calculations of Cromer and Liberman.
The first term f0 corresponds the the 26 electrons
of Fe, while f′(E) f
′′(E) represent the anomalous
dispersion corrections of the iron ion. The values
for f′(E) have been calculated in the energy range
between 6000 and 7400 eV via Kramers-Kronig
relation:149,150
(4.4) f′(ω) =
2πP
∫ ∞
0
ω′f ′′ω
′
ω′2 − ω2 dω
′
with P being the principal value of the integral
and the frequency ω. The values for f′′(E) were
obtained from the normalized absorption spec-
trum for cytochrome c as depicted in Figure 4.9
b. In a second step the values obtained from the
principal value integral have been adjusted to re-
sults of Cromer-Liberman calculations in the limit
of energies far apart form the K-absorption edge.
The results for the anomalous dispersion correc-
tions of f′(E) and f
′′(E) for Fe3+ are depicted in
Figure 4.10. The black dotes represent the X-ray energies where the ASAXS measurements were per-
formed. The Table in Figure 4.10 provides the anomalous dispersion corrections f′and f
′′for Fe3+ at the
three energies E1 =6810 eV, E2 =7094 eV and E3 =7112 eV. In Figure 4.11 the three the scattering curves
are plotted against the scattering vector q. All scattering curves have been calibrated into absolute units;
i.e. macroscopic scattering cross-sections in units of cross-section per unit volume [cm2/cm3] = [cm−1].
The error bars for the scattering data are smaller than the line width and are not shown in Figure 4.11.
The scattering curves show an systematic increase in intensity - as indicated by the arrow in Figure 4.11
a - when approaching the K-absorption edge at 7120 eV, thereby indicating a negative contrast of the
microgel.
Calculating the scattering intensity I(q) = |A(q)|2 = A(q) · A∗(q) and averaging over all orientations of
the colloid yields a to sum a of three contributions as described in detail in section 3.2.4.2. The calculated
values for the dispersion corrections were used to separate the form factor of the pure-resonant scattering
contribution of the Fe ions from the following equation which was already derived in section 3.2.4.2
(equation 3.27). Figure 4.11 b shows the total scattering and the the pure resonant term as extracted
with equation 3.27. The scattering cross section of the pure resonant term is about 3 order of magnitude
smaller when compared to the overall scattering cross section. The distribution of the protein was derived
from the the fit of the pure resonant scattering cross section. In particular, the curve was fitted in the range
47
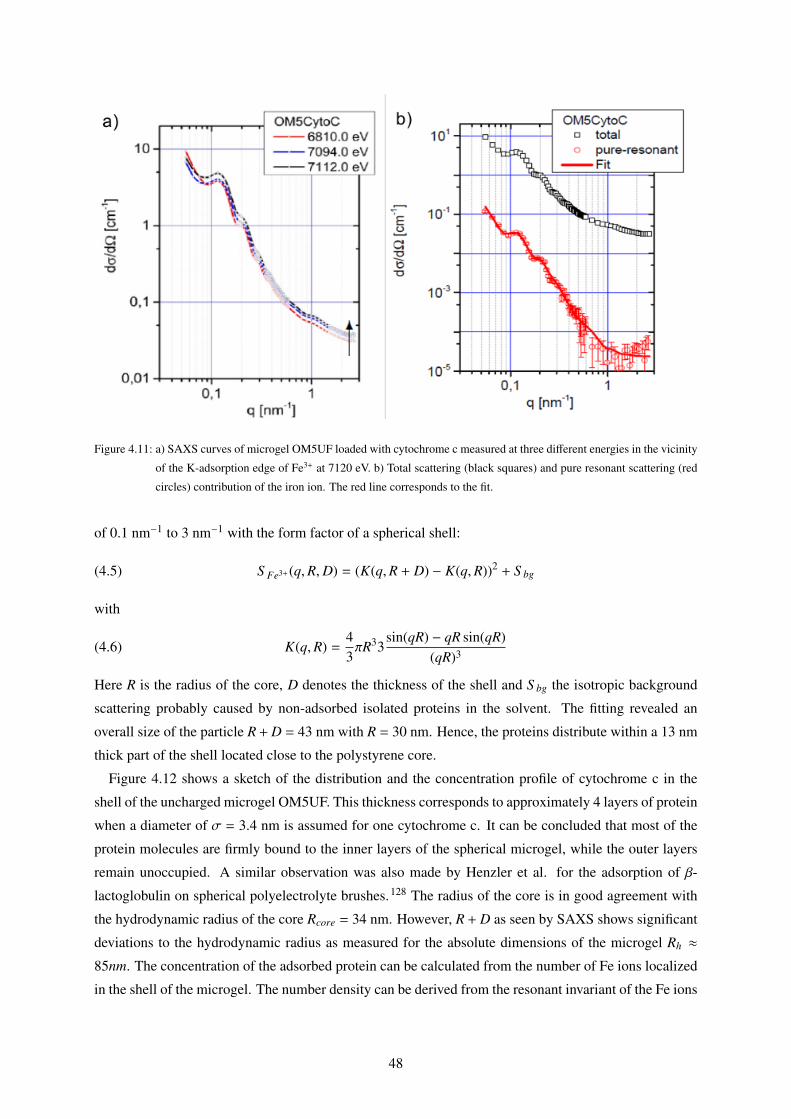
Figure 4.11: a) SAXS curves of microgel OM5UF loaded with cytochrome c measured at three different energies in the vicinity
of the K-adsorption edge of Fe3+ at 7120 eV. b) Total scattering (black squares) and pure resonant scattering (red
circles) contribution of the iron ion. The red line corresponds to the fit.
of 0.1 nm−1 to 3 nm−1 with the form factor of a spherical shell:
(4.5) S Fe3+(q,R,D) = (K(q,R + D) − K(q,R))2 + S bg
with
(4.6) K(q,R) =43πR33
sin(qR) − qR sin(qR)(qR)3
Here R is the radius of the core, D denotes the thickness of the shell and S bg the isotropic background
scattering probably caused by non-adsorbed isolated proteins in the solvent. The fitting revealed an
overall size of the particle R+D = 43 nm with R = 30 nm. Hence, the proteins distribute within a 13 nm
thick part of the shell located close to the polystyrene core.
Figure 4.12 shows a sketch of the distribution and the concentration profile of cytochrome c in the
shell of the uncharged microgel OM5UF. This thickness corresponds to approximately 4 layers of protein
when a diameter of σ = 3.4 nm is assumed for one cytochrome c. It can be concluded that most of the
protein molecules are firmly bound to the inner layers of the spherical microgel, while the outer layers
remain unoccupied. A similar observation was also made by Henzler et al. for the adsorption of β-
lactoglobulin on spherical polyelectrolyte brushes.128 The radius of the core is in good agreement with
the hydrodynamic radius of the core Rcore = 34 nm. However, R + D as seen by SAXS shows significant
deviations to the hydrodynamic radius as measured for the absolute dimensions of the microgel Rh ≈85nm. The concentration of the adsorbed protein can be calculated from the number of Fe ions localized
in the shell of the microgel. The number density can be derived from the resonant invariant of the Fe ions
48
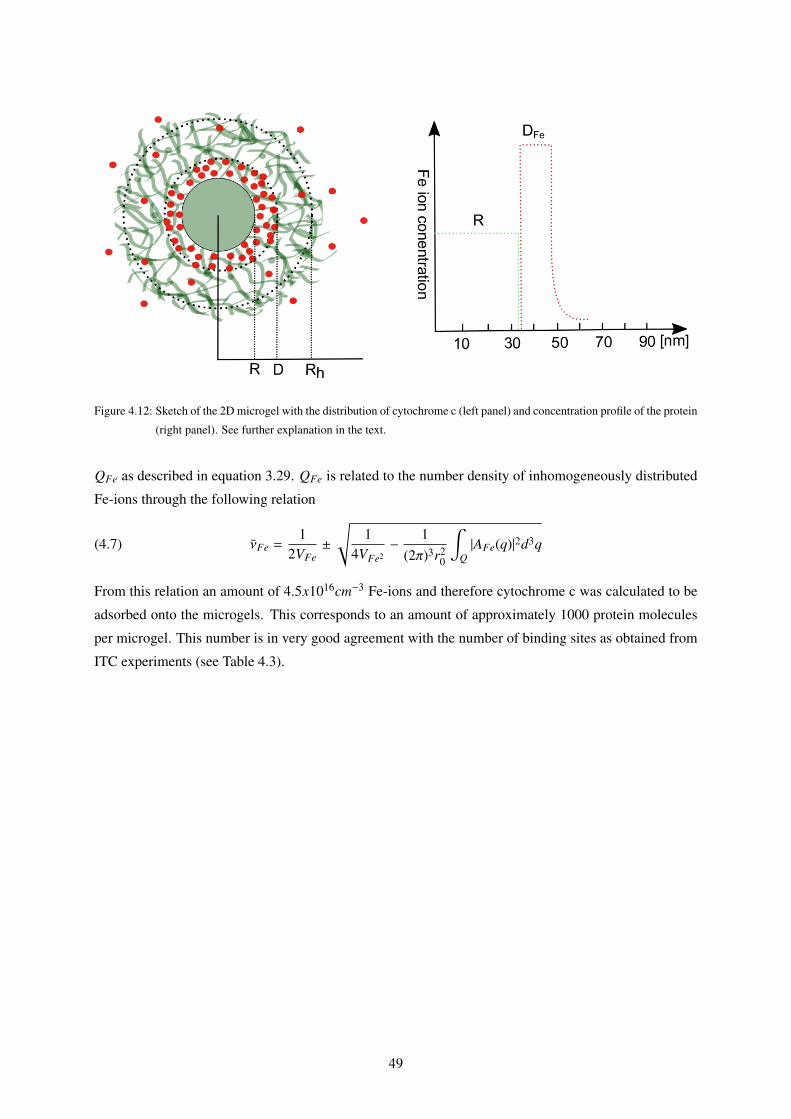
Figure 4.12: Sketch of the 2D microgel with the distribution of cytochrome c (left panel) and concentration profile of the protein
(right panel). See further explanation in the text.
QFe as described in equation 3.29. QFe is related to the number density of inhomogeneously distributed
Fe-ions through the following relation
(4.7) νFe =1
2VFe±
√1
4VFe2− 1
(2π)3r20
∫Q|AFe(q)|2d3q
From this relation an amount of 4.5x1016cm−3 Fe-ions and therefore cytochrome c was calculated to be
adsorbed onto the microgels. This corresponds to an amount of approximately 1000 protein molecules
per microgel. This number is in very good agreement with the number of binding sites as obtained from
ITC experiments (see Table 4.3).
49

4.4 Adsorption of Lysozyme as measured by AFM
In the following section the results of the AFM measurements are summarized. The AFM was operated in
the tapping mode. The microgel OM6UF was immobilized on a silicon surface by submerging the wafer
in a diluted microgel solution and evaporating the liquid film. Figure 4.13 a and b shows the height or
topography profile of microgel OM6UF and OM6UF loaded with lysozyme respectively. Obviously, the
topography image is neither able to resolve the core-shell structure nor to discriminate the size differences
which are induced by protein adsorption. By comparing these values of approximately 250 nm with DLS
data, one can conclude that the dried microgels on surfaces are strongly collapsed. In case of the unloaded
Figure 4.13: AFM images of a) 0.005% OM6UF microgel dried on a silicon wafer and b) 0.005% OM6UF microgel loaded
with 0.025 mg/ml lysozyme (molar ratio x = 200.000) dried on a silicon wafer; c) and d) corresponding phase of
a) and b), respectively. The green circles indicate the lateral extension of the microgel.
OM6UF (Figure 4.13 a) the array can be best described as periodic loosely packed microgel array, which
is in good agreement with the results on uncharged poly(NIPAM) microgels published by Horecha et
al.151 In contrast, the protein loaded OM6UF (Figure 4.13 b) seems to assemble in a less ordered array
probably caused by a change in repulsive forces. In Figure 4.13 c and d the AFM phase is shown.
Imaging the phase in AFM is a powerful tool that is sensitive to surface stiffness/softness and adhesion
50

between the tip and surface. It allows chemical mapping of surfaces based on these material differences.
For both microgels the protein free and the protein loaded a strong phase contrast between the shell, the
core and surrounding substrate is observed. There is also a significant phase contrast between the loaded
and unloaded shell indicating a strong change in the stiffness/softness. It was already concluded from
DLS data that the shell of the microgel shrinks upon protein adsorption leading to a more compact and
stiffer structure. However, these measurements were done in air and a qualitative interpretation of these
data remains ambiguous.
Figure 4.14: AFM images of a) 0.005% OM6UF microgel in 10 mM MOPS at pH = 7.2 immobilized on a poly-lysine coated
silicon wafer and b) 0.005% OM6UF microgel loaded with 0.025 mg/ml lysozyme (molar ratio x = 200.000) in
10 mM MOPS at pH = 7.2 immobilized on a poly-lysine coated silicon wafer; c) and d) corresponding elastic
modulus (DMT).
Hence, AFM measurements in liquid were performed and the samples were rinsed in situ in the AFM
fluid sample holder. The microgels will not immobilize on the surface by evaporation and were attached
by electrostatic interactions. For this reason the silicon wafer was functionalized with APTES and Poly-
L-Lysine (PLL). PLL is a polyelectrolyte and at pH = 7.2 is highly positively charged. It was found
that PLL leads to a more firmly attachment of the negatively charged microgels. Figure 4.14 a and
b shows the topography images of pure OM6UF and the protein loaded OM6UF, respectively. The
51
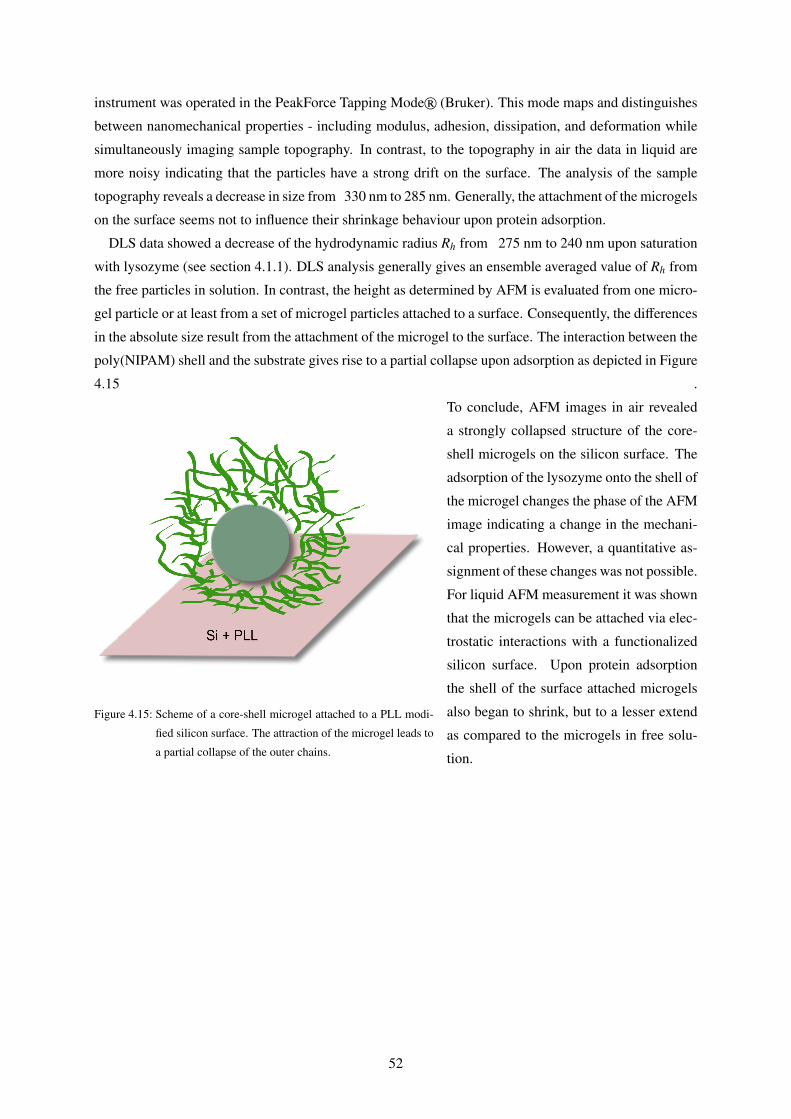
instrument was operated in the PeakForce Tapping Moder (Bruker). This mode maps and distinguishes
between nanomechanical properties - including modulus, adhesion, dissipation, and deformation while
simultaneously imaging sample topography. In contrast, to the topography in air the data in liquid are
more noisy indicating that the particles have a strong drift on the surface. The analysis of the sample
topography reveals a decrease in size from 330 nm to 285 nm. Generally, the attachment of the microgels
on the surface seems not to influence their shrinkage behaviour upon protein adsorption.
DLS data showed a decrease of the hydrodynamic radius Rh from 275 nm to 240 nm upon saturation
with lysozyme (see section 4.1.1). DLS analysis generally gives an ensemble averaged value of Rh from
the free particles in solution. In contrast, the height as determined by AFM is evaluated from one micro-
gel particle or at least from a set of microgel particles attached to a surface. Consequently, the differences
in the absolute size result from the attachment of the microgel to the surface. The interaction between the
poly(NIPAM) shell and the substrate gives rise to a partial collapse upon adsorption as depicted in Figure
4.15 .
Figure 4.15: Scheme of a core-shell microgel attached to a PLL modi-
fied silicon surface. The attraction of the microgel leads to
a partial collapse of the outer chains.
To conclude, AFM images in air revealed
a strongly collapsed structure of the core-
shell microgels on the silicon surface. The
adsorption of the lysozyme onto the shell of
the microgel changes the phase of the AFM
image indicating a change in the mechani-
cal properties. However, a quantitative as-
signment of these changes was not possible.
For liquid AFM measurement it was shown
that the microgels can be attached via elec-
trostatic interactions with a functionalized
silicon surface. Upon protein adsorption
the shell of the surface attached microgels
also began to shrink, but to a lesser extend
as compared to the microgels in free solu-
tion.
52
5 Summary and Outlook
The focus of this thesis was a detailed investigation of protein adsorption onto weakly charged or un-
charged core-shell microgels consisting of a solid polystyrene core and a poly(NIPAM) shell. The di-
mensions of the microgels were ranging between 100 and 300 nm.
First, adsorption isotherms of the proteins papain, lysozyme, Rnase A, cytochrome c and glucosidase
were obtained by ITC. The use of ITC to characterize protein nanoparticle interactions was discussed
critically. It was demonstrated that the stability of the protein plays a crucial role for these type of mea-
surements. On the example of glucosidase it was shown that larger size proteins occurring as dimers and
oligomers can cause problems in the interpretation of the adsorption isotherms. Furthermore, the resid-
ual enthalpy ∆Hres was identified to explain the differences between the enthalpies ∆HITC and the Van’t
Hoff enthalpy ∆Hb. This residual enthalpy originates from protonation effect or conformational rear-
rangements of the protein during adsorption. More concretely, the binding enthalpy ∆Hb of cytochrome
c to a non-charged core-shell microgel was identified as endothermic, but was accompanied by strong
exothermic reaction during the adsorption process which indicates a conformational rearangement or
protonation step.
In all these cases the protein adsorption isotherms were first fitted using the Langmuir model to reveal
the thermodynamic parameters K, N and ∆H. However, it was shown that the Langmuir model is limited
to these three parameter and the analysis is not fully quantitative, although the right trends can be derived.
Thus, in a second step, the adsorption isotherms were analyzed with the CB-model. With the approach
is was possible to separate the contributions of electrostatic and non-electrostatic interactions to the total
binding energy and to discuss the binding isotherms on a more quantitative level. The binding model
is virtually free of fit parameters and is easily expandable to protein mixtures adsorbing on polymeric
surfaces. The only fit parameter is the intrinsic binding energy ∆G0 which can be obtained by fitting the
adsorption isotherm of the single type of protein. Using the CB-model it was possible to show that the
stronger binding of lysozyme compared to cytochrome c results from the higher intrinsic binding energy
of lysozyme.
In addition, the CB-model was able to predict the competitive adsorption from binary mixtures of
a labeled lysozyme - lysozymeFITC and the proteins papain, lysozyme, Rnase A and cytochrome c.
In the mixture lysozyme and lysozymeFITC it could be demonstrated that protein adsorption onto this
type of core-shell microgels is a reversible process. The predictive power of the cooperative binding
model contributes to important research areas in nano(bio)technology in which protein adsorptions play
a pivotal role.
Secondly, in this work the spatial distribution of cytochrome c in a core-shell microgel was elucidated
53
by anomalous X-Ray scattering. By measuring at three different energies close to the K-edge of the iron
ion it was possible to unveil the pure resonant scattering contribution. The scattering data revealed a core-
shell structure where the proteins are located within a 13 nm thick shell close to the core. Moreover, by
analyzing the invariant it was possible to quantify the amount of adsorbed protein. It was demonstrated
that this amount is in good agreement with the number of binding sites as obtained from ITC.
The third part of this thesis was devoted to the interaction of core-shell microgels with charged sur-
faces. It could be shown that the microgels form a periodic loosely packed 2D array. Protein adsorption
seems to change this order probably due to a change in repulsive forces between the particles. By ana-
lyzing the phase of the AFM signal it was possible to visualize the core-shell structure. Adsorption of
lysozyme leads to a significant phase contrast indicating a change in the stiffness of the microgel. For the
measurements in liquid the microgels were attached by electrostatic attractions with the poly-L-Lysine
layer. The height image revealed a structure in which the microgels are partially collapsed along the
contact area with the surface.
54

6 Materials and Methods
6.1 Materials
The initiator potassium peroxidisulfate (KPS), the monomers styrene, N-isopropylacrylamide (NIPAM),
acrylic acid, N,N-methylenebisacrylamide (BIS) and sodium dodecyl sulfate (SDS) were purchased from
Sigma Aldrich. Styrene is stabilized by tert-butyl catechol as an inhibitor to avoid an uncontrolled
polymeriaztion. Prior to the polymerization reaction with KPS the inhibitor was removed by flushing
through a column filled with an inhibitor remover (Sigma Aldrich). Acrylic acid was distilled in a rotary
evaporator under reduced pressure (1 mbar, 40-45 °C) in order to remove the hydroquinone stabilizer.
The cleaned styrene and acrylic acid were stored at -4° C. All other chemicals for the synthesis of
the core-shell microgel were used as received. The buffer was prepared using 10 mM 3-(N-morpholino)
propane sulfonic acid (MOPS) (Sigma Aldrich) and 2 mM sodium azide (NaN3)(Sigma Aldrich) to avoid
bacterial contamination. The pH was adjusted to 7.2 by dropwise addition of 1 M NaOH under stirring.
The ionic strength was adjusted by adding sodium chloride (NaCl). For the protein labeling experiments
fluorescein isothiocyanate (FITC) was bought from Serva. For the surface functionalizations Poly-L-
Lysine hydrobromide was purchased from Sigma Aldrich (LOT # SLBM7099V) and used as received.
3-Aminopropyltriethoxysilane (APTES) was ordered from Gelest, PA, USA (Lot # 3l-21874) and used
as received. Silicon wafers 100 orientation were purchased from Virginia Semiconducters,VA, USA.
6.2 Proteins
Lysozyme from chicken hen egg white, papain from carrica papaya, cytochrome c from bovine heart,
RNase A from bovine pancreas, and β-D-Glucosidase from almonds were purchased from Sigma and
dialyzed against the buffer used in the experiment.
6.3 Synthesis and Characterization of Core-Shell Microgels
6.3.1 Synthesis of the Polystyrene Cores
The synthesis of the polystyrene cores were carried out using a 2 L three-necked flask equipped with
stirrer, reflux condenser, and thermometer. In the first step styrene, NIPAM and the surfactant SDS were
dissolved in water and the mixture was stirred at 300 rpm. Subsequently, the mixture was degassed for 10
minutes with nitrogen and heated up to 80 °C. The reaction was started by injection of the radical initiator
KPS. The reaction was allowed to continue for 8 h under nitrogen atmosphere at 80 °C. Afterwards,
55

the viscous white suspension was cooled down to room temperature and filtered through glass wool
afterwards to remove possible aggregates. Table 6.1 shows the amount of educts and solvent used for
Table 6.1: Overview of the amount of educts used for the synthesis of the polystyrene cores.
PS1 PS2 PS3
m (styrene) [g] 200 30 30
m (NIPAM) [g] 10 1.5 1.63
m (SDS) [g] 1.83 0.45 0.1
m (KPS) [g] 0.392 (in 10 g H2O) 0.172 (in 5 g H2O) 0.3 (in 20 g 2O)
m (H2O)[g] 700 130 270
weight percentage (in % w/w) 14.7 10.46 5.96
Hydrodynamic radius Rcore [nm] 62.2±0.7 34 ±5 100 ±7
the synthesis of different polystyrene cores PS1, PS2 and PS3. The size of the cores was controlled by
changing the amount of surfactant. The core particles were purified by ultrafiltration against water for
approximately two weeks using a cellulose nitrate membrane (Schleicher and Schuell and Millipore)
with pore size of 50 nm. Using this technique, unreacted monomers, surfactant molecules and extra ions
can be removed from the particle dispersion. The purification process was monitored by measuring the
conductivity of the extruded serum until a conductivity similar as ultrapure water is reached (κ < 0.7
µ S/cm). Afterwards, the PS particles were removed and their weight percentage was determined (see
Table 6.1). The size of the PS particles was measured by dynamic light scattering using a Zetasizer (see
section 6.3.5). The hydrodynamic radii for the PS cores listed in Table 6.1 under Rcore.
6.3.2 Synthesis of the Shell
The seeded emulsion polymerisation of the core-shell microgels were done in a 2 L three-necked flask
equipped with a stirrer, reflux condenser and thermometer. The amounts of the educts used for the
synthesis of these particles are summarized in Table 6.2. The microgel NW15 has been synthesized in
a previous work.81 The seed latex, NIPAM, the cross-linker BIS, and water were added to the flask and
degassed by flushing with nitrogen. The mixture was heated to 80 °C under nitrogen atmosphere while
Table 6.2: Overview of the amount of educts used for the synthesis of the core-shell microgels.
NW15 OM5UF OM6UF
m (PS-core) [g] 131.2 of 14.73 wt-% PS1 47.8 of 10.46 wt-% PS2 167.7 of 5.96 wt-% PS3
m (H2O) [g] 592 175 90
m (KPS) [g] 0.504 (in 20.3 g H2O) 0.182 (in 10 g H2O) 0.226 (in 20 g H2O)
m (NIPAM) [g] 23.8 3.8 10
m (BIS) [g] 1.62 0.28 0.68
m (AAc) [g] 0.64 0.24 (in 10 g H2O) 0.64 (in 20 g H2O)
stirring at 200 rpm. Subsequently, acrylic acid was added via a syringe. In the last step the initiator was
added and the reaction was allowed to proceed for 5 h at the given temperature. Then the mixture was
56

cooled down to room temperature and filtered through glass wool. The microgels were purified in the
same way as the seed latex with ultrafiltration using a cellulose nitrate membrane with a pore size of 100
nm. The serum was replaced against millipore water for about 4 weeks until a conductivity of (κ < 1
µ S/cm) was reached. Afterwards, their weight percentage was determined and the molecular weight of
the microgels was calculated using following formula:
(6.1) Mw,microgel = (mcore + mshell)NA =ρcore
43πR
3h,core
wcoreNA
Here ρcore = 1.055·10−21 g/nm−3 denotes the density of the PS core and Rh,core denotes the hydrodynamic
radius of the PS core. The weight fraction wcore = wcore/wcore−shell can be calculated from the weight
percentage of the purified PS core and core-shell particles. In Table 6.3 the properties of the three
microgels NW15, OM5UF and OM6UF are summarized.
Table 6.3: Composition, size and molecular weight of the shell network of the microgels used for the protein adsorption studies.
microgel NIPAM
[mol-%]
BIS [mol-%] AAc [mol-%] wcore Mw [g/mol] Rah) [nm]
NW15 85 5 10 0.54 1.18 · 109
185±50.2
OM5UF 85 5 10 0.86 1.21 · 108 75 ±5
OM6UF 85 5 10 0.58 5.79 · 109 284 ±7Rh= Hydrodynamic radius as measured in millipore water after extensive ultrafiltration
6.3.3 Transmission Electron Microscopy (TEM)
TEM samples were prepared by putting approximately 5 µL of a 0.0025 wt% solution on a TEM copper
grid with carbon support film (200 mesh, Science Services, Munich, Germany). The carbon coated
copper grids have been pretreated by 10 seconds of glow discharge. The excess of liquid was blotted
with a filter paper after 2 minutes. The remaining liquid film on the TEM grid was dried at room
temperature for at least one hour. The specimen was inserted into sample holder (EM21010, JEOL
GmbH, Eching, Germany) and transferred to a JEOL JEM-2100 with a LaB6 cathode (JEOL GmbH,
Eching, Germany). The TEM was operated at an acceleration voltage of 200 kV. All images were
recorded digitally by a bottom-mounted 4k x 4k CMOS camera system (TemCam-F416, TVIPS, Gauting,
Germany) and processed with a digital imaging processing system (EM-Menu 4.0, TVIPS, Gauting,
Germany). Figure 6.1 shows the TEM images from the microgels NW15, OM5UF and OM6UF. The
TEM sample preparation requires drying of the microgels and the core-shell structure is not clearly
visible due to this process. Instead, the NIPAM shell collapses into a compact structure around the
core which leads to visible deviations from the spherical shape. The size of these particles is similar
to the size of the PS-cores as determined by DLS data. Unfortunately, microgel OM5UF shows higher
polydispersity and aggregation. This probably can be traced backed to the smaller size of the particles.
57

Figure 6.1: TEM images of core-shell microgels a) NW15, b) OM6UF and c) OM5UF. See further explanation in the text.
6.3.4 Conductometric and Potentiometric Titrations
Simultaneous conductometric and potentiometric measurements were performed using the 809 Titrando
system (Metrohm Ion analysis, Herisau, Switzerland) equipped with an external dosing device (807
Dosing Unit, Metrohm Ion analysis), a stirrer (801 Stirrer, Metrohm Ion analysis), pH electrode (pH 0-14,
Metrohm Ion analysis), and a conductivity module (856 Conductivity Module, Metrohm Ion analysis).
The Titrando system was controlled by the tiamo 2.0 software (Metrohm Ion analysis). For the titration
experiment, the microgel dispersion was diluted with water to a total concentration of 0.5%. Then, 20
mL of the microgel suspension were titrated with 0.01 M NaOH. The titrations were run in a thoroughly
cleaned 50 mL beaker fitted with the pH and the conductivity electrode. The NaOH was added to the
microgel suspension with a flow rate of 0.1 mL/min. This slow rate is necessary because the the longer
relaxation time which is required to attain the equilibrium between the aqueous and the microgel phase.
The potentiometric and conductometric titration curve of OM5UF and OM6UF are shown in Figure 6.2.
From the equivalent point the titration curves the amount of acrylic acid polymerised into the microgel
particles is determined. In addition, the dissociation degree αdiss of the carboxylic acid functional groups
can be calculated as a function of the amount of added NaOH and, thus, as a function of the pH according
to
(6.2) αdiss =[V]pH
[V]eq
where [V]pH and [V]eq is the volume of added NaOH at a given pH value and at the equivalent point,
respectively. To calculate the pKa value of the carboxylic acid functional groups as a function of the
dissociation degree, the following equation is used:
(6.3) pKa = pH − log(αdiss
1 − αdiss
)
6.3.5 Dynamic Light Scattering (DLS)
Dynamic light scattering (DLS) experiments were performed at a single angle (173°) using a Zetasizer
Nano ZS (Malvern Instruments). The instrument consists of a He-Ne-Laser at 633 nm wavelength and
58

0 5 104
5
6
7
8
9
10
11
12
potentiometric
V(NaOH) [ml]
pH
0,0
0,2
0,4
0,6
0,8
conductometric
b)
Conductivity [m
S cm
-1]
a)
0 5 10
6,5
7,0
7,5
8,0
8,5
9,0
9,5
10,0 potentiometric
V(NaOH) [ml]
pH
0,0
0,2
0,4
0,6
0,8
conductometric
Conductivity [m
S cm
-1]
Figure 6.2: Potentiometric and conductometric titrations of a) OM6UF in millipore water and b) OM5UF in millipore water
can be used for the analysis of particles with diameters ranging from 0.3 nm and 10 nm according to
the manufacturer’s instructions. Prior to each measurement the microgel suspensions were diluted to a
concentration of 0.01% w/w with MOPS buffer. In case of the protein loaded microgels stock solutions
at different molar ratios were prepared and diluted to the same concentration. In case of the polystyrene
cores the suspensions were diluted to a to a concentration of 0.01% w/w in millipore water. To prevent
contamination with dust all samples were filtered through a 1.2 µm polyethersulfone (PES) membrane.
Before starting the measurements, the samples were incubated at the desired temperature for 5 min to
attain thermal equilibration. Signals were correlated 10 ×10 s.
The DLS data were analyzed with the software provided by the manufacturer to evaluate the hy-
drodynamic radius. Particle fluctuations in the dynamic light scattering experiment are described by a
first-order auto-correlation function g1(q, τ), where q is the wave vector and τ is the decay time. For
monodispersed particles g1(q, τ) is a single exponential decay:
(6.4) g1(q, τ) = exp(−Γτ)
with Γ being the decay rate. The decay rate is related to Dt via
(6.5) Γ = Dtq2
Finally, the analysis of the hydrodynamic radius Rh is derived from the translational diffusion coefficient
Dt according to the Stokes-Einstein relation:
(6.6) ⟨D⟩ = kBT6πηRh
6.4 Isothermal Titration Calorimetry
ITC experiments were performed using a VP-ITC instrument (MicroCal, GE Healthcare, Freiburg, Ger-
many) equipped with a degassing unit. The instrument is controlled by the VPViewer software (Micro-
Cal). The instrument consists of a sample cell and a reference cell composed of HastelloyrAlloy C-276
59

which is a highly efficient thermal conductive material and is inert to many different solvents. The for-
mer one is usually filled with the nanoparticle suspension and the latter one is filled with ultrapure water.
Before each titration the two cells need to be equilibrated in such a way that the temperature difference
between the cells approaches zero and the applied reference power dP of the feedback system shows a
stable baseline.
The sample preparation occurred as follows: Prior before each measurement samples have been de-
gassed for 5 minutes at 1 K below the experimental temperature to avoid formation of air bubbles during
the ITC experiment. Then a fixed volume of 1.4 mL of the microgel suspension was filled into the sam-
ple cell and a volume of 280 µL buffer matched protein solution was soaked up in the syringe. For all
measurements the reference power was set to 10 µcal/sec and the stirring speed in the sample cell was
307 rpm. Then the protein solution was titrated successively into the sample cell and Q′ was evaluated
for each injection step. Afterward, the same protein solution was titrated into the pure buffer system to
account for the heat of dilution. After each experiment the sample cell and the syringe were cleaned thor-
oughly using surfactant, 15 vol-% hydrogen peroxide, ultrapure water and acetone successively. Table
6.4 summarizes the experimental conditions. The injection program was adjusted to obtain good quality
data near the inflection point of the isotherm. For all measurements listed in Table 6.4 the C-parameter
was in a reliable range (see section 3.2.1.
Table 6.4: Overview of ITC parameters used in the experiments
System Ionic strength
[mM]
T [K] c(protein)
[mM]
c(microgel)
[mM]
Injections
NW15 + lysozyme 7 298 0.695 8.47· 10−7 20×3 µL +
48×5 µL
NW15 + RNAse 7 298 1.0204 8.47· 10−7 40×2 µL +
44×5 µL
NW15 + Glucosidase 7, 17, 32 298 0.088 8.47· 10−7 20×3 µL +
40×6 µL
NW15 + papain 7 298 0.523 8.47· 10−7 69×4 µL
NW15 + cytochrome c 7, 17, 32 298 0.598 8.47· 10−7 20×3 µL +
48×5 µL
OM5UF + cytochrome c 7 293, 298, 303 0.598 8.26· 10−6 20×3 µL +
28×5 µL
OM6UF + lysozyme 7 298 0.695 1.73· 10−7 75×4 µL
6.5 Fluorescence Spectroscopy
6.5.1 Labeling with Fluorescein isothiocyanate
Because the coupling of an amine group to the fluorophore is most efficient at basic conditions, a amount
of 10 mg/ml Lysozyme (0.695 mM) is dissolved in 50 mM bicarbonate buffer at pH = 8.85. In the next
step an equimolar amount of FITC was added from a freshly prepared stock solution of 5 mg/ml FITC
60

in anhydrous DMSO. The solution was diluted to aliquots of 1 mg/ml lysozyme using the bicarbonate
buffer and shaken moderately for 1 h in an Eppendorf shaker. The protein was isolated via size exclusion
chromatography using a Sephadex G25 column (GE healthcare) equilibrated with 10 mM MOPS and 2
mM NaN3 at pH 7.2. By this means, excess FITC is removed from the reaction mixture and the labeled
protein is transferred in the desired buffer for further experiments. The collected fractions were analyzed
by UV-vis. Fractions showing a higher extinction than E278 ≥ 0.2 were unified and the degree of labeling
was calculated using following equation:
n(FITC)n(Protein)
=E495
ϵ495,FITC · cp(6.7)
with cp =E278 − E495CFϵ278,Protein
Figure 6.3a shows the UV-vis spectrum of the purified LysozymeFITC , where the signal at 278 nm is
originating from aromatic aminoacids and the signal at 495 nm can be traced back solely to the excitation
of the fluorescein moiety. E278 and E495 are the extinction values at both positions in the spectrum. The
values ϵ278,protein and ϵ495,FITC are the molar extinction coefficients of the protein and the unbound FITC
(37047 and 47106 M−1 cm−1, respectively). CF is a correction factor CF = E278/E495 = 0.43. All values
have been measured in 10 mM MOPS at pH 7.2 at 298 K. The labeling degree of LysozymeFITC was
calculated to ≈ 1, that means on average every protein molecule is assigned with exactly one fluorophore
molecule.
300 400 500 6000,0
0,2
0,4
0,6
0,8
0,0 1,0x10⁻⁶ 2,0x10⁻⁶ 3,0x10-60
1x10⁶
2x10⁶
3x10⁶
4x10⁶
5x10⁶
Inte
nsity
a.u
.
wavelength in nm
a)
Fluo
resc
ence
Inte
nsity
a.u
.
c LysozymeFITC [M]
b)
Figure 6.3: a) UV-vis spectrum of LysozymeFITC in 10 mM MOPS buffer at 298 K. The peak at 278 nm results from the
excitation of aromatic amino acids and the peak at 495 nm is the excitation wavelength λex of the fluorescein
moiety. b) Fluorescence emission intensity at λem = 518 nm of LysozymeFITC depending on the concentration of
the protein. Spectra were recorded in 10 mM MOPS buffer at pH = 7.2 at 293 K at the excitation wavelength λex =
495 nm.
Figure 6.3 b shows the calibration line of lysozymeFITC in 10 mM MOPS at pH = 7.2 and 298K. The
calibration is necessary to determine the amount of labelled protein adsorbed on the microgel.
61
6.5.1.1 Experimental Setup for a Binary Protein Mixture
Fluorescence spectra were recorded with a Fluoro-Max-3 spectrometer (JY-Horiba) at a slit width of
1.5 nm and an optical path length of 1 cm. In the first step the microgel was loaded to ≈ 60% with
lysozymeFITC . For this purpose a solution of 0.8 µM lysozymeFITC in 10 mM MOPS at pH = 7.2
was filled in an optical quartz cell and 2.4×10⁵ µM of buffer-matched microgel suspension was added
under moderate stirring. At the same time the fluorescence peak at 518 nm was monitored. Imme-
diately, after adding the microgel the fluorescence signal is quenched to a large extent, which means
that LysozymeFITC has penetrated the polymeric layer. In the next step the concentration of the second
competing protein was increased successively by multiple injections from a protein stock solution of
well-defined concentration. After each injection the system was allowed to equilibrate for 5 min. If a
second protein competes for binding sites, lysozymeFITC will be desorbed from the microgel and as a
consequence the fluorescence signal increases proportional to the number of liberated labelled proteins.
This effect can be used to quantify the number of bound lysozymeFITC as a function of a second com-
peting protein. In particular, the amount of adsorbed lysozymeFITC is simply the difference between the
total protein concentration ctotp and the concentration of non-adsorbed protein ci, which can be calculated
from the calibration line easily (intensity vs. protein concentration).
6.6 Atomic Force Microscopy
6.6.1 Substrate Preparation
Silicon wafers (1.5 mm×1.5 mm) were cleaned for 24 h by submersion in piranha etch (70% v/v sulfuric
acid 98% with 30% v/v hydrogen peroxide, 30% aqueous solution) at room temperature. Afterwards,
the wafers were rinsed extensively with Milli-Q water (Millipore Corp.) and ethanol and dried under
nitrogen airflow.
For the silanization the cleaned wafers were submerged in a 15% APTES solution in dry ethanol for
12 h. After washing the wafers alternately with ethanol and Milli-Q water, they were centrifuged at 600
rpm for ≈ 2-3 minutes in order to remove the residual liquid film and to facilitate the formation of a
uniform APTES layer. In the last step the wafers were dried in an oven preset to 125° C.
Poly-L-lysine hydrobromide (PLL) coated silicon wafers were fabricated by dip coating as described
previously by Hasmi et al.110 The clean wafers were submerged with a buffered solution of 10 mg/ml
PLL (10 mM MOPS, 2 mM NaN3 and 100 mM NaCl at pH = 7.2) and the solution was allowed to soak
for 2 h. Then the wafers were thoroughly rinsed with Milli-Q water and dried under nitrogen airflow.
Wafers containing the microgel particles were prepared by placing one drop of ≈ 1 µL of a 0.005 %
w/w microgel solution on the APTES and PLL functionalized wafers. The wafers were then dried under
room temperature until the drop evaporates and a thin uniform white film emerges on the surface. In
the last step the wafers were washed again with Milli-Q water and dried under nitrogen airflow. For
measurements in liquid, a drop of the same microgel solution was dipped onto the wafer and placed in
the AFM liquid cell in situ.
62
6.6.2 AFM Measurements and Analysis
Atomic Force Microscopy was used as an additional method to confirm the morphology of the core-
shell microgel on a surface. Images were recorded under room temperature with a multimode AFM
microscope (Bruker Nanoscope V Multimode®8) using tapping mode in air and silicon nitride cantilever
(kF = 0.350 N/m, f0 = 65 kHz, Rtip 20 nm, Bruker model DNP-10). Mechanical properties were
obtained using Peak Force mode in liquid. Raw data of cantilever deflection vs. piezoelectric driver
displacement was converted to force vs. distance by defining the deflection sensitivity from a clean bare
silica surface in aqueous solution without microgels present. The images and height profiles have been
analyzed with NanoScope Analysis Version 1.50 (Bruker).
6.7 SAXS
SAXS measurements were done on a SAXSess mc2 instrument (Anton Paar, Austria). The instrument
was equipped with a Cu Kα slit-collimated radiation source which was operated at 40 kV. A fluid flow
cell with 1 mm quartz capillary was used for all samples. Samples of 20, 30, 40 and 50 mg/ml glucosidase
in 10 mM MOPS and 2 mM NaN3 at pH = 7.2 were prepared. The ionic strength was adjusted to I = 107
mM with NaCl. Data reduction and desmearing was done using the Saxsquant 3.50 software.
6.8 ASAXS
6.8.1 Sample Preparation
Following samples were prepared for the ASAXS measurements: i) 1%(w/w) microgel ii) 1%(w/w)
microgel loaded with 5mg mL−1 cytochrome c corresponding to a saturated system at a molar ratio of
approximately 4.800 and iii) 5mg mL−1 cytochrome c. All samples were prepared in 10mm MOPS, 2
mM NaN3 at pH = 7.2 and temperated to 293K.
6.8.2 Technical Details
ASAXS measurements were performed using the 7T-MPW-SAXS beam line at BESSY II58 within an
energy range of 300 eV in the vicinity of the K-absorption edge of Fe at 7112 eV. With sample detector
distances of 1000 mm and 3344 mm a q-range from 0.06 nm−1 to 3 nm−1 was covered, which corresponds
to structural sizes between 2 nm and 100 nm. All data sets have been corrected for background scattering,
detector sensitivity, detector dead time and dark current. After normalization to the primary flux the
scattering curves are calibrated into macroscopic scattering cross sections in units of cross section per
unit volume [cm2=cm3]=[cm−1].
63
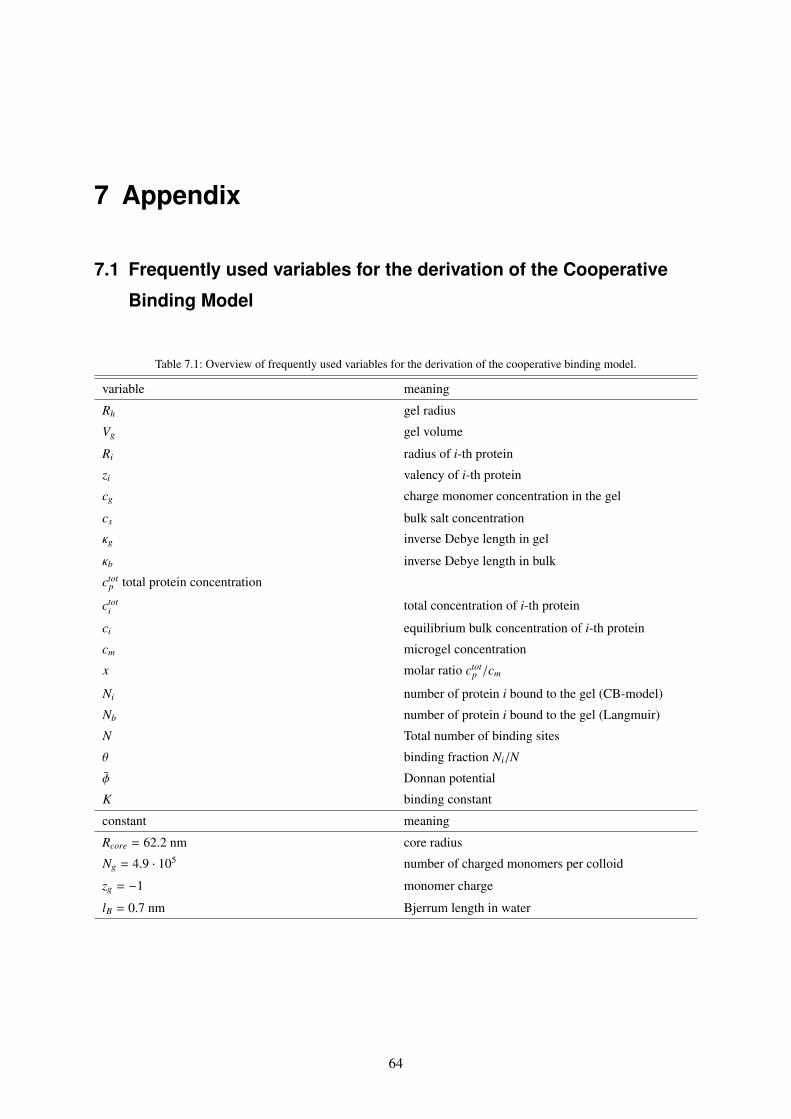
7 Appendix
7.1 Frequently used variables for the derivation of the Cooperative
Binding Model
Table 7.1: Overview of frequently used variables for the derivation of the cooperative binding model.
variable meaning
Rh gel radius
Vg gel volume
Ri radius of i-th protein
zi valency of i-th protein
cg charge monomer concentration in the gel
cs bulk salt concentration
κg inverse Debye length in gel
κb inverse Debye length in bulk
ctotp total protein concentration
ctoti total concentration of i-th protein
ci equilibrium bulk concentration of i-th protein
cm microgel concentration
x molar ratio ctotp /cm
Ni number of protein i bound to the gel (CB-model)
Nb number of protein i bound to the gel (Langmuir)
N Total number of binding sites
θ binding fraction Ni/N
ϕ Donnan potential
K binding constant
constant meaning
Rcore = 62.2 nm core radius
Ng = 4.9 · 105 number of charged monomers per colloid
zg = −1 monomer charge
lB = 0.7 nm Bjerrum length in water
64

8 Bibliography
[1] Xu, X.; ; Lenhoff, A. M. A Predictive Approach to Correlating Protein Adsorption Isotherms on
Ion-Exchange Media. The Journal of Physical Chemistry B 2008, 112, 1028–1040.
[2] Almeida, J. R.; Vasconcelos, V. Natural antifouling compounds: Effectiveness in preventing in-
vertebrate settlement and adhesion. Biotechnology Advances 2015, 33, 343 – 357.
[3] Gittens, J. E.; Smith, T. J.; Suleiman, R.; Akid, R. Current and emerging environmentally-friendly
systems for fouling control in the marine environment. Biotechnology Advances 2013, 31, 1738 –
1753.
[4] Nurioglu, A. G.; Esteves, A. C. C.; de With, G. Non-toxic, non-biocide-release antifouling coat-
ings based on molecular structure design for marine applications. J. Mater. Chem. B 2015, 3,
6547–6570.
[5] Kottke-Marchant, K.; Anderson, J.; Umemura, Y.; Marchant, R. Effect of albumin coating on the
in vitro blood compatibility of Dacron arterial prostheses. Biomaterials 1989, 10, 147—155.
[6] Kossovsky, N.; Millett, D.; Juma, S.; Little, N.; Briggs, P. C.; Raz, S.; Berg, E. In vivo char-
acterization of the inflammatory properties of poly(tetrafluoroethylene) particulates. Journal of
Biomedical Materials Research 1991, 25, 1287–1301.
[7] W, C. R. Surface-mediated defense reactions: the plasma contact activation system. J Clin Invest
1984, 73, 1249–1253.
[8] B, J.; G, P.; G, P. Mechanisms and clinical relevance of bacterial adhesion to polymers. J Biomater
Appl. 1987, 2, 520–543.
[9] Hu, W. J.; Eaton, J. W.; Ugarova, T. P.; Tang, L. Molecular basis of biomaterial-mediated foreign
body reactions. Blood 2001, 98, 1231–8.
[10] Hucknall, A.; Kim, D.-H.; Rangarajan, S.; Hill, R. T.; Reichert, W. M.; Chilkoti, A. Simple Fabri-
cation of Antibody Microarrays on Nonfouling Polymer Brushes with Femtomolar Sensitivity for
Protein Analytes in Serum and Blood. Advanced Materials 2009, 21, 1968–1971.
[11] Vroman, L. Effect of Adsorbed Proteins on the Wettability of Hydrophilic and Hydrophobic
Solids. Nature 1962, 196, 476–477.
65
[12] Vroman, L.; Adams, A. L. Findings with the recording ellipsometer suggesting rapid exchange of
specific plasma proteins at liquid/solid interfaces. Surface Science 1969, 16, 438–446.
[13] Vroman, L.; Adams, A. L. Identification of rapid changes at plasma solid interfaces. Journal of
Biomedical Materials Research 1969, 3, 43–67.
[14] Vroman, L.; Adams, A.; Fischer, G.; Munoz, P. Interaction of high molecular weight kininogen,
factor XII, and fibrinogen in plasma at interfaces. Blood 1980, 55, 156–159.
[15] Holmberg, M.; Hou, X. Competitive Protein Adsorption of Albumin and Immunoglobulin G from
Human Serum onto Polymer Surfaces. Langmuir 2009, 26, 938–942.
[16] Ortega-Vinuesa, J. L.; Hidalgo-Alvarez, R. Sequential adsorption of F(ab)2 and BSA on negatively
and positively charged polystyrene latexes. Biotechnology and Bioengineering 1995, 47, 633–639.
[17] Norde, W.; Giacomelli, C. E. BSA structural changes during homomolecular exchange between
the adsorbed and the dissolved states. Journal of Biotechnology 2000, 79, 259 – 268.
[18] Norde, W.; Giacomelli, C. E. Conformational changes in proteins at interfaces: From solution to
the interface, and back. Macromolecular Symposia 1999, 145, 125–136.
[19] Green, R. J.; Davies, M. C.; Roberts, C. J.; Tendler, S. J. B. Competitive protein adsorption as
observed by surface plasmon resonance. Biomaterials 1999, 20, 385–391.
[20] Ying, P.; Yu, Y.; Jin, G.; Tao, Z. Competitive protein adsorption studied with atomic force mi-
croscopy and imaging ellipsometry. Colloids and Surfaces B: Biointerfaces 2003, 32, 1–10.
[21] Gun’ko, V. M.; Mikhalovska, L. I.; Tomlins, P. E.; Mikhalovsky, S. V. Competitive adsorption
of macromolecules and real-time dynamics of Vroman-like effects. Physical Chemistry Chemical
Physics 2011, 13, 4476–4485.
[22] Lassen, B.; Malmsten, M. Competitive Protein Adsorption at Plasma Polymer Surfaces. Journal
of Colloid and Interface Science 1997, 186, 9–16.
[23] Huang, R.; Carney, R. R.; Ikuma, K.; Stellacci, F.; Lau, B. L. T. Effects of Surface Compositional
and Structural Heterogeneity on Nanoparticle-Protein Interactions: Different Protein Configura-
tions. ACS NANO 2014, 8, 5402–5412.
[24] Huang, Y.; Lai, X.; Qian, W.; Tang, Z.; Zhong, Y. Competitive protein adsorption on biomaterial
surface studied with reflectometric interference spectroscopy. Acta Biomaterialia 2010, 6, 2083–
2090.
[25] Riedel, T.; Riedelova-Reicheltova, Z.; Majek, P.; Rodriguez-Emmenegger, C.; Houska, M.;
Dyr, J. E.; Brynda, E. Complete Identification of Proteins Responsible for Human Blood Plasma
Fouling on Poly(ethylene glycol)-Based Surfaces. Langmuir 2013, 29, 3388–3397.
66
[26] Mohr, K.; Sommer, M.; Baier, G.; Schöttler, S.; Okwieka, P.; Tenzer, S.; Katharina, L.; Mailän-
der, V.; Schmidt, M.; Georg Meyer, R. Aggregation Behavior of Polystyrene-Nanoparticles in
Human Blood Serum and its Impact on the in vivo Distribution in Mice. Journal of Nanomedicine
& Nanotechnology 2014,
[27] Tenzer, S.; Docter, D.; Kuharev, J.; Musyanovych, A.; Fetz, V.; Hecht, R.; Schlenk, F.; Fischer, D.;
Kiouptsi, K.; Reinhardt, C.; Landfester, K.; Schild, H.; Maskos, M.; Knauer, S. K.; Stauber, R. H.
Rapid formation of plasma protein corona critically affects nanoparticle pathophysiology. Nat
Nano 2013, 8, 772–781.
[28] Aggarwal, P.; Hall, J. B.; McLeland, C. B.; Dobrovolskaia, M. A.; McNeil, S. E. Nanoparticle
interaction with plasma proteins as it relates to particle biodistribution, biocompatibility and ther-
apeutic efficacy. Adv Drug Deliv Rev 2009, 61, 428–37.
[29] Mahmoudi, M.; Lynch, I.; Ejtehadi, M. R.; Monopoli, M. P.; Bombelli, F. B.; Laurent, S. Protein-
Nanoparticle Interactions: Opportunities and Challenges. Chemical Reviews 2011, 111, 5610–
5637.
[30] Monopoli, M. P.; Aberg, C.; Salvati, A.; Dawson, K. A. Biomolecular coronas provide the biolog-
ical identity of nanosized materials. Nat Nano 2012, 7, 779–786.
[31] Walkey, C. D.; Chan, W. C. Understanding and controlling the interaction of nanomaterials with
proteins in a physiological environment. Chem Soc Rev 2012, 41, 2780–99.
[32] Walkey, C. D.; Olsen, J. B.; Guo, H.; Emili, A.; Chan, W. C. W. Nanoparticle Size and Surface
Chemistry Determine Serum Protein Adsorption and Macrophage Uptake. Journal of the Ameri-
can Chemical Society 2012, 134, 2139–2147.
[33] Walczyk, D.; Bombelli, F. B.; Monopoli, M. P.; Lynch, I.; Dawson, K. A. What the Cell Sees in
Bionanoscience. Journal of the American Chemical Society 2010, 132, 5761–5768.
[34] Wei, Q.; Becherer, T.; Angioletti-Uberti, S.; Dzubiella, J.; Wischke, C.; Neffe, A. T.; Lendlein, A.;
Ballauff, M.; Haag, R. Protein interactions with polymer coatings and biomaterials. Angew Chem
Int Ed Engl 2014, 53, 8004–31.
[35] Winzen, S.; Schoettler, S.; Baier, G.; Rosenauer, C.; Mailaender, V.; Landfester, K.; Mohr, K.
Complementary analysis of the hard and soft protein corona: sample preparation critically effects
corona composition. Nanoscale 2015, 7, 2992–3001.
[36] Milani, S.; Bombelli, F. B.; Pitek, A. S.; Dawson, K. A.; Rädler, J. Reversible versus Irreversible
Binding of Transferrin to Polystyrene Nanoparticles: Soft and Hard Corona. ACS Nano 2012, 6,
2532–2541.
[37] Rocker, C.; Potzl, M.; Zhang, F.; Parak, W. J.; Nienhaus, G. U. A quantitative fluorescence study
of protein monolayer formation on colloidal nanoparticles. Nat Nano 2009, 4, 577–580.
67

[38] Maffre, P.; Nienhaus, K.; Amin, F.; Parak, W. J.; Nienhaus, G. U. Characterization of protein ad-
sorption onto FePt nanoparticles using dual-focus fluorescence correlation spectroscopy. Beilstein
Journal of Nanotechnology 2011, 2, 374–383.
[39] Deng, Z. J.; Liang, M.; Monteiro, M.; Toth, I.; Minchin, R. F. Nanoparticle-induced unfolding of
fibrinogen promotes Mac-1 receptor activation and inflammation. Nat Nano 2011, 6, 39–44.
[40] Hoshino, Y.; Koide, H.; Furuya, K.; Haberaecker, W. W.; Lee, S.-H.; Kodama, T.; Kanazawa, H.;
Oku, N.; Shea, K. J. The rational design of a synthetic polymer nanoparticle that neutralizes a
toxic peptide in vivo. Proceedings of the National Academy of Sciences 2012, 109, 33–38.
[41] Salvati, A.; Pitek, A. S.; Monopoli, M. P.; Prapainop, K.; Bombelli, F. B.; Hristov, D. R.;
Kelly, P. M.; Aberg, C.; Mahon, E.; Dawson, K. A. Transferrin-functionalized nanoparticles lose
their targeting capabilities when a biomolecule corona adsorbs on the surface. Nat Nano 2013, 8,
137–143.
[42] Karakoti, A. S.; Das, S.; Thevuthasan, S.; Seal, S. PEGylated Inorganic Nanoparticles. Ange-
wandte Chemie International Edition 2011, 50, 1980–1994.
[43] Jokerst, J. V.; Lobovkina, T.; Zare, R. N.; Gambhir, S. S. Nanoparticle PEGylation for Imaging
and Therapy. Nanomedicine 2011, 6, 715–728.
[44] Hamad, I.; Al-Hanbali, O.; Hunter, A. C.; Rutt, K. J.; Andresen, T. L.; Moghimi, S. M.
Distinct Polymer Architecture Mediates Switching of Complement Activation Pathways at the
Nanosphere-Serum Interface: Implications for Stealth Nanoparticle Engineering. ACS Nano 2010,
4, 6629–6638.
[45] Yang, W.; Zhang, L.; Wang, S.; White, A. D.; Jiang, S. Functionalizable and ultra stable nanopar-
ticles coated with zwitterionic poly(carboxybetaine) in undiluted blood serum. Biomaterials 2009,
30, 5617 – 5621.
[46] Rosen, J. E.; Gu, F. X. Surface Functionalization of Silica Nanoparticles with Cysteine: A Low-
Fouling Zwitterionic Surface. Langmuir 2011, 27, 10507–10513.
[47] Moyano, D. F.; Saha, K.; Prakash, G.; Yan, B.; Kong, H.; Yazdani, M.; Rotello, V. M. Fabrication
of Corona-Free Nanoparticles with Tunable Hydrophobicity. ACS Nano 2014, 8, 6748–6755.
[48] Jackson, M. B. Molecular and Cellular Biophysics; Cambridge University Press: New York, 2006.
[49] Latour, R. A. The langmuir isotherm: A commonly applied but misleading approach for the anal-
ysis of protein adsorption behavior. Journal of Biomedical Materials Research Part A 2015, 103,
949–958.
[50] LeDuc, C. A.; Vroman, L.; Leonard, E. F. A Mathematical Model for the Vroman Effect. Indus-
trial & Engineering Chemistry Research 1995, 34, 3488–3495.
68

[51] Dell’Orco, D.; Lundqvist, M.; Oslakovic, C.; Cedervall, T.; Linse, S. Modeling the Time Evolution
of the Nanoparticle-Protein Corona in a Body Fluid. PLoS ONE 2010, 5, e10949.
[52] Dell’Orco, D.; Lundqvist, M.; Linse, S.; Cedervall, T. Mathematical modeling of the protein
corona: implications for nanoparticulate delivery systems. Nanomedicine (Lond) 2014, 9, 851–8.
[53] Brooks, C. A.; Cramer, S. M. Steric mass-action ion exchange: Displacement profiles and induced
salt gradients. AIChE Journal 1992, 38, 1969–1978.
[54] Noh, H.; Vogler, E. A. Volumetric interpretation of protein adsorption: Competition from mixtures
and the Vroman effect. Biomaterials 2007, 28, 405–422.
[55] Vogler, E. A. Protein adsorption in three dimensions. Biomaterials 2012, 33, 1201 – 1237.
[56] Su, X.-L.; Sun, Y. Thermodynamic model for nonlinear electrostatic adsorption equilibrium of
protein. AIChE Journal 2006, 52, 2921–2930.
[57] Fang, F.; Szleifer, I. Competitive adsorption in model charged protein mixtures: Equilibrium
isotherms and kinetics behavior. The Journal of Chemical Physics 2003, 119, 1053–1065.
[58] Vilaseca, P.; Dawson, K. A.; Franzese, G. Understanding and modulating the competitive surface-
adsorption of proteins through coarse-grained molecular dynamics simulations. Soft Matter 2013,
9, 6978–6985.
[59] Yigit, C.; Welsch, N.; Ballauff, M.; Dzubiella, J. Protein sorption to charged microgels: Charac-
terizing binding isotherms and driving forces. Langmuir 2012, 28, 14373–85.
[60] Tanaka, T.; Fillmore, D. J. Kinetics of swelling of gels. The Journal of Chemical Physics 1979,
70, 1214–1218.
[61] Hendrickson, G. R.; Smith, M. H.; South, A. B.; Lyon, L. A. Design of Multiresponsive Hydrogel
Particles and Assemblies. Advanced Functional Materials 2010, 20, 1697–1712.
[62] Hendrickson, G. R.; Andrew Lyon, L. Bioresponsive hydrogels for sensing applications. Soft Mat-
ter 2009, 5, 29–35.
[63] Saxena, S.; Hansen, C. E.; Lyon, L. A. Microgel Mechanics in Biomaterial Design. Accounts of
Chemical Research 2014, 47, 2426–2434.
[64] Kratz, K.; Hellweg, T.; Eimer, W. Structural changes in PNIPAM microgel particles as seen by
SANS, DLS, and EM techniques. Polymer 2001, 42, 6631 – 6639.
[65] Hoare, T.; Pelton, R. Highly pH and Temperature Responsive Microgels Functionalized with Viny-
lacetic Acid. Macromolecules 2004, 37, 2544–2550.
69
[66] Sershen, S. R.; Westcott, S. L.; Halas, N. J.; West, J. L. Temperature-sensitive polymeric nanoshell
composites for photothermally modulated drug delivery. Journal of Biomedical Materials Re-
search 2000, 51, 293–298.
[67] Duracher, D.; Sauzedde, F.; Elaassari, A.; Pichot, C.; Nabzar, L. Cationic amino-containing N-
isopropyl- acrylamide-styrene copolymer particles: 2-surface and colloidal characteristics. Col-
loid and Polymer Science 1998, 276, 920–929.
[68] Welsch, N.; Becker, A. L.; Dzubiella, J.; Ballauff, M. Core-shell microgels as smart carriers for
enzymes. Soft Matter 2012, 8, 1428–1436.
[69] Kubota, K.; Fujishige, S.; Ando, I. Single-chain transition of poly(N-isopropylacrylamide) in wa-
ter. The Journal of Physical Chemistry 1990, 94, 5154–5158.
[70] Heskins, M.; Guillet, J. E. Solution Properties of Poly(N-isopropylacrylamide). Journal of Macro-
molecular Science: Part A - Chemistry 1968, 2, 1441–1455.
[71] Ballauff, M.; Lu, Y. Smart nanoparticles: Preparation, characterization and applications. Polymer
2007, 48, 1815 – 1823.
[72] Jones, C. D.; Lyon, L. A. Synthesis and characterization of multiresponsive core-shell microgels.
Macromolecules 2000, 33, 8301–8306.
[73] Crassous, J. J.; Wittemann, A.; Siebenbürger, M.; Schrinner, M.; Drechsler, M.; Ballauff, M.
Direct imaging of temperature-sensitive core-shell latexes by cryogenic transmission electron mi-
croscopy. Colloid and Polymer Science 2008, 286, 805–812.
[74] Crassous, J. J.; Rochette, C. N.; Wittemann, A.; Schrinner, M.; Ballauff, M.; Drechsler, M. Quanti-
tative Analysis of Polymer Colloids by Cryo-Transmission Electron Microscopy. Langmuir 2009,
25, 7862–7871.
[75] Dingenouts, N.; Norhausen, C.; Ballauff, M. Observation of the Volume Transition in Thermosen-
sitive Core-Shell Latex Particles by Small-Angle X-ray Scattering. Macromolecules 1998, 31,
8912–8917.
[76] N. Dingenouts, .; M. Patel, .; S. Rosenfeldt, .; D. Pontoni, .; T. Narayanan, .; ; M. Ballauff*, .
Counterion Distribution around a Spherical Polyelectrolyte Brush Probed by Anomalous Small-
Angle X-ray Scattering. Macromolecules 2004, 37, 8152–8159.
[77] Dingenouts, N.; Seelenmeyer, S.; Deike, I.; Rosenfeldt, S.; Ballauff, M.; Lindner, P.; Narayanan, T.
Analysis of thermosensitive core-shell colloids by small-angle neutron scattering including con-
trast variation. Phys. Chem. Chem. Phys. 2001, 3, 1169–1174.
[78] Crassous, J. J.; Siebenbürger, M.; Ballauff, M.; Drechsler, M.; Henrich, O.; Fuchs, M. Ther-
mosensitive core-shell particles as model systems for studying the flow behavior of concentrated
colloidal dispersions. The Journal of Chemical Physics 2006, 125.
70
[79] Lu, Y.; Proch, S.; Schrinner, M.; Drechsler, M.; Kempe, R.; Ballauff, M. Thermosensitive core-
shell microgel as a nanoreactor for catalytic active metal nanoparticles. J. Mater. Chem. 2009, 19,
3955–3961.
[80] Welsch, N. Interactions of Proteins with Soft Polymeric Surfaces: Driving Forces and Kinetics.
Ph.D. thesis, Reports of the Helmholtz Centre Berlin (HZB-Berichte), 2012.
[81] Welsch, N.; Wittemann, A.; Ballauff, M. Enhanced Activity of Enzymes Immobilized in Ther-
moresponsive Core-Shell Microgels. The Journal of Physical Chemistry B 2009, 113, 16039–
16045.
[82] Kawaguchi, H.; Fujimoto, K.; Mizuhara, Y. Hydrogel microspheres III. Temperature-dependent
adsorption of proteins on poly-N-isopropylacrylamide hydrogel microspheres. Colloid and Poly-
mer Science 1992, 270, 53–57.
[83] Cole, M. A.; Voelcker, N. H.; Thissen, H.; Horn, R. G.; Griesser, H. J. Colloid probe AFM study
of thermal collapse and protein interactions of poly(N-isopropylacrylamide) coatings. Soft Matter
2010, 6, 2657–2667.
[84] Grabstain, V.; Bianco-Peled, H. Mechanisms Controlling the Temperature-Dependent Binding
of Proteins to Poly(N-isopropylacrylamide) Microgels. Biotechnology Progress 2003, 19, 1728–
1733.
[85] Lindman, S.; Lynch, I.; Thulin, E.; Nilsson, H.; Dawson, K. A.; Linse, S. Systematic Investigation
of the Thermodynamics of HSA Adsorption to N-iso-Propylacrylamide/N-tert-Butylacrylamide
Copolymer Nanoparticles. Effects of Particle Size and Hydrophobicity. Nano Letters 2007, 7,
914–920.
[86] Johansson, C.; Gernandt, J.; Bradley, M.; Vincent, B.; Hansson, P. Interaction between lysozyme
and colloidal poly(NIPAM-co-acrylic acid) microgels. Journal of Colloid and Interface Science
2010, 347, 241 – 251.
[87] Smith, M. H.; Lyon, L. A. Tunable Encapsulation of Proteins within Charged Microgels. Macro-
molecules 2011, 44, 8154–8160.
[88] Flory, P. J. Principles of Polymer Chemistry; Cornell University Press: Ithaca, NY, 1953, 1953.
[89] Huo, D.; Li, Y.; Qian, Q.; Kobayashi, T. Temperature and pH sensitivity of bovine serum albumin
protein-microgels based on cross-linked poly(N-isopropylacrylamide-co-acrylic acid). Colloids
and Surfaces B: Biointerfaces 2006, 50, 36 – 42.
[90] Yan, C.; Elaissari, A.; Pichot, C. Loading and Release Studies of Proteins Using Poly(N-
isopropylacrylamide) Based Nanogels. Journal of Biomedical Nanotechnology 2006, 2, 208–216.
71
[91] Becker, A. L.; Welsch, N.; Schneider, C.; Ballauff, M. Adsorption of RNase A on Cationic Poly-
electrolyte Brushes: A Study by Isothermal Titration Calorimetry. Biomacromolecules 2011, 12,
3936–3944.
[92] Wittemann, A.; Haupt, B.; Ballauff, M. Adsorption of proteins on spherical polyelectrolyte
brushes in aqueous solution. Physical Chemistry Chemical Physics 2003, 5, 1671–1677.
[93] Lund, M.; Akesson, T.; J?nsson, B. Enhanced Protein Adsorption Due to Charge Regulation.
Langmuir 2005, 21, 8385–8388.
[94] Lund, M.; Jonsson, B. On the Charge Regulation of Proteins. Biochemistry 2005, 44, 5722–5727.
[95] Longo, G. S.; de la Cruz, M. O.; Szleifer, I. Molecular Theory of Weak Polyelectrolyte Gels: The
Role of pH and Salt Concentration. Macromolecules 2011, 44, 147–158.
[96] Biesheuvel, P. M.; Wittemann, A. A Modified Box Model Including Charge Regulation for Protein
Adsorption in a Spherical Polyelectrolyte Brush. The Journal of Physical Chemistry B 2005, 109,
4209–4214.
[97] Bysell, H.; Hansson, P.; Malmsten, M. Effect of Charge Density on the Interaction between
Cationic Peptides and Oppositely Charged Microgels. The Journal of Physical Chemistry B 2010,
114, 7207–7215.
[98] Welsch, N.; Dzubiella, J.; Graebert, A.; Ballauff, M. Protein binding to soft polymeric layers: a
quantitative study by fluorescence spectroscopy. Soft Matter 2012, 8, 12043–12052.
[99] Angioletti-Uberti, S.; Ballauff, M.; Dzubiella, J. Dynamic density functional theory of protein
adsorption on polymer-coated nanoparticles. Soft Matter 2014, 10, 7932–7945.
[100] Buschmann, M. D.; Grodzinsky, A. J. A molecular model of proteoglycan-associated electrostatic
forces in cartilage mechanics. J Biomech Eng 1995, 117, 179–92.
[101] Dubrovskii, S.; Rakova, G.; Lagutina, M.; Kazanskii, K. Osmotic properties of poly(ethylene
oxide) gels with localized charged units. Polymer 2001, 42, 8075 – 8083.
[102] Horkay, F.; Zrinyi, M. Studies on the mechanical and swelling behavior of polymer networks
based on the scaling concept. 4. Extension of the scaling approach to gels swollen to equilibrium
in a diluent of arbitrary activity. Macromolecules 1982, 15, 1306–1310.
[103] Rubinstein, M.; ; Colby, R. H.; Dobrynin, A. V.; Joanny, J.-F. Elastic Modulus and Equilibrium
Swelling of Polyelectrolyte Gels. Macromolecules 1996, 29, 398–406.
[104] Hu, Z.; Li, C.; Li, Y. The scaling exponents of polyacrylamide and acrylamide and sodium acrylate
copolymer gels. The Journal of Chemical Physics 1993, 99, 7108–7114.
[105] Horkay, F.; Tasaki, I.; Basser, P. J. Osmotic Swelling of Polyacrylate Hydrogels in Physiological
Salt Solutions. Biomacromolecules 2000, 1, 84–90.
72

[106] Fernandes, P. A. L.; Schmidt, S.; Zeiser, M.; Fery, A.; Hellweg, T. Swelling and mechanical
properties of polymer gels with cross-linking gradient. Soft Matter 2010, 6, 3455–3458.
[107] Geissler, E.; Horkay, F.; Hecht, A.-M. Structure and thermodynamics of flexible polymer gels.
The Journal of Chemical Physics 1994, 100, 8418–8424.
[108] Lu, Y.; Drechsler, M. Charge-Induced Self-Assembly of 2-Dimensional Thermosensitive Microgel
Particle Patterns. Langmuir 2009, 25, 13100–13105.
[109] Höfl, S.; Zitzler, L.; Hellweg, T.; Herminghaus, S.; Mugele, F. Volume phase transition of smart
microgels in bulk solution and adsorbed at an interface: A combined AFM, dynamic light, and
small angle neutron scattering study. Polymer 2007, 48, 245 – 254.
[110] Hashmi, S. M.; Dufresne, E. R. Mechanical properties of individual microgel particles through the
deswelling transition. Soft Matter 2009, 5, 3682–3688.
[111] Linse, S.; Cabaleiro-Lago, C.; Xue, W.-F.; Lynch, I.; Lindman, S.; Thulin, E.; Radford, S. E.;
Dawson, K. A. Nucleation of protein fibrillation by nanoparticles. Proceedings of the National
Academy of Sciences 2007, 104, 8691–8696.
[112] Henzler, K.; Haupt, B.; Lauterbach, K.; Wittemann, A.; Borisov, O.; Ballauff, M. Adsorption of
beta-Lactoglobulin on Spherical Polyelectrolyte Brushes: Direct Proof of Counterion Release by
Isothermal Titration Calorimetry. Journal of the American Chemical Society 2010, 132, 3159–
3163.
[113] Hu, F.; Chen, K.; Xu, H.; Gu, H. Functional short-chain zwitterion coated silica nanoparticles
with antifouling property in protein solutions. Colloids and Surfaces B: Biointerfaces 2015, 126,
251–256.
[114] Chakraborti, S.; Joshi, P.; Chakravarty, D.; Shanker, V.; Ansari, Z. A.; Singh, S. P.; Chakrabarti, P.
Interaction of Polyethyleneimine-Functionalized ZnO Nanoparticles with Bovine Serum Albumin.
Langmuir 2012, 28, 11142–11152.
[115] Fleischer, C. C.; Payne, C. K. Secondary Structure of Corona Proteins Determines the Cell Surface
Receptors Used by Nanoparticles. The Journal of Physical Chemistry B 2014, 118, 14017–14026.
[116] Baier, G.; Costa, C.; Zeller, A.; Baumann, D.; Sayer, C.; Araujo, P. H. H.; Mailänder, V.;
Musyanovych, A.; Landfester, K. BSA Adsorption on Differently Charged Polystyrene Nanoparti-
cles using Isothermal Titration Calorimetry and the Influence on Cellular Uptake. Macromolecular
Bioscience 2011, 11, 628–638.
[117] Li, X.; Chen, M.; Yang, W.; Zhou, Z.; Liu, L.; Zhang, Q. Interaction of bovine serum albumin
with self-assembled nanoparticles of 6-O-cholesterol modified chitosan. Colloids and Surfaces B:
Biointerfaces 2012, 92, 136–141.
73

[118] Zhao, T.; Chen, K.; Gu, H. Investigations on the Interactions of Proteins with Polyampholyte-
Coated Magnetite Nanoparticles. The Journal of Physical Chemistry B 2013, 117, 14129–14135.
[119] Henzler, K.; Wittemann, A.; Breininger, E.; Ballauff, M.; Rosenfeldt, S. Adsorption of Bovine
Hemoglobin onto Spherical Polyelectrolyte Brushes Monitored by Small-Angle X-ray Scattering
and Fourier Transform Infrared Spectroscopy. Biomacromolecules 2007, 8, 3674–3681.
[120] Wang, S.; Chen, K.; Li, L.; Guo, X. Binding between Proteins and Cationic Spherical Polyelec-
trolyte Brushes: Effect of pH, Ionic Strength, and Stoichiometry. Biomacromolecules 2013, 14,
818–827.
[121] Sanchez-Moreno, P.; Buzon, P.; Boulaiz, H.; Peula-Garcia, J.; Ortega-Vinuesa, J.; Luque, I.; Sal-
vati, A.; Marchal, J. Balancing the effect of corona on therapeutic efficacy and macrophage uptake
of lipid nanocapsules. Biomaterials 2015, 61, 266 – 278.
[122] Oberle, M.; Yigit, C.; Angioletti-Uberti, S.; Dzubiella, J.; Ballauff, M. Competitive Protein Ad-
sorption to Soft Polymeric Layers: Binary Mixtures and Comparison to Theory. The Journal of
Physical Chemistry B 2015, 119, 3250–3258.
[123] Atkins, P. W.; De., P. J. Atkins’ Physical Chemistry 7th Ed.; Oxford: Oxford University Press,
2006.
[124] Lide, D. R., Ed. CRC Handbook of Chemistry and Physics 90th Edition; Taylor & Francis Ltd.,
2009.
[125] Ladbury, J. E.; Chowdhry, B. Z. Biocalorimetry; John Wiley&Sons, 1998.
[126] Turnbull, W. B.; Daranas, A. H. On the value of c: Can low affinity systems be studied by isother-
mal titration calorimetry? J. Am. Chem. Soc. 2003, 125, 14859–14866.
[127] Yu, S.; Xu, X.; Yigit, C.; van der Giet, M.; Zidek, W.; Jankowski, J.; Dzubiella, J.; Ballauff, M.
Interaction of human serum albumin with short polyelectrolytes: a study by calorimetry and com-
puter simulations. Soft Matter 2015, 11, 4630–4639.
[128] Henzler, K.; Haupt, B.; Rosenfeldt, S.; Harnau, L.; Narayanan, T.; Ballauff, M. Interaction strength
between proteins and polyelectrolyte brushes: a small angle X-ray scattering study. Phys. Chem.
Chem. Phys. 2011, 13, 17599–17605.
[129] Mackie, A. R.; Mingins, J.; North, A. N. Characterisation of adsorbed layers of a disordered coil
protein on polystyrene latex. J. Chem. Soc., Faraday Trans. 1991, 87, 3043–3049.
[130] Vauthier, C.; Lindner, P.; Cabane, B. Configuration of bovine serum albumin adsorbed on polymer
particles with grafted dextran corona. Colloids and Surfaces B: Biointerfaces 2009, 69, 207 – 215.
74
[131] Rosenfeldt, S.; Wittemann, A.; Ballauff, M.; Breininger, E.; Bolze, J.; Dingenouts, N. Interac-
tion of proteins with spherical polyelectrolyte brushes in solution as studied by small-angle x-ray
scattering. Phys. Rev. E 2004, 70, 061403.
[132] Henzler, K.; Rosenfeldt, S.; Wittemann, A.; Harnau, L.; Finet, S.; Narayanan, T.; Ballauff, M.
Directed Motion of Proteins along Tethered Polyelectrolytes. Phys. Rev. Lett. 2008, 100, 158301.
[133] Bharti, B.; Meissner, J.; Findenegg, G. H. Aggregation of Silica Nanoparticles Directed by Ad-
sorption of Lysozyme. Langmuir 2011, 27, 9823–9833, PMID: 21728288.
[134] Goerigk, G.; Schweins, R.; Huber, K.; Ballauff, M. The distribution of Sr 2+ counterions around
polyacrylate chains analyzed by anomalous small-angle X-ray scattering. EPL (Europhysics Let-
ters) 2004, 66, 331–337.
[135] Patel, M.; Rosenfeldt, S.; Ballauff, M.; Dingenouts, N.; Pontoni, D.; Narayanan, T. Analysis of
the correlation of counterions to rod-like macroions by anomalous small-angle X-ray scattering.
Phys. Chem. Chem. Phys. 2004, 6, 2962–2967.
[136] Guilleaume, B.; Blaul, J.; Ballauff, M.; Wittemann, M.; Rehahn, M.; Goerigk, G. The distribu-
tion of counterions around synthetic rod-like polyelectrolytes in solution. The European Physical
Journal E 2002, 8, 299–309.
[137] Goerigk, G.; Huber, K.; Mattern, N.; Williamson, D. L. Quantitative anomalous small-angle X-
ray scattering – The determination of chemical concentrations in nano-scaled phases. Eur. Phys.
J. Special Topics 2012, 208, 259–274.
[138] Boulos, S. P.; Davis, T. A.; Yang, J. A.; Lohse, S. E.; Alkilany, A. M.; Holland, L. A.; Murphy, C. J.
Nanoparticle Protein Interactions: A Thermodynamic and Kinetic Study of the Adsorption of
Bovine Serum Albumin to Gold Nanoparticle Surfaces. Langmuir 2013, 29, 14984–14996.
[139] Bunz, U. H. F.; Rotello, M., Vincent Gold Nanoparticle-Fluorophore Complexes: Sensitive and
Discerning Noses for Biosystems Sensing. Angewandte Chemie International Edition 2010, 49,
3268–3279.
[140] Ohkuma, S.; Poole, B. Fluorescence probe measurement of the intralysosomal pH in living cells
and the perturbation of pH by various agents. Proceedings of the National Academy of Sciences of
the United States of America 1978, 75, 3327–3331.
[141] Hungerford, G.; Benesch, J.; Mano, J. F.; Reis, R. L. Effect of the labelling ratio on the photo-
physics of fluorescein isothiocyanate (FITC) conjugated to bovine serum albumin. Photochem.
Photobiol. Sci. 2007, 6, 152–158.
[142] Chen, R. F.; Knutson, J. R. Mechanism of fluorescence concentration quenching of carboxyflu-
orescein in liposomes: Energy transfer to nonfluorescent dimers. Analytical Biochemistry 1988,
172, 61 – 77.
75
[143] Hansen, J. P.; McDonald, I. R. Theory of Simple Liquids;; Academic Press: London, 2006.
[144] Filatova, L. Y.; Oxenoyt, Y. S.; Yakovleva, K. S.; Ivanova, N. I.; Klyachko, N. L. Investigation
of the activity and stability of papain in different micellar systems. Moscow University Chemistry
Bulletin 2010, 65, 80–86.
[145] Hamill, A. C.; Wang, S.-C.; Lee, C. T. Probing Lysozyme Conformation with Light Reveals a
New Folding Intermediate. Biochemistry 2005, 44, 15139–15149.
[146] Oleinikova, A.; Sasisanker, P.; Weingaertner, H. What Can Really Be Learned from Dielectric
Spectroscopy of Protein Solutions? A Case Study of Ribonuclease A. The Journal of Physical
Chemistry B 2004, 108, 8467–8474.
[147] Wilkins, D. K.; Grimshaw, S. B.; Receveur, V.; Dobson, C. M.; Jones, J. A.; Smith, L. J. Hy-
drodynamic Radii of Native and Denatured Proteins Measured by Pulse Field Gradient NMR
Techniques. Biochemistry 1999, 38, 16424–16431.
[148] Giachini, L.; Francia, F.; Cordone, L.; Boscherini, F.; Venturoli, G. Cytochrome c in a Dry Tre-
halose Matrix: Structural and Dynamical Effects Probed by X-Ray Absorption Spectroscopy. Bio-
physical Journal 2007, 92, 1350 – 1360.
[149] Cromer, D. T.; Liberman, D. A. Anomalous dispersion calculations near to and on the long-
wavelength side of an absorption edge. Acta Crystallographica Section A 1981, 37, 267–268.
[150] Cromer, D. T.; Liberman, D. Relativistic Calculation of Anomalous Scattering Factors for X Rays.
The Journal of Chemical Physics 1970, 53, 1891–1898.
[151] Horecha, M.; Senkovskyy, V.; Synytska, A.; Stamm, M.; Chervanyov, A. I.; Kiriy, A. Ordered
surface structures from PNIPAM-based loosely packed microgel particles. Soft Matter 2010, 6,
5980–5992.
76

9 List of Abbreviations
AAc Acrylic acid
AFM Atomic Force Microscopy
APTES 3-Aminopropyl)triethoxysilane
ASAXS Anamolous Small Angle X-Ray Scattering
BAM N-tert-butylacrylamide
BIS N,N’-Methylenebisacrylamide
BLG β-Lactoglobulin
BSA Bovine Serum Albumin
CB-Model Cooperative Binding Model
DMSO Dimethylsulfoxide
DLS Dynamic Light Scattering
FCS Fluorescense Correlation Spectroscopy
FITC Fluoresceinisothiocyanate
Fgn Fibrinogen
HSA Human Serum Albumin
ITC Isothermal Titration Calorimetry
KPS Potassium peroxodisulfate
LCST Lower Critical Solution Temperature
MOPS 3-(N-morpholino)propanesulfonic acid
NIPAM N-isopropylacrylamide
NPs Nanoparticles
PAA Polyacrylic acid
PDB Protein Data Base
PEG Polyethylene glycol
PLL Poly-L-Lysine
PNIPAM Poly(N-isopropylacrylamide)
PS Polystyrene
PSS Polystyrene Sulfonate
RET Resonance Energy Transfer
SANS Small Angle Neutron Scattering
SAXS Small Angle X-Ray Scattering
SDS Sodium dodecyl sulfate
77
SPB Spherical Polyelectrolye Brush
TEM Transmission Electron Microscopy
VPTT Volume Phase Transition
78
10 List of Figures
1.1 Protein adsorptions occurring in different technological fields . . . . . . . . . . . . . . . 2
1.2 Illustration of the Vroman effect . . . . . . . . . . . . . . . . . . . . . . . . . . . . . . 3
1.3 Nanoparticle forming a corona interacting on a cellular level . . . . . . . . . . . . . . . 4
1.4 Scheme of a typical protein adsorption isotherm and Langmuir Lattice . . . . . . . . . . 6
3.1 Scheme of stimuli responsive core-shell microgel with a solid core structure . . . . . . . 10
3.2 Cryo-TEM image of a negatively charged poly(NIPAM) core-shell microgel . . . . . . . 10
3.3 Scheme of the two-step synthesis of core-shell microgels . . . . . . . . . . . . . . . . . 11
3.4 Donnan potential and charge regulation . . . . . . . . . . . . . . . . . . . . . . . . . . 12
3.5 Field-emission scanning electron microscope images of positively and negatively charged
microgel particles assembled on a mica surface . . . . . . . . . . . . . . . . . . . . . . 15
3.6 Schematic representation of an isothermal titration calorimeter . . . . . . . . . . . . . . 16
3.7 ITC titration of lysozyme binding to microgel NW15 . . . . . . . . . . . . . . . . . . . 18
3.8 The shape of ITC curves: Problems and Pitfalls . . . . . . . . . . . . . . . . . . . . . . 20
3.9 Distribution of β-lactoglobulin in SPB and electron density profile as derived from SAXS 22
3.10 Scheme of the model used for the calculation of the scattering function of the composite
system consisting of a spherical nanoparticle and adsorbed protein. See further explana-
tions in the text . . . . . . . . . . . . . . . . . . . . . . . . . . . . . . . . . . . . . . . 24
3.11 General scheme of the fluorescence-based competitive adsorption experiment in the case
of a binary protein mixture . . . . . . . . . . . . . . . . . . . . . . . . . . . . . . . . . 28
3.12 Simplified scheme of the Cooperative Binding Model (CB-Model) applied in the one-
component and multi-component case . . . . . . . . . . . . . . . . . . . . . . . . . . . 29
3.13 Sketch of the core-shell microgel in a binary mixture of proteins . . . . . . . . . . . . . 29
4.1 Adsorption isotherms for cytochrome c onto NW15 and OM5UF microgel particles at
different temperatures and van’t Hoff plot . . . . . . . . . . . . . . . . . . . . . . . . . 35
4.2 Adsorption isotherms for cytochrome c and glucosidase onto NW15 microgel particles . 37
4.4 Heats of dilution for glucosidase measured by ITC . . . . . . . . . . . . . . . . . . . . 38
4.3 SAXS intensity profiles I(q) for Glucosidase . . . . . . . . . . . . . . . . . . . . . . . . 39
4.5 Adsorption isotherm for lysozyme onto OM6UF microgel particles . . . . . . . . . . . 40
4.6 Adsorption isotherms of lysozyme, cytochrome c, RNase A and papain onto NW15 mi-
crogel particles . . . . . . . . . . . . . . . . . . . . . . . . . . . . . . . . . . . . . . . 41
79
4.7 Analysis of the total free energy . . . . . . . . . . . . . . . . . . . . . . . . . . . . . . 42
4.8 Competitive protein adsorption measured with fluorescence spectroscopy . . . . . . . . 44
4.9 Crystal structure of cytochrome c and the normalized adsorption spectrum of an iron foil
and for cytochrome c . . . . . . . . . . . . . . . . . . . . . . . . . . . . . . . . . . . . 46
4.10 Anomalous dispersion correction by Cromer-Liberman calculations . . . . . . . . . . . 47
4.11 SAXS curves of the uncharged microgel OM5UF loaded with cytochrome c measured at
three different energies and separation of the formfactor for the pure resonant scattering . 48
4.12 Sketch of the 2D microgel with the distribution of cytochrome c and concentration profile
of the protein . . . . . . . . . . . . . . . . . . . . . . . . . . . . . . . . . . . . . . . . 49
4.13 AFM images of OM6UF and OM6UF with lysozyme measured in air . . . . . . . . . . 50
4.14 AFM images of OM6UF and OM6UF with lysozyme measured in liquid . . . . . . . . . 51
4.15 Scheme of a core-shell microgel attached to a PLL modified silicon surface . . . . . . . 52
6.1 Overview of TEM images of the core-shell microgels . . . . . . . . . . . . . . . . . . . 58
6.2 Potentiometric and conductometric titrations of microgels . . . . . . . . . . . . . . . . . 59
6.3 UV-vis and fluorescence spectrum of LysozymeFITC . . . . . . . . . . . . . . . . . . . 61
80

11 List of Tables
3.1 Overview on ITC measurements used to obtain protein adsorption isotherms onto various
types of nanoparticles (NPs) . . . . . . . . . . . . . . . . . . . . . . . . . . . . . . . . 17
4.1 Microgels Overview . . . . . . . . . . . . . . . . . . . . . . . . . . . . . . . . . . . . 34
4.2 Overview: Protein-microgel combinations for ITC Experiments . . . . . . . . . . . . . 34
4.3 Thermodynamic parameters for the adsorption of cytochrome c onto microgels NW15
and OM5UF at different temperatures . . . . . . . . . . . . . . . . . . . . . . . . . . . 35
4.4 Thermodynamic parameters for the adsorption of cytochrome c and glucosidase . . . . . 36
4.5 Results for the adsorption isotherms of single proteins onto NW15 microgel particles
lysozyme, cytochrome c, RNase A and papain using the cooperative binding model . . . 41
6.1 Overview of the amount of educts used for the synthesis of the polystyrene cores . . . . 56
6.2 Overview of the amount of educts used for the synthesis of the core-shell microgels . . . 56
6.3 Composition, size and molecular weight of the shell network of synthesized microgels . 57
6.4 Overview of ITC parameters used in the experiments . . . . . . . . . . . . . . . . . . . 60
7.1 Overview of frequently used variables for the derivation of the cooperative binding model 64
81
12 List of Publications and Presentations
Oberle, M.; Yigit, C.; Angioletti-Uberti, S.; Dzubiella, J.; Ballauff, M. Competitive Protein Adsorption
to Soft Polymeric Layers: Binary Mixtures and Comparison to Theory. The Journal of Physical Chem-
istry B 2015, 119, 3250–3258.
Petzhold, A; Oberle, M.; Lemke, K.; Goerigk G.; Ballauff M. Cytochrome C Adsorption onto Core-
Shell Microgels analysed by Anomalous Small-Angle X-ray Scattering. 2016 in preparation
89th ACS Colloid & Surface Science Symposium, Pittsburgh, PA, USA, June 15-17, 2015, Oral pre-
sentation: Colloidal Microgels as Model Systems to Study Protein (Ad)sorptions
248th ACS National Meeting and Exposition, San Francisco, CA, USA, August 10-14, 2014, Poster
presentation: Competitive Protein Adsorption onto Functional Polymeric Materials predicted by a Mul-
ticomponent Binding Model
IRTG 1524 Annual Meeting 2013 New Bern, NC, USA, Sept 29-Oct 03, 2013, Oral presentation: Mea-
suring and Modelling Protein adsorption onto polymeric networks.
HVI-Methodenworkshop, Institut für Biomaterialforschung (HZG Teltow), Teltow, April 30, 2013, Oral
Presentation: Small-Angle Scattering with X-Rays and Neutrons: Studying Structures on a Mesoscopic
Scale.
82

13 Danksagung
Die Doktorarbeit war für mich ein großes Ziel im Leben, welches durch die Hilfe und Unterstützung
anderer Menschen nicht ohne Weiteres zu erreichen wäre.
Ich möchte daher an erster Stelle meinen Dank an Prof. Dr. Matthias Ballauff richten, der es mir ermög-
lichte auf einem anspruchsvollen, innovativem und interessanten Gebiet zu forschen und dort auch zu
neuen Erkenntnissen beizutragen. Insbesondere danke ich Herrn Ballauff für seine Diskussionsbereit-
schaft und das fortwährende Interesse an meiner Arbeit sowie sein Vertrauen und auch die Flexibilität,
die mir für meine Ideen gelassen wurden. Ich habe viel Wichtiges gelernt!
Mein Dank gilt gleichermaßen Prof. Joachim Dzubiella und Dr. Cemil Yigit aus der Theoriegruppe für
deren Diskussionsbereitschaft und Vertrauen. Insbesondere bedanke ich mich hier für deren maßgebliche
Hilfe bei der Analyse, Interpretation und Vorhersage der experimentellen Daten der kompetitiven Prote-
inadsorption sowie für die tolle Zusammenarbeit bei der Veröffentlichung. Ferner danke ich Dr. Günther
Goerigk und Dr. Albrecht Petzhold für die ASAXS Messzeit und die hervorragende Hilfe bei der Aus-
wertung und Interpretation der Messdaten - auch im Hinblick auf die noch ausstehende Publikation.
Ebenfalls möchte ich mich sehr herzlich bei Prof. Dr. Stefan Zauscher und seinen Mitarbeitern bedanken.
Während meines Aufenthalts in dessen Arbeitskreis in den USA habe ich sehr lehrreiche und wertvolle
Erfahrung sammeln können. Es war eine unvergessliche und schöne Zeit!
Für die finanzielle Unterstützung danke ich der Deutschen Forschungsgemeinschaft (DFG), in deren
Graduiertenkolleg IRTG-1524 ich Stipendiat war und welche mir auch meinen Auslandsaufenthalt er-
möglichte. An dieser Stelle möchte ich mich nochmal sehr herzlich bei den Organisatoren und Mitar-
beitern des IRTG-1524, namentlich Prof. Dr. Martin Schoen, Dr. Daniela Fliegner, Petra Erdmann und
Beatrix Thiele bedanken. Für die Anliegen der Stipendiaten hatten sie stets ein offenes Ohr und wertvolle
Ratschläge. Überdies möchte ich ein Dankeschön an das Helmholtz-Zentrum Berlin richten, welches mir
eine zusätzliche Finanzierung zur Fertigstellung dieser Arbeit ermöglichte.
Ein weiterer Dank gilt allen meinen Kollegen und Kolleginnen des Helmholtz-Zentrums Berlin, der
TU Berlin und der Duke University. Diese haben wesentlich zu einem angenehmen und inspirierenden
Arbeitsklima beigetragen.
Ein abschließender und spezieller Dank geht an meine wertvollen Freunde, die mich auch durch schwie-
rige Phasen im Leben begleitet haben.
Denn die richtigen Personen verändern dich nicht, sie verbessern dich!
83