Singapore Property Market Outlook 2020 · 2019-12-16 · Figure 2: Rental Index for Non-Landed...
21
Singapore Property Market Outlook 2020
Transcript of Singapore Property Market Outlook 2020 · 2019-12-16 · Figure 2: Rental Index for Non-Landed...

Singapore Property
Market Outlook 2020

PropertyGuru Singapore Property Market Outlook 2020
ExEcutivE
Summary
3PropertyGuru Singapore Property Market Outlook 2020
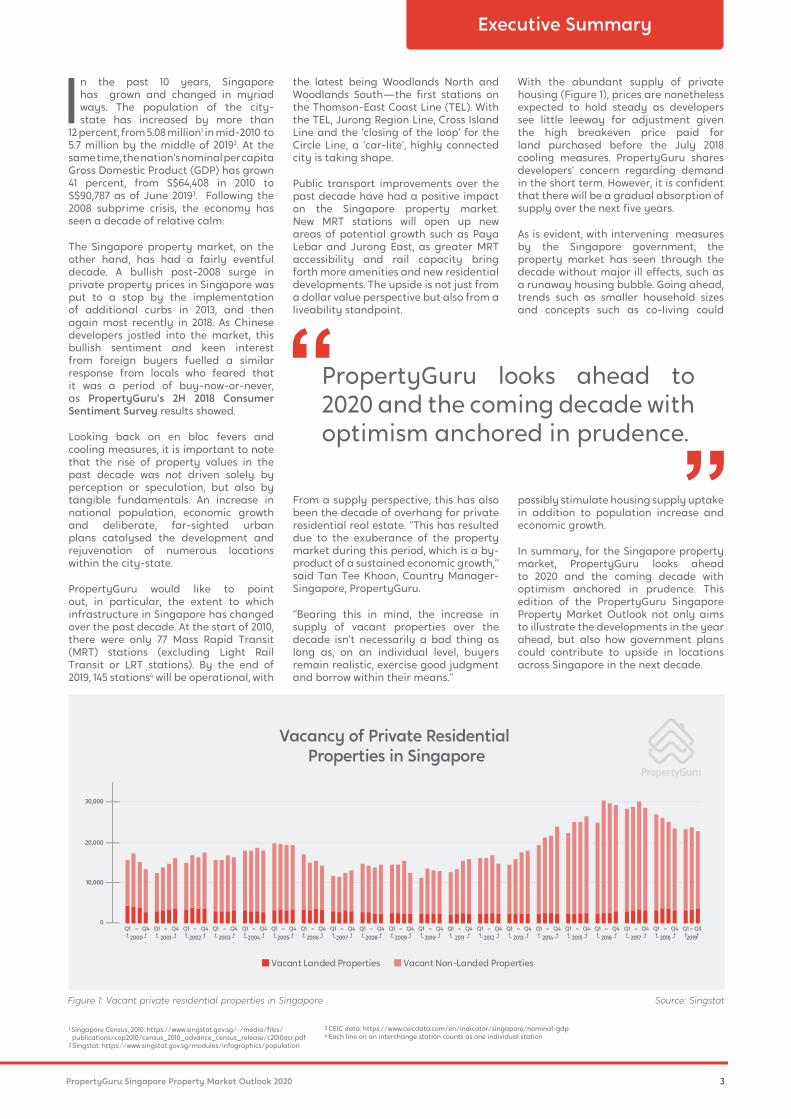
Vacancy of Private Residential
Properties in Singapore
10,000
20,000
30,000
0
Q4Q1 –
2000
Q4Q1 –
2001
Q4Q1 –
2002
Vacant Landed Properties Vacant Non-Landed Properties
Q4Q1 –
2003
Q4Q1 –
2004
Q4Q1 –
2005
Q4Q1 –
2006
Q4Q1 –
2007
Q4Q1 –
2008
Q4Q1 –
2009
Q4Q1 –
2010
Q4Q1 –
2011
Q4Q1 –
2012
Q4Q1 –
2013
Q4Q1 –
2014
Q4Q1 –
2015
Q4Q1 –
2016
Q4Q1 –
2017
Q3Q1 –
2019
Q4Q1 –
2018
In the past 10 years, Singapore
has grown and changed in myriad
ways. The population of the city-
state has increased by more than
12 percent, from 5.08 million1 in mid-2010 to
5.7 million by the middle of 20192. At the
same time, the nation’s nominal per capita
Gross Domestic Product (GDP) has grown
41 percent, from S$64,408 in 2010 to
S$90,787 as of June 20193. Following the
2008 subprime crisis, the economy has
seen a decade of relative calm.
The Singapore property market, on the
other hand, has had a fairly eventful
decade. A bullish post-2008 surge in
private property prices in Singapore was
put to a stop by the implementation
of additional curbs in 2013, and then
again most recently in 2018. As Chinese
developers jostled into the market, this
bullish sentiment and keen interest
from foreign buyers fuelled a similar
response from locals who feared that
it was a period of buy-now-or-never,
as PropertyGuru’s 2H 2018 Consumer
Sentiment Survey results showed.
Looking back on en bloc fevers and
cooling measures, it is important to note
that the rise of property values in the
past decade was not driven solely by
perception or speculation, but also by
tangible fundamentals. An increase in
national population, economic growth
and deliberate, far-sighted urban
plans catalysed the development and
rejuvenation of numerous locations
within the city-state.
PropertyGuru would like to point
out, in particular, the extent to which
infrastructure in Singapore has changed
over the past decade. At the start of 2010,
there were only 77 Mass Rapid Transit
(MRT) stations (excluding Light Rail
Transit or LRT stations). By the end of
2019, 145 stations4 will be operational, with
PropertyGuru looks ahead to
2020 and the coming decade with
optimism anchored in prudence.
the latest being Woodlands North and
Woodlands South—the first stations on
the Thomson-East Coast Line (TEL). With
the TEL, Jurong Region Line, Cross Island
Line and the ‘closing of the loop’ for the
Circle Line, a ‘car-lite’, highly connected
city is taking shape.
Public transport improvements over the
past decade have had a positive impact
on the Singapore property market.
New MRT stations will open up new
areas of potential growth such as Paya
Lebar and Jurong East, as greater MRT
accessibility and rail capacity bring
forth more amenities and new residential
developments. The upside is not just from
a dollar value perspective but also from a
liveability standpoint.
Executive Summary
From a supply perspective, this has also
been the decade of overhang for private
residential real estate. “This has resulted
due to the exuberance of the property
market during this period, which is a by-
product of a sustained economic growth,”
said Tan Tee Khoon, Country Manager-
Singapore, PropertyGuru.
“Bearing this in mind, the increase in
supply of vacant properties over the
decade isn’t necessarily a bad thing as
long as, on an individual level, buyers
remain realistic, exercise good judgment
and borrow within their means.”
With the abundant supply of private
housing (Figure 1), prices are nonetheless
expected to hold steady as developers
see little leeway for adjustment given
the high breakeven price paid for
land purchased before the July 2018
cooling measures. PropertyGuru shares
developers’ concern regarding demand
in the short term. However, it is confident
that there will be a gradual absorption of
supply over the next five years.
As is evident, with intervening measures
by the Singapore government, the
property market has seen through the
decade without major ill effects, such as
a runaway housing bubble. Going ahead,
trends such as smaller household sizes
and concepts such as co-living could
possibly stimulate housing supply uptake
in addition to population increase and
economic growth.
In summary, for the Singapore property
market, PropertyGuru looks ahead
to 2020 and the coming decade with
optimism anchored in prudence. This
edition of the PropertyGuru Singapore
Property Market Outlook not only aims
to illustrate the developments in the year
ahead, but also how government plans
could contribute to upside in locations
across Singapore in the next decade.
1 Singapore Census, 2010: https://www.singstat.gov.sg/-/media/files/
publications/cop2010/census_2010_advance_census_release/c2010acr.pdf
2 Singstat: https://www.singstat.gov.sg/modules/infographics/population
3 CEIC data: https://www.ceicdata.com/en/indicator/singapore/nominal-gdp
4 Each line on an interchange station counts as one individual station
Figure 1: Vacant private residential properties in Singapore Source: Singstat
PropertyGuru Singapore Property Market Outlook 2020
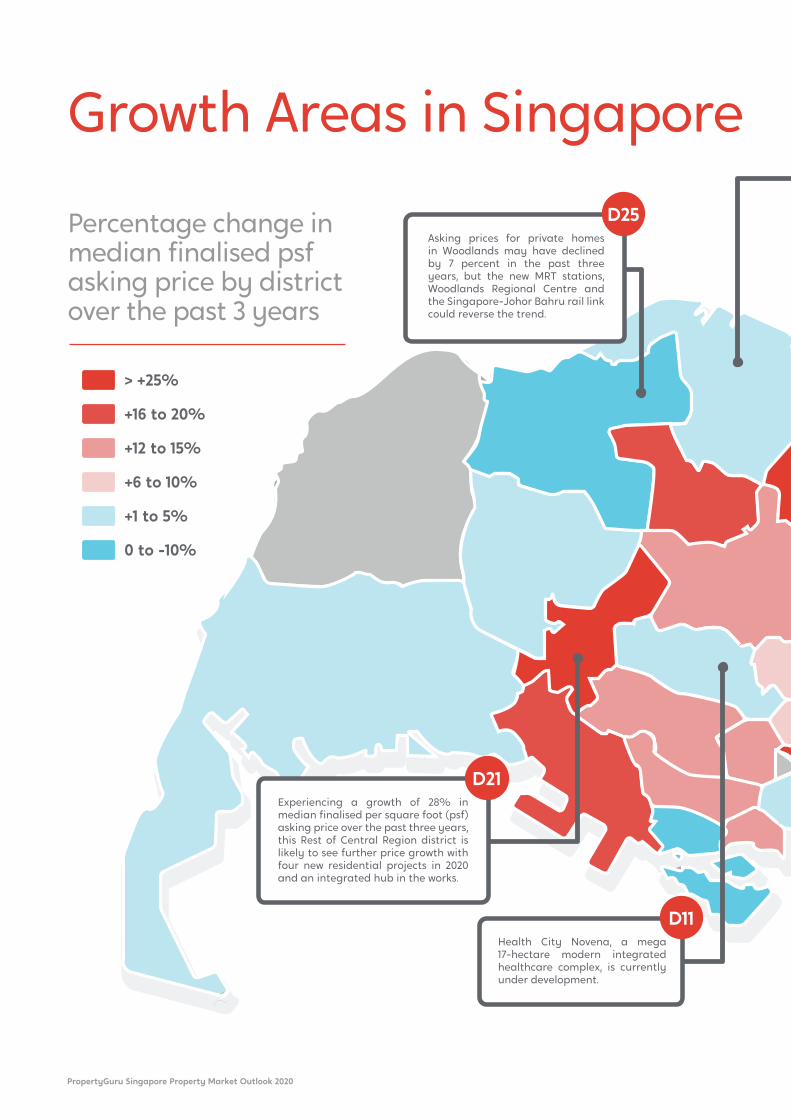
Asking prices for private homes
in Woodlands may have declined
by 7 percent in the past three
years, but the new MRT stations,
Woodlands Regional Centre and
the Singapore-Johor Bahru rail link
could reverse the trend.
D25
Health City Novena, a mega
17-hectare modern integrated
healthcare complex, is currently
under development.
D11
Experiencing a growth of 28% in
median finalised per square foot (psf)
asking price over the past three years,
this Rest of Central Region district is
likely to see further price growth with
four new residential projects in 2020
and an integrated hub in the works.
D21
Growth Areas in Singapore
> +25%
+16 to 20%
+12 to 15%
+6 to 10%
+1 to 5%
0 to -10%
Percentage change in
median finalised psf
asking price by district
over the past 3 years

5
Expansion of Singapore’s
MRT Network
77
145 No. of stations
2019
2010
A new executive condo at Tampines
will no doubt attract many suitors,
but stealing the limelight will be the
launch of a mixed-use development at
Pasir Ris Central.
D18
The introduction of Grade A offices
in 2019 may lead to further property
value uplift, considering that the URA
has plans for the further growth of
Paya Lebar Central.
D14
One of the most transformed
districts of the decade with
the rapid development of
West Sengkang.
D28
At 30%, this is the best performing
district in Singapore in terms
of growth in median psf asking
price over the past three years.
D7
Canberra, which is on an exciting
growth trajectory, will see the launch
of two executive condominiums in 2020.
D27Growth Areas in Singapore
Source: PropertyGuru
PropertyGuru Singapore Property Market Outlook 2020
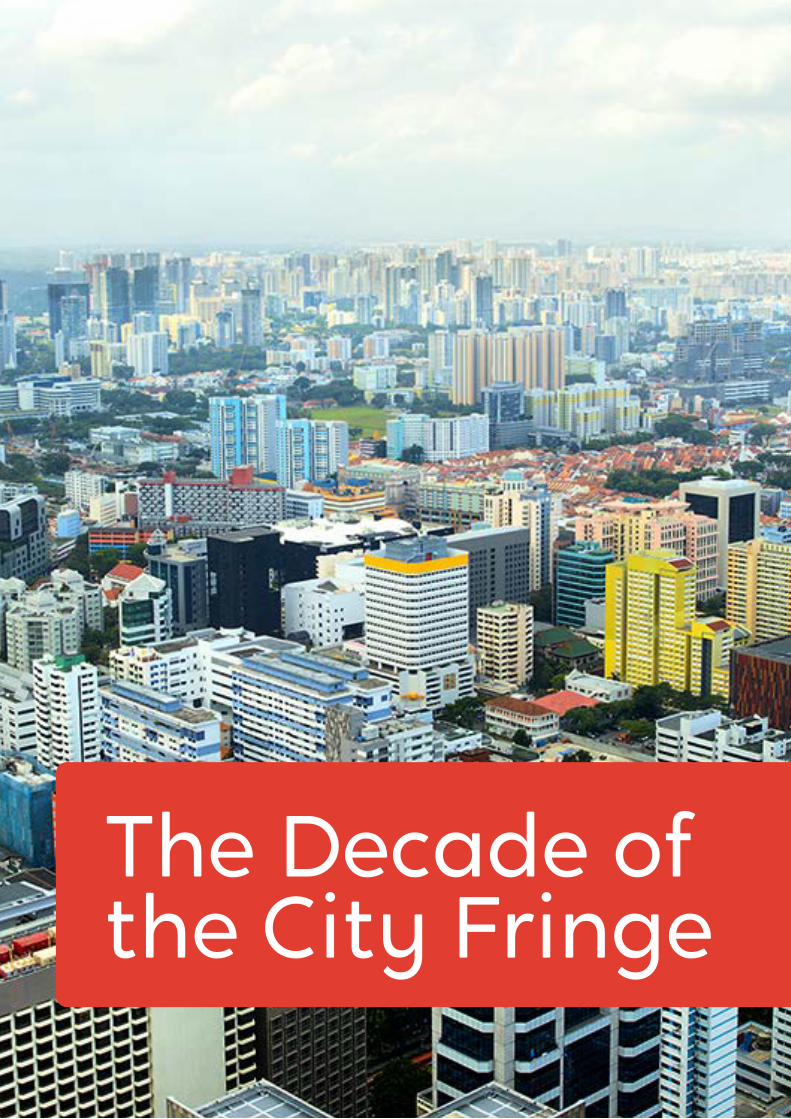
The Decade of
the City Fringe
7PropertyGuru Singapore Property Market Outlook 2020
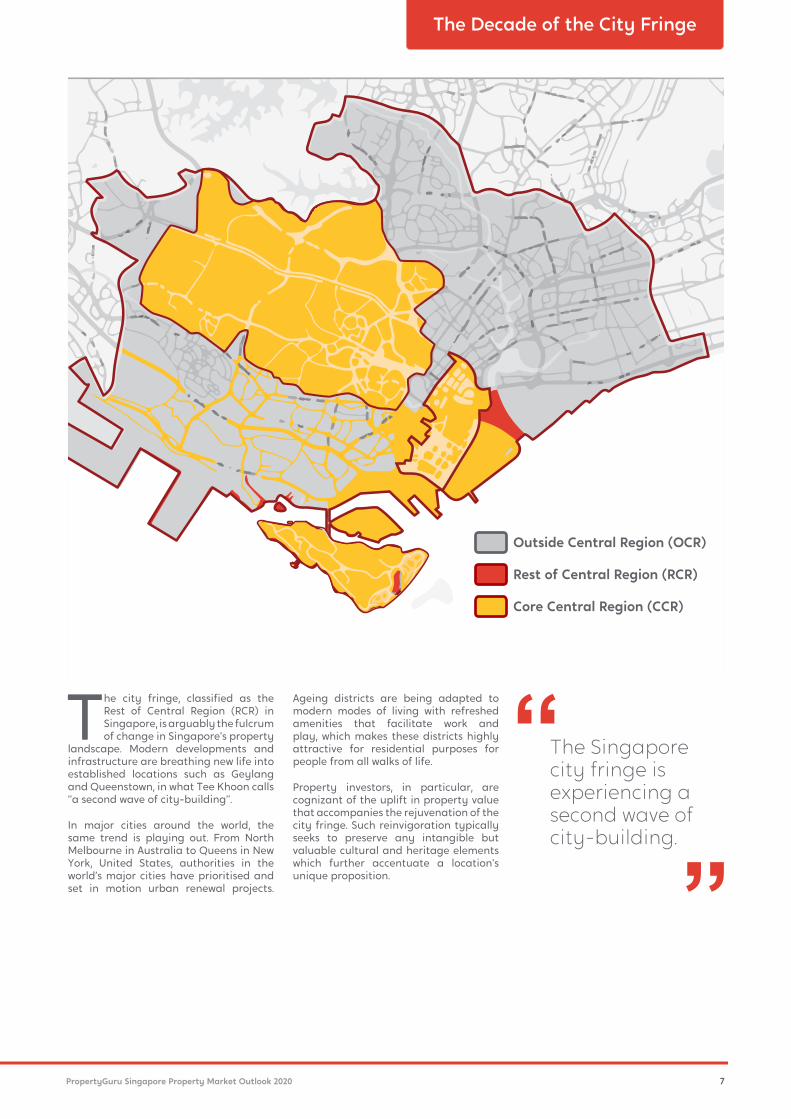
The city fringe, classified as the
Rest of Central Region (RCR) in
Singapore, is arguably the fulcrum
of change in Singapore’s property
landscape. Modern developments and
infrastructure are breathing new life into
established locations such as Geylang
and Queenstown, in what Tee Khoon calls
“a second wave of city-building”.
In major cities around the world, the
same trend is playing out. From North
Melbourne in Australia to Queens in New
York, United States, authorities in the
world’s major cities have prioritised and
set in motion urban renewal projects.
The Singapore
city fringe is
experiencing a
second wave of
city-building.
The Decade of the City Fringe
Outside Central Region (OCR)
Rest of Central Region (RCR)
Ageing districts are being adapted to
modern modes of living with refreshed
amenities that facilitate work and
play, which makes these districts highly
attractive for residential purposes for
people from all walks of life.
Property investors, in particular, are
cognizant of the uplift in property value
that accompanies the rejuvenation of the
city fringe. Such reinvigoration typically
seeks to preserve any intangible but
valuable cultural and heritage elements
which further accentuate a location’s
unique proposition.
Core Central Region (CCR)

8 PropertyGuru Singapore Property Market Outlook 2020
In the local context, properties in the
Rest of Central Region (RCR) may
benefit from the confluence of demand
from various buyer groups, including
foreigners looking for a good buy,
Singaporean investors, owner-occupiers
who want to live closer to the city, as well
as a sizeable pool of budget-conscious
tenants who might be priced out of the
prime rental market in the city centre.
For Singapore, strategic growth areas
and infrastructural developments
will augment the intrinsic locational
advantage of city fringe properties.
“In the coming year and decade, we
foresee the positioning of RCR projects
to change as upscale developments spill
over from the Core Central Region (CCR)
Properties in the RCR may benefit
from the confluence of demand
from various buyer groups.
Growth of the Rest
of Central Region
and its prime districts to the RCR,” said
Tee Khoon.
For ageing precincts such as Beauty
World and Rochor, it is foreseeable that
new developments or redevelopments
will provide much-needed booster shots
to surrounding property value. This
may give rise to a ripple effect that
encourages developers to hop onto the
rejuvenation bandwagon and buyers to
give the area greater consideration.
Furthermore, rents in the RCR have been
outperforming other regions since 2014,
according to the URA Rental Index for
non-landed properties (Figure 2), which
makes the RCR appealing to property
investors seeking rental yield.
Rental Index for Non-Landed
Properties by Region
95
100
105
110
115
120
90
Q3Q1
2010
Q3Q1
2011
Q3Q1
2012
Q3Q1
2013
Q3Q1
2014
Q3Q1
2015
Q3Q1
2016
Q3Q1
2017
Q3Q1
2018
Q3Q1
2019
CCR RCR OCR
The most popular
district in Singapore
among buyers for two
consecutive quarters.
Source: PropertyGuru Consumer
Sentiment Survey H2 2018 and
H1 2019
D15
The Decade of the City Fringe
Figure 2: Rental Index for Non-Landed Properties by Region. Source: URA

9PropertyGuru Singapore Property Market Outlook 2020
Median PSF Price - New Sale
500
1,000
1,500
2,000
2,500
3,000
0
CCR RCR OCR
Q1
2010
Q4
2016
Q3
2019
1,821
2,145
2,828
1,875
1,447
1,597
1,2031,196
793
800
600
1,200
1,000
1,400
1,600
1,800
2,000
0
CCR RCR OCR
Q1
2010
Q4
2016
Q3
2019
1,346
1,6911,832
887
1,1871,366
671
905 1,025
Median PSF Price - Resale
The addition
of new homes
and amenities
in the RCR
makes it a
region of
great promise.
In the course of the past decade, overall
median psf prices of non-landed private
properties in the RCR have increased
42 percent from S$1,035 psf in Q1 2010 to
S$1,802 psf in Q3 2019 (Figure 3a). “With
the pace of rejuvenation of the built
environment, there is likely further room
for property value to increase in the
RCR,” Tee Khoon noted. “The addition of
new homes and amenities will create a
virtuous cycle of rising value.”
In Q3 2019, the median RCR psf price was
closer to the CCR price than OCR price,
unlike at the beginning of the decade
when the RCR psf price was closer to the
OCR price than the CCR price (Figure 3a).
The most recent RCR median psf price is
buoyed by new launches just outside the
CCR, such as Sky Everton (District 2) and
Avenue South Residence (District 3).
Median PSF Price - All
500
1,000
1,500
2,000
2,500
0
Q1
2010
Q4
2016
Q3
2019
CCR RCR OCR
1,661
1,8612,084
1,802
1,348
1,483
1,1181,035
733
The Decade of the City Fringe
Figure 3c: Median per square foot price of resale private residential
properties by region and sale type
Figure 3b: Median per square foot price of new sale private residential
properties by region and sale type
Figure 3a: Median per square foot price of all private residential properties by region and sale type
Source: URA
Source: URA
Source: URA
10 PropertyGuru Singapore Property Market Outlook 2020
Back in Q4 2016, it is likely that the
average home buyer did not regard
new sale, direct-from-developer RCR
properties as being able to command a
higher price than a resale CCR property
(a median psf price of S$1,597 versus
S$1,691 respectively, as shown in Figures
3b and 3c).
In Q3 2019, however, the perception
was turned on its head: new sale RCR
properties commanded a median psf
price that was higher than that of CCR
resale homes (S$1,875 versus S$1,832).
“In 2019, a newly launched city fringe
condo is, in the eyes of your typical
buyer, seen as ‘more worth it’ than a
resale property in the city or in a prime
district,” explained Tee Khoon. New
sales for projects such as Avenue South
Residence and Park Colonial are pushing
RCR median prices to new heights.
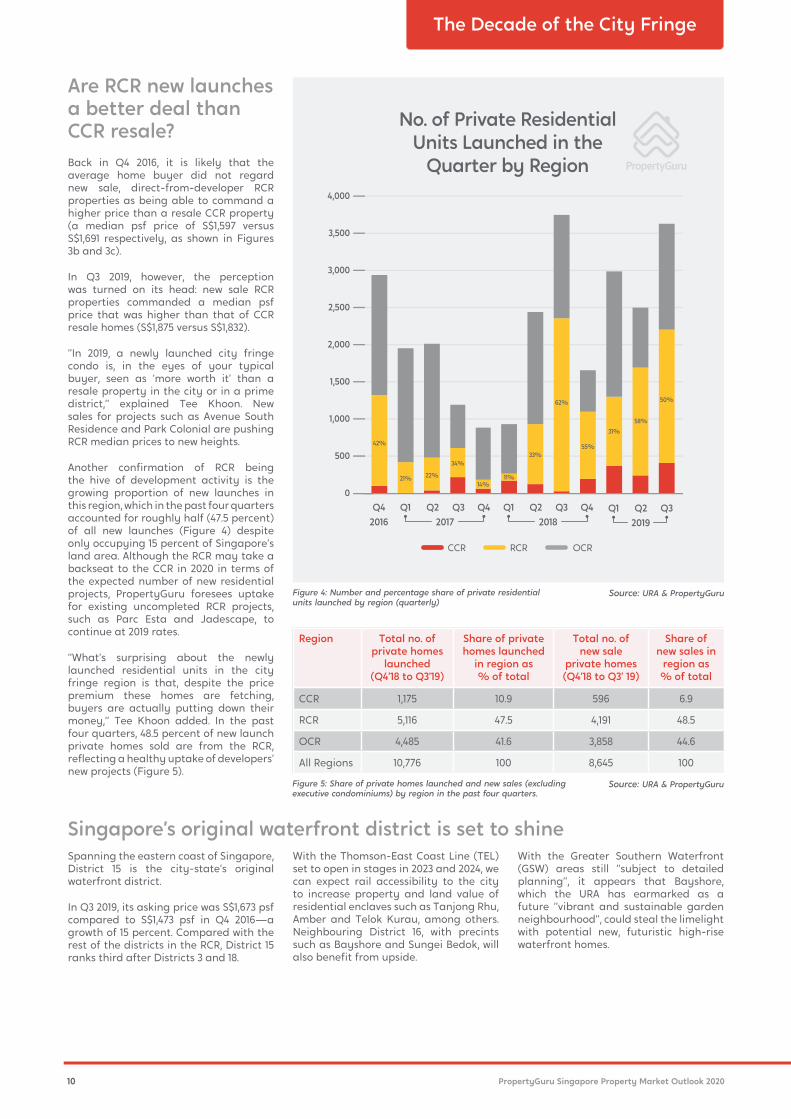
Another confirmation of RCR being
the hive of development activity is the
growing proportion of new launches in
this region, which in the past four quarters
accounted for roughly half (47.5 percent)
of all new launches (Figure 4) despite
only occupying 15 percent of Singapore’s
land area. Although the RCR may take a
backseat to the CCR in 2020 in terms of
the expected number of new residential
projects, PropertyGuru foresees uptake
for existing uncompleted RCR projects,
such as Parc Esta and Jadescape, to
continue at 2019 rates.
“What’s surprising about the newly
launched residential units in the city
fringe region is that, despite the price
premium these homes are fetching,
buyers are actually putting down their
money,” Tee Khoon added. In the past
four quarters, 48.5 percent of new launch
private homes sold are from the RCR,
reflecting a healthy uptake of developers’
new projects (Figure 5).
Are RCR new launches
a better deal than
CCR resale?
1,000
500
2,000
1,500
2,500
3,000
3,500
4,000
0
CCR RCR OCR
Q4
2016
No. of Private Residential
Units Launched in the
Quarter by Region
Q4Q1 Q2 Q3
2017
Q4Q1 Q2 Q3
2018
Q1 Q2 Q3
2019
50%62%
58%
31%
55%
33%
14%
11%
34%
42%
22%21%
Region Total no. of
private homes
launched
(Q4’18 to Q3’19)
Share of private
homes launched
in region as
% of total
Total no. of
new sale
private homes
(Q4’18 to Q3’ 19)
Share of
new sales in
region as
% of total
CCR 1,175 10.9 596 6.9
RCR 5,116 47.5 4,191 48.5
OCR 4,485 41.6 3,858 44.6
All Regions 10,776 100 8,645 100
Spanning the eastern coast of Singapore,
District 15 is the city-state’s original
waterfront district.
In Q3 2019, its asking price was S$1,673 psf
compared to S$1,473 psf in Q4 2016—a
growth of 15 percent. Compared with the
rest of the districts in the RCR, District 15
ranks third after Districts 3 and 18.
Singapore’s original waterfront district is set to shine
With the Thomson-East Coast Line (TEL)
set to open in stages in 2023 and 2024, we
can expect rail accessibility to the city
to increase property and land value of
residential enclaves such as Tanjong Rhu,
Amber and Telok Kurau, among others.
Neighbouring District 16, with precints
such as Bayshore and Sungei Bedok, will
also benefit from upside.
With the Greater Southern Waterfront
(GSW) areas still “subject to detailed
planning”, it appears that Bayshore,
which the URA has earmarked as a
future “vibrant and sustainable garden
neighbourhood”, could steal the limelight
with potential new, futuristic high-rise
waterfront homes.
The Decade of the City Fringe
Figure 4: Number and percentage share of private residential
units launched by region (quarterly)
Figure 5: Share of private homes launched and new sales (excluding
executive condominiums) by region in the past four quarters.
Source: URA & PropertyGuru
Source: URA & PropertyGuru
11PropertyGuru Singapore Property Market Outlook 2020
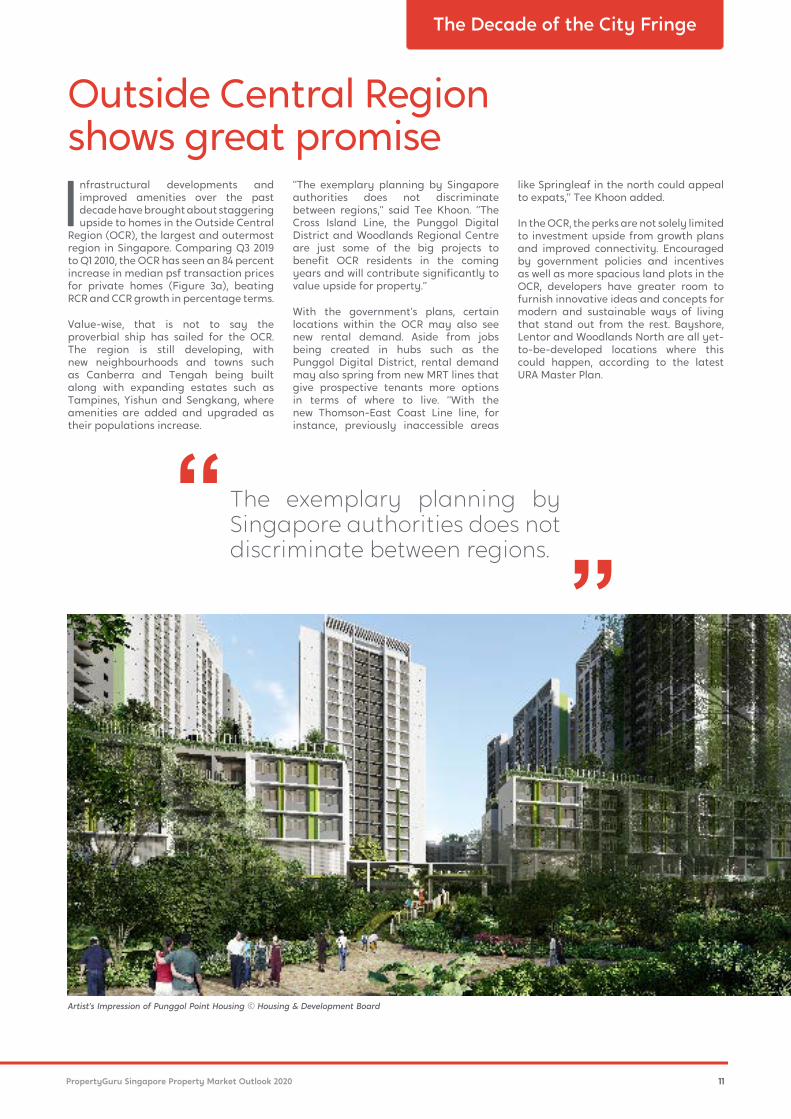
Artist’s Impression of Punggol Point Housing © Housing & Development Board
Infrastructural developments and
improved amenities over the past
decade have brought about staggering
upside to homes in the Outside Central
Region (OCR), the largest and outermost
region in Singapore. Comparing Q3 2019
to Q1 2010, the OCR has seen an 84 percent
increase in median psf transaction prices
for private homes (Figure 3a), beating
RCR and CCR growth in percentage terms.
Value-wise, that is not to say the
proverbial ship has sailed for the OCR.
The region is still developing, with
new neighbourhoods and towns such
as Canberra and Tengah being built
along with expanding estates such as
Tampines, Yishun and Sengkang, where
amenities are added and upgraded as
their populations increase.
“The exemplary planning by Singapore
authorities does not discriminate
between regions,” said Tee Khoon. “The
Cross Island Line, the Punggol Digital
District and Woodlands Regional Centre
are just some of the big projects to
benefit OCR residents in the coming
years and will contribute significantly to
value upside for property.”
With the government’s plans, certain
locations within the OCR may also see
new rental demand. Aside from jobs
being created in hubs such as the
Punggol Digital District, rental demand
may also spring from new MRT lines that
give prospective tenants more options
in terms of where to live. “With the
new Thomson-East Coast Line line, for
instance, previously inaccessible areas
like Springleaf in the north could appeal
to expats,” Tee Khoon added.
In the OCR, the perks are not solely limited
to investment upside from growth plans
and improved connectivity. Encouraged
by government policies and incentives
as well as more spacious land plots in the
OCR, developers have greater room to
furnish innovative ideas and concepts for
modern and sustainable ways of living
that stand out from the rest. Bayshore,
Lentor and Woodlands North are all yet-
to-be-developed locations where this
could happen, according to the latest
URA Master Plan.
Outside Central Region
shows great promise
The exemplary planning by
Singapore authorities does not
discriminate between regions.
The Decade of the City Fringe
12 PropertyGuru Singapore Property Market Outlook 2020
“Slowly but surely” might be the best
way to describe the developments that
are gathering pace at District 25, the
northernmost district in Singapore. In
terms of price growth, PropertyGuru
data shows that median psf asking prices
for this district declined from S$839 psf
in Q4 2016 to S$777 in Q3 2019, a fall of 7
percent in the span of three years. While
this could suggest weak demand for
private properties up north, the lack of
recent developments in the area remains
a primary contributing factor.
This could be set to change, as plans
to transform the northern region are
implemented with the opening of two
new MRT stations in Woodlands towards
the end of 2019. This will kickstart a series
of developments: a new regional centre
and the terminus of the Singapore-
Johor Bahru Rapid Transit System (RTS)
that will provide a smoother connection
to Johor Bahru in Malaysia than the
Causeway currently allows.
Will the North regain lost ground?
While the RTS could increase the appeal
of living in and around Woodlands, the
presence of the rail link on its own may
not necessarily reverse the direction of
asking prices in the area, which has seen
four consecutive quarters of decrease
starting from Q4 2018.
Of greater consequence will be the
completion of the TEL, which will run to
the city by 2021 and reduce travel time to
the CBD by 15 minutes or more.
In the longer term, property value
upside would depend heavily on the
success of Woodlands Regional Centre,
a 100-hectare commercial hub that the
government hopes to complete within
the next 15 years. If all goes to plan,
the ‘far north’ will be transformed into
a thriving business and lifestyle node
with 10,000 new homes, pulling in new
residents and likely pushing property
value northwards.
% of Singaporeans
feel proximity to public
transportation networks
is an important factor
when choosing a home.
Source: PropertyGuru Consumer
Sentiment Survey H1 2019
78
The Decade of the City Fringe
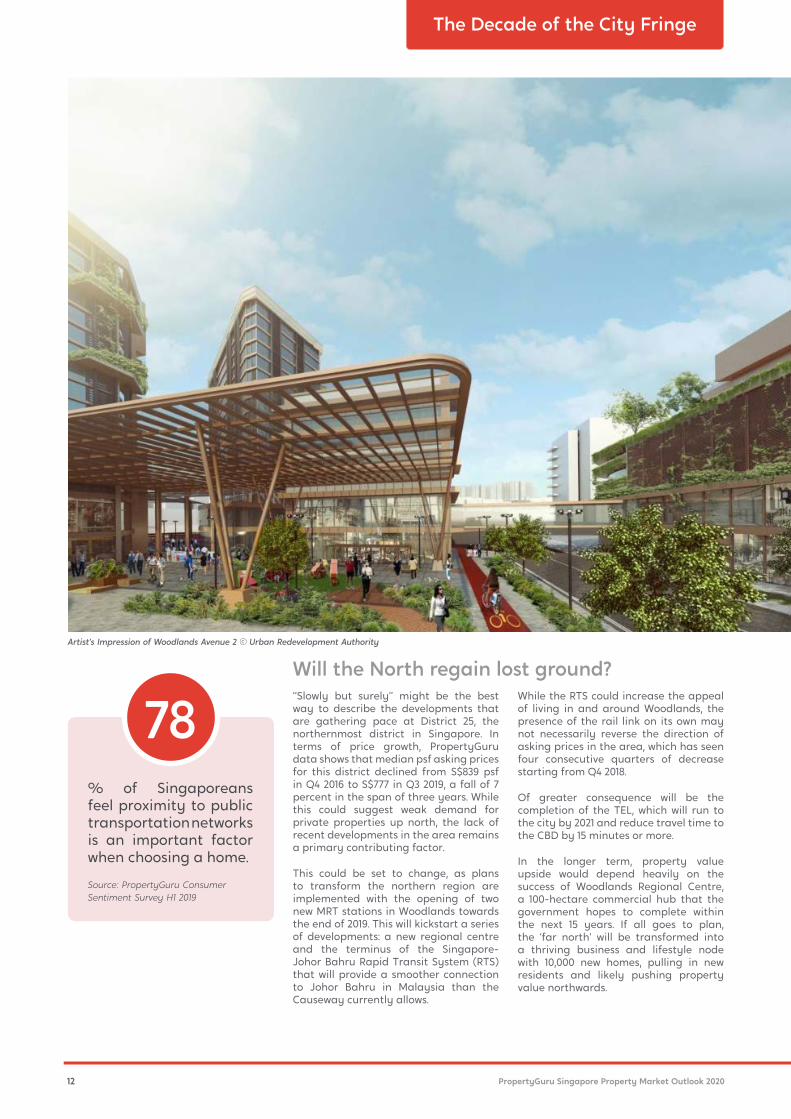
Artist’s Impression of Woodlands Avenue 2 © Urban Redevelopment Authority
13PropertyGuru Singapore Property Market Outlook 2020
With no less than eight projects
to be launched in the Core
Central Region (CCR) in 2020,
the performance of these will
be a litmus test of consumer demand
at the higher end of the price range.
Quarterly figures in the past decade
show that foreign buyers (including
Permanent Residents) typically account
for 30 to 35 percent of all property
purchases in the CCR.
Meanwhile, PropertyGuru expects CCR
real estate—99-year leasehold
properties included—to gravitate
towards the role of secure investment
assets for both local and foreign buyers.
“Decentralisation may shift supporting
business functions out of the traditional
downtown, but the CBD will remain
the financial hub of Singapore for the
foreseeable future, and the prestige of
Core Central Region real estate will likely
remain strong along with rental demand
from high-earning professionals,” said
Tee Khoon.
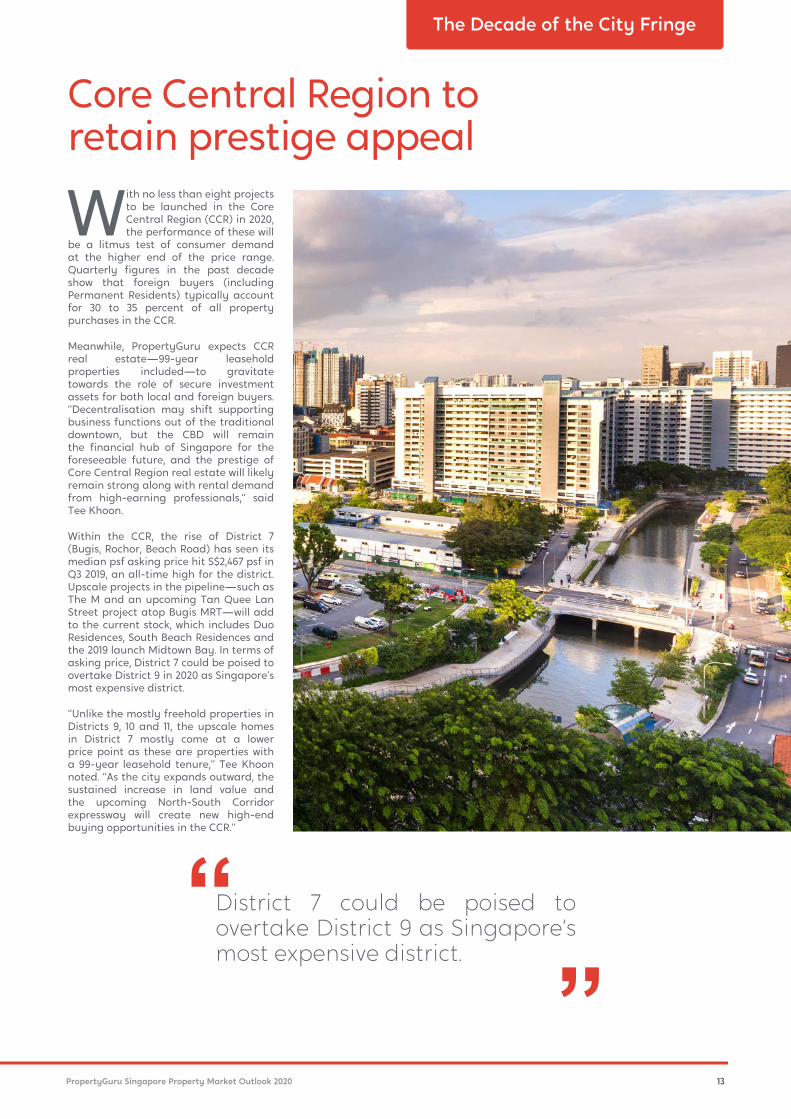
Within the CCR, the rise of District 7
(Bugis, Rochor, Beach Road) has seen its
median psf asking price hit S$2,467 psf in
Q3 2019, an all-time high for the district.
Upscale projects in the pipeline—such as
The M and an upcoming Tan Quee Lan
Street project atop Bugis MRT—will add
to the current stock, which includes Duo
Residences, South Beach Residences and
the 2019 launch Midtown Bay. In terms of
asking price, District 7 could be poised to
overtake District 9 in 2020 as Singapore’s
most expensive district.
“Unlike the mostly freehold properties in
Districts 9, 10 and 11, the upscale homes
in District 7 mostly come at a lower
price point as these are properties with
a 99-year leasehold tenure,” Tee Khoon
noted. “As the city expands outward, the
sustained increase in land value and
the upcoming North-South Corridor
expressway will create new high-end
buying opportunities in the CCR.”
Core Central Region to
retain prestige appeal
The Decade of the City Fringe
District 7 could be poised to
overtake District 9 as Singapore’s
most expensive district.
14 PropertyGuru Singapore Property Market Outlook 2020
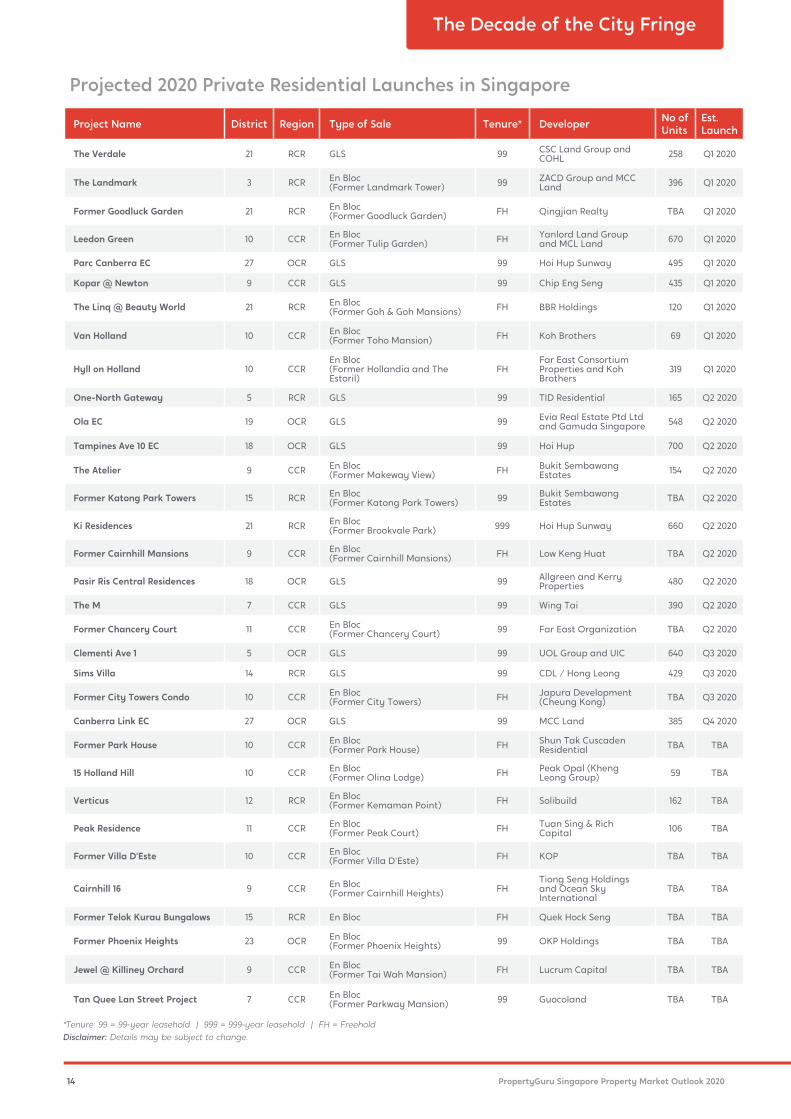
Projected 2020 Private Residential Launches in Singapore
Project Name District Region Type of Sale Tenure* DeveloperNo of
Units
Est.
Launch
The Verdale 21 RCR GLS 99CSC Land Group and
COHL258 Q1 2020
The Landmark 3 RCREn Bloc
(Former Landmark Tower)99
ZACD Group and MCC
Land396 Q1 2020
Former Goodluck Garden 21 RCREn Bloc
(Former Goodluck Garden)FH Qingjian Realty TBA Q1 2020
Leedon Green 10 CCREn Bloc
(Former Tulip Garden)FH
Yanlord Land Group
and MCL Land670 Q1 2020
Parc Canberra EC 27 OCR GLS 99 Hoi Hup Sunway 495 Q1 2020
Kopar @ Newton 9 CCR GLS 99 Chip Eng Seng 435 Q1 2020
The Linq @ Beauty World 21 RCREn Bloc
(Former Goh & Goh Mansions)FH BBR Holdings 120 Q1 2020
Van Holland 10 CCREn Bloc
(Former Toho Mansion)FH Koh Brothers 69 Q1 2020
Hyll on Holland 10 CCR
En Bloc
(Former Hollandia and The
Estoril)
FH
Far East Consortium
Properties and Koh
Brothers
319 Q1 2020
One-North Gateway 5 RCR GLS 99 TID Residential 165 Q2 2020
Ola EC 19 OCR GLS 99Evia Real Estate Ptd Ltd
and Gamuda Singapore548 Q2 2020
Tampines Ave 10 EC 18 OCR GLS 99 Hoi Hup 700 Q2 2020
The Atelier 9 CCREn Bloc
(Former Makeway View)FH
Bukit Sembawang
Estates154 Q2 2020
Former Katong Park Towers 15 RCREn Bloc
(Former Katong Park Towers)99
Bukit Sembawang
EstatesTBA Q2 2020
Ki Residences 21 RCREn Bloc
(Former Brookvale Park)999 Hoi Hup Sunway 660 Q2 2020
Former Cairnhill Mansions 9 CCREn Bloc
(Former Cairnhill Mansions)FH Low Keng Huat TBA Q2 2020
Pasir Ris Central Residences 18 OCR GLS 99Allgreen and Kerry
Properties480 Q2 2020
The M 7 CCR GLS 99 Wing Tai 390 Q2 2020
Former Chancery Court 11 CCREn Bloc
(Former Chancery Court)99 Far East Organization TBA Q2 2020
Clementi Ave 1 5 OCR GLS 99 UOL Group and UIC 640 Q3 2020
Sims Villa 14 RCR GLS 99 CDL / Hong Leong 429 Q3 2020
Former City Towers Condo 10 CCREn Bloc
(Former City Towers)FH
Japura Development
(Cheung Kong)TBA Q3 2020
Canberra Link EC 27 OCR GLS 99 MCC Land 385 Q4 2020
Former Park House 10 CCREn Bloc
(Former Park House)FH
Shun Tak Cuscaden
ResidentialTBA TBA
15 Holland Hill 10 CCREn Bloc
(Former Olina Lodge)FH
Peak Opal (Kheng
Leong Group)59 TBA
Verticus 12 RCREn Bloc
(Former Kemaman Point)FH Solibuild 162 TBA
Peak Residence 11 CCREn Bloc
(Former Peak Court)FH
Tuan Sing & Rich
Capital106 TBA
Former Villa D’Este 10 CCREn Bloc
(Former Villa D'Este)FH KOP TBA TBA
Cairnhill 16 9 CCREn Bloc
(Former Cairnhill Heights)FH
Tiong Seng Holdings
and Ocean Sky
International
TBA TBA
Former Telok Kurau Bungalows 15 RCR En Bloc FH Quek Hock Seng TBA TBA
Former Phoenix Heights 23 OCREn Bloc
(Former Phoenix Heights)99 OKP Holdings TBA TBA
Jewel @ Killiney Orchard 9 CCREn Bloc
(Former Tai Wah Mansion)FH Lucrum Capital TBA TBA
Tan Quee Lan Street Project 7 CCREn Bloc
(Former Parkway Mansion)99 Guocoland TBA TBA
*Tenure: 99 = 99-year leasehold | 999 = 999-year leasehold | FH = Freehold
Disclaimer: Details may be subject to change.
The Decade of the City Fringe

15
KEy trEndS

16 PropertyGuru Singapore Property Market Outlook 2020
Increased grant amounts
for resale flats will give
sellers more leverage in
their asking prices.
Key Trends
The Singapore luxury property
market, which performed well
above expectations in 2019, is
likely to do the same next year as
new launches continue to hit the market.
At the same time, intense competition
among developers may curb price
increases for higher-end properties.
“We will continue to see an inflow of
foreign buyers in the Singapore luxury
In 2019, the government has expressed
clear plans to make Build-to-Order
(BTO) public housing more readily
available in mature estates, giving
first-time home buyers access to more
affordable housing options within such
estates. “Consumers who want to live in
mature estates are typically limited to
buying resale flats from the open market,
which usually comes at a higher price
point than BTO flats,” said Tee Khoon.
In the next five years, flat buyers can
expect the Housing and Development
Board (HDB) to launch and build more
BTO flats in mature estates. The HDB
has already revealed it will build around
5,000 BTO flats in the city-fringe location
of Queenstown by 2027 and another 1,500
units in Bishan, an estate located within
the RCR, by 2025.
Buoyant foreign
buying to continue
New mature estate
flats unlikely to dent
resale demand
market. Investors see Singapore as
a safe and stable country for wealth
preservation via real estate,” said Tee
Khoon. “Compared to the likes of London,
Sydney and New York, Singapore is also a
relatively cheaper property destination.”
In the ultra-luxury property market
(transactions in the price range of S$10
million and above), interest from Chinese
national buyers is expected to continue.
As BTO flats are offered by the HDB at
a lower-than-market rate, more BTO
launches in mature estates could result
in a slight price moderation of resale
flats in the same estates. However,
PropertyGuru does not expect demand
for mature estate resale flats, especially
those with good locational attributes, to
fall. Supporting our view is the recently
increased grant amount for resale flats,
which gives sellers more leverage in their
asking prices.
Additionally, the increase in income
ceiling for BTO and EC homes will also
bring about a new pool of demand. BTO
flats in mature estates are likely to be
multiple times oversubscribed, funneling
first-time buyers into the resale market.
Artist’s Impression of Queenstown
© Housing & Development Board
© Wallich Residence
17PropertyGuru Singapore Property Market Outlook 2020
Despite many positives in the
Singapore property market,
possible headwinds in the
form of muted economic
growth and a possible US-China trade
war could dampen home buying
sentiment. The Monetary Authority of
Singapore (MAS) released a report in
November 2019 advising home buyers
to be more prudent in their purchasing
decisions, on the back of an increasing
number of unsold units and more new
launches slated for 2020.
The MAS report also noted that property
prices have moved more in line with
economic fundamentals compared
with the first half of last year following
the additional cooling measures of July
2018. The number of housing loans, which
rose in the past two quarters, are in line
with the increase in transaction activity,
while buyers’ financial leverage remains
lower than the period before last year’s
cooling measures kicked in.
Of greater concern is affordability
of housing beyond HDB flats. “What
needs to improve is wage growth, which
should ideally keep up with property
price increases to remain affordable for
aspirational home buyers and facilitate
upward mobility of Singaporeans
upgrading from HDB flats to condos,”
said Tee Khoon. Low wage growth,
coupled with a tight loan-to-value (LTV)
ratio, could also impact buyers’ ability
to make downpayments and reduce
affordability overall. However, it is not
all gloom and doom. Interest rates are
seeing a downward trend and this is
likely to continue in the mid- to long-
term. This is sure to bring cheer to
buyers grappling with issues around
affordability. Even current buyers would
get an opportunity to evaluate loan
refinancing options that will ensure long-
term financial sustainability.
In the past three years, while the median
psf asking prices of non-landed private
property in Singapore increased by 12
percent, gross monthly income from
work has only increased by 7 to 8 percent,
according to Ministry of Manpower
(MOM) statistics. With GDP growth
projections subdued for the year ahead
and possible headwinds, the affordability
gap for private homes could further
widen for Singaporeans.
Macroeconomic concerns
need to be answered
Key Trends

PropertyGuru Singapore Property Market Outlook 2020
PropertyGuru.com.sg was launched in 2007. It revolutionised the Singapore property market by taking it
online and making property search transparent for everyone. For the past 12 years, PropertyGuru.com.sg
has been helping property seekers in Singapore make confident property decisions. With over 5 million
monthly visits* and more than 70%** consumer market share, PropertyGuru is the No.1 destination for
Singapore homeseekers.
It is part of PropertyGuru Group, Southeast Asia’s leading property technology company and the preferred
destination for over 23 million property seekers to find their desired home, every month. PropertyGuru
Group of companies empower property seekers with the widest option of over 2.4 million homes, in-depth
insights and solutions that enable them to make confident property decisions across Singapore, Malaysia,
Thailand, Indonesia and Vietnam.
Over the decade, the Group has grown from a regional property media powerhouse to a high-growth
technology company with a robust portfolio comprising: leading property portals across its core markets;
award-winning mobile apps; a SaaS-based sales automation solution, ‘PropertyGuru FastKey’, which is
used by property developers to enable end-to-end project management from launch to sales conversion;
one of the largest property awards business in the region, ‘PropertyGuru Asia Property Awards’, which
sources entries from fourteen markets across Asia
For more information, please visit propertyguru.com.sg; linkedin.com/company/propertyguru
*Source – Google Analytics data, Jan-June 2019
**Source - SimilarWeb - Relative Engagement Market Share, average of Jan-June 2019]
About PropertyGuru
19
Disclaimer
This publication has been prepared for general guidance on matters of
interest only, and does not constitute professional advice. You should not act
upon the information contained in this publication without obtaining specific
professional advice. No representation or warranty (express or implied) is
given as to the accuracy or completeness of the information contained in
this publication, and, to the extent permitted by law, PropertyGuru Group
does not accept or assume any liability, responsibility or duty of care for any
consequences of you or anyone else acting, or refraining to act, in reliance on
the information contained in this publication or for any decision based on it.
PropertyGuru Group
REG PropertyGuruGroup.com | AsiaPropertyAwards.com
AsiaRealEstateSummit.com
SG PropertyGuru.com.sg | CommercialGuru.com.sg
MY PropertyGuru.com.my
ID Rumah.com | RumahDijual.com
TH DDproperty.com
VN Batdongsan.com.vn
Contact
For media or press enquiries, or to understand more about
the PropertyGuru Singapore Property Market Outlook 2020,
please email [email protected].
© 2019 PropertyGuru Group. All rights reserved.

PropertyGuru Singapore Property Market Outlook 2020
Expansion of Singapore’s
MRT Network
77
145 No. of stations
2019
2010
Asking prices for private homes
in Woodlands may have declined
by 7 percent in the past three
years, but the new MRT stations,
Woodlands Regional Centre and
the Singapore-Johor Bahru rail link
could reverse the trend.
D25
The introduction of Grade A offices
in 2019 may lead to further property
value uplift, considering that the URA
has plans for the further growth of
Paya Lebar Central.
D14
One of the most transformed
districts of the decade with
the rapid development of
West Sengkang.
D28
Health City Novena, a mega
17-hectare modern integrated
healthcare complex, is currently
under development.
D11
At 30%, this is the best performing
district in Singapore in terms
of growth in median psf asking
price over the past three years.
D7
Experiencing a growth of 28% in
median finalised per square foot (psf)
asking price over the past three years,
this Rest of Central Region district is
likely to see further price growth with
four new residential projects in 2020
and an integrated hub in the works.
D21
Canberra, which is on an exciting
growth trajectory, will see the launch
of two executive condominiums in 2020.
D27Growth Areas in Singapore
> +25%
+16 to 20%
+12 to 15%
+6 to 10%
+1 to 5%
0 to -10%
Percentage change in
median finalised psf
asking price by district
over the past 3 years
Source: PropertyGuru
A new executive condo at Tampines
will no doubt attract many suitors,
but stealing the limelight will be the
launch of a mixed-use development at
Pasir Ris Central.
D18