Singapore Property Market Index PropertyGuru Singapore Property Market Index Q1 2020 1 From this...
20
Q1 2020 Singapore Property Market Index
Transcript of Singapore Property Market Index PropertyGuru Singapore Property Market Index Q1 2020 1 From this...

Q1 2020
Singapore
Property Market Index

2 PropertyGuru Singapore Property Market Index Q1 2020
Contents
Executive Summary1
Get The GuruView2
Price Index Overview3
Supply Index Overview4
District Roundup5
About PropertyGuru Group10
Methodology9
Quarterly Insights 6
Looking Ahead7
About This Report8

3PropertyGuru Singapore Property Market Index Q1 2020
Executive
Summary
The PropertyGuru Singapore
Property Market Index Q1 2020
looks at the key property data
points that rounded out 2019 and
illustrates the trends that may unfold
as we enter the first quarter of a new
decade.
Q1 2020 has presented the unforeseen
macro-level impact of the Coronavirus
Disease 2019 (COVID-19). And whilst the
overall impact is still being assessed each
day, we can look to draw a parallel to the
SARS outbreak 17 years ago. The impact
of SARS in Singapore was first felt in
November 2002, and it was only in May
2004 that conditions stabilised. During
this period, there was no significant
property price correction - overall private
home prices only softened by 2.3% from
November 2002 to May 2004, based on
URA residential price index recorded
during this period. Furthermore, the total
sales volume in primary and secondary
markets staged a steep recovery shortly
thereafter.
Given the proactive precautious
implemented by government, along with
the learnings from the SARS outbreak,
PropertyGuru does not expect the prices
Q4 2019 Price Index
110.7 (Down 0.7%)
Q4 2019 Supply Index
78,184 (Up 13.3%)
Q4 2019 Asking Price
$1,566 psf
of residential real estate to significantly
drop, and predicts that the community
will resume property hunting shortly
after COVID-19 begins to subside.
In Q4 2019, for the second successive
quarter, asking prices in the non-
landed private residential market have
continued to taper slightly downwards.
However, an increasing number of
homeowners are showing a willingness
to sell, as the number of listings have
increased.
Despite the quarter-on-quarter (QoQ)
downward trend in listing prices, a
prosperous schedule of new project
launches, local infrastructure and
government planning (including the
February budget address), could
contribute to an upswing in asking
prices across Singapore in Q1, 2020. This
is subject to, and perhaps in line with the
COVID-19 subsiding.
This report will dive deeper into these
trends, the districts which are likely
to benefit from the new MRT stations
coming into operation, as well as on top
selling condominiums and new launches
to watch out for this quarter.

4 PropertyGuru Singapore Property Market Index Q1 2020
Property prices in 2019 stabilised
following the July 2018 round
of cooling measures, which saw
Additional Buyer’s Stamp Duty
(ABSD) increase, and property loan-to-
value (LTV) borrowing ratios tightened.
Taking the four quarters of 2019 on
average, overall median asking prices
for private property in Singapore have
attenuated by 3% compared to the peak
in Q2 2018.
Asking prices in 2019 would have trended
slightly upwards were it not for the
influx of units from newly launched
condominiums during the year—a result
of the collective sale frenzy in 2017 and
2018. Once enough of the new supply is
absorbed, PropertyGuru expects prices
overall to once again trend upward
in 2020, on the key condition that a
borrower-friendly low interest rate
environment prevails.
A Recap of 2019
Property Price Index
(Base Quarter = Q4 2016 = 100.0)
111.6 Q1 2019
111.7 Q2 2019
111.5 Q3 2019
110.7Q4 2019

5PropertyGuru Singapore Property Market Index Q1 2020
Asking prices in the non-landed private
residential market continued to taper
slightly downwards for the second
successive quarter. However, the number
of listings increased, with a growing
number of homeowners showing a
willingness to sell. Investors in particular
may also be open to sub-sale, increasing
competition for buyers in the market.
Five of the top ten best-selling
uncompleted condominiums in the
quarter were launched prior to 2019;
developments that are close to MRT
stations are consistently in high demand.
In 2020, new launches located within
walking distance of an existing or future
MRT station will continue to perform
above market expectations.
With new MRT stations on the Thomson-
East Coast Line (TEL) becoming
operational from January 2020 onwards,
PropertyGuru expects to see an upswing in
asking prices for resale private residential
properties within walking distance from
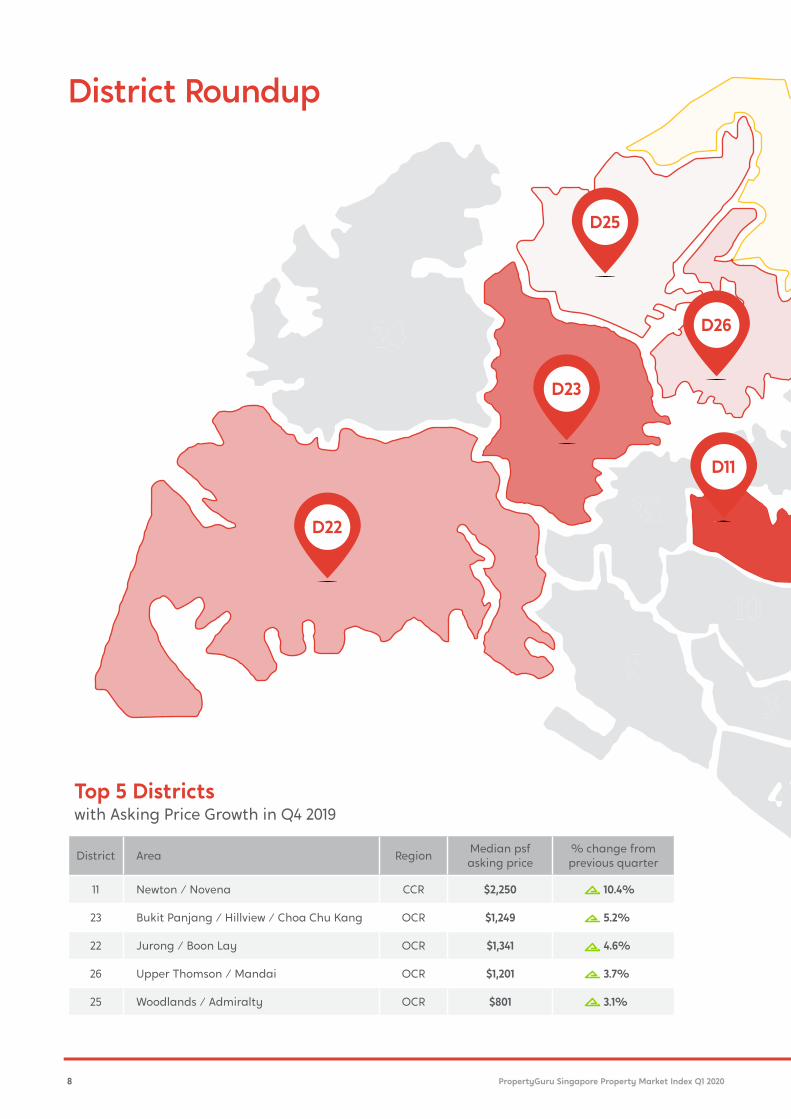
the new stations. District 25 and 26 both
benefit from new TEL stations and are two
of the top five districts in the past quarter
with the highest percentage increase in
median per square foot asking price.

6 PropertyGuru Singapore Property Market Index Q1 2020
1 From this edition of the SPPI onwards, the index will use Q4 2016 as the Base Quarter. The index was previously computed using Q1 2015 as the Base Quarter.
2 In figure, the median finalised per square foot (psf) asking price for non-landed private residential property is $1,566 for Q4 2019, taken from across the 28 postal districts in Singapore. In subsequent
analysis we have omitted two postal districts—6 and 24—as they have either fewer than the number of listings required (a share of 0.1% or more of total) and/or too few projects listed (less than three).
3 The PropertyGuru Singapore Property Market Index shows seller optimism and indicates the price level that developers and homeowners feel that they can fetch for their respective properties.
An increase in the Property Market Index (PMI) may demonstrate buoyancy of sentiment while a decrease may indicate a moderation of expectations
Price Index Overview
The PropertyGuru Singapore
Property Price Index (SPPI)1,
which tracks asking prices in the
non-landed private residential
market, fell by 0.7% to 110.7 in the previous
quarter2. This figure, while lower than the
pre-July 2018 cooling measures high of
115.2, was still higher than Q1 2018 (109.5)
at a time when the Singapore property
market was showing signs of heating up.
Even as the index fell QoQ in Q4 2019,
the Urban Redevelopment Authority
(URA) price index for the same quarter
showed a 0.5% increase that was fuelled
primarily by new housing stock. Assessing
the statistics, Tan Tee Khoon, Country
Manager-Singapore at PropertyGuru,
noted that “the Singapore property
market can be viewed as relatively
buoyant in the last quarter, considering
the prevailing dampened global
economic outlook.”
Although the Q4 2019 index indicated
that the overall asking prices of non-
landed private property in Singapore
have continued to marginally decrease,
PropertyGuru believes that this correction
is not excessive and does not indicate
weakened buyer sentiment. Instead,
the moderation can be reasonably
attributed to increased activity on the
part of sellers in the condominium resale
market. PropertyGuru additionally
forecasts prices for new launch private
residential properties to remain resilient
and unlikely to be revised downwards
this year, even with 30 to 40 new launches
scheduled to be released.
Explaining why prices of newly launched
condominiums are likely to hold steady
and even increase, Tee Khoon noted
that buyer preference remains skewed
towards new launches, and added that
“developers on average still have a four-
year timeframe to sell all units,” which
they will likely view as achievable given
that there is persistent buyer demand
for property in Singapore, coupled with
the resilience of the Singapore property
market and the government’s continued
resolve to preserve its stability in the face
of global headwinds.
QoQ Property Market Index & Supply Index
100
120
140
160
180
20
40
60
80
200
0
Property Market Index3 Supply Index
Q1 Q2 Q3 Q4
2019
Q1 Q2 Q3 Q4
2018
Q1 Q2 Q3 Q4
2017
134.24
110.72
Q4
2016
Source: PropertyGuru

7PropertyGuru Singapore Property Market Index Q1 2020
Property Terms
Explained
“Sub-sale”
The URA defines a sub-sale as
“the sale of a unit by one who
has signed an agreement to
purchase the unit from a
developer or a subsequent
purchaser before the
issuance of the Certificate
of Statutory Completion
and the Subsidiary Strata
Certificates of Title or the
Certificates of Title for all the
units in the development”.
More simply, a sub-sale is
the secondary sale of a unit
before it is completed.
With infrastructural
improvements, such
as the Thomson-
East Coast MRT
Line coming into
operation, some
owners within close
proximity to these
new stations may be
tempted to cash out.
Supply Index Overview
The PropertyGuru Singapore
Property Supply Index (SPSI),
which tracks the number of non-
landed private residential listings
posted on PropertyGuru, recorded a gain
of 13.3% from 120.2 in Q3 2019 to 132.2 in Q4
2019. In absolute numbers, the recorded
number of listings in Q4 2019 was 78,184,
compared to 68,979 in Q3 2019—an
increase of 9,205 listings. The number
of listings in Q4 2019 indicates a peak in
supply not seen since Q3 2017.
Meanwhile, Q4 2019 URA statistics
indicated a 10.3% reduction in vacancy
rate of completed private residential
units and a 3.5% reduction in the number
of planned and under construction
private residential units in the pipeline.
This supports the observation that resale
units newly placed on the market are
the main contributors to the growth of
listings in the past quarter (as opposed
to newly launched, uncompleted units).
Addressing the possible increase in the
number of existing owners putting up
their private residential units for sale,
or even sub-sale, Tee Khoon believes
that investors might be responding to
opportunities both intrinsic and extrinsic
to the property market. “It is reasonable
to suggest that with infrastructural
improvements, such as the Thomson-East
Coast MRT Line coming into operation in
certain locations this year, some owners
may be tempted to cash out,” he said.
8 PropertyGuru Singapore Property Market Index Q1 2020
Top 5 Districts
with Asking Price Growth in Q4 2019
District Area RegionMedian psf
asking price
% change from
previous quarter
11 Newton / Novena CCR $2,250 10.4%
23 Bukit Panjang / Hillview / Choa Chu Kang OCR $1,249 5.2%
22 Jurong / Boon Lay OCR $1,341 4.6%
26 Upper Thomson / Mandai OCR $1,201 3.7%
25 Woodlands / Admiralty OCR $801 3.1%
District Roundup
D25
D26
D23
D22
D11

9PropertyGuru Singapore Property Market Index Q1 2020
Top 5 Districts
with Asking Price Moderation in Q4 2019
District Area RegionMedian psf
asking price
% change from
previous quarter
7 Bugis / Rochor / Beach Road CCR $2,622 14.4%
9 Orchard / River Valley CCR $2,623 5.4%
1 Marina Bay / Raffles Place CCR $2,371 4.7%
17 Changi / Loyang OCR $979 4.4%
27 Sembawang / Yishun OCR $981 2.9%
Legend:
CCR – Core Central Region
RCR – Rest of Central Region
OCR – Outside Central Region
Asking Price Growth
Asking Price Moderation
High
High
Low
Low
D27
D17
D9D7
D1

10 PropertyGuru Singapore Property Market Index Q1 2020
External
headwinds in
2020, such as the
economic effects
of the COVID-19
outbreak, may
dampen property
buying sentiments.
At the same time, certain districts also
appear to have hit a ceiling regarding
price growth. According to PropertyGuru
data, the median psf asking price in
District 28 (Seletar / Yio Chu Kang), which
had experienced one of the biggest
increases in median asking price over
the past three years, appears to have
plateaued in 2019.
Diving deeper into the data, median psf
asking prices for District 28 (D28) non-
landed private homes in Q4 2016 stood
at $976. Fast forward to Q1 2019, and
that figure has climbed 26.9% to $1,239.
Located in the Outside of Central Region
(OCR) of Singapore, D28’s rapid growth
in property value largely owes itself to
amenities, such as Seletar Mall, that
have accompanied the area’s fast-paced
population increase on land that was
mostly undeveloped.
In Q1 2020, newly completed private
residential properties could contribute
to rising vacancy rates, which could in
turn exert further downward pressure
on asking prices. Recently completed
condominiums with a significant number
of unsold balance units could cause prices
of older homes in the vicinity to stagnate,
especially given the fact that the condo
resale market is facing keen competition
from new launches.
Another possible downward pressure on
asking prices could be the increase in
the number of investors looking to cash
out their property purchase following
the lapse of their respective three-year
Seller Stamp Duty (SSD) liability periods.
“There could be investors out there who
Today, most of these value-adding
amenities are complete, fulfilling the
upside potential in what is now a
maturing, family-friendly precinct. The
reality, however, is that the D28 private
housing stock has not been cleared, as
evidenced by D28’s number of recorded
listings on PropertyGuru, which has
increased 80% over the past three years.
Putting it simply, supply in D28 has
outpaced demand. Under normal
circumstances, this should concern
owners of properties in D28. Yet, for the
owners of the recently completed High
Park Residences, a significant rise in
property value despite a surfeit in supply
means that the time is ripe for profit
taking. This is evidenced by the 32 sub-
sale and 1 resale transactions for the
project in Q4 2019.
Quarterly Insights
Further downward pressures likely
Price plateau could prompt profit-taking
look at the current market and feel
that the value of their properties will
not appreciate as much as it did over
the past few years, and may consider
liquidating their assets,” said Tee Khoon.
Further gaps in the property market—
highlighted in this report—show that
the Singapore property market does not
currently present a level playing field
for sellers and developers. “Although the
total number of unsold private residential
units in the pipeline have decreased for
the third consecutive quarter, external
headwinds in 2020, such as the economic
effects of the COVID-19 outbreak, may
dampen property buying sentiments,”
Tee Khoon noted.
Source: OKP Holdings Limited

11PropertyGuru Singapore Property Market Index Q1 2020
Compared to Q4 2018, which was the
immediate aftermath of the July 2018
cooling measures, market activity in Q4
2019 has picked up. Year-on-year, the
index has conveyed a decrease in the
overall asking price of non-landed private
residential properties by -1.35%. More
favourable asking prices appear to have
played a part in increasing the volume of
total transactions from 3,387 in Q4 2018 to
4,306 in Q4 2019, which translates to 27.1%
in percentage terms.
For what is traditionally the quietest
quarter of the year, Tee Khoon noted
that the number of Q4 2019 buyers have
shown a year-on-year increase for three
reasons. “First is the shared opinion that
prices are unlikely to fall any further,
which is backed by the rising URA price
index. The second reason is because of
the favourable interest rate environment,
which has moderated over the course of
2019. The third reason is because buyers
who are looking to purchase their second
property will have psychologically priced
in the Additional Buyer’s Stamp Duty,
which may have originally held them
back from entering the market.”
That said, keen competition for new
launches has meant that not every
developer with a new project has been
able to turn buyers’ heads. As a matter
of fact, out of the top 10 uncompleted
private residential projects by units sold
in Q4 2019, only five were projects that
were launched in 2019. Clearly, a handful
of older uncompleted projects have
demonstrated massive staying power.
Typically, these projects are also backed
by developers with more financial clout,
who are in a better position to offer
discounts that can lure buyers away from
the more recent launches.
Another notable aspect of the quarter’s
best performing new launch condos is the
fact that seven out of the 10 developments
are within a 10-minute walking distance
of an MRT station. More significantly, five
of these projects are within a five-minute
walking distance to the nearest MRT
station. With the growing MRT network,
Tee Khoon felt that buyers are setting a
higher bar for what is considered “near to
an MRT station”. Particularly, integrated
developments that are near an MRT
station are likely to be highly sought
after by buyers in 2020.
For projects and units that do not possess
the MRT proximity attribute, developers
and sellers will likely find it much more
challenging to move units as demand
for these projects remains modest.
By and large, PropertyGuru believes
that buyers will continue to gravitate
towards uncompleted projects, especially
larger-scale developments with more
comprehensive facilities.
The surprising stars of Q4 2019
Staying Power
Buyers aren’t only going for the newest launches on the block
Ranking by
units soldProject name
Units sold
in Q4 2019Launched
More than
50% sold?
1 Parc Esta 238 Q4 2018 Yes
2 Sengkang Grand Residences 235 Q4 2019 No
3 Treasure at Tampines 161 Q2 2019 No
4 One Holland Village Residences 114 Q4 2019 No
5 Jadescape 109 Q3 2018 No
6 Parc Clematis 105 Q3 2019 No
7 Avenue South Residence 91 Q3 2019 No
8 Riverfront Residences 87 Q2 2018 Yes
9 Stirling Residences 87 Q3 2018 Yes
10 Parc Botannia 84 Q4 2017 Yes
Year-on-year, the
index has conveyed
a decrease in the
overall asking
price of non-landed
private residential
properties by -1.35%.

12 PropertyGuru Singapore Property Market Index Q1 2020

13PropertyGuru Singapore Property Market Index Q1 2020
Project Watch
High Park
Residences
District 28
No. of units: 1,376
Developer: CEL Development
Q3 2015 - Launch Quarter
No. of units transacted
137 (All new sale)
Average psf price of sold unit
$959
Q4 2019
No. of units transacted
33 (32 sub-sale, 1 resale)
Average psf price of sold unit
$1,226*
*27.8% increase from Q3 2015
Source: Heeton Holdings Ltd

14 PropertyGuru Singapore Property Market Index Q1 2020
District 11 (Newton/Novena), part of the
CCR in Singapore, posted the highest
QoQ increase out of all districts in Q4
2019. The increase of 10.2% was largely
due to the transactions of the newly-
launched Neu at Novena and Pullman
Residences—both freehold projects.
In the resale market, District 11’s 89
transactions in Q4 2019 is on par with
the 88 transactions recorded in the same
quarter in 2018. PropertyGuru foresees
demand for homes in D11 to remain
buoyant given the prospect of key future
amenities (Health City Novena and North
South Corridor) and rising private home
prices in neighbouring District 10.
District 26 (Mandai/Upper Thomson)
may have seen modest median psf
asking price growth in Q4 2019, but by the
same measure the district has recorded
the biggest year-on-year growth in
Singapore: 21.7%.
This upswing in asking prices in D26 is
not by accident nor coincidence. The
district will be home to the two upcoming
Thomson-East Coast Line (TEL) MRT
stations of Springleaf and Lentor, which
which will start operating from this year
onwards. The opening of the two stations,
which will provide residents with a direct
MRT link to the city, is a gamechanger for
these neighbourhoods, which previously
were outside walking distance of an MRT
station.
By 2026, the completion of the North
South Corridor expressway could further
boost property value in D26.
Singled out for special mention in the
PropertyGuru Market Outlook 2020, the
city fringe district of District 14 (Paya
Lebar / Eunos / Geylang) has seen
median psf asking prices jump by 14.0%
over the past three years. The increase
in property value is largely spurred by
commercial and office developments
centred around Paya Lebar, and the
potential of the area to further grow as a
satellite business district.
In terms of property value, 2020 will be a
test of whether D14’s good fortunes will
continue. Sustained buyer appetite for
Parc Esta and Arena Residences, both
with more than 70% of units sold, will be
positive news for the district. Prospective
investor-landlords are likely to be
keeping a keen eye on the rental demand
of the district before taking the plunge,
given that the imminent completion of
Park Place Residences will set a new bar
for rent in D14.
District 11 plays
catch up
District 26 gears up
for TEL boom
Will momentum be
with District 14?
Q4 2019 q-o-q median
psf asking price change
Q4 2019 q-o-q median
psf asking price change
Q4 2019 q-o-q median
psf asking price change
Q4 2019 Median psf
Asking Price
Q4 2019 Median psf
Asking Price
Q4 2019 Median psf
Asking Price
10.2% 3.7% 0.78%
$2,250 $1,201 $1,542
D11 D26 D14
Quarterly Insights (cont’d)
District Deepdive
Source: Roxy-Pacific Holdings Limited Source: Land Transport Authority Source: Lendlease Corporation

15PropertyGuru Singapore Property Market Index Q1 2020
Impact of Coronavirus Disease 2019 on real
estate and property in Singapore
Dr Tee Khoon Tan, Country Manager – Singapore
Recent news from around the globe has
been led by reports on the Coronavirus
Disease 2019 (COVID-19).
Despite enhanced measures proactively
taken by the government, developers
are monitoring the situation before
confirming the continuance of their
project launch plans. With the looming
COVID-19, footfall to the show galleries
is likely to be affected. Property buyers
may also choose to wait out this period.
Moreover, with 50% of new launches
in the prime districts (where 30% of
transactions are typically attributable to
foreign buyers), the restrictions imposed
on travels are certain to affect sales.
As for secondary market sales and lease,
we believe that viewing appointments
may be selectively scheduled.
We have been speaking with our partners
in agencies and developers, who have put
in place similar precautionary measures
in accordance with the Ministry of Health
(MOH) advisories so that regardless,
agents and property professionals
can remain vigilant in their viewing
appointments, showflats and offices.
This is also a time when e-solutions (such
as PropertyGuru FastKey) can assist in
reducing the physical contact elements
of current property transactions, if the
involved parties would like to proceed
with extra caution. For example, viewings
could take place virtually and even
documentation to an extent can certainly
be digitised and circulated electronically
thereby reducing face to face meetings.

16 PropertyGuru Singapore Property Market Index Q1 2020
Looking
Ahead
While a handful of projects will
continue to do well because
of their key amenities
and superior locational
attributes, it is important to note that,
given the relatively low number of
prospective buyers in the market today,
any observed increase in asking and
transaction prices will likely remain
localised on a district-level in 2020, as
opposed to a nationwide uptrend in
property value.
At the same time, low interest rates will
be the silver lining for investors this year,
and 2020 will be an opportune time for
homeowners to refinance their home
loans. We foresee rental yields to remain
stable this year and rental demand
to increase in suburban areas given
increasing public transport availability.
Despite COVID-19 the outlook for buyers
looking to purchase their homes in
Singapore in 2020 (and beyond) remains
positive. The Singapore property market
has a strong history of resilience and
stability, even in testing times. The
schedule of new launches for the year
ahead, and abundant housing stock spell
good news for buyers looking for their
ideal home or investment - but with the
shrinking supply overhang, this scenario
will not last for too long. Furthermore,
with key infrastructure such as the TEL in
the works, the price gap between suburbs
and areas closer to the city may also
narrow, prompting mass-market condo
buyers to move sooner rather than later.

17PropertyGuru Singapore Property Market Index Q1 2020
Buying a home is one of the most
difficult decisions of our lives. It is
also likely to be the most expensive
decision. When committing to
a home purchase, it is important to be
equipped with relevant and sufficient
information so that the decision can be
made confidently.
PropertyGuru wants to simplify this
process for property seekers, including
first-time homebuyers and existing
homeowners who might be looking into
buying their second or third properties. In
that vein, we created this report to help
Singaporeans understand the movement
of the property market better, so that
property buyers can gain greater insight
Using a range of statistical
techniques, the data from over
200,000 private home listings
on PropertyGuru Singapore are
aggregated and indexed, demonstrating
the movement of supply-side pricing.
The PropertyGuru Singapore Property
Market Index shows seller optimism and
indicates the price level that developers
and homeowners feel that they can fetch
for their respective properties.
An increase in the Property Market Index
(PMI) may demonstrate buoyancy of
sentiment while a decrease may indicate
a moderation of expectations.
About This Report
Methodology
on current price trends that are in line
with market sentiments, and to try to
time their property purchases better.
As a leader in the real estate market in
Singapore, PropertyGuru processes a
vast amount of real estate data daily,
providing us with the necessary data to
crunch, and deliver in-depth insights to
all Singaporean home seekers.
In this report, we look at pricing and
supply indices of private residential
properties in Singapore, in various
locations, and across different property
types, to provide a comprehensive
overview of property market dynamics
across the city-state.
The Index is based on price levels as of Q1
2015. This means that aggregated price
levels are denominated as 100 at Q1 2015,
and the subsequent quarters’ pricing are
relative to that.
We complement the price levels with a
view on supply volumes in the market
through the number of property listings
on PropertyGuru Singapore. Our supply
volumes not only take into account
residential resale supply, but also new
launch supply in Singapore.

18 PropertyGuru Singapore Property Market Index Q1 2020
PropertyGuru.com.sg was launched in 2007. It revolutionised the Singapore property market by taking it
online and making property search transparent for everyone. For the past 12 years, PropertyGuru.com.sg
has been helping property seekers in Singapore make confident property decisions. With over 5.5 million
monthly visits* and 75%** consumer market share, PropertyGuru is the No.1 destination for Singapore
homeseekers.
It is part of PropertyGuru Group, Southeast Asia’s leading property technology company and the preferred
destination for over 20 million property seekers to find their desired home, every month. PropertyGuru
Group of companies empower property seekers with the widest option of over 2 million homes, in-depth
insights and solutions that enable them to make confident property decisions across Singapore, Malaysia,
Thailand, Indonesia and Vietnam.
Over the decade, the Group has grown from a regional property media powerhouse to a high-growth
technology company with a robust portfolio comprising: leading property portals across its core markets;
award-winning mobile apps; a SaaS-based sales automation solution, ‘PropertyGuru FastKey’, which is
used by property developers to enable end-to-end project management from launch to sales conversion;
one of the largest property awards business in the region, ‘PropertyGuru Asia Property Awards’, which
sources entries from fourteen markets across Asia.
For more information, please visit propertyguru.com.sg; linkedin.com/company/propertyguru
*Source – Google Analytics data, Jul-Dec 2019
**Source - SimilarWeb - Relative Engagement Market Share, average of Jul-Dec 2019
About PropertyGuru

19PropertyGuru Singapore Property Market Index Q1 2020

Disclaimer
This publication has been prepared for general guidance on matters
of interest only, and does not constitute professional advice. You should
not act upon the information contained in this publication without
obtaining specific professional advice. No representation or warranty
(express or implied) is given as to the accuracy or completeness of the
information contained in this publication, and, to the extent permitted
by law, PropertyGuru Group does not accept or assume any liability,
responsibility or duty of care for any consequences of you or anyone
else acting, or refraining to act, in reliance on the information contained
in this publication or for any decision based on it.
PropertyGuru Group
REG PropertyGuruGroup.com | AsiaPropertyAwards.com
AsiaRealEstateSummit.com
SG PropertyGuru.com.sg | CommercialGuru.com.sg
MY PropertyGuru.com.my
ID Rumah.com | RumahDijual.com
TH DDproperty.com
VN Batdongsan.com.vn
Contact
For media or press enquiries, or to understand more about
the PropertyGuru’s Singapore Property Market Index Q1 2020,
please email [email protected].
© 2020 PropertyGuru Group. All rights reserved.