SING 3- Nutritional Assessment in Challenging · PDF fileNutrition Assessment in Challenging...
38
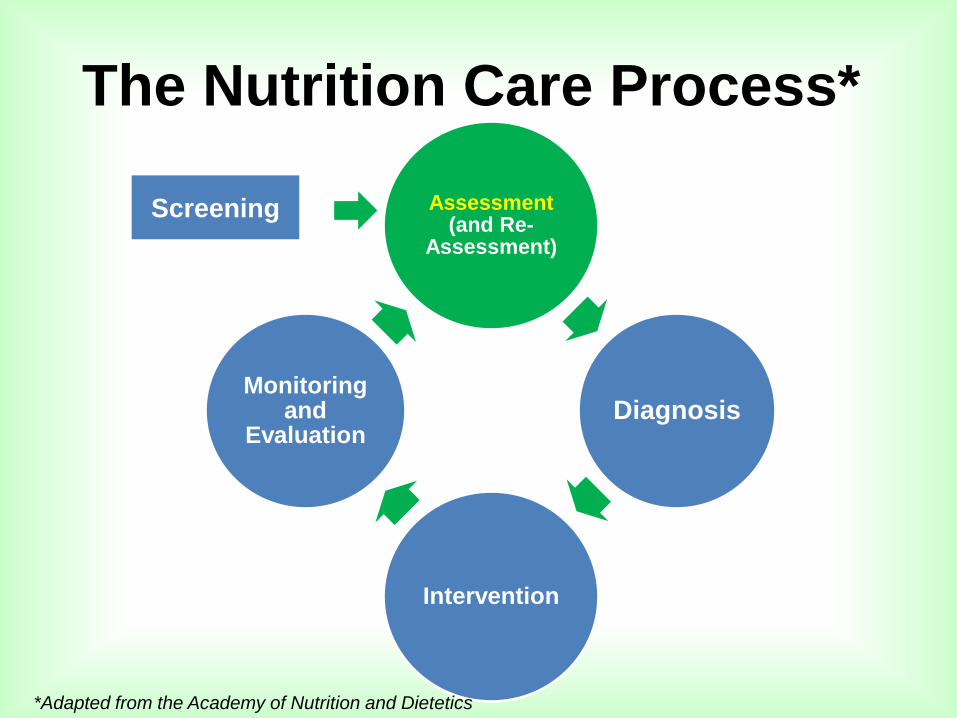
SING 3 Nutrition Assessment in Challenging Patients Enrico N. Cembrano, R.N-D October 8, 2014
Transcript of SING 3- Nutritional Assessment in Challenging · PDF fileNutrition Assessment in Challenging...

SING 3
Nutrition Assessment in Challenging Patients
Enrico N. Cembrano, R.N-D
October 8, 2014

Outline
Learning Objectives
I. Anthropometrics
II. Nutrition Assessment in Challenging Cases
III. Key Points

Learning Objectives
1. Identify cases where specialized nutrition assessment is needed.
2. Explain assessment methods and related equations.
3. Apply and integrate the learned information to actual practice.
4. Realize the value of accurate nutrition assessment as part of nutrition care management.
Assessment (and Re-
Assessment)
Diagnosis
Intervention
Monitoring and
Evaluation
*Adapted from the Academy of Nutrition and Dietetics
The Nutrition Care Process*
Screening

Nutrition Assessment’s
Basic Components
• Height
• Weight (incl. changes)
• BMI
• Waist circumference
• CBC
• Electrolytes
• Serum proteins
• Relevant blood exams
• Urinalysis
• Fecalysis
• Vital signs
• General physical
assessment (skin,
muscle, face)
• Fluid status
• Bowel habits
• Food intake record
or Food intake recall
• FFQ
• Food allergies
• Food habits/
preferences
• Medical
• Drug
• Psycho social

PART II
Anthropometrics • Knee Height
• Arm Span
• Ulna Length
• Desirable Body Weight
• Adjusted weight for amputees
• Evaluation of body weight & weight loss

Knee Height

Height Estimation Formula using
Knee Height Females: 𝐻𝑡 (𝑐𝑚) = 84.88 − (0.24 𝑥 𝑎𝑔𝑒 𝑖𝑛 𝑦𝑟) + (1.83 𝑥 𝑘𝑛𝑒𝑒 ℎ𝑒𝑖𝑔ℎ𝑡 𝑖𝑛 𝑐𝑚)
Males: 𝐻𝑡 𝑐𝑚 = 64.19 − 0.04 𝑥 𝑎𝑔𝑒 𝑖𝑛 𝑦𝑟 + (2.02 𝑥 𝑘𝑛𝑒𝑒 ℎ𝑒𝑖𝑔ℎ𝑡 𝑖𝑛 𝑐𝑚)
Example: 80 year old male, knee height of 50 cm
𝐻𝑡 𝑐𝑚 = 64.19 − 0.04 𝑥 𝟖𝟎 + (2.02 𝑥 𝟓𝟎)
𝐻𝑡 𝑐𝑚 = (64.19 − 𝟑. 𝟐) + (𝟏𝟎𝟏)
𝐻𝑡 𝑐𝑚 = 𝟔𝟏 + 𝟏𝟎𝟏
𝑯𝒕 𝒄𝒎 = 𝟏𝟔𝟐
*2007 ASPEN Nutrition Support Core Curriculum

Height Estimation Formula using
Knee Height (FILIPINOS)
Females: 𝐻𝑡 𝑐𝑚 = 89.68 + 1.53 𝑥 𝑘𝑛𝑒𝑒 ℎ𝑒𝑖𝑔ℎ𝑡 𝑖𝑛 𝑐𝑚 − (0.17 𝑥 𝑎𝑔𝑒 𝑖𝑛 𝑦)
Males: 𝐻𝑡 𝑐𝑚 = 96.5 + 1.38 𝑥 𝑘𝑛𝑒𝑒 ℎ𝑒𝑖𝑔ℎ𝑡 𝑖𝑛 𝑐𝑚 − (0.08 𝑥 𝑎𝑔𝑒 𝑖𝑛 𝑦)
Example: 80 year old male, knee height of 50 cm
𝐻𝑡 𝑐𝑚 = 96.5 + 1.38 𝑥 𝟓𝟎 − (0.08 𝑥 𝟖𝟎)
𝐻𝑡 𝑐𝑚 = (96.5 + 𝟔𝟗) − 𝟔. 𝟒
𝐻𝑡 𝑐𝑚 = 𝟏𝟔𝟓. 𝟓 − 𝟔. 𝟒
𝑯𝒕 𝒄𝒎 = 𝟏𝟓𝟗. 𝟏
Tanchoco et al, Arm span and knee height as proxy indicators for height. J Nutritionist-Dietitians’ Assoc Philippines 2001;15:84-90.)

Demispan
Source: HIckson M, Frost G. A comparison of three methods for estimating height in the acutely ill elderly population. J Hum Nutr
Diet 2003;6:1-3. In “A guide to completing the Mini Nutritional Assessment Short Form (MNA-SF)”
Females:
𝐻𝑡 𝑐𝑚 = 1.35 𝑥 𝑑𝑒𝑚𝑖𝑠𝑝𝑎𝑛 𝑐𝑚 + 60.1
Males:
𝐻𝑡 𝑐𝑚 = 1.4 𝑥 𝑑𝑒𝑚𝑖𝑠𝑝𝑎𝑛 𝑐𝑚 + 57.8

Ulna Length
Souce: http://www.bapen.org.uk/pdfs/must/must_explan.pdf
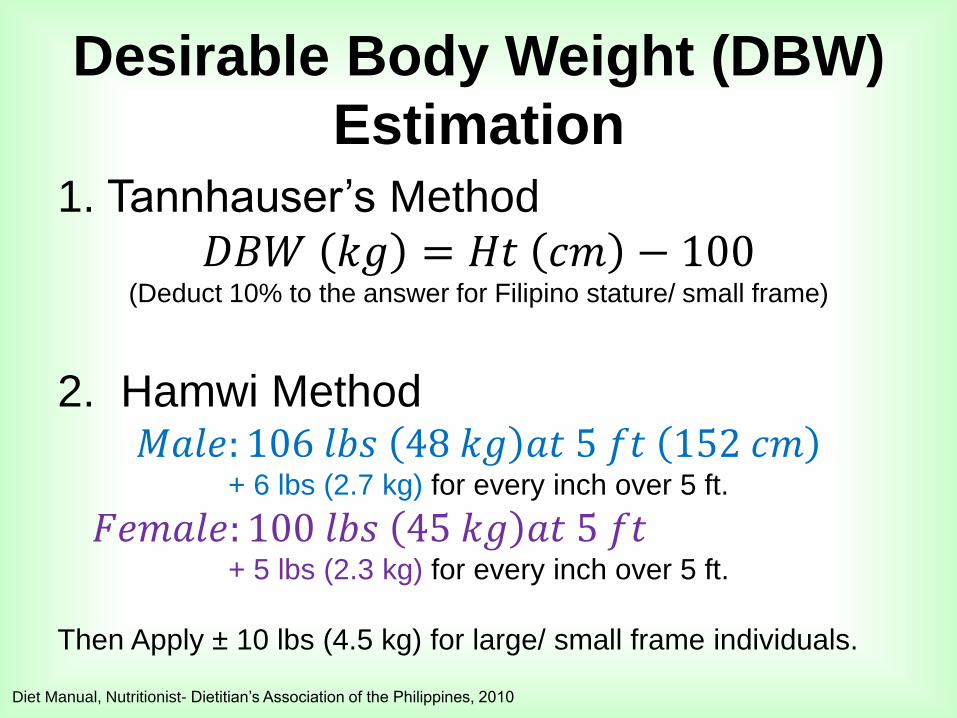
Desirable Body Weight (DBW)
Estimation
1. Tannhauser’s Method
𝐷𝐵𝑊 𝑘𝑔 = 𝐻𝑡 𝑐𝑚 − 100 (Deduct 10% to the answer for Filipino stature/ small frame)
2. Hamwi Method 𝑀𝑎𝑙𝑒: 106 𝑙𝑏𝑠 48 𝑘𝑔 𝑎𝑡 5 𝑓𝑡 152 𝑐𝑚
+ 6 lbs (2.7 kg) for every inch over 5 ft.
𝐹𝑒𝑚𝑎𝑙𝑒: 100 𝑙𝑏𝑠 45 𝑘𝑔 𝑎𝑡 5 𝑓𝑡 + 5 lbs (2.3 kg) for every inch over 5 ft.
Then Apply ± 10 lbs (4.5 kg) for large/ small frame individuals.
Diet Manual, Nutritionist- Dietitian’s Association of the Philippines, 2010

Adjusted Weight for Amputees
Steps
1. Establish pre- amputation
Ideal Body Weight (PA-IBW).
2. Determine the total % of
missing body parts.
3. Get the missing wt by
multiplying total % missing
body parts to PA-IBW
4. Subtract the missing body
weight to the PA-IBW
Example
Below Knee Amputation, Left
1. IBW (pre BKA)- 60 kg
2. BKA % value- 5.9
3. Missing wt =
60 kg x .059 = 3.5 kg
4. Adjusted wt =
60 kg - 3.5 kg = 56.5 kg
Modified from Morris J, Dietitian’s Guide to Assessment and Documentation, Jones and Bartlett Publishers, 2011

Osterkamp LK. Journal of the American Dietetic Association, 1995;95:215-218 in Nutrition Screening and Assessment, ASPEN
Nutrition Support Core Curriculum , 2007
Percent Body Weight Contributed by Individual Body Parts

Evaluation of Body Weight
% 𝐼𝐵𝑊 =𝐶𝑢𝑟𝑟. 𝑤𝑡.
𝐼𝐵𝑊 𝑥 100
% IBW Degree of Malnutrition
80-90 Mild
70-79 Moderate
0-69 Severe
*Adapted from Blackburn G and Bistrian B. Nutritional and Metabolic Assessment of the Hospitalized Patient. J Parenter Enteral Nutr.
1977;1(1):11-22, in Nutrition Screening and Assessment, ASPEN Nutrition Support Core Curriculum , 2007

Evaluation of Weight Loss
% 𝒓𝒆𝒄𝒆𝒏𝒕 𝒘𝒕 =𝒖𝒔𝒖𝒂𝒍 𝒘𝒕 𝑼 − 𝒄𝒖𝒓𝒓𝒆𝒏𝒕 𝒘𝒕(𝑪)
𝒖𝒔𝒖𝒂𝒍 𝒘𝒕 (𝑼)𝒙 𝟏𝟎𝟎
Time Significant
Loss (%)
Severe
Loss (%)
1 wk. 1 to 2 > 2
1 mo. 5 > 5
3 mos. 7.5 > 7.5
6 mos. 10 > 10
*Adapted from Blackburn G and Bistrian B. Nutritional and Metabolic Assessment of the Hospitalized Patient. J Parenter Enteral Nutr.
1977;1(1):11-22, in Nutrition Screening and Assessment, ASPEN Nutrition Support Core Curriculum , 2007

Nutrition Assessment and Risk Level

PART III
Nutrition Assessment in
Challenging Cases
• Thermal Burns
• Chronic Kidney Disease
• Chronic Liver Disease

Burn Classification

Burn Severity
https://www.ebmedicine.net/topics.php?paction=showTopicSeg&topic_id=111&seg_id=2138, accessed Sept 15, 2014
Severity Children & Elderly Adults
Minor <10% TBSA <15% TBSA
Or full- thickness burns <2% TBSA
Moderate 10- 20% TBSA 15- 25% TBSA
Or full- thickness at <10% TBSA (non- critical areas)
Severe
>20% TBSA >25% TBSA
Or full- thickness (3rd degree) at >10% TBSA
Burns in critical areas*
Complicated burns (e.g. with DM, CKD, elderly)
TBSA- Total Body Surface Area
*Critical areas- face, hands, feet, genitalia, perineum, major joints

“Rule of
Nines”
Nelms, et al.,, 2010

Consequences
Burn Injury
• Fluid and electrolyte imbalance
• Accelerated loss of Lean Body Mass (LBM)
• High risk for infection
• Hyperglycemia

• Reduce evaporative water losses.
• Restore fluid and electrolyte balance.
• Promote wound healing and graft retention.
• Achieve positive nitrogen balance.
• Avoid overfeeding.
• Restore skin’s protection.
Nutrition Management Objectives
Escott- Stump S, Nutrition and Diagnosis- Related Care (2011)

Nutrition Assessment
• Height
• Weight (pre- burn)
• BMI
• Daily wt. changes
• Measured EE
• SAlbumin, prealbumin (˅)
• CRP
• SGOT (˄)
• Alk Phos (˄)
• Glucose (˄)
• Na+(˅),K+,Ca++,Mg++
• Chol, TG
• WBC, TLC
• pCO2, pO2
• Nitrogen balance
• Burn classification &
severity
• Edema
• Fluid status
• Vital signs (BP,
temp, RR, HR)
• Allergies
• Intake VS requirements
• Co- morbidities
• Drug Hx

PEW in CKD
Ikizler et al, Kidney International (2013) 84, 1096–1107; doi:10.1038/ki.2013.147;

• Retard progression of renal failure
• Maintain or improve nutritional status
• Preserve lean body mass
• Control uremic symptoms and reduce
complications.
• Control blood pressure.
• Control blood glucose and lipid levels.
• Maintain optimal quality of life
Nutrition Management Objectives
Escott- Stump S, Nutrition and Diagnosis- Related Care (2011)
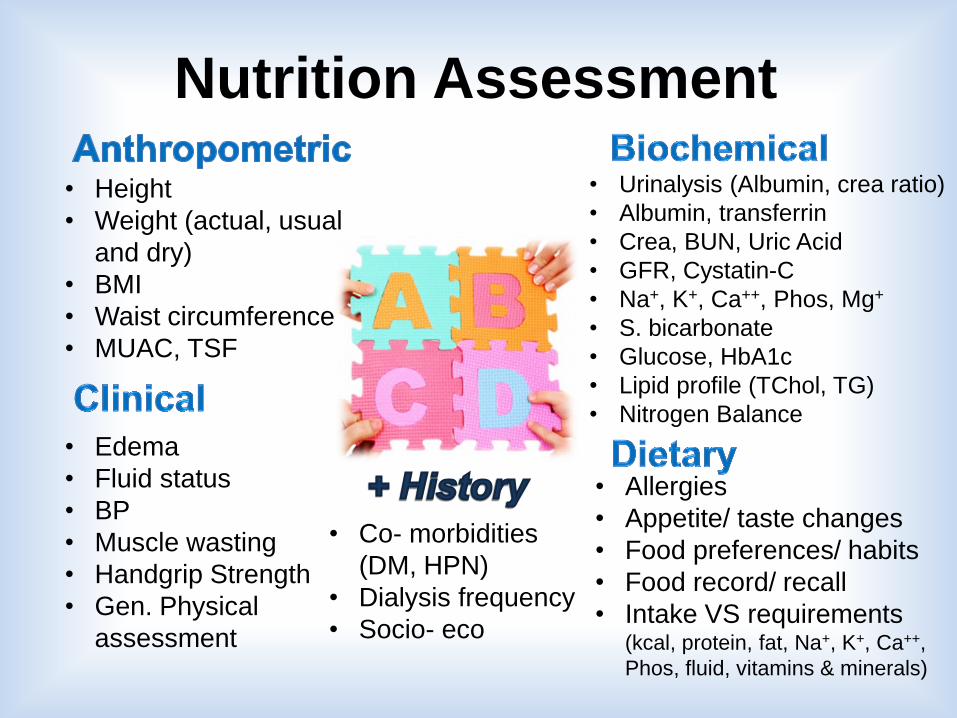
Nutrition Assessment
• Height
• Weight (actual, usual
and dry)
• BMI
• Waist circumference
• MUAC, TSF
• Urinalysis (Albumin, crea ratio)
• Albumin, transferrin
• Crea, BUN, Uric Acid
• GFR, Cystatin-C
• Na+, K+, Ca++, Phos, Mg+
• S. bicarbonate
• Glucose, HbA1c
• Lipid profile (TChol, TG)
• Nitrogen Balance
• Edema
• Fluid status
• BP
• Muscle wasting
• Handgrip Strength
• Gen. Physical
assessment
• Allergies
• Appetite/ taste changes
• Food preferences/ habits
• Food record/ recall
• Intake VS requirements (kcal, protein, fat, Na+, K+, Ca++,
Phos, fluid, vitamins & minerals)
• Co- morbidities
(DM, HPN)
• Dialysis frequency
• Socio- eco

Relevant Blood Tests CKD stage
related
Infection/
Inflammation
related
Malnutrition related
Albumin (˅)
Alkaline Phos.
PTH ˄ or ˅
BUN
K+ (˄)
Phos (˄)
S.Bicarbonate (˅)
Albumin (˅)
CRP (˄)
Ferritin (˄)
Creatinine (˅)
Ferritin (˅)
Prealb./Transthyretin (˅)
Glucose (˅)
Cholesterol (˅)
Na+, K+ (˅)
Ionized Ca++, Mg++ (˅)
Phos (˅)

Adjusted edema- free body weight
Use if actual edema- free BW is <95% or >115% of SBW
aBWef = BWef + [(SBW - BWef) x 0.25] Where: BWef = actual edema- free body weight (post- HD/ post- drain CPD)
SBW = Standard/ Ideal body weight
Example:
Male, Ht = 1.7 m, actual BW = 80 kg (127% SBW), IBW = 63 kg
aBWef = 80 + [(63 – 60) x 0.25]
= 80 + [-17 x 0.25]
= 80 – 4.3
= 75.7 or 76 kg
Nutrition in Chronic Renal Failure, K/DOQI Guidelines, American Journal of Kidney Diseases, VOL 35, NO 6,
SUPPL 2, JUNE 2000
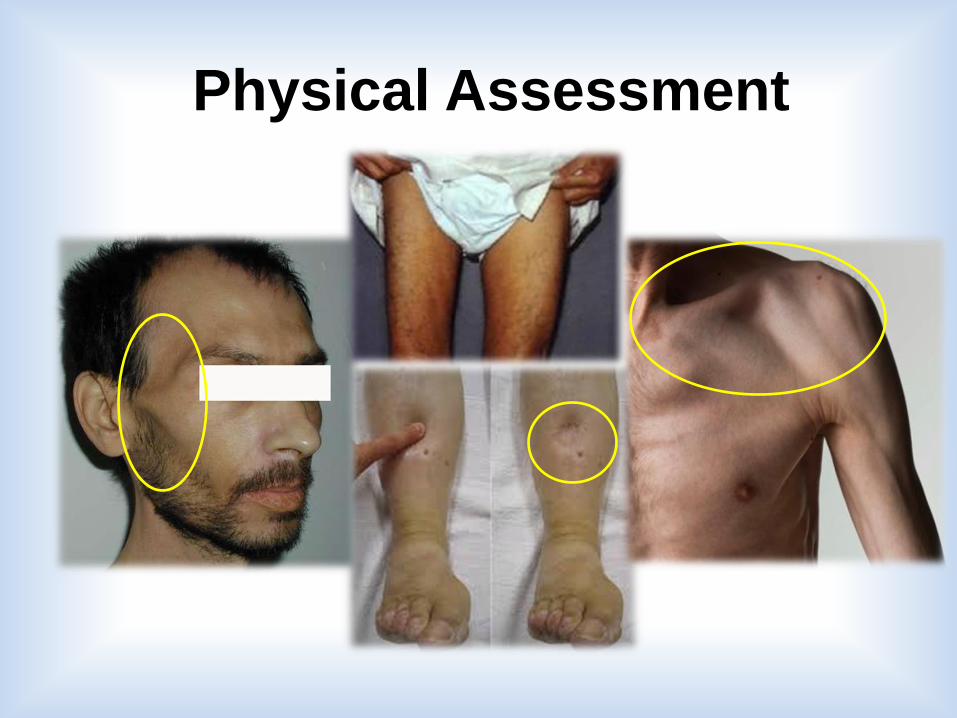
Physical Assessment
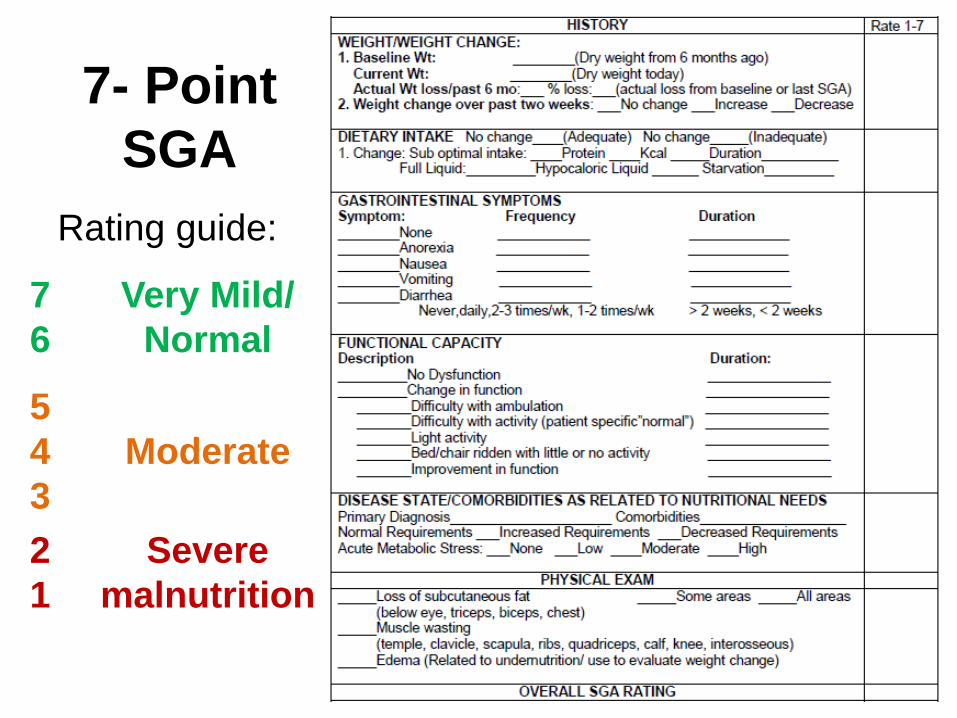
7- Point
SGA
Rating guide:
7
6
Very Mild/
Normal
5
4
3
Moderate
2
1
Severe
malnutrition
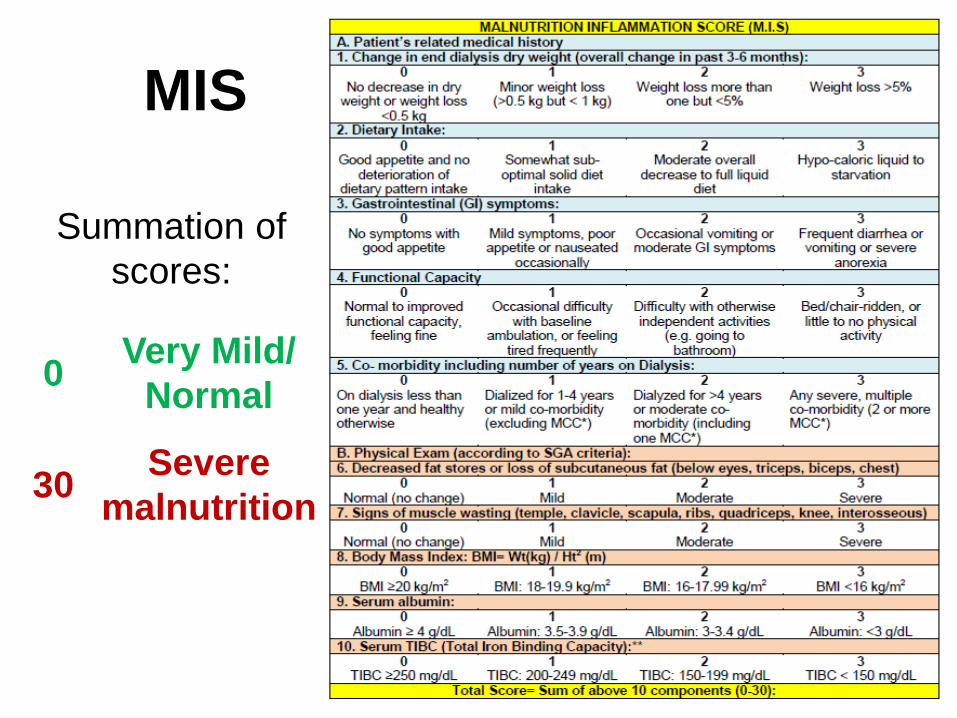
MIS
Summation of
scores:
0 Very Mild/
Normal
30 Severe
malnutrition

Liver Cirrhosis and Malnutrition
Bemeur et al, Role of Nutrition in the Management of Hepatic Encephalopathy in End-Stage Liver Failure, Journal of Nutrition and
Metabolism, 2010,doi:10.1155/2010/489823

Nutrition Management Objectives
• Delay progression of scar tissue and support
Residual liver function.
• Provide supportive treatment for ascites, edema,
muscle wasting, weight loss, esophageal varices
and portal hypertension
• Provide adequate nutrition to maintain/ replete
nutritional stores
• Correct nutritional deficiencies
Escott- Stump S, Nutrition and Diagnosis- Related Care (2011)

Nutrition Assessment
• Height
• Weight (ideal/ dry
wt.)
• BMI
• MUAC, TSF
• Edema/ Ascites
• Bowel changes
• Muscle wasting
• Handgrip Strength
• Physical assessment
• Behavioral changes
• Allergies
• Appetite/ taste changes
• Food preferences/
habits
• Food record/ recall
• Intake VS requirements
• Co-
morbidities
• Socio- eco.
• CBC, WBC
• ALT, AST(˄)
• PT (prolonged?), INR
• Crea, Bilirubin (˄), Alk Phos (˄)
• S. ammonia (˄?)
• Alb (˅), Globulin, Transferrin
• Trig (˄), Chol (˅?), Gluc (˄/ ˅?)
• Na+, K+, Ca++, Mg+

Physical
Assessment
Jaundice
Ascites
Abdominal Veins
Palm Erythema
Bruises
Ankle edema
Muscle wasting
Escott- Stump S, Nutrition and Diagnosis-
Related Care (2011)

Royal Free Hospital- Global Assessment
(RFH-GA)
Morgan et al, HEPATOLOGY, Vol. 44, No. 4, 2006, 823-35

Key Points
• Nutritional assessment should be individualized.
• No single parameter can predict nutrition status.
• Most parameters obtained during assessment should also be monitored.
• Effective nutrition management depends on an accurate and concise nutrition assessment.