Simultaneous Remova olf Benzen ane d Copper from Water … · and Wastewater Using Micellar-Enhance...
114
Simultaneous Removal of Benzene and Copper from Water and Wastewater Using Micellar-Enhanced Ultrafiltration Zaid Ahmed Mohammed Ridha A Thesis In The Department of Building, Civil, and Environmental Engineering Presented in Partial Fulfillment of the Requirements for the Degree of Master of Applied Science (civil Engineering) at Concordia University Montreal, Quebec, Canada August 2010 ©Zaid Ahmed Mohammed Ridha, 2010
Transcript of Simultaneous Remova olf Benzen ane d Copper from Water … · and Wastewater Using Micellar-Enhance...

Simultaneous Removal of Benzene and Copper from Water
and Wastewater
Using Micellar-Enhanced Ultrafiltration
Zaid Ahmed Mohammed Ridha
A Thesis
In
The Department
of
Building, Civil, and Environmental Engineering
Presented in Partial Fulfillment of the Requirements
for the Degree of Master of Applied Science (civil Engineering) at
Concordia University
Montreal, Quebec, Canada
August 2010
©Zaid Ahmed Mohammed Ridha, 2010

1*1 Library and Archives Canada
Published Heritage Branch
Bibliothgque et Archives Canada
Direction du Patrimoine de l'6dition
395 Wellington Street Ottawa ON K1A 0N4 Canada
395, rue Wellington Ottawa ON K1A 0N4 Canada
Your Tile Votre reference ISBN: 978-0-494-71075-3 Our file Notre r6f6rence ISBN: 978-0-494-71075-3
NOTICE:
The author has granted a non-exclusive license allowing Library and Archives Canada to reproduce, publish, archive, preserve, conserve, communicate to the public by telecommunication or on the Internet, loan, distribute and sell theses worldwide, for commercial or non-commercial purposes, in microform, paper, electronic and/or any other formats.
The author retains copyright ownership and moral rights in this thesis. Neither the thesis nor substantial extracts from it may be printed or otherwise reproduced without the author's permission.
AVIS:
L'auteur a accorde une licence non exclusive permettant a la Biblioth6que et Archives Canada de reproduire, publier, archiver, sauvegarder, conserver, transmettre au public par telecommunication ou par I'lnternet, preter, distribuer et vendre des theses partout dans le monde, a des fins commerciales ou autres, sur support microforme, papier, electronique et/ou autres formats.
L'auteur conserve la propriete du droit d'auteur et des droits moraux qui protege cette these. Ni la these ni des extraits substantiels de celle-ci ne doivent etre imprimes ou autrement reproduits sans son autorisation.
In compliance with the Canadian Privacy Act some supporting forms may have been removed from this thesis.
While these forms may be included in the document page count, their removal does not represent any loss of content from the thesis.
Conform6ment a la loi canadienne sur la protection de la vie privee, quelques formulaires secondaires ont ete enleves de cette these.
Bien que ces formulaires aient inclus dans la pagination, il n'y aura aucun contenu manquant.
Canada

ABSTRACT
Simultaneous Removal of Benzene and Copper from Water and
Wastewater
Using Micellar-Enhanced Ultrafiltration
Zaid Ahmed Mohammed Ridha
To remove metal ions and/or organic molecules from aqueous solutions is a
difficulty commonly encountered in the treatment of contaminated water.
Traditional ultrafiltration is usually used to separate the high molecular weight
molecules and is ineffective in removing heavy metal ions or organic molecules
with small molecular weights. Micellar-enhanced ultrafiltration (MEUF) is an
effective technique to remove contaminants that traditional ultrafiltration cannot
remove. Micellar-enhanced ultrafiltration makes use of the micellar properties of
surfactant solutions to remove dissolved ions and/or organics from aqueous
streams. Chemical surfactants have proven effective. However compared to
biosurfactants they are toxic and create a secondary problem since part of the
surfactant monomers frequently leak through the pores of membrane filters. This
study is an attempt to examine the effect of rhamnolipid biosurfactant, JBR 425,
on contaminant removal from aqueous solutions.
The required quantity of rhamnolipid to remove the copper ions as a heavy metal
pollutant and benzene molecules as an organic pollutant separately has been
determined for different concentrations of pollutants. This quantity, the molar ratio
hi

(MR), was 6.25 to obtain a 100% rejection for the copper ions and 1.33 to obtain
the same rejection of benzene molecules. When copper and benzene were
mixed, these molar ratios have been either improved as in benzene molar ratio
which was decreased from 1.33 to 0.56 or remained the same as in copper molar
ratio but in all cases rhamnolipid JBR 425 proved of excellent efficiency in the
removal of contaminants and a rejection of 100% has been obtained for copper
and benzene either separately or simultaneously which is the objective of this
study.
IV

ACKNOWLEDGMENTS
I would like to express my gratitude to all those who gave me the possibility to
complete this thesis. I especially would like to thank my supervisor, Dr. Catherine
Mulligan, for her guidance, encouragement, and understanding during the course
of this study. I have appreciated her support and also her working style:
promoting self-confidence and autonomy.
I am grateful to the faculty, staff and my friends in the department of Building,
Civil, and Environmental Engineering for their assistance in every aspect of my
study.
Finally, I would like to thank my families for their continuous support and
encouragement. Especial note of thank also goes to my wife for her support and
Patience.

TABLE OF CONTENTS
LIST OF FIGURES XI
LIST OF TABLES XV
CHAPTER ONE: INTRODUCTION 1
1.1 GENERAL REMARKS 1
1.2 OBJECTIVE OF THIS RESEARCH 4
1.3ORGANIZATION OF THIS THESIS 5
CHAPTER TWO: BACKGROUND AND LITERATURE REVIEW 6
2.1 INTRODUCTION 6
2.2 BENZENE 6
2.2.1 IDENTITY, STRUCTURE, PHYSICAL AND CHEMICAL
PROPERTIES 7
2.2.2 PRODUCTION AND USES 7
2.2.3 NATURAL AND ANTHROPOGENIC SOURCES AND RELEASES....9
2.2.4 ENVIRONMENTAL FATE 10
2.2.5 CANADIAN ENVIRONMENTAL LEVELS AND DRINKING WATER
GUIDELINE 10
2.2.6 EFFECTS ON HUMANS 11
2.3 COPPER 11
2.3.1 IDENTITY, STRUCTURE, PHYSICAL AND CHEMICAL
PROPERTIES 12
2.3.2 PRODUCTION AND USES 12
viii

2.3.3 NATURAL AND ANTHROPOGENIC SOURCES AND
RELEASES 12
2.3.4 ENVIRONMENTAL FATE 14
2.3.5 LEVELS IN THE CANADIAN ENVIRONMENT 14
2.3.6 EFFECTS ON HUMANS, ACUTE EXPOSURE 15
2.4MEMBRANE SEPARATION PROCESSES 16
2.4.1 REVERSE OSMOSIS 17
2.4.2 ULTRAFILTRATION 17
2.4.3 MICROFILTRATION 18
2.4.4 DIALYSIS 18
2.5 CLASSIFICATION OF FILTERS 18
2.5.1 DEPTH FILTERS 18
2.5.2 SCREEN FILTERS 19
2.6 MEMBRANE CLASSIFICATIONS 20
2.6.1 CONVENTIONAL MODULES OF ULTRAFILTRATION 20
2.7 CROSS-FLOW AND DEAD END FILTRATION 21
2.8 MICELLAR ENHANCED ULTRAFILTRATI ON (MEUF) 23
2.8.1 THE CRITICAL MICELLE CONCENTRATION (CMC) 25
2.8.2 CONCENTRATION POLARIZATION 27
2.8.3 FOULING 28
2.9 SURFACTANTS 29
2.9.1 GENERAL CLASSIFICATION OF SURFACTANTS 29
2.10 BIOSURFACTANTS 30
viii

2.10.1 CLASSIFICATION OF BIOSURFACTANTS 30
2.10.2 RHAMNOLIPID 33
2.10.3 ENVIRONMENTAL APPLICATIONS OF RHAMNOLIPID 33
CHAPTER 3: MATERIALS AND METHODS 36
3.1 INTRODUCTION 36
3.2 CHEMICALS AND BIOSURFACTANT 37
3.2.1 COPPER 37
3.2.2 BENZENE 37
3.2.3 ACIDS AND BASES 37
3.2.4 RHAMNOLIPID BIOSURFACTANT, JBR 425 38
3.3 EQUIPMENT USED 39
3.3.1 THE QUIXSTAND™ BENCHTOP SYSTEM
(THE ULTRAFILTRATION SYSTEM) 39
3.3.2 PERISTALTIC PUMP 39
3.3.3 XAMPLER™ CARTRIDGE 41
3.4 RHAMNOLIPID CHARACTERIZATION AND EXPERIMENTAL DESIGN
42
3.4.1 RHAMNOLIPID CHARACTERIZATION: DETERMINATION OF
RHAMNOLIPID CRITICAL MICELLE CONCENTRATION (CMC) 42
3.4.2 EXPERIMENTS OF GROUP ONE: EFFECT OF OPERATION
PARAMETERS ON FLUX 43
viii

3.4.3 EXPERIMENTS OF GROUP TWO: FINDING THE MOLAR RATIO, MR,
FOR THE 100% REJECTION AND INVESTIGATING THE RHAMNOLIPID
BEHAVIOUR IN THE PRESENCE OF COPPER AND BENZENE 46
3.4.4 EXPERIMENTS OF GROUP THREE: THE EVALUATION OF
RHAMNOLIPID CAPABILITY TO SEPARATE COPPER IONS AND
BENZENE MOLECULES SIMULTANEOUSLY 50
CHAPTER FOUR: RESULTS AND DISCUSSION .53
4.1 GENERAL REMARKS 53
4.2 CHARACTERIZATION OF RHAMNOLIPID: DETERMINATION OF
RHAMNOLIPID CRITICAL MICELLE CONCENTRATION (CMC) 54
4.2.1 DU NOUY METHOD 54
4.2.2 ELECTRICAL CONDUCTIVITY METHOD 56
4.3 EXPERIMENTS OF GROUP ONE: THE EFFECT OF OPERATION
PARAMETERS ON FLUX 56
4.3.1 TRANSMEMBRANE PRESSURE (TMP) 57
4.3.2 TEMPERATURE 58
4.3.3 PUMP SPEED 59
4.3.4 FOULING 61
4.3.5 CONCENTRATION EFFECTS 61
4.4 EXPERIMENTS OF GROUP TWO: DETERMINING THE MOLAR RATIO,
MR, FOR THE 100% REJECTION AND INVISTIGATING THE RHAMNOLIPID
BEHAVIOUR IN THE PRESENCE OF COPPER AND BENZENE 64
IX

4.4.1 DETERMINATION OF THE MR FOR COPPER 64
4.4.2 DETERMINING THE MR FOR BENZENE 67
4.4.3 RHAMNOLIPID BEHAVIOR IN THE PRESENCE OF COPPER 67
4.4.4 RHAMNOLIPID BEHAVIOR IN THE PRESENCE OF BENZENE 72
4.5 EXPERIMENTS OF GROUP THREE: THE EVALUATION OF
RHAMNOLIPID CAPABILITY TO SEPARATE COPPER IONS AND BENZENE
MOLECULES SIMULTANEOUSLY 75
4.5.1 EXPERIMENTS OF FIRST SUBGROUP: THE EFFECT OF BENZENE
PRESENCE ON RHMNOLIPID CAPABILITY TO REMOVE COPPER 76
4.5.2 EXPERIMENTS OF SECOND SUBGROUP: THE EFFECT OF
COPPER PRESENCE ON RHMNOLIPID CAPABILITY TO REMOVE
BENZENE 78
4.6 RESULTS SUMMARY 81
CHAPTER FIVE: CONCLUSIONS AND RECOMMENDATIONS 85
5.1 SUMMARY AND CONCLUDING REMARKS 85
5.2 RECOMMENDATIONS FOR FUTURE WORK 88
REFERENCES 90
viii

LIST OF FIGURES
Figure 2.1 Benzene, C6H6 7
Figure 2.2 Filter classification 19
Figure 2.3 Dead-end (conventional) and cross-flow filtration 22
Figure 2.4 Simultaneous removal of Cu (II) ions and benzene molecules from
aqueous solutions utilizing Micellar-Enhanced Ultrafiltration (MEUF system)... 24
Figure 2.5 Simultaneous removal of Cu (II) ions and benzene molecules from
aqueous solutions utilizing Micellar-Enhanced Ultrafiltration (inside the
membrane) 24
Figure 2.6 Surfactant below and above cmc (micelle formation) 25
Figure 2.7 Micelle in aqueous solution. Hydrophobic tails are gathered inside the
micelle and hydrophilic heads are exposed to the aqueous phase 26
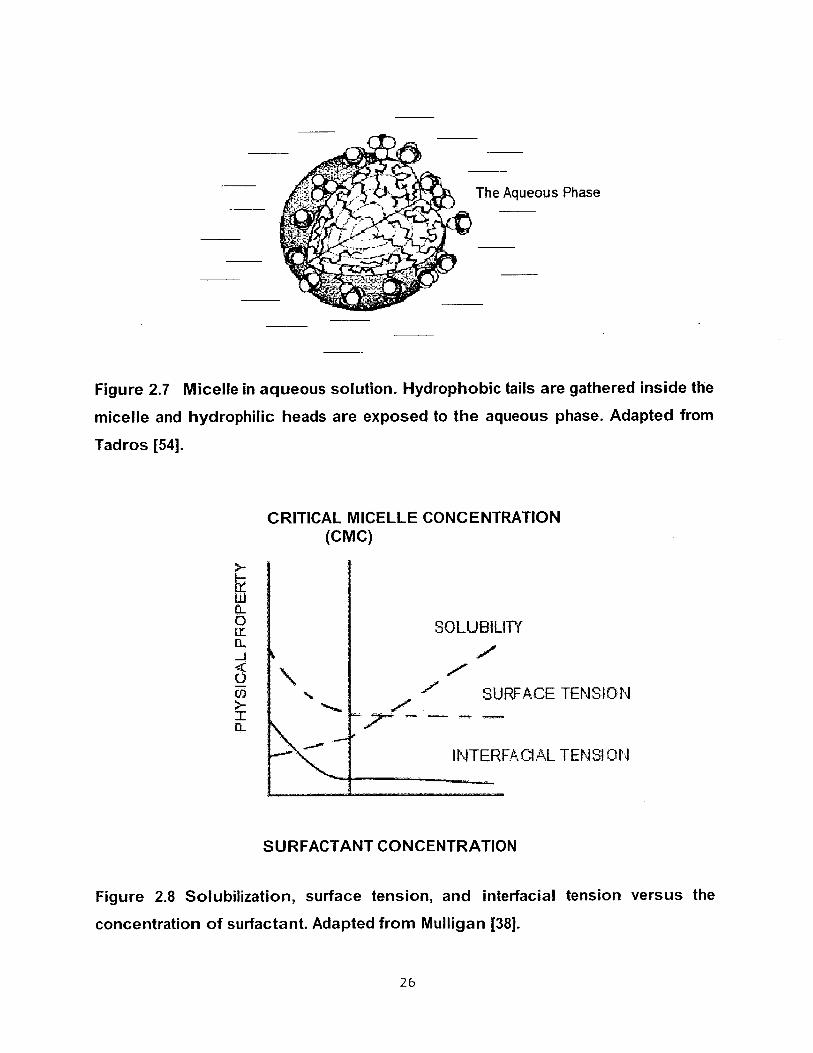
Figure 2.8 Solubilization, surface tension, and interfacial tension versus the
concentration of surfactant 26
Figure 2.9 Concentration polarization of macromolecular solutes and colloidal,
showing the build up of the polarized (gel) layer and associated boundary
layer 27
XI

Figure 2.10 a. Fouling by mixed size particulates. At high velocity, larger particles
are subjected to comparatively greater lift velocities which give smaller particles
a higher probability to foul the membrane, b. Fouling by particulates, effect of
pore size 28
Figure 2.11 Surfactant monomer, the building unit of the micelle 29
Figure 2.12 Surfactants monomer hydrophilic and hydrophobic parts and their
classification according to the head-group charge, (a) cationic surfactants
monomer, (b) anionic surfactants monomer, (c) nonionic surfactants monomer,
and (d) amphoteric and zwitterionic surfactants monomer 31
Figure 2.13 Four different rhamnolipid structures produced by P. aeruginosa...34
Figure 3.1 Flow diagram of the micellar enhanced ultrafiltration system 40
Figure 4.1 Absolute surface tension of different rhamnolipid solutions by Du Nouy
method to find the critical micelle concentration (cmc) 55
Figure 4.2 Rhamnolipid solutions conductivity at different concentrations to
determine the critical micelle concentration (cmc) by the electrical conductivity
method 57
Figure 4.3 Effect of transmembrane pressure on clean water flux 58
Figure 4.4 Effect of temperature on clean water flux 59
Figure 4.5 Effect of pump speed on flux at constant temperature and solution
concentration (476.7 mg/l rhamnolipid and 9.6 mg/l Cu) 60
Xll

Figure 4.6 Effect of pump speed on transmembrane pressure at constant
temperature and solution concentration (476.7 mg/l rhamnolipid and 9.6 mg/l Cu)
60
Figure 4.7 Fouling effect, decline of flux with time while keeping temperature,
solution concentrations (6.4mg/l Cu and 317.8 mg/l rhamnolipid), and pump
speed constant 61
Figure 4.8 Effect of rhamnolipid concentration in rhamnolipid-copper solution on
the flux 63
Figure 4.9 Effect of rhamnolipid concentration in rhamnolipid-copper solution on
transmembrane pressure 64
Figure 4.10 Rejection of rhamnolipid-copper solution at molar ratio = 5.41 66
Figure 4.11 Rejection of rhamnolipid-copper solution at molar ratio = 6.25 66
Figure 4.12 Rejection of rhamnolipid-benzene solution at molar ratio = 0.77 68
Figure 4.13 Rejection of rhamnolipid-benzene solution at molar ratio = 1.33 68
Figure 4.14 Permeate rhamnolipid versus feed rhamnolipid concentrations 70
Figure 4.15 Rejection percentage of two rhamnolipid feed solutions 71
Figure 4.16 Surface tension of rhamnolipid permeates 71
Figure 4.17 Permeate rhamnolipid versus feed rhamnolipid concentration 73
Figure 4.18 Rejection percentage of two rhamnolipid feed solutions 74
xm

Figure 4.19 Surface tension of rhamnolipid-benzene solutions permeates 75
Figure 4.20 Effect of 90mg/l benzene on copper MR of 100% rejection (MR = 6.25) 77
Figure 4.21 Effect of 6.2 and 8.3 mg/l copper on benzene MR 78
Figure 4.22 Effect of 8.3 mg/l copper on benzene new MR (0.77) for 100%
rejection 80
Figure 4.23 Benzene effect on copper MR comparing to 100% rejection MR....80
Figure 4.24 Effect of 43.7 and 63 mg/l benzene on copper MR comparing to MR
of less than 100% rejection 81
XIV

LIST OF TABLES
Table 2.1 Benzene's most important physical and chemical properties 8
Table 2.2 Pure copper physical properties 13
Table 2.3 Average values of the daily exposures 15
Table 2.4 Membrane separation processes, their driving force, and applications 16
Table 2.5 Main modules of ultrafiltration with their advantages and disadvantages, a:
microfiltration; b: ultrafiltration; c: nanofiltration; d: reverse osmosis 21
Table 2.6 Main biosurfactants classified according to chemical composition 32
Table 3.1 Physical properties of rhamnolipid biosurfactant, JBR 425 38
Table 3.2 Main characteristics of Xampler™ cartridge 41
Table 3.3 Experimental design of group three experiments. Benzene effect on copper
molar ratio of 100% rejection (MR=6.25) 52
Table 3.4 Experimental design of group three experiments. Copper effect on benzene
molar ratio of 100% rejection 52
Table 4.1 Effect of copper feed concentration on copper rejection using a MR of
5.41 82
X V

Table 4.2 Effect of copper feed concentration on copper rejection using a MR of
6.25 82
Table 4.3 Benzene feed concentration effect on benzene rejection using a MR of
0.77 83
Table 4.4 Effect of benzene on 100% rejection molar ratio of copper 84
Table 4.5 Effect of copper on 100% rejection molar ratio of benzene 84
x v i

CHAPTER ONE
INTRODUCTION
1.1 GENERAL REMARKS
One of the most considerable environmental problems in the world is water
pollution [60]. This serious problem which threatens one of the main important
sources of life, not only for human beings but also for the whole ecosystem, has
been discussed in detail and many solutions have been applied to solve this
important issue. Identifying the pollutants or contaminants which caused this
significant problem is part of the solution; the other main part is to determine the
treatment method. With focusing more on the solution part, these two parts have
been discussed in this study specifically for benzene as an organic pollutant and
copper as a heavy metal pollutant since they have been considered to be part of
the water pollution problem as will be explained later in this chapter and the next
one, the Literature Review chapter.
According to the National Pollutant Release Inventory-1999, the total releases of
benzene from facilities that reported the largest on-site releases are 1,523.061
tonnes [15]. Benzene is widely used in industries and its releases result in
1

quantifiable concentrations in a variety of media to which humans and other
organisms may be exposed. The most important source of human exposure to
the benzene in Canada is ambient and indoor air, food, and drinking water.
Benzene has been revealed to cause cancer. It can cause undesirable effects at
any level of exposure, so for this reason benzene is a "non-threshold toxicant",
therefore, according to the Canadian Environmental Protection Act, benzene is
believed to be "toxic" [20],
Copper is very abundant in the earth's crust and has very important properties in
the same time. Therefore it is one of the major metals in most industries
approximately. Because of this wide availability in nature and industry, the
copper and its compounds can enter the water bodies and share in the water
pollution problem [29], The Canadian total releases of copper and its compounds
are 1,265.328 tonnes as documented in National Pollutant Release Inventory-
1999; this is only for the facilities that considered producing the largest on-site
releases [15].
Generally the removal of contaminants or hazardous compounds from aqueous
streams by conventional methods is not economical in the cases of huge
volumes of dilute wastewaters that must be handled. Some existing methods of
separating soluble compounds from a stream usually involve a phase change, as
in distillation only, or distillation preceded by extraction, a number of treatment
methods, such as adsorption, chemical precipitation, or oxidation and ion
exchange, need a physicochemical treatment or pretreatment and are no longer
2
environmentally acceptable due to the low level of pollutants or contaminants
allowed in wastewater discharges. The high cost of precipitating and complexing
agents and the probability of not separating all of the contaminants that need to
be removed make this choice also not efficient [24],
To remove different organic and inorganic pollutants from aqueous solutions,
micellar-enhanced ultrafiltration (MEUF) has been used. It has been found to be
a capable method of removing low levels of pollutants like organic compounds
and heavy metal ions [60],
Micellar-enhanced ultrafiltration (MEUF), a membrane separation process utilises
surface active agents to form micelles that capture the contaminants to enhance
the filtration process, has the capability to remove the organics and heavy metal
ions either separately or simultaneously. This capability is not the only reason to
select MEUF as a process to remove the contaminants.
The energy consumption of micellar-enhanced ultrafiltration is considered to be
very low compared to the above conventional methods since the required energy
is only for pumping water through the membrane filter and for the separation
processes such as filtering and precipitation that are needed for polishing the
permeate or surfactant recovery from retentate. For this economical reason
besides its efficiency, the micellar-enhanced ultrafiltration (MEUF) could be an
alternative of the high energy consumption techniques. The surfactant molecules
3

that do not participate in micelle formation represent a disadvantage since these
molecules can leak throughout the filter membrane into the flux of permeate [48].
To overcome this problem of secondary pollution, rhamnolipid has been utilised
as a biological surfactant, (biosurfactant), instead of chemical surfactants in this
research because of its biodegradability and low toxicity.
1.2 OBJECTIVE OF THIS RESEARCH
The utilization of surfactants obtained by chemical synthesis to remove the
contaminants from aqueous solutions will solve a problem but it will create a new
one since the chemical surfactant is toxic and non-biodegradable. To solve
these two problems together, biodegradable surfactants (biosurfactants) have
been used as an environmentally acceptable alternative for chemical surfactants.
Therefore, the general objective of this research is to investigate and determine
the ability of rhamnolipid biosurfactant (JBR425) to remove organic molecules
and heavy metal ions either separately or simultaneously and to determine what
the efficiency of that removal is.
The specific objectives of this research are to:
1. Determine the molar ratio (MR) of rhamnolipid biosurfactant to copper
ions, as heavy metal contaminants, that reject 100% of the copper ions.
4

2. Determine the molar ratio (MR) of rhamnolipid biosurfactant to benzene
molecules, as organic contaminants, that reject 100% of the benzene
molecules.
3. Investigate the effect of presence of benzene on the 100% rejection molar
ratio of rhamnolipid to copper.
4. Investigate the effect of presence of copper on the 100% rejection molar
ratio of rhamnolipid to benzene.
1.3 ORGANIZATION OF THIS THESIS
This thesis consists of five chapters, a list of references, and appendices. The
necessary theoretical background of micellar-enhanced ultrafiltration and the
main related subjects have been discussed in Chapter two such as the important
membrane filtration processes, the surfactants, and the micelle mechanisms of
the contaminants removal. Chapter three includes the chemicals, methods, and
the experimental design. In Chapter four, the results of conducted experiments
are presented and discussed. The conclusions of this research and
recommendations for future work are summarized in Chapter five. References
are listed at the end of this thesis.
5

CHAPTER TWO
BACKGROUND AND LITERATURE REVIEW
2.1 INTRODUCTION
This background and literature review chapter reviews the current literature on the
potential of rhamnolipid efficiency to remove simultaneously benzene and copper from
aqueous streams and micellar-enhanced ultrafiltration system used for this reason. To
facilitate the understanding of this study including this literature review, background
knowledge on other surfactants and filtration systems is presented as well.
2.2 BENZENE
In 1825 Michael Faraday was the first to isolate the benzene from the liquid condensed
by compressing oil gas [29], All 12 atoms of benzene, C6H6, lie in a single plane Figure
2.1. Benzene is one of the natural petroleum components. However, it represents a
small amount in most crude oils (less than 1.0% by weight). According to the
Environmental Protection Agency (EPA) classification, benzene is a hazardous waste
and under Section 11 of the Canadian Environmental Protection Act it is considered to
be "toxic" [29], [20].
6
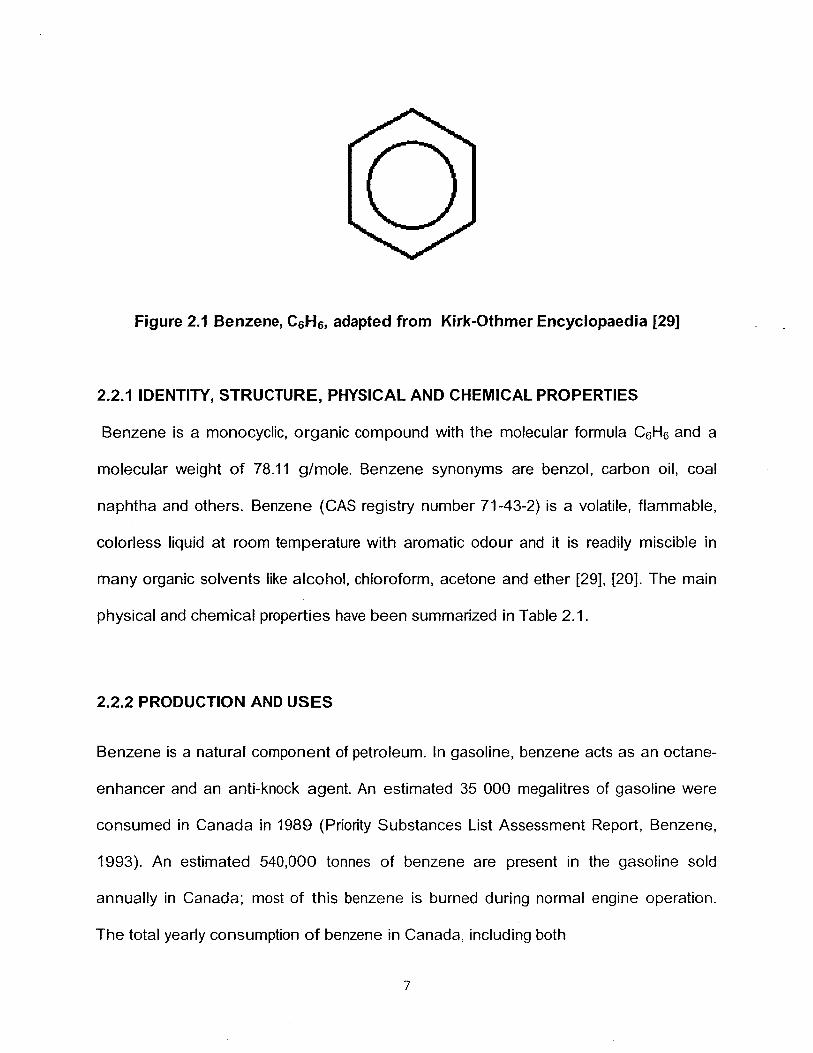
Figure 2.1 Benzene, C6H6, adapted from Kirk-Othmer Encyclopaedia [29]
2.2.1 IDENTITY, STRUCTURE, PHYSICAL AND CHEMICAL PROPERTIES
Benzene is a monocyclic, organic compound with the molecular formula CeH6 and a
molecular weight of 78.11 g/mole. Benzene synonyms are benzol, carbon oil, coal
naphtha and others. Benzene (CAS registry number 71-43-2) is a volatile, flammable,
colorless liquid at room temperature with aromatic odour and it is readily miscible in
many organic solvents like alcohol, chloroform, acetone and ether [29], [20], The main
physical and chemical properties have been summarized in Table 2.1.
2.2.2 PRODUCTION AND USES
Benzene is a natural component of petroleum. In gasoline, benzene acts as an octane-
enhancer and an anti-knock agent. An estimated 35 000 megalitres of gasoline were
consumed in Canada in 1989 (Priority Substances List Assessment Report, Benzene,
1993). An estimated 540,000 tonnes of benzene are present in the gasoline sold
annually in Canada; most of this benzene is burned during normal engine operation.
The total yearly consumption of benzene in Canada, including both
7

Table 2.1 Benzene's most important physical and chemical properties, adapted
from Environment Canada, Environmental Protection Service, Hemond and
Fechner-Levy [41], [14], [23].
PROPERTY VALUE
MELTING POINT 5.53 °C
BOILING POINT 80.1 at 101.3 kPa
FLASH POINT -11 °C
HENRY'S LAW CONSTANT 0.24
DENSITY 873.7 kg/m3
WATER SOLUBILITY 820-2167 mg/l a t25°C
VAPOUR PRESSURE 10.1-13.2 kPa at 25 °C
Log Kow 1.56-2.69
HEAT OF COMBUSTION 41.8 kJ/gat 25 °C
8

isolated benzene and benzene as a component of gasoline, is therefore estimated to be
1,362,000 tonnes. In Canada in 1990, 765,000 tonnes of isolated (purified) benzene
were produced, 131,000 tonnes were imported while 74,000 tonnes of these were
exported, leads to a domestic use for the rest quantity of isolated benzene (Priority
Substances List Assessment Report, Benzene, 1993). In Canada, most isolated benzene is
produced from petroleum sources. Commercially benzene can be produced from
natural gas condensates, petroleum, or coal [20], Benzene is used in a very wide sector
of industries like oils, greases, resins, inks, paints, and motor fuels, a fat solvent, also in
the manufacture of plastics, synthetic rubber, textiles, detergents, explosives, packing
materials, pharmaceuticals, disinfectants, and pesticides. In Canada, benzene is used
mainly for the production of ethylbenzene, styrene, cumene, cyclohexane, and maleic
anhydride [5],
2.2.3 NATURAL AND ANTHROPOGENIC SOURCES AND RELEASES
Benzene exists in nature at low concentrations and is a crude oil component. One of the
main sources of benzene for water and soil are petroleum spills and seepage. For
groundwater, benzene enters from rocks. Forest fires, volcanoes considered to be
important sources for air and the volatile chemicals from plants too. The emissions from
natural sources is believed to be generally low in comparison with anthropogenic
sources, however the levels of these emissions are unknown. Other sources of benzene
to the environment include the use, production, storage, emissions from fuel
combustion, and transportation of isolated benzene, crude oil, and gasoline.
9

In 1985, according to the estimations 34,150 tonnes of benzene were released into the
Canadian atmosphere (Priority Substances List Assessment Report, Benzene, 1993).
Surface water contamination could result from spills of petroleum and chemical products
besides the industrial and municipal effluents. It is estimated that every year in Canada,
34,000 tonnes of benzene are released into the atmosphere, 1000 tonnes into water,
and 200 tonnes onto soil [20], The National Pollutant Release lnventory-1995 shows
that benzene is one of the 25 highest releases by weight through Canada [5].
2.2.4 ENVIRONMENTAL FATE
In soil, benzene biodegrades mainly under aerobic conditions. In surface water, it
rapidly volatilizes to the air, biodegrades with a half-life of a few days to weeks, or
reacts with hydroxyl radicals with a half-life of several weeks to months. In air, it reacts
with hydroxyl radicals, with a half-life of about 5 days [62].
2.2.5 CANADIAN ENVIRONMENTAL LEVELS AND DRINKING WATER GUIDELINE
According to 586 samples of ambient air surveyed between 1988 and 1990, the mean
concentrations of benzene were range from 1.2 to 14.6 pg/m3 in ten Canadian cities.
41.9 pg/m3 was the maximum 24-hour average concentration and 4.4 pg/m3 the overall
mean concentration [41]. Surface water concentrations of benzene in general are low.
Non-detectable to 5 pg/L are the concentrations documented in Canadian water quality
guidelines (CCREM ,1987) for several locations in the St- Lawrence River and Ontario
[41], [5], Normally, the concentrations of benzene were in the range of 50-200 pg/L.
The maximum contaminant concentration of 500 pg/L [41]. Benzene levels were
approximately below the detection limits (2 pg /kg dry soil) in two-thirds of the soil
10

samples. Soil samples concentrations collected from a Port Credit petroleum plant and
a refinery in Oakville, Ontario were less than 0.002 to 0.16 pg /kg dry soil [41]. The
maximum acceptable concentration (MAC) for benzene in drinking water is 0.005 mg/L
(5 M9/L) [17].
2.2.6 EFFECTS ON HUMANS
Death may be caused by acute exposure to 65 g/m3 of benzene. Acute exposure
primarily affects the central nervous system at high concentrations of benzene. High
benzene concentrations (325 mg/m3) may ultimately result in leukaemia [62].
2.3 COPPER
Early humans used copper as one of the first metals they discovered and knew. About
8500 B.C. was the earliest use of copper. The records indicate that this was in northern
Iraq. Copper has an average estimated concentration of 55 mg/kg in the earth's crust
which is one of the most available metals. Copper is a preferred metal for conductors
and especially for electrical wires [29].
For adults, the dose between 4 and 400 mg of copper (II) ion per kg of body weight is
considered to be the acute lethal dose, based on suicide cases and data from
accidental ingestion. Copper ions, at lower doses, can cause symptoms like vomiting,
headache, and diarrhoea [62],
l i

2.3.1 IDENTITY, STRUCTURE, PHYSICAL AND CHEMICAL PROPERTIES
Copper (CAS registry number 7440-50-8), has the symbol Cu and the atomic number
29. Absorption caused by optical transitions in copper structure give its distinguishing
red color. Copper forms monovalent and divalent cations, cuprous and cupric
respectively. It is a transition metal and shows stability in its metallic state. 63Cu (69.2 %
abundance) and 65Cu (30.8% abundance) are the two stable isotopes. General copper
compounds are copper (II) acetate monohydrate, copper (II) chloride, copper (II) nitrate
trihydrate, copper (II) oxide, and copper (II) sulphate pentahydrate [29], [62], and [21].
2.3.2 PRODUCTION AND USES
Copper as a metal is ductile and has a good electrical and thermal conductivity. Copper
is used to make pipes, valves, electrical wiring, and building materials. It is used in
alloys like bronze and brass and also in the coatings. Food additives are one of the
copper compound uses and they can be part of animal feeds and fertilizers.
Compounds of copper are used in algaecides, insecticides, wood preservatives,
petroleum refining, and in electroplating [62],
2.3.3 NATURAL AND ANTHROPOGENIC SOURCES AND RELEASES
Natural Flux to Atmosphere and Oceans
Copper enters the natural environment since it is abundant in the earth's crust by
different mechanisms like volcanic dust, ashes, and by riverbed erosion [29].
12

Table 2.2 Pure copper physical properties, adapted from Kirk-Othmer
Encyclopaedia [29].
Property Value
atomic weight 63.546
atomic volume, cm3/mol 7.11
mass numbers, stable isotopes 63(69.1%), 65(30.9%)
oxidation states 1,2,3
density, g/m3 8.95285 (pure, single crystal) 8.94 (nominal)
thermal conductivity, W/(m)(K) 394
electrical resistivity at 208C, nQ_m 16.70
melting point 1358.03 K(1084.88°C)
heat of fusion, kJ/kg 212
boiling point 2868 K (2,595°C)
surface tension, mN/m 1300 (99.99% Cu, 1084°C, vacuum)
13

Mining operations of copper have all the time been faced with the problem of large
solid-waste disposal. Wastes of course contain small copper concentrations [29].
Introduction of the metal to freshwater and saltwater bodies by rainwater runoff is the
main concern because aquatic life may be harmfully affected. Many sources can supply
copper to rainwater runoff which enters water bodies through the breakdown of copper-
based antifouling paints, chemicals, wood preservatives, landfills as seepage, or
through the use of copper algaecides in lakes and ponds [29].
Anthropogenic Sources and Releases
In 2007, the Canadian total on-site releases of copper were 801 tonnes and the total
disposals were 2541 tonnes [63].
2.3.4 ENVIRONMENTAL FATE
In water, elemental copper fate is complex and affected by many factors such as pH
and dissolved O2. Copper surface oxidation produces copper (I) oxide or hydroxide.
Mainly, copper (I) ion is consequently oxidized to copper (II) ion. The copper (II) ion is
the common oxidation state in pure water. Removing dissolved copper ions from
solution has to be done with precipitation or sorption to organic solids, clays, and
minerals. Clay materials strongly adsorb copper depending on pH values. Collected
copper from wastewater during treatment is in the sludge. Copper removal from the
atmosphere is by rain, snow, gravitational settling, and dry disposition [62].
2.3.5 LEVELS IN THE CANADIAN ENVIRONMENT
The average daily exposure for copper in Canada has been reported in Table 2.3.
14

Table 2.3 Average values of the daily exposures, Adapted from Health Canada
website [22].
Route Concentration
(mg/day)
% of total
mg/kg body
weight/day
Food 2.200 89.14 0.0314
Water 0.264 10.70 0.00377
Air 0.00070-0.004 0.16 0.00001-0.00006
Total 2.468* 100.00 0.0352*
(* Maximum exposure assumed to be through air.)
2.3.6 EFFECTS ON HUMANS, ACUTE EXPOSURE
Based on data obtained from accidental ingestion and suicide cases, adults acute lethal
dose is 4 - 400 mg of copper(ll) ion per kg of body weight, human beings ingesting high
doses of copper could have many symptoms like gastrointestinal bleeding, haematuria,
intravascular haemolysis, hepatocellular toxicity. Copper ions may cause symptoms, at
lower doses, typical of food poisoning such as diarrhoea, headache, and vomiting. After
15-60 minutes of exposure, symptoms usually appear. Children could be affected with
lower levels depending on some studies [62].
15

2.4 MEMBRANE SEPARATION PROCESSES
According to many factors like membranes driving forces or areas of application,
membrane separation processes can be very different from each other. The main
membrane separation processes have been summarized in Table 2.4 with their
operating principles and applications [57].
Table 2.4 Membrane separation processes, their driving force, and applications.
Adapted from Ullmann's Encyclopaedia [57].
Separation
Process Membrane type used
Applied driving
force Applications
Microfiltration
symmetric porous
membrane, pore radius
0.1-10 pm
hydrostatic pressure,
0 .05-0 .2 MPa
water purification,
sterilization
Ultrafiltration
asymmetric porous
membranes, pore radius
2 - 10 nm
hydrostatic pressure,
0.1 - 0 . 5 MPa
separation of
molecular mixtures
Reverse
osmosis
asymmetric skin-type
solution-diffusion
membrane
hydrostatic pressure,
1 - 1 0 MPa
sea- and brackish
water desalination
Dialysis symmetric porous
membrane
concentration
gradient artificial kidney
Electrodialysis symmetric ion-exchange
membrane electrical potential water desalination
16

2.4.1 REVERSE OSMOSIS
To separate low molecular mass compounds, particles, and macromolecules from a
solvent, generally water, reverse osmosis is considered a very suitable technique.
Feed solutions frequently have a considerable osmotic pressure that should be
overcome by applied hydrostatic pressure. Solutions osmotic pressure holding low
molecular mass solutes can be rather high even with low solute concentrations. The
difference of hydrostatic pressure is the driving force in this process. The structure of
the membrane is asymmetric. The membrane side which faces the feed solution has a
dense barrier layer [57],
2.4.2 ULTRAFILTRATION
Macromolecules are the retained components by an ultrafiltration separation process
with membranes of asymmetrical structure mostly and skin layer pores of 2 - 10 nm in
diameter. Pressure gradient is the driving force and convective flux passing through
pores is dominating the mass transport. The separation in ultrafiltration depends on the
difference of hydrostatic pressure and the asymmetric porous membrane with small
pores compared to membranes of the microfiltration process. The retained components
are of molecular weight between 5000 and several million Daltons [57],
17

2.4.3 MICROFILTRATION
When the required particles to be separated from a solvent have a diameter range of
0.1 -10 pm, the microfiltration then is the suitable process to separate these particles by
a mechanism that is derived from a sieving effect. The applied hydrostatic pressure
differences range is 0.05 - 0.2 MPa and the pressure gradient is the driving force for the
mass to transport across a membrane with a symmetric porous structure [57].
2.4.4 DIALYSIS
When a specific solute is transferred through a membrane to a receiving or stripping
solution by the influence of the concentration gradient, this is called dialysis. Compound
separation depends on diffusivity differences in the matrix of the used membrane [57],
2.5 CLASSIFICATION OF FILTERS
2.5.1 DEPTH FILTERS
Depth filters are filters where the particle removal or filtration occurs inside the depths of
the material matrix of the filter. This matrix is composed of randomly oriented fibres or
beads. These filters are used in dead-end filtration [7],
18

2.5.2 SCREEN FILTERS
Screen filters have the capability of retaining the particles on their surfaces. These filters
have a structure which is in general more rigid, continuous, uniform, and with a defined
pore size [7].
TEES
J i
f MCROPOROUS
l [ 1
i
1 ASYMMETRIC
M
i
ANISOTROPIC INTEGRALLY NON- INTEGRAL LY SK
Figure 2.2 Filter classification. Adapted from Cheryan [7].
1 9

2.6 MEMBRANE CLASSIFICATIONS
According to the ultrastructure, as in Figure 2.2, screen filters are classified as
asymmetric and microporous which are subdivided in to isotropic (uniform pore size
throughout the membrane body) and anisotropic (non-uniform size of the pore on
membrane surfaces). Asymmetric membranes which can be called skinned membranes
can be subdivided in to integrally skinned and non- integrally skinned [7].
2.6.1 CONVENTIONAL MODULES OF ULTRAFILTRATION
One of the important requirements of modules is to be removed and replaced with
simple procedures since the membranes have short operation life time. Another
important factor is the way that these modules control the feed fluid flow turbulent flow is
the main operational flow that used for the most devices utilize cross-flow membrane,
so the conduit diameter should not subjected to a sudden contraction or expansion in
order to get a low energy consumption design. These contractions and expansions have
very less importance in laminar flow modules than the limiting factor in this kind of flow
which is the smallest passage diameter in which fluid has to flow [43]. Table 2.5 shows
the main modules of ultrafiltration with their advantages and disadvantages. The other
filtration technologies where these modules are used as shown below are MF
(microfiltration), UF (ultrafiltration), NF (nanofiltration), and RO (reverse osmosis).
20
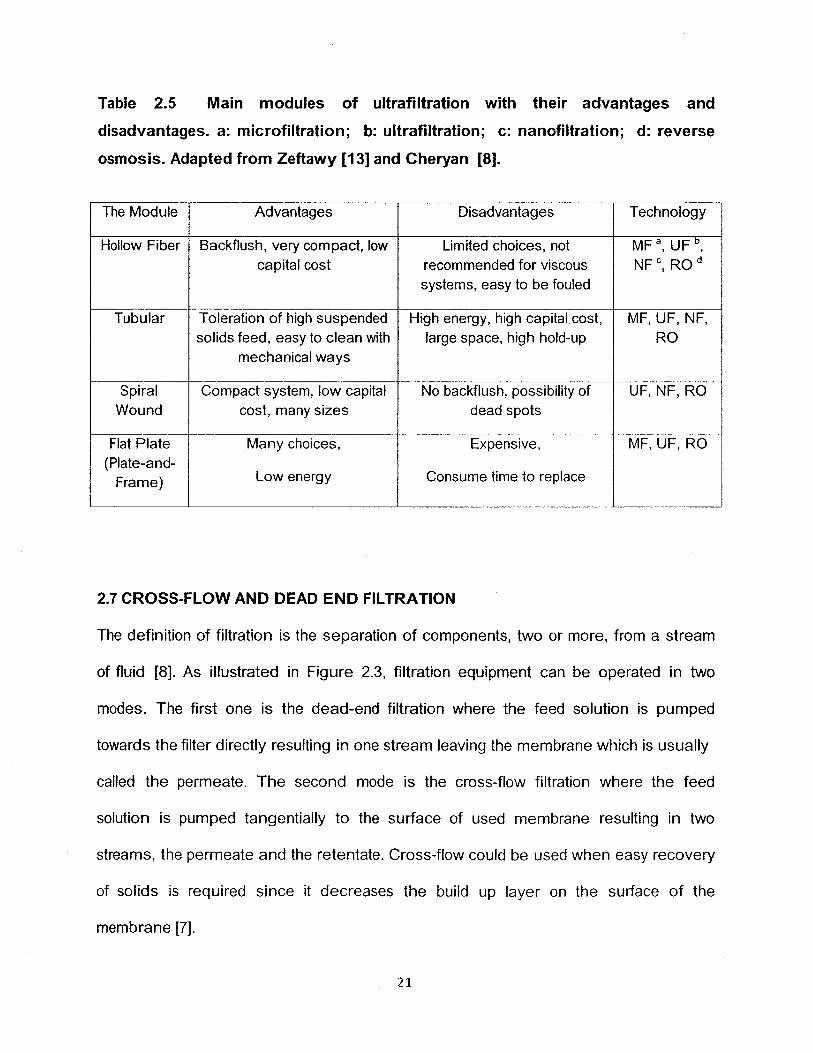
Table 2.5 Main modules of ultrafiltration with their advantages and
disadvantages, a: microfiltration; b: ultrafiltration; c: nanofiltration; d: reverse
osmosis. Adapted from Zeftawy [13] and Cheryan [8].
The Module Advantages Disadvantages Technology
Hollow Fiber Backflush, very compact, low capital cost
Limited choices, not recommended for viscous systems, easy to be fouled
MFa, UFb, NFc, RO d
Tubular Toleration of high suspended solids feed, easy to clean with
mechanical ways
High energy, high capital cost, large space, high hold-up
MF, UF, NF, RO
Spiral Wound
Compact system, low capital cost, many sizes
No backflush, possibility of dead spots
UF, NF, RO
Flat Plate (Plate-and-
Frame)
Many choices,
Low energy
Expensive,
Consume time to replace
MF, UF, RO
2.7 CROSS-FLOW AND DEAD END FILTRATION
The definition of filtration is the separation of components, two or more, from a stream
of fluid [8]. As illustrated in Figure 2.3, filtration equipment can be operated in two
modes. The first one is the dead-end filtration where the feed solution is pumped
towards the filter directly resulting in one stream leaving the membrane which is usually
called the permeate. The second mode is the cross-flow filtration where the feed
solution is pumped tangentially to the surface of used membrane resulting in two
streams, the permeate and the retentate. Cross-flow could be used when easy recovery
of solids is required since it decreases the build up layer on the surface of the
membrane [7].
2 1

DEAD - END FILTRATION CROSS - FLOW FILTRATION
0 FEED
FEED
0 O O Q. i&OOQOQ^^O CAKE ZS°o ° <Po 0 °o o oPan Q 0 0
PERMEATE
RETENTATE
Rc , Cake Resistance
J, The Flux
Time
J, The Flux
Rc, Cake Resistance
Time
Figure 2.3 Dead-end (conventional) and cross-flow filtration. Adapted from
Cheryan [7].
22

2.8 MICELLAR ENHANCED ULTRAFILTRATION (MEUF)
To separate high molecular weight molecules, traditional ultrafiltration could be one of
the recommended choices. However separation of small molecular weight molecules
such as metal ions or organic solutes with the same way is not effective. When a
surfactant is added at higher than its critical micelle concentration (cmc) to a polluted
water, the surfactant starts to form large amphiphilic aggregates (micelles). These
micelles are capable of attracting metal ions on their surfaces and solubilizing organic
molecules in their interiors.
If this solution of polluted water and surfactant is passed through a membrane with
pores smaller than micelles volume then this filtration is called the micellar-enhanced
ultrafiltration (MEUF), as shown in Figures 2.4 and 2.5, and the permeate will be a clean
water with very low concentrations of surfactant monomers and unbound organic
molecules or metal ions [53],
There are a lot of potential applications for an improved, separation process of low
energy to remove dissolved metals or organics from water in present industries. Such
applications may include toxic metal separation from or valuable metal concentration
from dilute streams industrial wastewater streams [18].
23

RHAMNOLIPID MICELLE WITH SOLUBILIZED BENZENE MOLECULES RETENTATE
Figure 2.4 Simultaneous removal of Cu (II) ions and benzene molecules from
aqueous solutions utilizing Micellar-Enhanced Ultrafiltration (MEUF system).
Adapted from Misra et al. [36].
Benzene molecule
Rhamnolipid monomer
Copper ion
Flow direction
Ultrafiltration membrane
Membrane pore
Clean Water (Permeate)
Micelle containing t ~ solubilized benzene • » molecules and attracted
copper ions
Figure 2.5 Simultaneous removal of Cu (II) ions and benzene molecules from aqueous solutions utilizing Micellar-Enhanced Ultrafiltration (inside the membrane).
24

2.8.1 CRITICAL MICELLE CONCENTRATION (CMC)
When surfactant solution remain below a critical value of concentration (CMC) as shown
below in Figure 2.6, then surfactant molecules will continue to be mainly in a single
monomer state. At the CMC or higher values the single molecules start to form the
micelles. As shown in Figure 2.7, the hydrophilic heads are aligned at the micelle
surface and exposed to the aqueous phase while the hydrophobic tails are gathered
inside the micelle [51], Micelles are in dynamic equilibrium of association-disassociation
with monomers in the solution which represents the difference between micelles and
other colloids [37]. In general, micelles are spherical for many common ionic surfactants
in the absence of electrolyte and concentrations ranging from the cmc to a minimum of
10 times the cmc [9]. Micelles consist of monomers that average 30-200 monomers
Figure 2.6 Surfactant below and above cmc (micelle formation). Adapted from
Hudson [25],
[50],
BELOW CMC (MONOMERS)
ABOVE CMC (SPHERICAL MICELLES FORMATION)
25
The Aqueous Phase
Figure 2.7 Micelle in aqueous solution. Hydrophobic tails are gathered inside the
micelle and hydrophilic heads are exposed to the aqueous phase. Adapted from
Tadros [54].
> fc LL) CL O ir CL < g CO >•
x Q.
CRITICAL MICELLE CONCENTRATION (CMC)
SOLUBILITY
y
SURFACE TENSION
INTERFAQ AL TENS! ON
SURFACTANT CONCENTRATION
Figure 2.8 Solubilization, surface tension, and interfacial tension versus the
concentration of surfactant. Adapted from Mulligan [38].
2 6

2.8.2 CONCENTRATION POLARIZATION
Because of the build up effect of retained compounds in membrane separation
processes, near the membrane interface, a gradient of concentration usually occurs.
The concentration polarization is the name of this effect. Increasing the flux of permeate
results in an increase in the concentration polarization which leads to the reduction of
permeation driving force and eventually leads to low selectivity of separation and lower
flux [4].
Figure 2.9 Concentration polarization of macromolecular solutes and colloidal,
showing the build up of the polarized (gel) layer and associated boundary layer.
Adapted from Cheryan [7].
Membrane Gel Layer
PERMEATE
J
M > 0
27
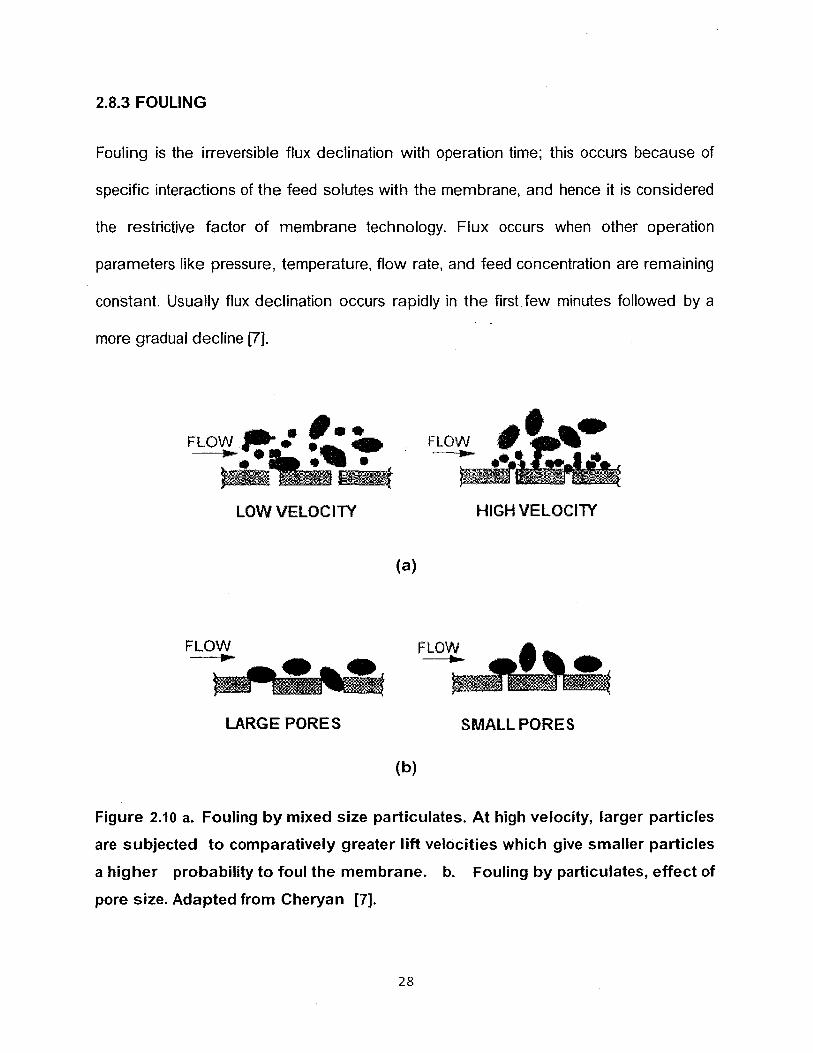
2.8.3 FOULING
Fouling is the irreversible flux declination with operation time; this occurs because of
specific interactions of the feed solutes with the membrane, and hence it is considered
the restrictive factor of membrane technology. Flux occurs when other operation
parameters like pressure, temperature, flow rate, and feed concentration are remaining
constant. Usually flux declination occurs rapidly in the first few minutes followed by a
more gradual decline [7].
LARGE PORES SMALL PORES
(b)
Figure 2.10 a. Fouling by mixed size particulates. At high velocity, larger particles
are subjected to comparatively greater lift velocities which give smaller particles
a higher probability to foul the membrane, b. Fouling by particulates, effect of
pore size. Adapted from Cheryan [7].
2 8

2.9 SURFACTANTS
Surface active agents are chemical compounds and they are composed of a polar or
ionic portion (the head-group) and a linear or branched hydrocarbon portion in their
most general structure as in Figure 2.11 [55], Other references define the surfactants as
follows: A surface active amphiphile (molecules with hydrophilic "water-loving" and
hydrophobic "water-hating" parts) that aggregates in solvents like water to form micelles
or other different microstructures [40], [32], Surfactants reduce the system free energy,
at an interface, by replacing the higher energy bulk molecules [38], [39],
Figure 2.11 Surfactant monomer, the building unit of the micelle, adapted from
Tadros [55] and Myers [40].
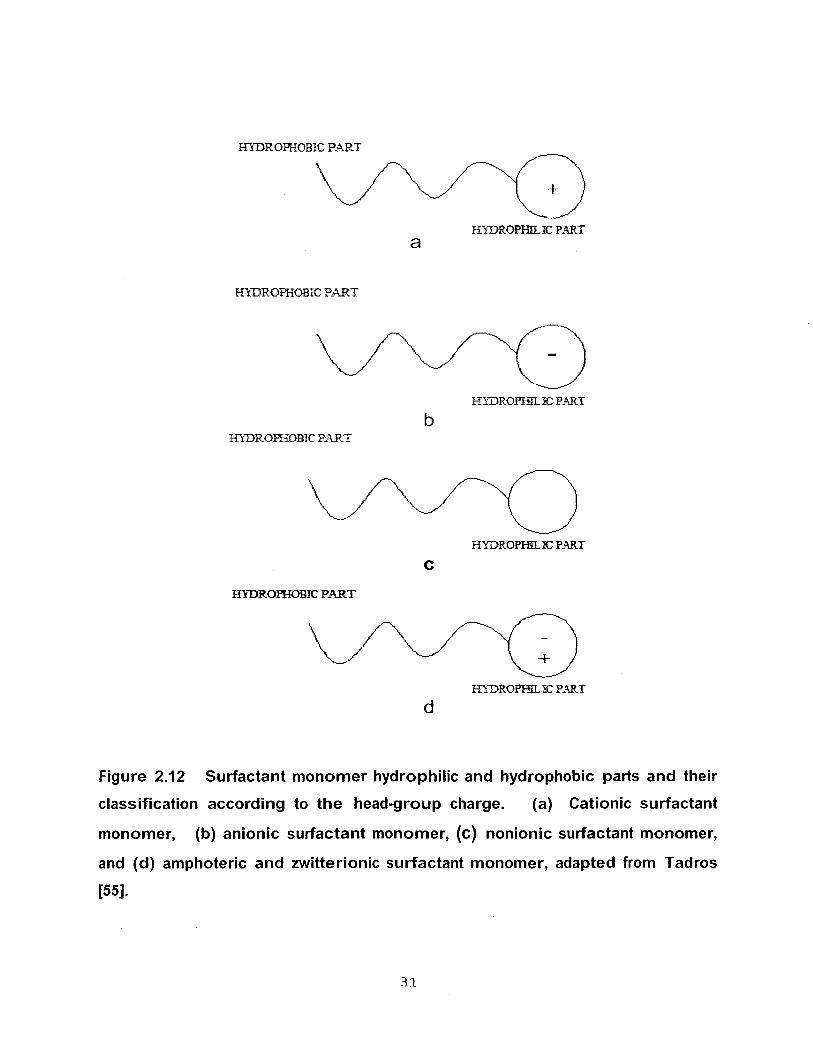
2.9.1 GENERAL CLASSIFICATION OF SURFACTANTS
The classification generally used is depending on the head-group nature as illustrated in
Figure 2.12 [55]. Cationic surfactants contain a positive charge on the molecule
surface- active portion [40], Anionic surfactants possess a negative charge on the
molecule surface-active portion [40] and nonionic surfactants do not have any electrical
Chain or Tail Head Group
Branched or linear
29

charge [40]. When the functional group of an amphiphilic compound, depending on the
pH, has the ability to carry both cationic and anionic charges then the surfactant is
amphoteric. If amphiphiles demonstrate cationic and anionic behaviour independent of
the pH then the surfactant is zwitter-ionic [16].
2.10 BIOSURFACTANTS
The biosurfactants are produced either on the surfaces of microbial cell or excreted
extracellularly. The biosurfactants have both moieties, hydrophilic and hydrophobic.
Compared to the chemical surfactants, the biosurfactants have more advantages like
the high selectivity at extreme temperatures and pH, higher biodegradability, and lower
toxicity. Some biosurfactants have low CMC in addition to the high surface activities the
reasons that make these biosurfactants are promising as a substitutes for the synthetic
surfactants [56]. Inexpensive raw materials can be used to produce biosurfactants.
These materials are available in big quantities. For the interest of bulk production,
biosurfactant can be produced from industrial wastes as well as their by-products [56].
Biosurfactants have been used in many industrial applications such as petroleum,
environmental, food, biological, and agricultural industries [30].
2.10.1 CLASSIFICATION OF BIOSURFACTANTS
Biosurfactant classification is based mainly on the categorization of their microbial origin
and their chemical composition [12].
30
HYDROPHOBIC PART
HYDROPML JC PART a
HYDROPHOBIC PART
HYDROPHIL JC PART
b HYDROHIOBIC PART
HYDROPMLJC PART
C
HYDROPHOBIC PART
HYDROPKL1C PART
d
Figure 2.12 Surfactant monomer hydrophilic and hydrophobic parts and their
classification according to the head-group charge. (a) Cationic surfactant
monomer, (b) anionic surfactant monomer, (c) nonionic surfactant monomer,
and (d) amphoteric and zwitterionic surfactant monomer, adapted from Tadros
[55].
3 1

Table 2.6 Main biosurfactants classified according to chemical composition.
Adapted from Kosaric [31].
1. Glycolipids 4. Polymeric Surfactants
Trehalose mycolates Lipoheteropolysaccharide
Trehalose esters Heteropolysaccharide
Mycolates of mono-, di-,and trisaccharide Polysaccharide protein
Rhamnolipids Mannoprotein
Sophorolipids Carbohydrate protein
2. Phospholipids and Fatty Acids Mannanlipid complex
Phospholipids and fatty acids Mannose/erythrose lipid
Phospholipids Carbohydrate protein-lipid complex
3. Lipopeptides and Lipoproteins 5. Particulate Biosurfactants
Gramicidens Membrane vesicles
Polymyxins Fimbriae
Ornithine lipid Whole cells
Cerilipin
Lysinlipid
Surfactin. Subtilysin
Peptide lipid
32

2.10.2 RHAMNOLIPIDS
The rhamnolipid biosurfactants produced by Pseudomonas species, when grown on
different carbon substrates, have shown surface active properties. Pseudomonas
aeruginosa has the ability to produce four different rhamnolipids. These rhamnolipids
are composed of one or two L-rhamnose units and one or two units of li-
hydroxydecanoic acid. Two of the rhamnolipids, RL1 and RL3, are the principal
products of Pseudomonas aeruginosa while RL2 and RL4 could be biosynthesized only
when certain cultivation conditions are available [56], Rhamnolipids (R1-R4) are anionic
biosurfactants. The interfacial tension against n-hexadecane can be lowered to about 1
mN/m and surface tension to 25 - 30 mN/m depending on the salt concentration and pH
when pure rhamnolipids from Pseudomonas spp. are utilized [31]. Figure 2.13 illustrates
the structures of R1 to R4 mentioned above. Recent studies showed that there are
seven rhamnolipid homologues that have been identified. These biosurfactants are
capable of lowering the water surface tension to 29 mN/m [33]. At pH values above 4.0,
rhamnolipid molecules show anionic behaviour [42].
2.10.3 ENVIRONMENTAL APPLICATIONS OF RHAMNOLIPID
BIODEGRADATION OF PETROLEUM HYDROCARBONS
Rhamnolipid can enhance the biodegradation when is added to hexadecane,
octadecane, phenanthrene, and n-paraffin in liquid systems, as well as the hexadecane,
pristine, tetradecane, creosote and hydrocarbon mixtures in soils [38].
33

Vh
J ™ } '
0 1
I OH
| H - C H f C O - ( H
0 1
c h 2 - c - o h
{CH^
C:H, j f
(CH2)s
HO
0 1
CH -CH2 -C -O-CH - c i ^ - C - O H
chjeis ;ch2)6
€H*
R 1 R 2
I OH >-c ~ CH2-C "OH
HO — r I
OH CH2)g
c h 3
OH >~<MCH ~ CH2-C ~ OH
O
R 3 R 4
Figure 2.13 Four different rhamnolipid structures produced by P. aeruginosa.
Adapted from Mulligan [38].
34

REMOVAL OF HEAVY METALS
Rhamnolipid capability to remove metals like copper, cadmium, and zinc from soil and
ions is caused by its anionic nature. Rhamnolipid to metal molar ratio for copper is 2.31,
for cadmium is 1.91, and for zinc is 1.58 [33],
BIODEGRADATION OF POLYCYCLIC AROMATIC HYDROCARBONS (PAHs)
Rhamnolipids in a bioslurry were more effective than SDS, a chemical surfactant, up to
five times as they could improve the four-ring PAH solubilization more than three-ring
PAHs significantly [38].
DISPERSING OIL IN CONTAMINATED WATER
Since they are less toxic and persistent than synthetic surfactants, rhamnolipid can be
useful for oil spills. A new development is the feasibility of rhamnolipid biosurfactants for
dispersing oil slicks [38], [10]. Rhamnolipids biosurfactant are efficient for heavy metal
and hydrocarbon removal and could also be efficient for the removal of mixed
contaminants, metals and hydrocarbons. However, large scale studies have not been
performed [38],
The current study is an application of the mixed contaminant removal from simulated
polluted water samples with copper ions and benzene molecules using rhamnolipid
biosurfactant. Ultrafiltration with a hollow fiber membrane was used to perform this
separation process.
3 5

CHAPTER THREE
MATERIALS AND METHODS
3.1 INTRODUCTION
The main objective of this research is to determine the efficiency of rhamnolipid
biosurfactant (JBR 425) to remove both the heavy metal, copper in this case, and
organic pollutant, benzene in this case, simultaneously. This chapter includes the
experimental preparation including materials and methods, rhamnolipid
characterization, and experimental design. The experiments were divided into three
groups. Rhamnolipid characterization was done to obtain the critical micelle
concentration for the rhamnolipid surfactant. The first group is to determine the effect of
the operation factors. The second one is to determine the molar ratios that achieve
100% rejection for each pollutant, and the fourth group is to evaluate the efficiency of
the rhamnolipid biosurfactant to achieve the main objective of this research which is the
simultaneous removal of both, the copper ions and benzene molecules.
36

3.2 CHEMICALS AND BIOSURFACTANT
3.2.1 COPPER
A copper reference standard solution, ( a solution of copper nitrate and every 1 ml = 1
mg of copper), from Fisher Scientific was used to prepare the Atomic Absorption
standard solutions and to be diluted in different concentrations with distilled water to
prepare the artificially contaminated water samples with Cu+2 ions.
3.2.2 BENZENE
Benzene of purity more than 99% from Fisher Scientific was used for preparing the
artificially contaminated water samples with benzene molecules at different
concentrations and also for preparing the standard solutions to establish the calibration
curve of the high performance liquid chromatography (HPLC).
3.2.3 ACIDS AND BASES
Concentrated nitric acid (67-70 %) from Fisher Scientific was used to adjust the pH of
the artificial contaminated water samples and to prepare the standard solution (the
blank) of the atomic absorption spectroscopy. Sodium hydroxide (0.5N) from Fisher
Scientific was used as well to adjust the pH of the artificially contaminated water
samples.
37

3.2.4 RHAMNOLIPID BIOSURFACTANT, JBR 425
The biosurfactant JBR 425 is produced from centrifuged and sterilized fermentation
broth that has had all protein removed. JBR 425 is an aqueous solution of rhamnolipids
with concentration of 25%, (the used batch is 26%). The two main rhamnolipids R1,
(C26H4809, CAS Registry Number 37134-61-5), and R2, (C32H58013, CAS Registry
Number 4348-76-9), are present. The chemical composition of the rhamnolipids are
glycosides of rhamnose and |3-hydroxydecanoic acid [26].
Table 3.1 Physical properties of rhamnolipid biosurfactant, JBR 425, adapted
from Jeneil Biosurfactant Co. [26].
PARAMETER VALUE
SPECIFIC GRAVITY 1.05-1.06
pH 6 .5-7 .0
ODOR SOAPY
APPEARANCE AMBER SOLUTION
WATER SOLUBILITY SOLUBLE AT NEUTRAL PH
SUITABLE DILUENTS WATER AND MOST COMMON ALCOHOLS
SURFACE TENSION 29 mN/m
INTERFACIAL TENSION 0.3 mN/m
VOLATILITY NOT VOLATILE
STABILITY STABLE AT ROOM TEMPERATURE
* : pH 6.57 for the used batch
38

3.3 EQUIPMENT USED
3.3.1 QUIXSTAND ™ BENCHTOP SYSTEM ( ULTRAFILTRATION SYSTEM)
The MEUF (micellar-enhanced ultrafiltration) system, as shown in Figure 3.1, was used
to separate the copper ions which were adsorbed on the micelle surface and the
benzene molecules which were solubilized inside the micelle from the aqueous
solutions of copper-rhamnolipid, benzene-rhamnolipid, and copper-benzene-
rhamnolipid solutions. The Quixstand ™ Benchtop System 'M' Series from A/G
Technology Corporation was used to conduct the micellar-enhanced ultrafiltration
separation experiments. The system consisted of the feed reservoir, peristaltic pump
(Watson-Marlow ® 313 S), inlet pressure gauge, Xampler ™ cartridge ( hollow fiber
cartridge ), outlet pressure gauge, and back pressure control valve.
3.3.2 PERISTALTIC PUMP
The peristaltic pump ( Watson-Marlow ® 313 S) is from Watson-Marlow and for the
pump to be controlled as a simple dosing pump, then the Single / Continuous / Repeat
slider switch should be set to Single or Repeat. When the slider switch set on
Continuous, the way that pump was used during the experiments, the timing functions
are cancelled and the pump operates as a manual control variable speed unit through
knobs front panel control [59].
39

5
4
Figure 3.1 Flow diagram of the micellar enhanced ultrafiltration system, adapted
from A/G Technology Corporation [1].
(1) Feed reservoir; (2) Sampling/Drain ball valve;
(3) Feed sampling stream; (4) Peristaltic pump;
(5) Pressure gauge (6) Membrane cartridge;
(7) Flow meter; (8) Permeate stream;
(9) Backpressure control valve; (10) Retentate stream
40

3.3.3 XAMPLER™ CARTRIDGE
The hollow fiber cartridge from A/G Technology Corporation was used in the
ultrafiltration system. This cartridge represents the membrane filter and each one
contains a bundle of polysulfone fibres or tubules potted in parallel within a plastic
housing. Ultrafiltration membranes are classified according to their Nominal Molecular
Weight Cut-Off (NMWC). Table 3.2 shows the used Xampler ™ cartridge's main
characteristics [1],
Table 3.2 Main characteristics of the Xampler ™ cartridge, adapted from A/G
Technology Corporation [1].
Nominal Molecular Weight Cut-Off (NMWC) 5000
Cartridge Membrane Area (cm2) 140
Nominal Fiber ID (mm) 0.5
Nominal Number of Fibres 30
Transmembrane Pressure (10 -25 °C) 344.7 (kPa)
Nominal Flow Path Length 30 cm
Nominal Housing Identifier 3M
pH Range 2-13
4 1
3.4 RHAMNOLIPID CHARACTERIZATION AND EXPERIMENTAL DESIGN
3.4.1 RHAMNOLIPID CHARACTERIZATION: DETERMINATION OF RHAMNOLIPID
CRITICAL MICELLE CONCENTRATION (CMC)
The ability of rhamnolipid biosurfactant to adsorb or solubilize contaminants starts when
the micelles begin to be formed which means that the solution is at its critical micelle
concentration (CMC). To determine the concentration, two methods were chosen, the
first one was the Du Nouy method and the second one was the conductivity method.
DU NOUY METHOD
In this method the Surface Tensiomat® 21 from Fisher Scientific was used. Aqueous
solutions of rhamnolipid with different concentrations (0, 25, 50, 100, 500, 1000 mg/l),
were prepared to measure the surface tension and determine the CMC, the point where
the rhamnolipid concentration-surface tension values illustrates a sudden change over
a narrow range of rhamnolipid concentrations. The Surface Tensiomat® 21 shows the
apparent surface tension, P, which could be converted, to the absolute surface tension,
S [19].
S = P X F (3.1)
Where,
S = absolute surface tension
42
P = apparent surface tension as indicated by the dial reading
F = correction factor obtained from correction factor chart
CONDUCTIVITY METHOD
In this method the conductivity of aqueous solutions of rhamnolipid with different
concentrations, (0, 5, 10, 25, 29.5, 50, 100, 500, 1000 mg/l), were taken [11]. The CMC
value was determined where the concentration-conductivity curve demonstrates an
abrupt change over a short range of rhamnolipid concentrations. The conductivity meter
used was from HACH of the brand HQ 30d.
3.4.2 EXPERIMENTS OF GROUP ONE: EFFECT OF OPERATION PARAMETERS
ON FLUX
TRANSMEMBRANE PRESSURE
This experiment was conducted at room temperature, 22°C, by feeding the membrane
filter with the same distilled water at different transmembrane pressures, 40, 73, and
104 (kPa) through the peristaltic pump to see the effect of this factor on flux.
Transmembrane Pressure = ( (P inlet + P ou t le t ) /2 ) — P permeate ( 3 . 2 )
43

The flux was calculated by measuring the flow rate by using the flow meter connected to
the permeate stream then substituting the measured values in the flux equations 3.3 or
3.4 to obtain the fluxes [58], [1].
J = Q p / A system ( 3 . 3 )
Where,
J = Flux ( L / m2.h )
Q p = Permeate Flow ( L / h )
A system = Surface area of the membrane system ( m 2 )
Or,
Flux (L / m2.h) = (Permeate Flow (ml / min) / Cartridge Area (m2)) X 0.06 (3.4)
Then correcting these values to the standard temperature, 25°C, by applying the
equation 3.5
Temperature Corrected Flux = (Flux) T2 X (T1/T2) (3.5)
Where,
T1 = Reference Temperature (°F)
T2 = Actual Temperature (°F)
44

TEMPERATURE
Experiments were performed to observe the effect of temperature variance on flux at
room temperature, 22°C, by feeding the membrane filter through the peristaltic pump
with distilled water at different temperatures, 24°C, 38°C, and 53°C and the same
transmembrane pressure. The flux was calculated by measuring the flow rate using the
flow meter connected to the permeate stream then substituting the measured values in
the flux equation 3.4 to obtain the fluxes.
PUMP SPEED
To see the effect of this factor on flux and transmembrane pressure, feeding the
membrane filter with the same aqueous copper-rhamnolipid solution at different pump
speeds was carried out. More details will be discussed in Chapter 4. This experiment
was conducted at room temperature, 22°C.
FOULING
Since fouling is the decline of flux with time, an experiment to examine this important
factor was performed at room temperature, 22°C, by measuring the flux at different
times keeping all other factors, transmembrane pressure, temperature, concentration,
and pump speed constant for the aqueous copper-rhamnolipid solution.
4 5

EFFECT OF pH
All the experiments were conducted at the pH range of 6.81 to 7.11 since the
morphology of rhamnolipid is a pH function and this range of pH keep rhamnolipid
biosurfactant structure in micelle form, which was required to achieve the research
objective, also rhamnolipid solution surface tension is highly affected by pH changes.
Decreasing pH from 7.0 to 5.0 is increasing the surface tension from 30 to more than 40
mN/m [18], [64]. The other reason is to prevent the precipitation of positively charged
copper ions because the dirhamnolipid, the second major component of the used
rhamnolipid, is neutral for more than 98% of its molecules at pH 4.0, while the same
percentage is of negative charge when pH value is 7.4 [47], Sodium hydroxide was
used to adjust the pH.
3.4.3 EXPERIMENTS OF GROUP TWO: FINDING THE MOLAR RATIO, MR, FOR
THE 100% REJECTION AND INVESTIGATING THE RHAMNOLIPID
BEHAVIOUR IN THE PRESENCE OF COPPER AND BENZENE
The formation of rhamnolipid micelles is not the only factor that determines the ability of
rhamnolipid biosurfactant to separate contaminants from their aqueous solutions. Also
the molar ratio, MR, of the biosurfactant to the contaminant which means in this case
the quantity of rhamnolipid in moles to the number of either copper or benzene moles in
one litre of aqueous solution can also be used.
When a micellar-enhanced ultrafiltration operation is applied to a contaminated solution
with a particular substance (organic, heavy metal, or both), a biosurfactant has to be
46

added to the same solution to enhance the ultrafiltration operation, as explained in the
previous chapter, at a specific molar ratio, MR. The MR with 0% of that contaminated
substance in the permeate stream or 100% in the retentate stream, which can be called
also the rejection, R, will considered to be the 100% Rejection MR [35].
R = 1 - ( Cp / Cf) (3.6)
Where,
R = Rejection; Cp = Permeate Concentration; Cf = Feed Concentration
Three groups of experiments were performed to reach the 100% rejection MR for three
concentrations of copper. The mean of three replicates for each concentration were
taken. For benzene, also three groups of experiments were done to reach the 100 %
Rejection MR, that was done for two concentrations. The mean of two replicates for
each concentration were taken.
Since no enough studies indicating the molar ratio of rhamnolipid/benzene 100%
rejection, a molar ratio of a chemical compound approximately similar to the benzene
composition (styrene) were used as a starting point. The starting point for the molar
ratio of rhamnolipid/copper 100% rejection was the values obtained from other studies
had similar conditions approximately.
A range of concentrations higher than drinking water guidelines of the maximum
acceptable concentration for benzene, 5 pg/L, and copper, 1.0 mg/L, were used when
they added as pollutants [17].
47

Equation (3.6) was used also to calculate the rejection percentage of the rhamnolipid
that retained by the membrane filter which indicates the membrane efficiency in
preventing the rhamnolipid micelles from going out with the permeate flux as well as the
rhamnolipid efficiency to form the needed micelles for contaminant removal.
The Tensiomat® 21 was used to determine the rhamnolipid concentration in the
permeate, Cp t by the Du Nouy method as explained previously in this chapter. Two
readings for the permeate were taken in each experiment. Cf represents the rhamnolipid
feed concentration.
RHAMNOLIPID TO COPPER MOLAR RATIO FOR 100% REJECTION
For copper, three solutions of different concentrations, (3.1, 6.4, and 9.6 mg/l), were
prepared at the same MR, 5.41. The sample of permeate flux for each solution was
analyzed by the atomic absorption spectroscopy to determine the presence of copper
ions. For each experiment the feed sample was analyzed as well to determine the
concentrations. Three samples of each feed and permeate were analyzed to determine
the copper concentration. The rhamnolipid concentration in the permeate, Cp , for the
above experiment was determined by applying the Du Nouy method using the
Tensiomat® 21. Two readings of the permeate surface tension were taken. Cf
represents the rhamnolipid feed concentration, and then the rhamnolipid rejection was
determined by applying equation (3.6).
4 8

To reach the 100% rejection MR, the same procedures were repeated. The three
aqueous solutions of copper-rhamnolipid, (3.1, 6.4, and 9.6 mg/l), were used but this
time at MR = 6.25. The atomic absorption spectroscopy showed the absence of copper
ions in the permeate samples. At MR = 6.25, 100% rejection was obtained.
ANALYSIS WITH ATOMIC ABSORPTION SPECTROSCOPY
The aqueous solution samples that were contaminated with copper ions, Cu+2, were
analyzed by AAnalyst 100 Atomic Absorption Spectrometer from Perkin Elmer using the
Hollow Cathode Lamp from SCP Science at the wavelength 324.8 nm to determine the
copper concentrations in the feed and permeate samples [45],
RHAMNOLIPID TO BENZENE MOLAR RATIO FOR 100% REJECTION
Two aqueous solutions of benzene-rhamnolipid were prepared at concentrations of 190
mg/l and 264 mg/l benzene with MR = 0.77 for both. Two samples of the feed were
analyzed by the High Performance Liquid Chromatography to evaluate of the
concentrations the feed and the permeate samples of the benzene. For the above
experiment, the rhamnolipid concentration in the permeate, Cp, was determined by
applying the Du Nouy method using the Tensiomat® 21. Two readings of the permeate
surface tension were taken. Cf represents the rhamnolipid feed concentration, and then
the rhamnolipid rejection was determined by applying equation (3.6).
49

Another two aqueous solutions of benzene-rhamnolipid were prepared at
concentrations of 63 mg/l and 129 mg/l benzene. As the expected molar ratio should
be higher, a MR = 1.33 was used. The HPLC results showed that MR = 1.33 is the
100% rejection MR. There was no benzene in the permeate samples.
ANALYSIS WITH HIGH PERFORMANCE LIQUID CHROMATOGRAPHY (HPLC)
The aqueous solution samples that contaminated with benzene molecules were
analyzed by two HPLCs, System Gold High Performance Liquid Chromatography from
Beckman Coulter, Inc. and Agilent 7500 ICP - MS from Agilent Technologies [3], [2],
The connected column to the HPLCs was a SUPELCOSIL ™ LC - 8 from Supelco /
Sigma-Aldrich Co. and was operated by the classic reversed phase mechanism, mobile
phase 60:40 - methanol: water, detection: UV 254 nm, and flow rate of 1 ml/min [52],
3.4.4 EXPERIMENTS OF GROUP THREE: THE EVALUATION OF RHAMNOLIPID
CAPABILITY TO SEPARATE COPPER IONS AND BENZENE MOLECULES
SIMULTANEOUSLY
The evaluation of rhamnolipid capability to remove both copper ions and benzene
molecules simultaneously required preparing two subgroups of experiments with two
objectives, primary and secondary. The primary objective was to observe the effect of
the added contaminant on the 100% rejection molar ratio of the other one which means
finding the effect of the added contaminants on the capability of the same rhamnolipid
quantity required to achieve 100% rejection for the main contaminant. That was

repeated at two different concentrations of the main contaminant. The secondary
objective was to see how the molar ratio for the added contaminant was affected as
well.
To achieve the primary objective of the first subgroup, a certain weight of benzene, 90
mg, was added to two copper aqueous solutions for the 100% rejection molar ratio of
6.25. The copper concentrations for the first and second solutions were 6.2 and 8.3
mg/l, respectively. The effect of benzene on the 100% Rejection MR for copper was
examined by analyzing the copper ion content of the permeate samples. The presence
of copper ions indicates the negative effect of benzene presence and vice versa. The
benzene presence in the permeate samples was analyzed as well as a secondary
objective for the same experiment to check the effect of copper concentration on the
removal of benzene molecules. Depending on the percentage of benzene, the
simultaneous removal efficiency was determined. The lower the percentage of benzene,
the higher the simultaneous removal efficiency is.
The primary objective of the second subgroup was to investigate the effect of added
copper on the 100% Rejection MR of benzene. To evaluate the capability of rhamnolipid
biosurfactant to remove the benzene molecules and copper ions simultaneously, a
certain weight of copper (8.3 mg) was added to two benzene aqueous solutions of
100% rejection molecular ratio which was equal to 1.33. The benzene concentrations
for the first and second solutions were 43.7 and 63 mg/l respectively.
51

The effect of copper presence on the 100% Rejection MR for benzene was examined
by analyzing the benzene content of the permeate samples. The presence of benzene
molecules indicates the negative effect of copper presence and vice versa. The
secondary objective of the same experiment was to check the effect of benzene on the
removal of added copper ions. That was done by analyzing the copper concentration in
the permeate samples. Depending on the percentage of copper rejection, the
simultaneous removal efficiency has been determined. The higher the percentage of
copper rejection, the higher the simultaneous removal efficiency.
Did you do with 0 mg/L copper (Table 3.3) or 0 mg/L benzene (Table 3.4)? If so
add
Table 3.3 Experimental design of group three experiments. Benzene effect on
copper molar ratio of 100% rejection (MR=6.25).
Copper Concentration (mg/l)
Benzene Concentration (mg/l)
Rhamnolipid/Cu Molar Ratio
8.3 90 6.25
6.2 90 6.25
Table 3.4 Experimental design of group three experiments. Copper effect on
benzene molar ratio of 100% rejection.
Benzene Concentration (mg/l)
Copper Concentration (mg/l)
Rhamnolipid/Cu Molar Ratio
63 8.3 0.77
52
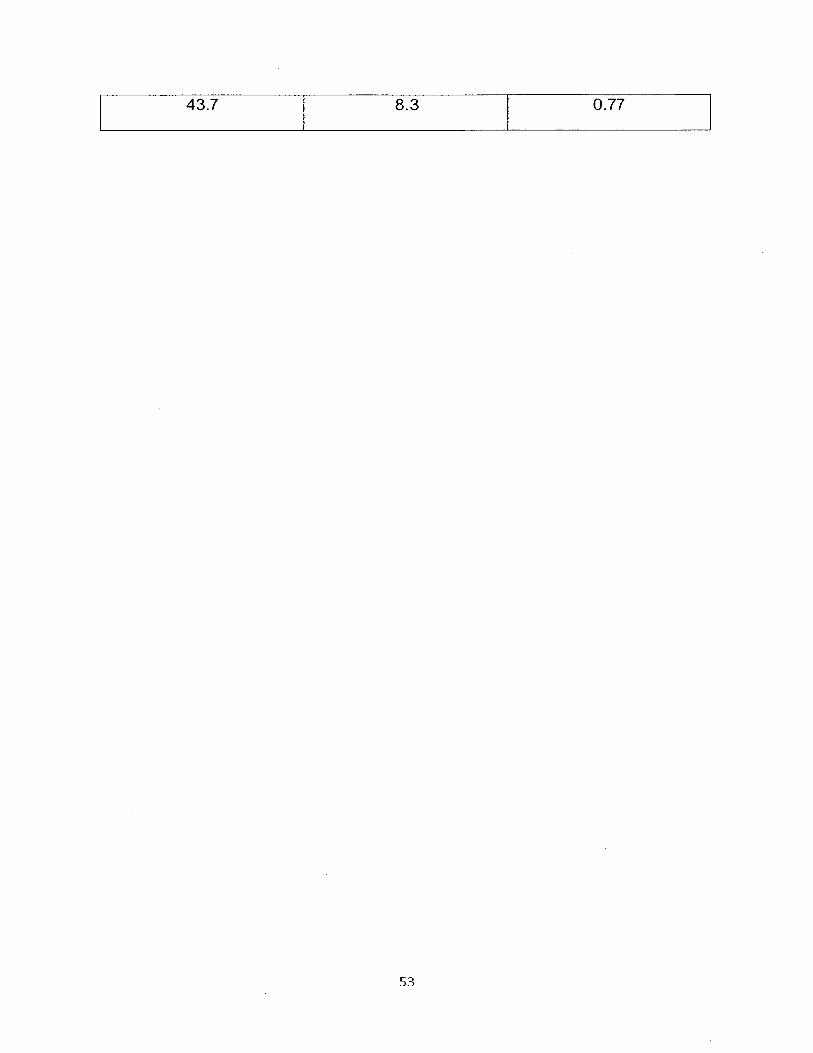
43.7 8.3 0.77
5 3

CHAPTER FOUR
RESULTS AND DISCUSSION
4.1 GENERAL REMARKS
The main objective of this research was to determine the efficiency of
rhamnolipid biosurfactant (JBR 425™) to remove simultaneously the benzene
molecules by solubilization and the copper ions by adsorption as explained in
Chapter 2. To achieve and evaluate this objective, cross-flow micellar-enhanced
ultrafiltration experiments were planned, designed, and conducted.
Characterization of the rhamnolipid and three groups of experiments were
conducted to determine the efficiency of rhamnolipid simultaneous removal of
copper and benzene. The second group consisted of two experiments. The first
one was prepared to find the copper molar ratio (MR) which is the number of
rhamnolipid moles that is required to remove completely a one mole of copper
ions from contaminated aqueous solution (100% rejection). The second one was
performed to find out the rhamnolipid to benzene molar ratio (MR) of 100%
rejection in the same way. The third group also consisted of two experiments.
The first one was prepared to investigate the effect of benzene molecules
presence on the 100% rejection molar ratio (MR) of copper. This means the
53

effect of benzene on the capability of rhamnolipid micelles to adsorb 100% of
copper ions from the contaminated aqueous solution by passing it with
rhamnolipid biosurfactant through the filter membrane in the ultrafiltration system.
A flow meter was connected to the permeate stream of the ultrafiltration system
to control the optimum flux. Filtered samples were collected to evaluate the
contamination level (concentrations of copper, benzene, or both of them) by
analyzing these samples with the atomic absorption spectroscopy for copper or
HPLC for benzene. The second group was accomplished to investigate the effect
of copper ion presence on the 100% rejection of benzene.
4.2 CHARACTERIZATION OF RHAMNOLIPID: DETERMINATION OF
RHAMNOLIPID CRITICAL MICELLE CONCENTRATION (CMC)
4.2.1 DU NOUY METHOD
As a requirement for selecting the concentration of a biosurfactant to achieve its
optimal performance is to know the CMC value of this surfactant. Thus, to
determine the amount of rhamnolipid biosurfactant required for contaminant
removal, the CMC was obtained from the relationship of rhamnolipid
concentrations and surface tension by measuring surface tension of various
dilution solutions. The results in Figure 4.1 showed that the apparent surface
tension values, the Surface Tensiomat® 21 dial readings of samples from the
rhamnolipid dilution solutions, decreased from 75.3 to 31.4 mN/m with an
54

increase in the rhamnolipid concentration from 0 to 50 mg/l, and beyond that an
increase in rhamnolipid concentration had a very small effect on surface tension.
The absolute surface tension values, the dial readings multiplied by the
correction factor, as explained in Chapter three, decreased from 63 to 26.2
mN/m.
0 100 200 300 400 500 600 700 800 900
Rhamnolipid Concentration (mg/l)
1000 1100
Figure 4.1 Absolute surface tension of different rhamnolipid solutions by
Du Nouy method to find the critical micelle concentration (cmc).
The results as represented in Figure 4.1 shows that a low rhamnolipid
concentration (< 25 mg/l) has a significant effect on the surface tension, while
high concentrations (> 50 mg/l) have a negligible effect. The critical micelle
concentration (CMC) of rhamnolipid biosurfactant was determined as 38 mg/l
using the curve of rhamnolipid concentration versus surface tension as shown in
55

Figure 4.1. This result is close to the CMC value reported by Zhang and Miller
which was equal to 40 mg/l [64].
4.2.2 Electrical Conductivity Method
The electrical conductivity was used as another way to determine the value of
critical micelle concentration (CMC) by measuring the conductivities of different
rhamnolipid aqueous solutions at different concentrations by using the
conductivity meter HQ 30d from HACH. The critical micelle concentration (CMC)
calculated by this way was equal to 38 mg/l as shown in Figure 4.2 which is the
same value that has been obtained from the surface tension versus
concentration graph. The intersection of linear slopes in the conductivity versus
surfactant concentration graph represents the critical micelle concentration
(CMC).
The conductivity in this research was used as an indicator for the solution's
equilibrium state during and after the mixing the components of the artificially
contaminated water samples. If there is no more change in the conductivity it
means the solution reached at ambient conditions its equilibrium state [44],
4.3 EXPERIMENTS OF GROUP ONE: THE EFFECT OF OPERATION
PARAMETERS ON FLUX
Many experiments have been performed to understand the effects of the main
operation parameters on the ultrafiltration system as well as on the rhamnolipid-
56
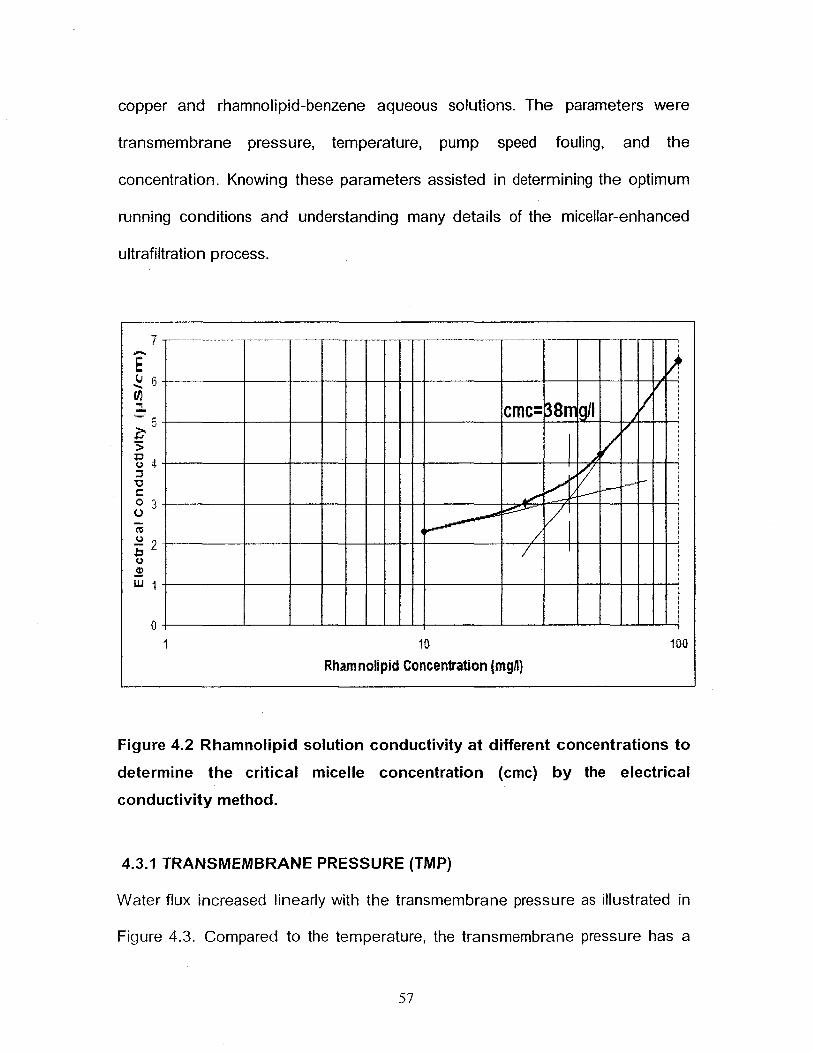
copper and rhamnolipid-benzene aqueous solutions. The parameters were
transmembrane pressure, temperature, pump speed fouling, and the
concentration. Knowing these parameters assisted in determining the optimum
running conditions and understanding many details of the micellar-enhanced
ultrafiltration process.
Figure 4.2 Rhamnolipid solution conductivity at different concentrations to
determine the critical micelle concentration (cmc) by the electrical
conductivity method.
4.3.1 TRANSMEMBRANE PRESSURE (TMP)
Water flux increased linearly with the transmembrane pressure as illustrated in
Figure 4.3. Compared to the temperature, the transmembrane pressure has a
57

very significant effect on the process and this is clear according to the flux values
in both cases.
60
ro <U O
50
40
30
20
10
40 73
Transmembrane Pressure (kPa)
104
Figure 4.3 Effect of transmembrane pressure on clean water flux.
4.3.2 TEMPERATURE
The temperature effect on the flux was less than that of transmembrane pressure
as explained previously. However it behaves in the same way, increasing the
temperature increased the clean water flux since increasing the temperature will
decrease water viscosity and increase molecules energy and passing through
membrane pores. Figure 4.4 shows the temperature-flux linear relationship. The
degree of process flux improvement is less predictable than with clean water
since both a gel layer and a fouling layer on the membrane surface contribute to
flux resistance [1].
58

24 38 Temperature (°C)
53
Figure 4.4 Effect of temperature on clean water flux.
4.3.3 PUMP SPEED
Increasing the peristaltic pump speed of ultrafiltration system keeping the
temperature and solution concentrations constant increased the flow rate of the
pump and eventually the flux. The transmembrane pressure increased as well.
However the effect on the transmembrane pressure as illustrated in Figure 4.6
was higher than that of the flux as shown in Figure 4.5. Having a high flux is an
important objective of the micellar-enhanced ultrafiltration process but this has to
be balanced with fouling, the most dominant factor of the process since
increasing the speed will increase the possibility of the membrane pore blockage.
59

120
16
12
X
•2 8
13
Pump Speed (rpm)
Figure 4.5 Effect of pump speed on flux at constant temperature and solution concentration (476.7 mg/l rhamnolipid and 9.6 mg/l Cu).
140
™ 120 j*: m 1 100 <n CO n j j- 80 Q_
0> 2 60
-Q E ® 40
c 2 20
13
Pump Speed (rpm)
Figure 4.6 Effect of pump speed on transmembrane pressure at constant temperature and solution concentration (476.7 mg/l rhamnolipid and 9.6 mg/l Cu).
6 0

4.3.4 FOULING
As explained in the literature review chapter, membrane fouling is the limiting
factor in ultrafiltration process. Figure 4.7 shows that within ten minutes of
filtration, the flux declined by 42.1% (from 21.4 to 12.4 l/h-m2). The temperature,
solution concentrations, and pump speed were constant during the experiment
with a negligible difference in the transmembrane pressure.
25
20
e-si
E15
=10 LI—
o' ^ 0 2 4 6 8 10 12
Time (min.)
Figure 4.7 Decline of flux with time while keeping temperature, solution
concentrations (6.4mg/l Cu and 317.8 mg/l rhamnolipid), and pump speed
constant.
61

4.3.5 CONCENTRATION EFFECTS
Increasing the rhamnolipid - copper concentration increased the transmembrane
pressure and decreased the flux at the same temperature (22°C) and pump
speed. Figures 4.8 and 4.9 show the different effects of increasing concentration.
When the experiment was conducted at low rhamnolipid and copper
concentrations (158.9 mg/l and 3.1 mg/l) respectively, a high flux (23.1 l/h-m2)
and low transmembrane pressure (61 kPa) were obtained.
Doubling the rhamnolipid concentration to 317.8 mg/l and copper to 6.4 mg/l had
very little effect on the TMP which increased from 61 to 66 kPa only while the flux
was decreased significantly from 23.1 to 17.3 l/h-m2. The same effects were
observed at higher concentrations for the aqueous solutions of rhamnolipid
(476.7 mg/l) and copper (9.6 mg/l) on TMP where the increase was by 24%
comparing to the first TMP value while the decline of the flux was less by 45%.
Increasing the concentrations means more available rhamnolipid molecules,
either in micelle form or as monomers, and more copper ions that have been
adsorbed by the rhamnolipid micelles or free in the solution.
62

Therefore these results were expected since these molecules and ions have a
higher possibility to interact with the internal membrane surface and eventually
the opportunity to block the membrane pores. Increasing the concentration could
be considered as another example of the fouling effect.
- —
illl[p(lljllK
SBfiPffSlilt
158.9 317.8
Rhamnolipid Concentration (mg/l)
476.7
Figure 4.8 Effect of rhamnolipid concentration in rhamnolipid-copper
solution on the flux.
63

80 CTJ a .
^70 a>
ot 60 CO a>
50 a> « 4 0
E 30 t a> j
«> 20 1
re 10 t
0 158.9 317.8
Rhamnolipid Concentration (mg/l)
476.7
Figure 4.9 Effect of rhamnolipid concentration in rhamnolipid-copper
solution on transmembrane pressure.
4.4 EXPERIMENTS OF GROUP TWO: DETERMINING THE MOLAR RATIO,
MR, FOR THE 100% REJECTION AND INVESTIGATING THE RHAMNOLIPID
BEHAVIOUR IN THE PRESENCE OF COPPER AND BENZENE
4.4.1 DETERMINING THE MR FOR COPPER
Three rhamnolipid-copper aqueous solutions at different concentrations were
prepared at the same MR, 5.41 as shown in Figure 4.10 to determine if this
64

MR will achieve the 100% rejection. The sample of permeate flux for each of 3.1,
6.4, and 9.6 mg/l solutions was analyzed by the atomic absorption spectroscopy
and indicate the presence of copper at concentrations of 0.8, 0.7, and 0.7 mg/l
respectively.
For each experiment the feed sample was analyzed as well to determine the
concentrations. Three samples of each feed and permeate were analyzed then
the mean value were taken to determine the copper concentrations.
To reach the 100% rejection MR, the same procedures were repeated and three
aqueous solutions of rhamnolipid-copper at concentrations of 3.1, 6.4, and 9.6
mg/l as shown in Figure 4.11 were used but this time at higher MR of 6.25. It was
shown that at MR = 6.25 100% rejection molar ratio was achieved.
65

120
0 ;
3.1 6.4 9.6 Copper Concentration (mg/I)
Figure 4.10 Rejection of rhamnolipid-copper solution at molar ratio = 5.41.
3.1 6.4 9.6 Cu Concentration (mg/l)
Figure 4.11 Rejection of rhamnolipid-copper solution at molar ratio = 6.25.
6 6

4.4.2 DETERMINATION OF THE MR FOR BENZENE
Two rhamnolipid-benzene aqueous solutions were prepared at concentrations
of 190 mg/l and 264 mg/l benzene with MR equals to 0.77 for both as shown in
Figure 4.12. Two samples of the feed and permeate samples were analyzed by
HPLC and the mean value was taken to determine the concentrations. The
analysis of the permeate samples confirmed the presence of the benzene. For
190 mg/l of benzene which had been added to make the rhamnolipid - benzene
aqueous feed solution, the permeate concentration was 8.2 mg/l. The feed
concentration then increased to 264 mg/l, the permeate concentration increased
as well to 26 mg/l. Another two aqueous solutions of benzene and rhamnolipid
were prepared at concentrations of 63 mg/l and 129 mg/l benzene. The expected
molar ratio should be higher and therefore MR = 1.33 was used. The HPLC
results showed that MR which equals to 1.33 is the 100% rejection MR for the
above benzene two concentrations as shown in Figure 4.13. There was no
benzene in the permeate samples.
4.4.3 RHAMNOLIPID BEHAVIOR IN THE PRESENCE OF COPPER
When rhamnolipid biosurfactant was added to copper aqueous solutions at
concentrations higher than its CMC (38 mg/l), the micelles start to form and try to
bind the copper ions. Figure 4.14 illustrates the results of experiments that were
conducted for two reasons, the first one was to investigate the relationship
between the rhamnolipid feed and permeate concentrations with values higher
than the CMC in the presence of copper ions and the second one was to
67

determine the effect of increasing the rhamnolipid feed concentration on the
rhamnolipid permeate.
120
100
80
o = 60 o a> aT a: 40
20
190 264 Benzene Concentration (mg/l)
Figure 4.12 Rejection of rhamnolipid-benzene solution at molar ratio = 0.77.
120
63 129 Benzene Concentration (mg/l)
Figure 4.13 Rejection of rhamnolipid-benzene solution at molar ratio = 1.33.
6 8

Figure 4.14 shows that rhamnolipid permeate concentration values were very
little in general regardless of the feed concentrations. For 159 mg/l of rhamnolipid
which has been added to prepare rhamnolipid - copper aqueous feed solution,
the permeate concentration was negligible (0.31 mg/l). The feed concentration
then doubled to 317.8 mg/l. However, the permeate concentration decreased to
0.29 mg/l. These results were expected since the added rhamnolipid
concentrations were more than four times the CMC which means that most of the
added rhamnolipid monomers have been transformed into micelles and only a
few monomers that remained free passed throughout the membrane filter pores
to the permeate stream.
The economical aspect is a limiting point in using the rhamnolipid biosurfactant.
Therefore, it is very important to reuse the rhamnolipid which means a high
rejection has to be achieved. The low CMC is another important factor which
could be included in the economical factor too since less biosurfactant is required
to reach the CMC. In order to complete the evaluation of rhamnolipid efficiency
by taking the economical aspect in consideration in addition to the contaminant
removal, the concentrations of rhamnolipid biosurfactant in the feed and
permeate streams needed to be determined as explained in Chapter three to
determine the rhamnolipid efficiency by applying equation 3.6. That was done by
using a surface tension-concentration curve to find the rhamnolipid
concentrations of permeates of the 5.41 molar ratio. Since all the other conditions
were approximately the same as for the 6.25 molar ratio, rhamnolipid efficiency
69

procedures was done only for 5.41 MR. Figure 4.15 demonstrates the results of
rhamnolipid rejection which indicated the high efficiency of biosurfactant JBR 425
used in the above experiments. Increasing the rhamnolipid concentration from
158.9 to 317.8 mg/l resulted in an increase in the rejection percentage from 99.8
to 99.91%. This was in agreement with the previous results of Figure 4.14 since
the highest rejection means the lowest rhamnolipid in the permeate and retention
of all the micelles by the membrane filter. Figure 4.16 illustrates the results of
surface tension of rhamnolipid permeates which was compatible with the results
mentioned above. As explained in the literature review chapter, the high surface
tension is an indication of the low rhamnolipid concentration. Therefore the
permeates of 99.9% and 99.8% rejections had a surface tension of 62.5 mN/m
which is very near to the clean water surface tension (62.9 mN/m).
0.35
0.30
0.25
-0.20
o as
a> o tz o o a> ro — o> cn E E i -o>
Q_
OH
'0.15
0.10
0.05
0.00 158.9 317.1
Rhamnolipid Feed Concentration (mg/l)
Figure 4.14 Permeate rhamnolipid versus feed rhamnolipid concentrations.
70

100.0
99.9
«= 99.8 o
99.7 a>
oc 99.6
o 99.5 £= E « 99.4 a:
99.3
99.2
MbhhmHI fjpjfnnp^ iMiNtp IMShB IBBBM iSNHmll
slHta wMMI
wiimik RK
158.9 317.8
Rhamnolipid Feed Concentration (mg/l)
Figure 4.15 Rejection percentage of two rhamnolipid feed solutions.
0.29 0.31
Rhamnolipid Permeate Concentration (mg/l)
Figure 4.16 Surface tension of rhamnolipid permeates.
71

4.4.4 RHAMNOLIPID BEHAVIOR IN THE PRESENCE OF BENZENE
When rhamnolipid biosurfactant was added to benzene aqueous solutions at
concentrations higher than its CMC (38 mg/l), the micelles start to solubilize the
benzene molecules. Figure 4.17 illustrates the results of experiments that have
been conducted for two reasons. The first one was to investigate the relationship
between the rhamnolipid feed and permeate concentrations with values higher
than CMC in the presence of benzene molecules and the second one was to
determine the effect of increasing the rhamnolipid feed concentration on the
rhamnolipid permeate. Figure 4.18 showed that rhamnolipid permeate
concentration values were minimal in general regardless the feed concentration.
For 1080 mg/l of rhamnolipid which was added to make the rhamnolipid -
benzene aqueous feed solution. The permeate concentration was 21.6 mg/l. The
feed concentration then increased to 1445 mg/l. However the permeate
concentration decreased to 10 mg/l. The added rhamnolipid concentrations were
more than twenty eight times the CMC which means that most of the added
rhamnolipid monomers have been transformed to micelles and only a few
monomers were able to pass through the membrane filter pores to the
permeate stream. As mentioned above in determining the efficiency of
biosurfactant JBR425 for economical aspects, the concentrations of rhamnolipid
in the permeate of rhamnolipid-benzene aqueous solutions has to be evaluated.
Figure 4.18 demonstrates the rejection efficiency of the membrane for the above
experiments. Increasing the rhamnolipid concentration from 1080 to 1445 mg/l
72

resulted in an increase in the rejection percentage from 98.0 to 99.3%. This was
in agreement with the previous results of Figure 4.17 since the highest rejection
means the lowest rhamnolipid concentration in the permeate and the retention of
all the micelles by the membrane filter. Figure 4.19 illustrates the results of the
surface tension measurement of rhamnolipid permeates which was compatible
with the results mentioned above. Chapter two showed that the high surface
tension is an indication of low rhamnolipid concentration. Therefore the permeate
of 99.3% rejection had a surface tension of 49 mN/m while the permeate of 98%
rejection had a surface tension of 33 mN/m.
1080.2 1445.3
Rhamnolipid Feed Concentration (mg/l)
Figure 4.17 Permeate rhamnolipid versus feed rhamnolipid concentration.
73

Figure 4.10 illustrates that increasing the copper concentration increased the
rhamnolipid removal efficiency for the same molar ratio (MR = 5.41) because the
required quantity of rhamnolipid at 3.1 mg/l of Cu is near to cmc and with
increasing the copper concentrations the rhamnolipid concentration will
increased too which means more micelles will form and eventually higher
rejection.
120
1080.2 1445.3
Rhamnolipid Feed Cone, (mg/l)
Figure 4.18 Rejection percentage of two rhamnolipid feed solutions.
74

CO 10
10 21.6 Rhamnolipid Permeate Cone, (mg/l)
Figure 4.19 Surface tension of rhamnolipid-benzene solutions permeates.
4.5 EXPERIMENTS OF GROUP THREE: THE EVALUATION OF
RHAMNOLIPID CAPABILITY TO SEPARATE COPPER IONS AND BENZENE
MOLCULES SIMULTANEOUSLY
The evaluation of rhamnolipid capability for the removal of copper ions and
benzene molecules simultaneously, required preparing two subgroups of
experiments with two objectives, primary and secondary. The primary objective
was to observe the effect of the presence of the added contaminant on the 100%
rejection molar ratio of the other one. That was repeated at two different
concentrations of the main contaminant. The secondary objective was to
determine that the molar ratio of the added contaminant was affected as well.
75

4.5.1 EXPERIMENTS OF FIRST SUBGROUP: THE EFFECT OF BENZENE
PRESENCE ON RHMNOLIPID CAPABILITY TO REMOVE COPPER
This objective, which is the primary one of the first subgroup, was performed by
adding 90 mg of benzene to two rhamnolipid-copper aqueous solutions of 100%
rejection molar ratio which is equal to 6.25 to investigate the effect of benzene
presence on the 100% rejection MR. The copper concentrations of the first and
second solutions were 6.2 and 8.3 mg/l respectively. The effect of benzene
presence on the 100% rejection MR for copper has been examined by analyzing
the copper ions content of the permeate samples since the presence of copper
ions in them means that MR of 6.25 is no more being the 100% rejection MR
which indicates the negative effect of benzene presence. The atomic absorption
spectroscopy did not detect any presence of copper ions in the permeate
samples which meant that benzene presence had no negative effect on
rhamnolipid capability to remove copper and the 100% rejection MR, 6.25 did not
change as illustrated in Figure 4.20.
For the same experiment the benzene presence in the permeate samples were
analyzed additionally as the secondary objective to check the effect of copper
presence on the removal of benzene molecules at that amount of rhamnolipid
which was enough to achieve 100% of copper rejection and eventually if there
will be any positive or negative change on the benzene 100% rejection MR. This
was repeated for the two concentrations of copper, 6.2 and 8.3 mg/l. Depending
on the percentage of benzene presence in permeate samples, the simultaneous
76
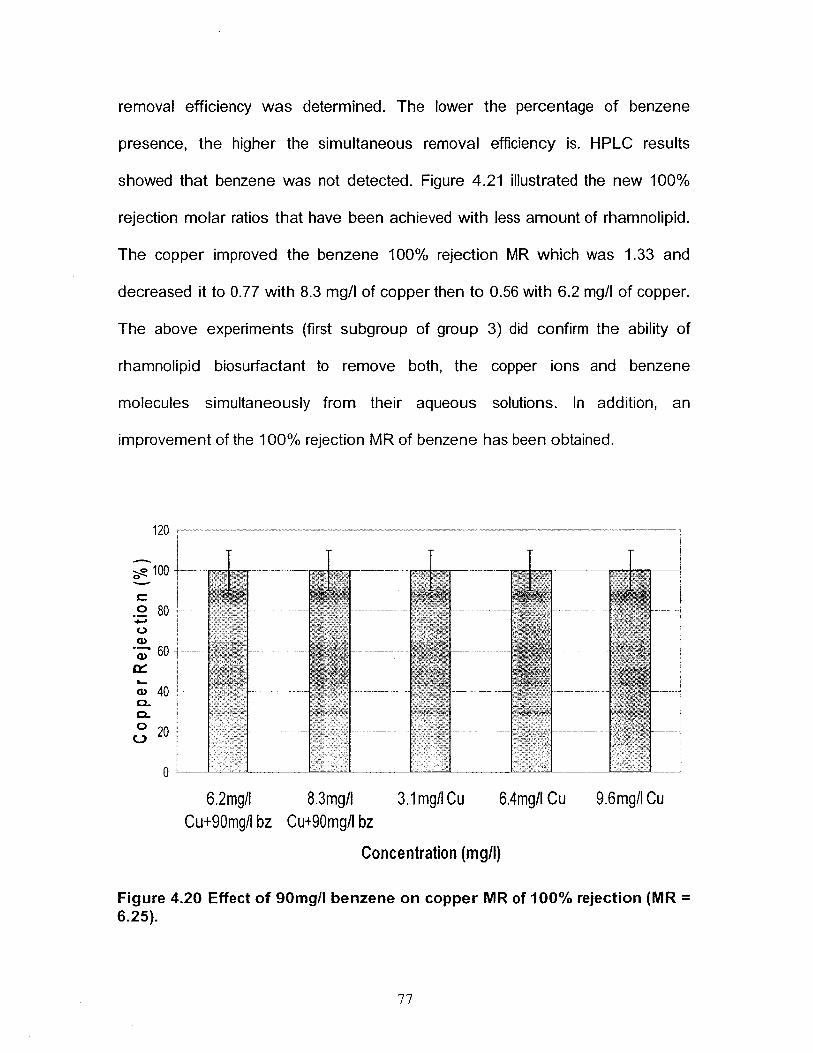
removal efficiency was determined. The lower the percentage of benzene
presence, the higher the simultaneous removal efficiency is. HPLC results
showed that benzene was not detected. Figure 4.21 illustrated the new 100%
rejection molar ratios that have been achieved with less amount of rhamnolipid.
The copper improved the benzene 100% rejection MR which was 1.33 and
decreased it to 0.77 with 8.3 mg/l of copper then to 0.56 with 6.2 mg/l of copper.
The above experiments (first subgroup of group 3) did confirm the ability of
rhamnolipid biosurfactant to remove both, the copper ions and benzene
molecules simultaneously from their aqueous solutions. In addition, an
improvement of the 100% rejection MR of benzene has been obtained.
120
100
tz .2 80 » o CD
o 60 on
a> 40 Q _ CL O O 20
M M
6.2mg/l 8.3mg/l 3 .1mg/ ICu 6.4mg/ ICu 9 .6mg/ ICu Cu+90mg/l bz Cu+90mg/ lbz
Concentration (mg/l)
Figure 4.20 Effect of 90mg/l benzene on copper MR of 100% rejection (MR 6.25).
77

120
T 100
o 80 o cu » 6 0 o> 5 40 IM
a> m 20
90 mg/lbz + 8.3 ma/I Cu
0.56
63 mg/l bz 129 mg/l bz
0.77 1.33
Benzene Molar Ratio 1.33
Figure 4.21 Effect of 6.2 and 8.3 mg/l copper on rhamnolipid-benzene MR.
4.5.2 EXPERIMENTS OF SECOND SUBGROUP: THE EFFECT OF COPPER
PRESENCE ON RHMNOLIPID CAPABILITY TO REMOVE BENZENE
The primary objective of the second subgroup was illustrated in Figure 4.22 and
the secondary in Figure 4.23. The primary is to investigate the effect of copper
presence on benzene new molar ratio (MR) for 100% rejection, 0.77, which were
obtained from the first subgroup experiments. The secondary objective was to
determine how the molar ratio of added contaminant, and the copper, was
affected with each new molar ratio. The effect of copper presence on the new
100% rejection molar ratio of benzene was investigated to evaluate the capability
of rhamnolipid biosurfactant to remove the benzene molecules and copper ions
simultaneously. To do so, a certain weight of copper (8.3 mg) was added to two
78

benzene aqueous solutions of 100% rejection molar ratio which became equal to
0.77.
The benzene concentrations for the first and second solutions were 43.7 and 63
mg/l respectively. The effect of copper presence on the 100% rejection MR for
benzene was examined by analyzing the benzene content of the permeate
samples. HPLC results showed that benzene was not detected which meant that
8.3 mg/l of added copper did not affect the capability of rhamnolipid to remove
the benzene and the new 0.77 molar ratio has been confirmed to be the 100%
rejection MR as shown in Figure 4.22. To determine the second objective, the
permeate samples were analyzed to determine copper presence and to check
the effect of benzene on the removal of copper ions. Depending on the
percentage of copper presence in permeate samples or copper rejection by
rhamnolipid, the simultaneous removal efficiency was determined. The atomic
absorption spectroscopy showed the presence of copper in permeate samples
and that the copper rejection decreased slightly to 97% for both experiments of
63 and 43.7 mg/l of benzene as shown in Figure 4.23. However these rejections
of 97% for 8.3 mg/l of copper have been obtained with molar ratios of 4.72 and
2.33 respectively comparing to 6.25 for 100% rejection for copper concentrations
less than 8.3 mg/l. Figure 4.24 shows that benzene addition improved the MR" of
copper rejections of less than 100% and with the lower concentration of benzene
the rejection was the same.
79

120
~ i o o
43.7 mg/l bz + 8.3 mS/l Cu
63 mg/l bz + 8.3 mli/ICu
63 mg/l bz 129 mg/l bz
0.77 0.77 1.33
Benzene Molar Ratio 1.33
Figure 4.22 Effect of 8.3 mg/l copper on the new benzene MR (0.77) of 100% rejection.
102
.100
£ 98 o cu CD
oc ^ 96 a> o .
O <-> 94
92
8.3 mg/l Cu + 43.7 mg/l bz
8.3 mg/l Cu + 63 mg/l bz
9.6 mg/l Cu 6.4 mg/l Cu 3.1 mg/l Cu
n i
Mlill l
• 111 8Ss
2.33 4.72 6.25
Copper Molar Ratio
6.25 6.25
Figure 4.23 Benzene effect on copper MR compared to 100% rejection MR.
80

108
—100 0s
O 92 o a> o 84
Dd
• 7 6 a. o
^ 68
60
Figure 4.24 Effect of 43.7 and 63 mg/l benzene on copper MR compared to MR of less than 100% rejection.
4.6 RESULTS SUMMARY
The following tables summarize the important results of this study. Tables 4.1
and 4.2 show that MR (molar ratio) of less than and equal to 100% rejections for
three different concentrations of copper (3.1, 6.4, and 9.6 mg/l) using rhamnolipid
biosurfactant JBR 425 are 5.41 and 6.25 respectively. Other studies [34] showed
that a molar ratio of 5 is required to remove more than 99% of 12.7 mg/l copper
when the chemical surfactant sodium dodecyl sulphate (SDS) was used [34]. For
50 mg/l of copper the required molar ratio to remove 99.2% was 18.5 by SDS
chemical surfactant [27].
8.3 mg/l Cu+ 8.3 mg/l Cu + 43.7 mg/l bz 63 mg/l bz
2.33
9.6mg/ICu 6.4mg/l Cu
||§ltl|i
4.72 5.41 5.41
Copper Molar Ratio
3.1 mg/l Cu
5.41
81

Table 4.1 Effect of copper feed concentration on copper rejection using a
MR of 5.41.
Cu feed conc.(mg/l) Cu Rejection%
3.1 74.2
6.4 89.1
9.6 92.8
Table 4.2 Effect of copper feed concentration on copper rejection using a
MR of 6.25.
Cu feed conc.(mg/l) Cu Rejection %
3.1 100
6.4 100
9.6 100
Tables 4.3 and 4.5 show that MR's (molar ratios) for less than 100% rejection of
two different concentrations of benzene, 190 and 264 mg/l, and molar ratios for
100% rejection of 63 and 129 mg/l of benzene using rhamnolipid biosurfactant
JBR 425 are 0.77 and 1.33 respectively. A study showed that a molar ratio of 0.5
was required to remove 81.4% of 15.6 mg/l benzene using the chemical
surfactant sodium dodecyl sulphate (SDS) [28].
82

Table 4.3 Benzene feed concentration effect on benzene rejection using a
MR of 0.77.
Benzene feed conc.(mg/l) Rejection %
190 95.7
264 90.2
Table 4.4 showed that benzene presence had no effect on the 100% rejection
molar ratio (6.25) of copper but in the same time a significant improvement,
because of the copper presence, in 100% rejection molar ratio of benzene was
observed, from 1.33 to 0.77 in the presence of 8.3 mg/l of copper then to 0.56 in
the presence of 6.2 mg/l of copper. Table 4.5 shows that copper presence had
no effect on the new benzene 100% rejection molar ratio (0.77). However, an
improvement of copper molar ratios of less than 100% rejection was obtained. A
molar ratio of only 2.33 was needed to achieve 97% removaf of 8.3 mg/l copper
while a molar ratio of 5.41 was needed to achieve 89.1% removal of 6.4 mg/l.

Table 4.4 Effect of benzene on 100% rejection molar ratio of copper.
Cu MR Cu Rejection% Cu (mg/l) benzene
(mg/l) benzene
Rejection % benzene MR
6.25 100 9.6 0 0 0
6.25 100 6.4 0 0 0
6.25 100 3.1 0 0 0
6.25 100 8.3 90 100 0.77
6.25 100 6.2 90 100 0.56
Table 4.5 Effect of copper on 100% rejection molar ratio of benzene.
benzene MR benzene Rejection %
benzene conc. (mg/l)
Cu conc. (mg/l)
Cu Rejection % Cu MR
1.33 100 129 0 0 0
1.33 100 63 0 0 0
0.77 100 63 8.3 97 4.72
0.77 100 43.7 8.3 97 2.33
84
CHAPTER FIVE
CONCLUSIONS AND RECOMMENDATIONS
5.1 SUMMARY AND CONCLUDING REMARKS
The main objective of this research was to determine the efficiency of anionic
rhamnolipid biosurfactant (JBR 425) in removing both copper ions and benzene
molecules simultaneously from water and wastewater streams. Cross-flow
micellar-enhanced ultrafiltration (MEUF) system has been used to achieve this
objective.
The removal depends on the presence of rhamnolipid biosurfactant JBR 425
which has the ability to form micelles when it is added with concentration higher
than its critical micelle concentration (CMC). The formed rhamnolipid micelles
have hydrophilic surfaces where the copper ions have been bound and the
hydrophobic core where benzene molecules have been solubilized and these
micelles are big enough to be retained by the hollow fibre membrane filter and
rejected by a separate stream, the retentate, leaving the clean water to pass
through membrane pores with acceptable concentrations of rhamnolipid
monomers and contaminants. Part of the objective of this study was to observe
the effect of operation parameters on the process efficiency such as fouling,
TMP, temperature, concentrations of contaminants and the biosurfactant, and the
85

peristaltic pump speed. The other part of this study which is the most important to
achieve the objective was conducting experiments to determine the rhamnolipid -
contaminant molar ratio for copper and for benzene separately and then to
investigate the effect of contaminant presence on the other one molar ratio and
vice versa.
Through the conducted experiments, the following observations and conclusions
were made based on the obtained results.
• The operating parameters had different effects on the micellar-enhanced
ultrafiltration process. For clean water, transmembrane pressure had a higher
effect than temperature within the range studied. The pH value of the solution
was kept in the range of 6.81 to 7.11 since the rhamnolipid efficiency starts to
decline below this range.
• Since the fouling effect increases with speed, and to have a high flux is an
important objective of the ultrafiltration process, therefore it was always better
to keep the system at low speed, 4 rpm (maximum pump rpm is 100). The
high and low speed values were determined by the solution nature and
operation parameters.
• The effect of increasing rhamnolipid concentration on the surface tension of
contaminated aqueous solutions beyond CMC was minimal. However this
86
increase creates more micelles to remove the contaminants and eventually
increases the rhamnolipid efficiency.
• The contaminant type had a significant effect on permeate surface tension
depending on the obtained results. However, that effect was very little on
rejections. For concentrations higher than CMC, permeate surface tension of
two different copper-rhamnolipid solutions with NaOH for pH adjustment was
62.5 mN/m for both which is much higher than that of benzene-rhamnolipid
solutions which were 32.8 and 49 mN/m. For the same previous solutions, the
rhamnolipid rejections of rhamnolipid-copper solutions were > 99.8% with
rhamnolipid feed concentration much less than that of the benzene. However
the rhamnolipid rejection of rhamnolipid-benzene solution was > 98%.
• The molar ratio (MR) which is the required quantity of rhamnolipid to remove
either copper or benzene in the separate case was not the same when the
removal was done simultaneously. This indicated the influences of the two
contaminants on each other. This influence was positive since the required
MR to remove copper and benzene simultaneously was either equal to or less
than its required value to remove them separately.
• Fouling was the limiting factor of the process. Within ten minutes of filtration,
the flux declined by 42.1%.
87

5.2 RECOMMENDATIONS FOR FUTURE WORK
This study tries to present an effort to deal with a serious problem and to
participate in finding a solution but it by no means completely solves this
challenging problem and for that reason future research is required. Depending
on the theoretical and practical knowledge acquired in the current study the
subsequent recommendations for future work can be made:
• In the present study the evaluation of micellar-enhanced ultrafiltration process
was limited to a membrane of 5000 NMWC. Therefore a membrane filter with
larger pores which means a higher NMWC such as 10,000 or 30,000 is
required to increase the flux.
• Since the fouling, which is the main factor affecting the process flux, is
caused by interaction of contaminants with the material of membrane, then
using membranes with different materials will help to investigate the best
membrane material matching the system requirements and eventually the
process efficiency.
• The efficiency of rhamnolipid JBR 425 in removal of benzene and copper,
separately or simultaneously, is very high. However an attempt to investigate
the efficiency of another biosurfactant at lower cost is recommended to
enlarge the area of MEUF applications depends on finding inexpensive
sources of biosurfactant to compete the chemical ones in the market.
88
• Preparing wastewater samples with more than two contaminants and testing
the rhamnolipid efficiency to remove them all will help more to understand the
full capacity of the rhamnolipid removal efficiency.
• Evaluating the treatability of actual wastewater samples to observe the other
factors like suspended solids on rhamnolipid efficiency.
89

REFERENCES
1- A/G Technology Corporation. (2000/2001). Operating Guide. A/G Technology
Corporation.
2- Agilent Technologies. 2004. Agilent 7500 ICP-MS ChemStation (G 1834 B)
Operator's Manual. Agilent Technologies.
3- Beckman Coulter. 1999. System Gold ® HPLC User's Information for
Operation with 32 Karat™ Software. Beckman Instruments, Inc.
4- Bitter, J. G. A. (1991). Transport Mechanisms in Membrane Separation
Processes. Plenum Press, New York.
5- Canadian Council of Ministers of the Environment, (1999). Canadian Water
Quality Guidelines for the Protection of Aquatic Life: BENZENE, Canadian
Council of Ministers of the Environment, Winnipeg.
6- Champion,J. T., Gilkey,J. C., Lamparski,H„ Retterer,J. Miller., R. M. (1995).
Electron Microscopy of Rhamnolipid (Biosurfactant) Morphology: Effects of pH,
Cadmium, and Octadecane. Journal of Colloid and Interface Science, Volume
170, Issue 2, pp. 569-574.
7- Cheryan, M. (1998). Ultrafiltration and Microfiltration Handbook. Technomic
Publishing Company, Inc., Pennsylvania, U.S.A.
8- Cheryan, M. (1986). Ultrafiltration Handbook, Technomic Publishing Company,
Inc.
9- Christian, S. D., Scamehorn, J. F. (1995). Solubilization in Surfactant
Aggregates. Marcel Dekker, Inc.
90

10- Dagnew, M. D. (2004). Rhamnolipid Assisted Dispersion and Biodegradation
of Crude Oil Spilled on Water. M. A. Sc. Thesis, Concordia University, Montreal.
11- Dahrazma, B. (2005). Removal of Heavy Metals from Sediment Using
Rhamnolipid. Ph. D. Thesis, Concordia University, Montreal.
12- Desai, J. D., Banat, I. M. (1997). Microbial Production of Surfactants and
Their Commercial Potential. Microbiology and Molecular Biology Reviews, pp.47-
64.
13- El Zeftawy, M. A. M. (2006). Use of Rhamnolipid to Remove Heavy Metals
From Aqueous Streams Via Micellar Enhanced Ultrafiltration. Ph. D. Thesis,
Concordia University, Montreal.
14- Environmental Protection Service, Ottawa, Ontario. (1984). Benzene:
Environmental and Technical Information for Problem Spills. Beauregard Press
Limited.
15- Environment Canada. (1999). National Pollutant Release Inventory, National
Overview 1999. Minister of Public Works and Government Services Canada.
16- Fainerman, V. B., Mobius, D„ Miller, R. (2001). Surfactants: Chemistry,
Interfacial Properties, Applications. Elsevier Science B. V.
17- Federal-Provincial Subcommittee on Drinking Water of the Federal-Provincial
Committee on Environmental and Occupational Health, (1996). Guidelines for
Canadian Drinking Water Quality 6th edition. Minister of Supply and Services
Canada.
91
18- Fillipi, B. R., Brant, L. W., Scamehorn, J. F., Christian, S. D. (1999). Use of
Micellar-Enhanced Ultrafiltration at Low Surfactant Concentrations and with
Anionic - Nonionic Surfactant Mixtures. Colloid and Interface Science 213, pp.
68-80.
19- Fisher Scientific. (1990). Instructions: Fisher Surface Tensiomat Model 21.
Catalog No. 14 - 814. Fisher Scientific.
20- Government of Canada, Environment Canada, Health and Welfare Canada.
(1993). Priority Substances List Assessment Report, Benzene. Beauregard
Press Limited.
21- Georgopoulos, P. G., Roy, A., Yonone-Lioy, M. J., Opiekun, R. E., Lioy, P. J.
(2001). Copper: Environmental Dynamics and Human Exposure Issues. The
International Copper Association.
22- Health Canada, (1992). Guidelines for Canadian Drinking Water Quality -
Technical Documents: Copper. Health Canada, http://www.hc-sc.gc.ca
23- Hemond H. F., Fechner-Levy E. J. (2000). Chemical Fate and Transport in
the Environment, 2nd Edition. Academic Press.
24- Huang, Y. (1994). Surfactant-Based Ultrafiltration of Heavy Metals Ions from
Aqueous Streams. Ph. D. Thesis, Texas A & M University, USA.
25- Hudson, R. C. (2006). Hazardous Materials in the Soil and Atmosphere:
Treatment, Removal and Analysis. Nova Science Publishers, Inc.
92

26- Jeneil Biosurfactant Co. (2007). Material Safety Data Sheet. Jeneil
Biosurfactant Co.
27- Juang, R., Xu, Y., Chen, C. (2003). Separation and Removal of metal ions
from dilute Solutions Using Micellar-Enhanced Ultrafiltration. Journal of
Membrane Science 218, pp. 257 - 267.
28- Kim, J., Kim, C., Kim, D., Kim, S., Park, S., Lee, M., Lim, J. (2003). Removal
of Aromatic Organics in Aqueous Solution via Micellar-Enhanced Ultrafiltration.
Separation Science and Technology, Vol. 38, No. 8, pp. 1791 - 1811.
29- Kirk-Othmer Encyclopaedia of Chemical Technology, 5th edition, (2004).
John Wiley & Sons, Inc.
30- Kosaric, N. (2001). Biosurfactants and Their Application for Soil
Bioremediation. Food Technol. Biotechnol. 39 (4) 295-304.
31- Kosaric, N. (1993). Biosurfactants: Production, Properties, Applications; V.
48. Marcel Dekker, Inc.
32- Lange, K. R„ (1999). Surfactants: A Practical Handbook. Carl Hanser Verlag,
Munich.
33- Letcher, T. M. (2007). Thermodynamics, Solubility and Environmental Issues.
Elsevier B. V.
34- Li, C„ Liu, C., Yen, W. (2006). Micellar-enhanced ultrafiltration (MEUF) with
mixed surfactants for removing Cu(ll) ions. Chemosphere 63, pp. 353-358.
93

35- Mallevialle, J., Odendaal, P.E., Wiesner, M. R. (1996). Water Treatment
Membrane Processes. McGrow-Hill.
36- Misra, S.K., Mahatele, A.K., Tripathi, S. C„ Dakshinamoorthy, A. (2009).
Studies on the simultaneous removal of dissolved DBP and TBP as well as
uranyl ionsfrom aqueous solutions by using Micellar-Enhanced Ultrafiltration
Technique. Hydrometallurgy 96, pp.47-51.
37- Moroi, Y. (1992). Micelles: Theoretical and Applied Aspects. Plenum Press,
New York.
38- Mulligan, Catherine N. (2005). Environmental applications for
biosurfactants. Environmental Pollution 133, pp. 183-198.
39- Mulligan, C. N. (2009). Recent advances in the environmental applications
of biosurfactants. Current Opinion in Colloid & Interface Science 14, pp. 372-
378.
40- Myers, D., (2006). Surfactant Science and Technology. John Wiley and
Sons, Inc.
41- National Guidelines and Standard Office, Environment Canada, (2005).
Canadian Soil Quality Guidelines for the Protection of Environmental and Human
Health: Benzene. National Guidelines and Standard Office, Environment
Canada.
42- Nitschke, M„ Costa, S. G. V. A. O., Contiero, J. (2005). Rhamnolipid
Surfactants: An Update on the General Aspects of These Remarkable
Biomolecules. Biotechnol. Prog., 21, pp. 1593- 1600.
94

43- Noble, R. D., Stern, S. A. (1995).Membrane Separations Technology:
Principles and Applications. Elsevier Science B. V.
44- Oh, S. G„ Shah, D. 0. (1993). The Effect of Micellar Lifetime on the Rate of
Solubilization and Detergency in Sodium Dodecyl Sulfate Solutions. Journal of
the American Oil Chemists' Society. Vol. 70, No. 7, pp. 673-678.
45- Perkin Elmer. 1994. Analytical Methods for Atomic Absorption Spectrometry.
The Perkin-Elmer Corporation.
46- Pisarcik, M., Devinsky, F., Lacko, I. (2003). Critical Micelle Concentration,
lonisation Degree and Micellisation Energy of Cationic Dimeric (Gemini)
Surfactants in Aqueous Solution and in Mixed Micelles with Anionic Surfactant.
Acta Facult. Pharm. Univ. Comenianae 50, pp. 119-131.
47- Sanchez, M., Aranda, F. J., Espuny, M. J., Marques, A., Teruel, J. A.,
Manresa, A., Ortiz, A. (2007). Aggregation behaviour of a dirhamnolipid
biosurfactant secreted by Pseudomonas aemginosa in aqueous media. Journal
of Colloid and Interface Science 307, pp. 246 - 253.
48- Scamehorn, J. F., Chiristian, S. D., Co-Pis. (1994). A Study of Colloid-
Enhanced Ultrafiltration. US Department of Energy.
49- Singh, A., Van Hamme J. D., Ward, O. P. (2007). Surfactants in microbiology
and biotechnology: Part 2. Application aspects. Biotechnology Advances 25, pp.
99-121.
50- Singh, R. (1996). Removal of Volatile Organic Compounds by Ultrafiltration.
Desalination 104, pp. 203-214.
95

51- Starov, V., Zhdanov, V., Kovalchuk, N.M. (2009). Kinetic models of micelles
formation. Colloids and Surfaces A: Physicochem. Eng. Aspects.
52- Supelco. (2000). HPLC Column Quality Assurance Test Report. Supelco.
53- Tung, C., Yang, Y., Chang, C., Maa, J. (2002). Removal of copper ions and
dissolved phenol from water using micellar-enhanced ultrafiltration with mixed
surfactants. Waste Management 22, pp. 695-701.
54- Tadros, Th. F. (2005). Applied Surfactants Principles and Applications
WILEY-VCH Verlag GmbH & Co. KGaA, Weinheim.
55- Tadros, Th. F. (1984). Surfactants. Academic Press Inc.
56- Tahzibi A., Kamal F., Assadi M. M. (2004). Improved Production of
Rhamnolipids by a Pseudomonas aeruginosa Mutant. Iranian Biomedical Journal
8 (1), pp. 25-31.
57- Ullmann's Encyclopaedia of Industrial Chemistry, 7 lh Edition, (2006). John
Wiley & Sons, Inc.
58- Water Environment Federation. (2006). Membrane Systems for Wastewater
Treatment. Water Environment Federation.
59- Watson-Marlow, Inc. Watson Marlow pumps: Operating Instructions. Watson-
Marlow, Inc.
60- Witek, A., Koltuniewicz, A., Kurczewski, B., Radziejowska, M., Hatalski, M.
(2006). Simultaneous removal of phenols and Cr3+ using micellar-enhanced
ultrafiltration process. Desalination 191, pp. 111-116.
96

61- World Health Organization, (2003). Benzene in Drinking-water: Background
document for development of WHO Guidelines for Drinking-water Quality. World
Health Organization.
62- World Health Organization, (2004). Copper in Drinking-water: Background
document for development of WHO Guidelines for Drinking-water Quality. World
Health Organization.
63- www.ec.gc.ca. (2007). National Pollutant Release Inventory 2007 Summary.
Environment Canada
64- Zhang, Y., Miller, R. M. (1992). Enhanced Octadecane Dispersion and
Biodegradation by a Pseudomonas Rhamnolipid Surfactant (Biosurfactant).
Applied and Environmental Microbiology, pp. 3276-3282.
97