Simultaneous Measurement of Noise-Activated … · Simultaneous Measurement of Noise-Activated...
15
: Simultaneous Measurement of Noise-Activated Middle-Ear Muscle Reflex and Stimulus Frequency Otoacoustic Emissions SHAWN S. GOODMAN AND DOUGLAS H. KEEFE Center for Hearing Research, Boys Town National Research Hospital, 555 North 30th Street, Omaha, NE 68131, USA Received: 1 July 2005; Accepted: 17 January 2006; Online publication: 28 March 2006 ABSTRACT Otoacoustic emissions serve as a noninvasive probe of the medial olivocochlear (MOC) reflex. Stimulus frequency otoacoustic emissions (SFOAEs) elicited by a low-level probe tone may be the optimal type of emission for studying MOC effects because at low levels, the probe itself does not elicit the MOC reflex [Guinan et al. (2003) J. Assoc. Res. Otolaryngol. 4:521]. Based on anatomical considerations, the MOC reflex activated by ipsilateral acoustic stimula- tion (mediated by the crossed olivocochlear bundle) is predicted to be stronger than the reflex to contralateral stimulation. Broadband noise is an effective activator of the MOC reflex; however, it is also an effective activator of the middle-ear muscle (MEM) reflex, which can make results difficult to interpret. The MEM reflex may be activated at lower levels than measured clinically, and most previous human studies have not explicitly included measure- ments to rule out MEM reflex contamination. The current study addressed these issues using a higher- frequency SFOAE probe tone to test for cochlear changes mediated by the MOC reflex, while simulta- neously monitoring the MEM reflex using a low- frequency probe tone. Broadband notched noise was presented ipsilaterally at various levels to elicit probe- tone shifts. Measurements are reported for 15 normal-hearing subjects. With the higher-frequency probe near 1.5 kHz, only 20% of subjects showed shifts consistent with an MOC reflex in the absence of an MEM-induced shift. With the higher-frequency probe near 3.5 kHz, up to 40% of subjects showed shifts in the absence of an MEM-induced shift. However, these responses had longer time courses than expected for MOC-induced shifts, and may have been dominated by other cochlear processes, rather than MOC reflex. These results suggest caution in the interpretation of effects observed using ipsilater- ally presented acoustic activators intended to excite the MOC reflex. Keywords: olivocochlear, efferent, acoustic reflex, middle ear, cochlear mechanics, otoacoustic emissions INTRODUCTION Cochlear mechanics are influenced by efferent nerve fibers originating at the superior olivary complex in the brainstem. Neurons with cell bodies located near the medial superior olivary nucleus have axons that project mostly to the contralateral side and terminate on outer hair cells (OHCs; Warr, 1992). Electrical stimulation of the olivocochlear bundle reduces otoacoustic emission (OAE) amplitudes (Mountain, 1980; Siegel and Kim, 1982). Activation of olivoco- chlear efferents reduces basilar membrane (BM) vibration in a frequency-dependent manner (Dolan et al., 1997; Murugasu and Russell, 1996). These results suggest that medial olivocochlear (MOC) activation reduces the transduction potentials of OHCs, thereby reducing the gain of the cochlea amplifier and corresponding BM vibration. Because of their noninvasive nature, OAEs have emerged as a key measurement tool in studying the Correspondence to: Shawn S. Goodman & Center for Hearing Research & Boys Town National Research Hospital & 555 North 30th Street, Omaha, NE 68131, USA. Telephone: +1-402-4986300; email: [email protected] JARO 7: 125–139 (2006) DOI: 10.1007/s10162-006-0028-9 125 JARO Journal of the Association for Research in Otolaryngology
Transcript of Simultaneous Measurement of Noise-Activated … · Simultaneous Measurement of Noise-Activated...
:
Simultaneous Measurement of Noise-ActivatedMiddle-Ear Muscle Reflex and StimulusFrequency Otoacoustic Emissions
SHAWN S. GOODMAN AND DOUGLAS H. KEEFE
Center for Hearing Research, Boys Town National Research Hospital, 555 North 30th Street, Omaha, NE 68131, USA
Received: 1 July 2005; Accepted: 17 January 2006; Online publication: 28 March 2006
ABSTRACT
Otoacoustic emissions serve as a noninvasive probe ofthe medial olivocochlear (MOC) reflex. Stimulusfrequency otoacoustic emissions (SFOAEs) elicitedby a low-level probe tone may be the optimal type ofemission for studying MOC effects because at lowlevels, the probe itself does not elicit the MOC reflex[Guinan et al. (2003) J. Assoc. Res. Otolaryngol.4:521]. Based on anatomical considerations, theMOC reflex activated by ipsilateral acoustic stimula-tion (mediated by the crossed olivocochlear bundle)is predicted to be stronger than the reflex tocontralateral stimulation. Broadband noise is aneffective activator of the MOC reflex; however, it isalso an effective activator of the middle-ear muscle(MEM) reflex, which can make results difficult tointerpret. The MEM reflex may be activated at lowerlevels than measured clinically, and most previoushuman studies have not explicitly included measure-ments to rule out MEM reflex contamination. Thecurrent study addressed these issues using a higher-frequency SFOAE probe tone to test for cochlearchanges mediated by the MOC reflex, while simulta-neously monitoring the MEM reflex using a low-frequency probe tone. Broadband notched noise waspresented ipsilaterally at various levels to elicit probe-tone shifts. Measurements are reported for 15normal-hearing subjects. With the higher-frequencyprobe near 1.5 kHz, only 20% of subjects showedshifts consistent with an MOC reflex in the absence
of an MEM-induced shift. With the higher-frequencyprobe near 3.5 kHz, up to 40% of subjects showedshifts in the absence of an MEM-induced shift.However, these responses had longer time coursesthan expected for MOC-induced shifts, and may havebeen dominated by other cochlear processes, ratherthan MOC reflex. These results suggest caution inthe interpretation of effects observed using ipsilater-ally presented acoustic activators intended to excitethe MOC reflex.
Keywords: olivocochlear, efferent, acoustic reflex,middle ear, cochlear mechanics, otoacousticemissions
INTRODUCTION
Cochlear mechanics are influenced by efferent nervefibers originating at the superior olivary complex inthe brainstem. Neurons with cell bodies located nearthe medial superior olivary nucleus have axons thatproject mostly to the contralateral side and terminateon outer hair cells (OHCs; Warr, 1992). Electricalstimulation of the olivocochlear bundle reducesotoacoustic emission (OAE) amplitudes (Mountain,1980; Siegel and Kim, 1982). Activation of olivoco-chlear efferents reduces basilar membrane (BM)vibration in a frequency-dependent manner (Dolanet al., 1997; Murugasu and Russell, 1996). Theseresults suggest that medial olivocochlear (MOC)activation reduces the transduction potentials ofOHCs, thereby reducing the gain of the cochleaamplifier and corresponding BM vibration.
Because of their noninvasive nature, OAEs haveemerged as a key measurement tool in studying the
Correspondence to: Shawn S. Goodman & Center for HearingResearch & Boys Town National Research Hospital & 555 North30th Street, Omaha, NE 68131, USA. Telephone: +1-402-4986300;email: [email protected]
JARO 7: 125–139 (2006)DOI: 10.1007/s10162-006-0028-9
125
JAROJournal of the Association for Research in Otolaryngology
MOC reflex in humans. OAEs are thought to be agood assay of the MOC reflex because OAEs arisefrom the action of OHCs, and the MOC reflex actsthrough synapses on OHCs to alter BM mechanics.However, care is needed when interpreting theeffects of MOC activation on OAEs.
Some possible confounds were discussed byGuinan et al. (2003). First, some OAE probe stimulithemselves may elicit the MOC reflex, making theshift in the OAE smaller than it would otherwise be inthe absence of this partial activation of the reflex bythe probe. Second, the MOC activator is generallypresented to the contralateral ear to avoid acousticcontamination of the OAE (Collet et al., 1990;Veuillet et al., 1991; Maison et al., 1997). Anatomicalevidence suggests that the ipsilateral reflex is stron-ger than the contralateral reflex (Guinan et al., 1983;Robertson and Gummer, 1985; Warr, 1992), whereBipsilateral^ refers to the case when activator andprobe are presented in the same ear.
Guinan et al. (2003) presented data from humanears suggesting that using stimulus frequency oto-acoustic emissions (SFOAEs) as an assay of the MOCreflex may overcome these problems: a low-level[approximately 40 dB sound pressure level (SPL)]SFOAE probe tone does not itself elicit the MOCreflex and allows measurements to be made usingipsilateral noise activators. A disadvantage of ipsilater-al noise activators is that SFOAEs are elicited by so-called Btwo-tone^ suppression during the presentationof the activator. It is therefore possible to measureMOC reflex effects only after the activator has beenturned off.
The initial report by Guinan et al. (2003) sug-gested that SFOAEs and ipsilateral activators may bean effective way to measure the MOC reflex; however,their study reported data from a limited group ofsubjects at a single frequency and over a limited timeinterval. Part of their subject inclusion criteria wasthat subjects had easily measurable MOC efferenteffects. If SFOAE tests of MOC reflex are to findclinical value, it is important to know the prevalenceof measurable MOC effects in the general, normal-hearing population. Auditory nerve fiber thresholdsin the cat (Guinan and Gifford, 1988) suggest thatthe MOC reflex is strongest across a range offrequencies in the lower mid-frequency range ofhearing. The efferent innervation patterns in humansare not known, and MOC reflex effects in humansmight also vary across a range of frequencies. Guinanet al. (2003) reported MOC shifts in only a 100-msinterval beginning 50 ms after cessation of a noiseactivator. The sensitivity of detecting MOC efferentshifts may be strongly affected by the probe frequen-cy relative to SFOAE fine structure. Although Guinanet al. noted that their protocol may have produced an
alignment with each subject’s fine structure, theymade no attempt to measure this directly.
Measurement of the MOC reflex may also be easilycontaminated by the middle-ear muscle (MEM)reflex. Effective activators of the MOC reflex are alsoeffective activators of the MEM reflex. Elicitation ofthe MEM reflex results in a stapedius musclecontraction, which alters the source sound pressurein the ear canal, primarily at low frequencies (Moller,1983). This change in sound pressure may easily bemistaken for a MOC reflex, which can have a similartemporal pattern (Guinan et al., 1983).
To date, the majority of studies using OAEs tostudy MOC reflex in humans have only indirectlyaddressed the problem of MEM reflex (Mott et al.,1989; Collet et al., 1990; Veuillet et al., 1991, 1992;Hood et al., 1996, 2003; Maison et al., 1997, 1999).The studies of Burns et al. (1993) and Whitehead etal. (1991) suggest that emissions may be sensitive tosmall, subclinical MEM contractions, making directmeasurement desirable. Two exceptions to the indi-rect evaluation of MEM reflex contamination exist.Buki et al. (2000) examined phase and level shifts ofthe 2f1–f2 distortion product otoacoustic emission(DPOAE) as a function of frequency. When high-levelnoise was presented to activate the MEM reflex, phaseleads were seen below 2 kHz, and level decreases wereseen below 1 kHz. In contrast, when lower-level noisewas used to activate the MOC reflex, no obviousfrequency dependence was seen in phase or levelchanges. Buki et al. (2000) suggested that thisfrequency dependence could be used to separateMEM and MOC effects. Guinan et al. (2003) evalu-ated the contributions of the MEM reflex by makingseveral measurements at closely spaced frequenciesand then examining the phase gradient of theresponses. In this method, a shift caused by an MEMreflex is expected to have a short group delay,corresponding to a shallow phase gradient, comparedto the much longer delays of SFOAEs associated withMOC-induced shifts (Shera and Guinan, 1999).
One of the main disadvantages of such methods isthe need to make sequential measurements at severalfrequencies. The need to make several closely spacedmeasurements is time consuming and may makeclinical implementation more difficult. The activa-tion of MEM reflex can vary across runs even whenstimulus levels are fixed Guinan et al. (2003).Because of this, interpretation of sequential measure-ments may be difficult when activator levels are nearthe MEM reflex threshold.
An alternative method, which may overcome thesedifficulties, is to simultaneously measure the MOCand MEM reflexes using low- and high-frequencyprobe tones presented together. The use of a low-frequency (226 Hz) probe tone to detect an MEM
126 GOODMAN AND KEEFE: Noise-Activated MEM and SFOAE
reflex via changes in acoustic admittance is a standardclinical practice. However, nonlinear signal extractiontechniques such as those used to measure SFOAE re-siduals can be used to provide a more sensitive probeof the MEM reflex (Neumann et al., 1996).
Based on these considerations, the current studywas designed to further examine the use of SFOAEprobes and ipsilaterally presented activators to mea-sure the MOC reflex. A sample of subjects was chosenwith normal hearing and middle-ear function, butwithout regard to MOC reflex strength. Responseswere examined near frequencies of 1.5 and 3.5 kHz.The exact probe frequency for each subject waschosen relative to their SFOAE fine structure. Anovel method was used to simultaneously measurethe MOC and MEM reflexes, and a nonlinear signalextraction technique was used to improve MEMreflex detection capability. Changes in SFOAE ampli-tude after the offset of a broadband noise activatorwere examined. It was hypothesized that (1) SFOAEprobes would provide a sensitive measure of theipsilateral MOC reflex in most subjects; (2) probesnear 1.5 and 3.5 kHz would both be sensitiveindicators of the MOC reflex; and (3) a simulta-neously presented low-frequency probe tone wouldprovide a sensitive measure of MEM reflex activation.
METHODS
Subjects
Fifteen subjects in the age range 14–34 years [mean =24.7 years, standard deviation (SD) = 6.5 years] weretested. All subjects had pure-tone air conductionthresholds e15 dB HL at octave frequencies from0.25 to 8 kHz and normal middle-ear function, asassessed by normal 226 Hz tympanograms at the timeof testing. The subjects included 11 females and 4males. During testing, subjects were seated in acomfortable chair within a sound-attenuated booth.The experimental protocol was approved by theInstitutional Review Board at Boys Town NationalResearch Hospital, and written informed consent wasobtained from all participants.
Measurement paradigm
Stimuli were digitally generated and recorded at a22,050-Hz sampling rate using a personal computer,a Digital Audio Labs CardDeluxe sound card, andcustom software. Stimulus delivery and responseacquisition was made via an Etymotic Research ER-10C probe microphone system, using two loud-speakers and a microphone. The system was modifiedby Etymotic to provide 20 dB of additional gain in thesignal driving each loudspeaker. SFOAEs were col-
lected using a double-evoked (2E) method (Keefe,1998; Keefe and Ling, 1998). In this paradigm, a totalof three stimulus intervals were presented. The firststimulus (s1) was presented through a first loudspeak-er, followed by a presentation of the second stimulus(s2) through a second loudspeaker. Then bothstimuli were presented simultaneously (s12), eachthrough its own loudspeaker. The ear canal soundpressure p1 was measured in response to stimulus s1,p2 to stimulus s2, and p12 to stimulus s12. Thenonlinear residual pd was extracted by calculating
pd ¼ p1 þ p2 � p12: ð1Þ
By this process, the signals themselves along with anyisochannel system distortion were canceled, leavingonly the nonlinear components (generally inter-preted as OAEs or MEM reflexes) and any intermod-ulation distortion generated by the system. Systemdistortion was assessed from coupler recordings usingan artificial human ear simulator (Bruel and Kjærtype 4157) that approximated the impedance of anaverage adult ear (IEC 711 standard). System distor-tion was below the level of the noise floor at all levelsused in this experiment. Sets of stimulus waveforms(s1, s2, and s12) were interleaved, and online and posthoc artifact rejection were used (see Analysis fordetails), resulting in stable and repeatable results.
Stimuli
A typical stimulus set is shown in Figure 1. The firststimulus (s1) condition consisted of a higher-frequen-cy probe tone (PH) and a lower-frequency (PL) probetone presented simultaneously. The overall durationof each s1 stimulus buffer was 2000 ms, during whichthe probe tone was gated on for 1350 ms and wassilent for 650 ms (Fig. 1, top panel). The probe s1 wasgated on at 50 ms and gated off at 1400 ms with 5-msgating ramps. The 650-ms silent interval was chosento allow the auditory system to return to baseline.The second stimulus (s2) condition was an acousticMOC activator consisting of a notched broadbandnoise and had the same overall buffer duration of2000 ms (Fig. 1, middle panel). The activator wasgated on for 500 ms starting at an onset time of 300ms, which was 250 ms after the onset of the s1 probe.The activator ended at 800 ms, which provided a 600-ms postactivator window in which the proberemained on (i.e., between 800 and 1400 ms) inwhich possible efferent effects could be observed.The activator used the same 5-ms gating ramps as didthe probe. The activator duration of 500 ms waschosen based on data suggesting that MOC onseteffects in humans occur with a time constant of about69 ms (Kim et al., 2001). The duration of 600 ms was
GOODMAN AND KEEFE: Noise-Activated MEM and SFOAE 127

chosen based on data showing an important class ofefferent effects decay with time constants of 50–100ms (Guinan, 1990; Tavartkiladze et al., 1996). Thethird stimulus condition (s12) consisted of the jointpresentation of s1 and s2 (Fig. 1, bottom panel).
The probe frequency of PH was near 1.5 or 3.5kHz, and the probe frequency of PL was near 0.25kHz. Because the MEM reflex reduces sound trans-mission at low frequencies, and because SFOAEs areextremely difficult to measure at low frequenciesnear 0.25 kHz because of the higher noise floor, itwas assumed that PL would be sensitive only to MEMreflexes. Conversely, it was assumed that PH would besensitive to SFOAEs and processes that modify thestrength of SFOAEs (e.g., the MOC reflex or othercochlear changes) because SFOAEs are generallymeasured in this frequency range and MEM reflexeffects are considered small.
Because the probe tones were low-level (40 dBSPL), it is likely that any effects of the activator variedwith the total duty cycle of the activator stimulus,based on a single presentation of each of s1, s2, ands12. The three stimulus buffers comprised a 6-srepetition period, during which the activator was onfor a total of 1 s, yielding a duty cycle of 1/6.
Specific PH frequencies ( fH) were chosen individ-ually for each subject to be near their SFOAE finestructure amplitude maxima, but at least 100 Hz awayfrom any synchronous spontaneous OAEs. Twofrequency regions were tested for fH: 1.5 and 3.5kHz. The frequency of PL ( fL) was between 0.25 and0.3 kHz, the exact frequency chosen to ensure thatharmonic distortion of PL fell on either side of PH,thereby removing a source of potential artifact. Thisfrequency is in the range of clinical probe frequen-cies (typically 226 Hz) used to detect the MEM reflex.PH was presented at a level of 40 dB SPL, and PL waspresented at a level of 55 dB SPL.
The MOC activator was an electrically flat notchednoise with energy from 0.4 to 8 kHz. Broadbandnoise was chosen because it is an effective elicitor ofthe MOC reflex (Berlin et al., 1993). One purpose ofusing a notched noise was to measure an SFOAEsignal when the SFOAE probe tone and the notchednoise signals were simultaneously present (using anonlinear SFOAE residual technique described lat-er). A narrowband filter (30-Hz bandwidth) was usedto extract an SFOAE signal such that the 30-Hzpassband was contained in the notch of the notchednoise. In the original experiments, the broadbandnoise contained a notch logarithmically centered atf H, with a notch width (NW) = 1/6, 1/3, 2/3, or 1octave. The intent of varying notch width was toexamine its effect on the strength of the MOC reflex.Nominal overall levels LA of the activator were 45, 51,57, 63, 69, and 75 dB SPL, corresponding to spectral
FIG. 1. Set of stimulus waveforms: s1 (top), s2 (middle), and s12
(bottom) were presented in separate stimulus intervals. Stimulus s1
consisted of a pair of sinusoidal probe tones gated on from 50 to1350 ms; s2 was a short-duration (500 ms) activator noise; s12 wasthe joint presentation of s1 and s2. As indicated by vertical dashedlines in this and subsequent figures, the time period 50–299 ms isreferred to as the Bpreactivator window,^ the time period 300–800ms is called the Bactivator window,^ the time period 850–1350 ms iscalled the Bpostactivator window,^ and 1351–2000 ms is called theBsilent period.^ The 50-ms delay between the end of the activatorwindow (at 800 ms) and the beginning of the postactivator window(at 850 ms) allows for filter settling time and for cochlearsuppression effects to die away. The vertical dashed line at thebeginning of the postactivator period is drawn with a thicker linewidth in this and subsequent figures.
FIG. 2. Sample stimulus spectra. Low-frequency probes PL werepresented at 55 dB SPL and were located between 250 and 300 Hz.Spectra are shown, in which the high-frequency probe tones PH werepresented at 40 dB SPL and were located near 1.5 kHz (top) or 3.5kHz (bottom). The MOC activator was an electrically flat, notchednoise with energy from 0.4 to 8 kHz. The notch was logarithmicallycentered at f H with varying notch widths and levels. The exampleshown is for an activator of 45 dB SPL with a notch width of 1/3octave.
128 GOODMAN AND KEEFE: Noise-Activated MEM and SFOAE

levels of 6, 12, 18, 24, 30, and 36 dB SPL (re 1 Hzbandwidth), respectively. Typical frequency spectraof the stimuli and activator, as measured in asubject’s ear canal, are shown in Figure 2.
Analysis
Data were analyzed using custom software written inMATLAB. For each measurement, N = 18 indepen-dent buffers of data were collected (where one bufferrepresents a set of p1, p2, and p12 waveforms). Onlineartifact rejection was used to detect and reject databuffers that were contaminated by intermittent noise.The artifact rejection test is described in detail inSchairer et al. (2003). The 2E residual (pd) wascalculated using Eq. (1), and responses to PH and PL
were examined separately by filtering each set with aKaiser window-based finite impulse response (FIR)filter (2463 taps, 55-ms group delay, 30-Hz equivalentrectangular bandwidth) centered at f H and f L. Eachset of Npd waveforms was filtered. The Hilbertenvelope and instantaneous phase (Oppenheim andSchafer, 1989) were extracted and averaged over theN waveforms to produce estimates of signal SPL andphase. The noise floor was calculated as the standarderror of the mean (SEM) of the Hilbert envelopesand converted to a noise SPL (in dB). Signal-to-noiseratio (SNR) was calculated as the mean signal levelminus the SEM.
The nonlinear residual pressure pd extracted usingresponses to PH is called the BSFOAE signal^ in thisreport (the absence of a significant residual responsein coupler measurements verified that the pd residualwas of biological origin). The response to PH did notinvolve a substantial contribution from the MEMreflex at fH and was thus concluded to be of cochlearorigin. This SFOAE signal was a nonlinear SFOAEresidual obtained from the SFOAE present in re-sponse to a pure tone (s1) and the modified SFOAEpresent in response to the simultaneous presentationof the pure tone in a broadband notched noise (s12).The calculation of the residual identified as theSFOAE signal in Eq. (1) also involved a subtractingout of the broadband notched-noise signal compo-nent (s2), which was present at low levels in thenarrowband filter output centered within the notchof the notched noise.
The nonlinear residual pressure pd extracted usingresponses to PL is called the BMEM signal^ in thisreport for the following reasons. The low-frequencyPL responses were measured at f L close to 0.25 kHz,where SFOAE responses were weak because of theelevated internal physiologic noise floor, and MEMreflex effects are known from clinical practice to besignificant. It was possible to classify a given nonlin-ear residual pd at f L as having an MEM source if its
onset latency was Q70 ms, or as having an SFOAEorigin if its onset latency was shorter, e.g., e44 ms.The specific choice of 44 ms as an upper bound to anSFOAE latency is based on the fact that the SFOAElatency at 1 kHz at low levels is approximately 11 ms(Shera and Guinan, 2003), whereas the assumptionof cochlear scaling symmetry (Zweig and Shera,1995) predicts the latency at other frequencies. Ifsuch a symmetry exists, the SFOAE latency at 0.25kHz is predicted to be four times that at 1 kHz, or44 ms. If the symmetry is violated at low frequen-cies, e.g., if the BM is more broadly tuned at lowfrequencies in human ears, then the prediction isthat the SFOAE latency at 0.25 kHz would be lessthan 44 ms. Thus, 44 ms is an upper bound forthe expected round-trip SFOAE latency. The onsetlatencies of SFOAEs and MEM reflex effects werethus separated by tens of milliseconds, whichallowed classification of the origin of each responseto PL. Some residuals would possibly have both MEMand SFOAE sources, but such a residual wouldinitially include the short-latency SFOAE response.The results summarized in Discussion showed thatonly one subject had a short-latency response thatcould be attributed to an SFOAE. Except for thissubject, all other subjects had residuals pd extractedusing responses to PL that were of MEM origin. Forthese reasons, a pd response to PL is called an MEMsignal.
It remained to determine when a nonlinearresidual was significantly different than zero. AnSNR criterion was adopted for signal detection basedon Green and McGill (1970). They showed that a 10-dB SNR corresponds approximately to a 99% correctcriterion in a two-alternative forced-choice signaldetection task, for a bandwidth-duration product of1.5 (i.e., a 30-Hz filter and 50-ms window duration). A50-ms window duration was chosen to allow for filtersettling time and to facilitate comparisons withGuinan et al. (2003).
To verify the 10-dB criterion, empirical distribu-tion functions (edfs) of SNR were constructed. Anedf is a cumulative distribution function created fromactual data. For a random sample xi, i = 1, 2, . . . , n, theedf equals the fraction of the set that is less than orequal to each xi. Edfs were calculated for threeconditions, numerical simulations, coupler record-ings, and recordings from a subject’s ear (with thetone present and the activator absent). For eachcondition, 984 independent samples of SNR wereused to calculate the edf. Samples were filtered withthe FIR filters described above prior to calculatingSNR. As shown in Figure 3, there was good agree-ment between the edfs of the three conditions. Closeagreement was also seen between these measures andwith Green and McGill: the average SNR value
GOODMAN AND KEEFE: Noise-Activated MEM and SFOAE 129

corresponding to a cumulative probability of 0.99 was10.0 dB. Based on these results, a signal was consid-ered present in any given 50-ms time window if theSNR was Q10 dB.
The presence of a signal was also associated with themean phase trajectory becoming relatively flat, indi-cating a quasi-sinusoidal response. A rapid-varyingphase for this stimulus set would be consistent with anoise-dominated narrowband signal. Although phasewas not used as part of the criteria for determiningpresence of a signal, it still yielded additional, usefulinformation.
When the 2E method is used to extract OAEs, caremust be taken that baseline shifts in the stimulussound pressure are not mistaken for OAEs. Suchbaseline shifts may arise from movements of theacoustic probe assembly in the ear canal or fromchanges in middle-ear pressure. In the measurementparadigm described here, the effects of such changeswere controlled in two ways. First, such changes werelikely to be associated with a sudden increase in theoverall energy present in the recording buffer. Posthoc artifact rejection was used to remove bufferswhere changes occurred. After narrowband FIRfiltering, the energy in each buffer was calculated.Any buffer with energy more than five times greaterthan the median was rejected. This method of posthoc artifact rejection resulted in an average of N = 16buffers (SD = 2 buffers) for each recording. Second,for those buffers that were kept, the method ofcalculating the noise floor as the SEM of the squareof the emission sound pressure amplitude ensuredthat sudden changes were not interpreted as emis-sions. Using this method, baseline shifts would
change the mean emission level slightly, but theywould also increase the SEM (i.e., the noise floor),ensuring that changes as a result of a sudden baselineshift were not interpreted as emissions.
RESULTS
Individual results
An example of expected results for PH in the absenceof an MEM reflex is shown in Figure 4. In thepreactivator window (0–350 ms), the SFOAE level isless than the detection criterion (shaded gray area)and thus not significantly different from the noise(black area), and the phase varies rapidly. TheSFOAE SPL shows a fast-rising slope when theactivator is turned on, this slope being primarilydetermined by FIR filter delay. The SFOAE SPLexceeds the detection criterion (shaded gray area)during the activator window, and the correspondingphase is relatively flat, indicative of a quasi-sinusoidalresponse at the probe frequency. In the absence ofMEM reflex during the time in which the activator ison, the SFOAE response is presumably a result ofsuppression of the tone by the activator on the BM.Fluctuations in SPL and phase over the duration ofthe activator window may be a result of the MOCreflex or to other factors, which include the OAEeffects caused by temporal fluctuations in the enve-lope of the frozen-noise activator. Because thecharacteristic time constants of MOC reflex decaysare on the order of 100 ms or more (Guinan, 1990,
FIG. 3. Empirical distribution functions (edfs) for SNR when no OAEis present. Solid line shows a numerical simulation, dotted line showsdata recorded from a coupler, and dashed lines show data from asubject’s ear (with the probe tone present but the activator absent).
FIG. 4. SPL envelope (top panel) and phase (bottom panel)responses using PH = 1 kHz. Mean SPL is shown by black line ofuniform width. The noise based on the SEM is shown by the blackline of nonuniform thickness. The gray shaded area marks thedetection criterion, the top of the shaded area being 10 dB above thenoise. Vertical dashed lines mark the preactivator, activator, andpostactivator windows.
130 GOODMAN AND KEEFE: Noise-Activated MEM and SFOAE
1996; Tavartkiladze et al., 1996), the influence of theMOC reflex is expected to extend into the postacti-vator window. In contrast, the influence of thebasilar-membrane suppression mechanism ends 10–20 ms after the activator is gated off. In Figure 4, aresponse is present in the initial part of the post-activator window (just after 850 ms). This responsedecays into the noise floor within approximately 200ms, consistent with reported values of MOC reflexdecay (Guinan et al., 1983, 2003).
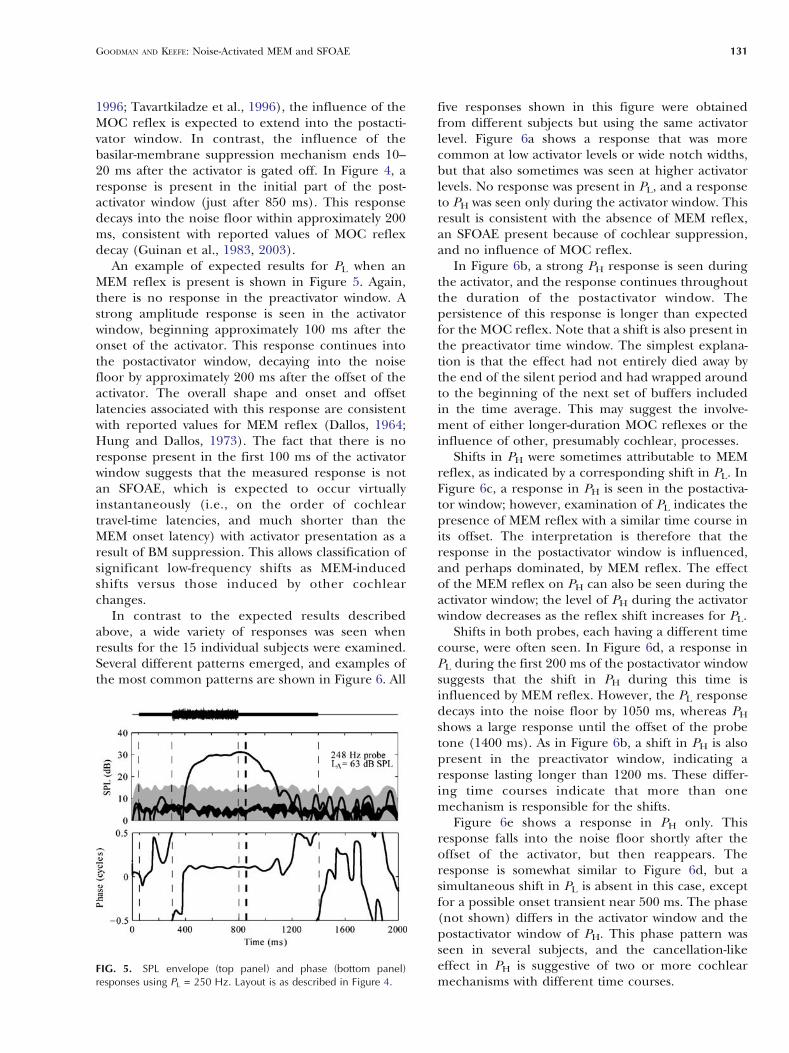
An example of expected results for PL when anMEM reflex is present is shown in Figure 5. Again,there is no response in the preactivator window. Astrong amplitude response is seen in the activatorwindow, beginning approximately 100 ms after theonset of the activator. This response continues intothe postactivator window, decaying into the noisefloor by approximately 200 ms after the offset of theactivator. The overall shape and onset and offsetlatencies associated with this response are consistentwith reported values for MEM reflex (Dallos, 1964;Hung and Dallos, 1973). The fact that there is noresponse present in the first 100 ms of the activatorwindow suggests that the measured response is notan SFOAE, which is expected to occur virtuallyinstantaneously (i.e., on the order of cochleartravel-time latencies, and much shorter than theMEM onset latency) with activator presentation as aresult of BM suppression. This allows classification ofsignificant low-frequency shifts as MEM-inducedshifts versus those induced by other cochlearchanges.
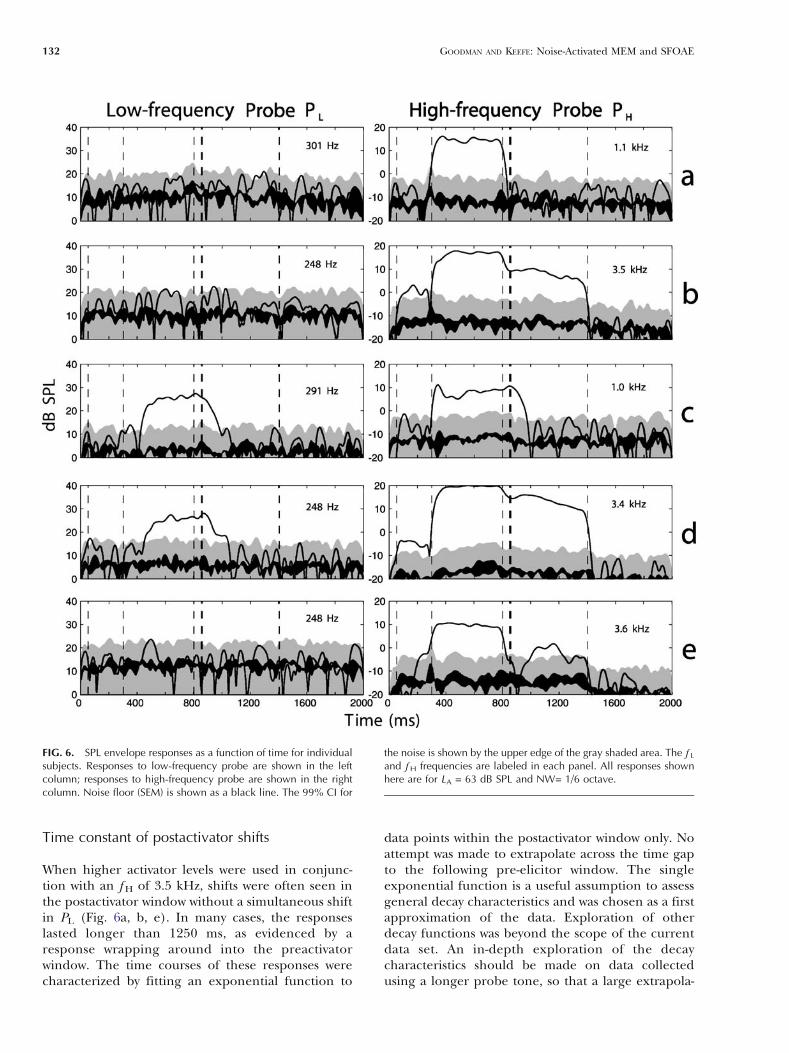
In contrast to the expected results describedabove, a wide variety of responses was seen whenresults for the 15 individual subjects were examined.Several different patterns emerged, and examples ofthe most common patterns are shown in Figure 6. All
five responses shown in this figure were obtainedfrom different subjects but using the same activatorlevel. Figure 6a shows a response that was morecommon at low activator levels or wide notch widths,but that also sometimes was seen at higher activatorlevels. No response was present in PL, and a responseto PH was seen only during the activator window. Thisresult is consistent with the absence of MEM reflex,an SFOAE present because of cochlear suppression,and no influence of MOC reflex.
In Figure 6b, a strong PH response is seen duringthe activator, and the response continues throughoutthe duration of the postactivator window. Thepersistence of this response is longer than expectedfor the MOC reflex. Note that a shift is also present inthe preactivator time window. The simplest explana-tion is that the effect had not entirely died away bythe end of the silent period and had wrapped aroundto the beginning of the next set of buffers includedin the time average. This may suggest the involve-ment of either longer-duration MOC reflexes or theinfluence of other, presumably cochlear, processes.
Shifts in PH were sometimes attributable to MEMreflex, as indicated by a corresponding shift in PL. InFigure 6c, a response in PH is seen in the postactiva-tor window; however, examination of PL indicates thepresence of MEM reflex with a similar time course inits offset. The interpretation is therefore that theresponse in the postactivator window is influenced,and perhaps dominated, by MEM reflex. The effectof the MEM reflex on PH can also be seen during theactivator window; the level of PH during the activatorwindow decreases as the reflex shift increases for PL.
Shifts in both probes, each having a different timecourse, were often seen. In Figure 6d, a response inPL during the first 200 ms of the postactivator windowsuggests that the shift in PH during this time isinfluenced by MEM reflex. However, the PL responsedecays into the noise floor by 1050 ms, whereas PH
shows a large response until the offset of the probetone (1400 ms). As in Figure 6b, a shift in PH is alsopresent in the preactivator window, indicating aresponse lasting longer than 1200 ms. These differ-ing time courses indicate that more than onemechanism is responsible for the shifts.
Figure 6e shows a response in PH only. Thisresponse falls into the noise floor shortly after theoffset of the activator, but then reappears. Theresponse is somewhat similar to Figure 6d, but asimultaneous shift in PL is absent in this case, exceptfor a possible onset transient near 500 ms. The phase(not shown) differs in the activator window and thepostactivator window of PH. This phase pattern wasseen in several subjects, and the cancellation-likeeffect in PH is suggestive of two or more cochlearmechanisms with different time courses.
FIG. 5. SPL envelope (top panel) and phase (bottom panel)responses using PL = 250 Hz. Layout is as described in Figure 4.
GOODMAN AND KEEFE: Noise-Activated MEM and SFOAE 131
Time constant of postactivator shifts
When higher activator levels were used in conjunc-tion with an f H of 3.5 kHz, shifts were often seen inthe postactivator window without a simultaneous shiftin PL (Fig. 6a, b, e). In many cases, the responseslasted longer than 1250 ms, as evidenced by aresponse wrapping around into the preactivatorwindow. The time courses of these responses werecharacterized by fitting an exponential function to
data points within the postactivator window only. Noattempt was made to extrapolate across the time gapto the following pre-elicitor window. The singleexponential function is a useful assumption to assessgeneral decay characteristics and was chosen as a firstapproximation of the data. Exploration of otherdecay functions was beyond the scope of the currentdata set. An in-depth exploration of the decaycharacteristics should be made on data collectedusing a longer probe tone, so that a large extrapola-
FIG. 6. SPL envelope responses as a function of time for individualsubjects. Responses to low-frequency probe are shown in the leftcolumn; responses to high-frequency probe are shown in the rightcolumn. Noise floor (SEM) is shown as a black line. The 99% CI for
the noise is shown by the upper edge of the gray shaded area. The f L
and f H frequencies are labeled in each panel. All responses shownhere are for LA = 63 dB SPL and NW= 1/6 octave.
132 GOODMAN AND KEEFE: Noise-Activated MEM and SFOAE
tion is not required between post- and preactivatortime windows. The time courses of shifts during thepostactivator window were therefore characterized bya single exponential function, and time constantswere calculated for shifts that were above the noise
floor (28 recordings from 12 subjects). The resultingmean time constant was 516 ms (SD = 186 ms).
Group results
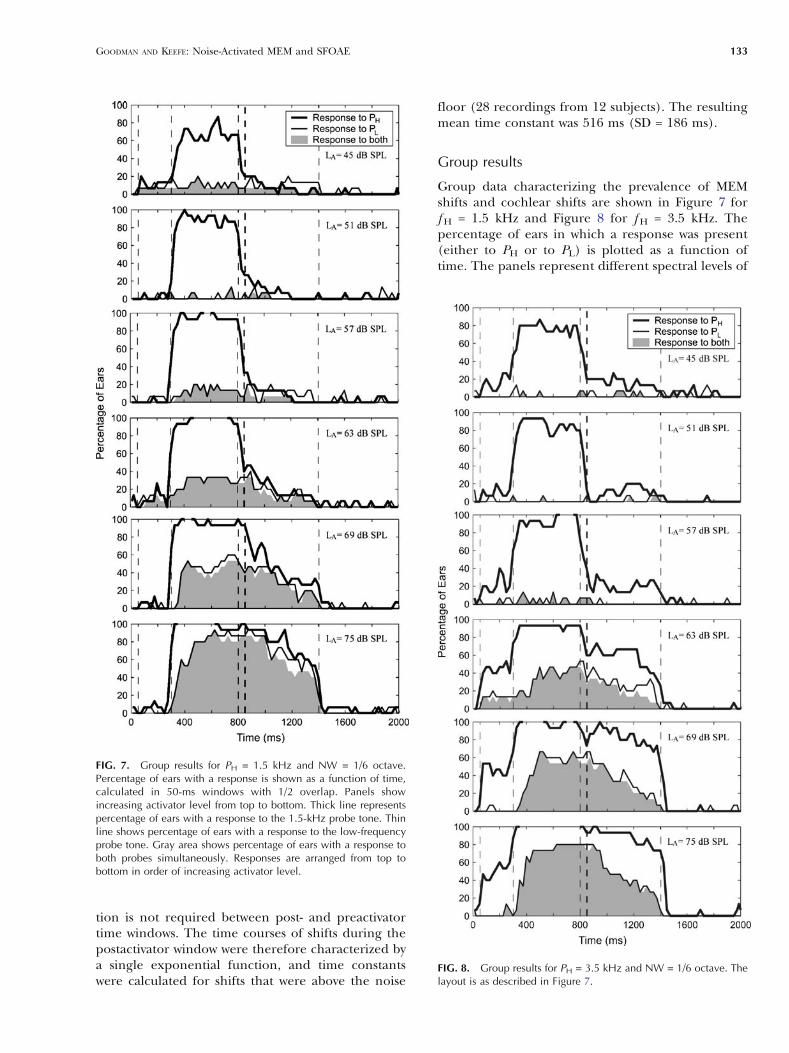
Group data characterizing the prevalence of MEMshifts and cochlear shifts are shown in Figure 7 forf H = 1.5 kHz and Figure 8 for f H = 3.5 kHz. Thepercentage of ears in which a response was present(either to PH or to PL) is plotted as a function oftime. The panels represent different spectral levels of
FIG. 7. Group results for PH = 1.5 kHz and NW = 1/6 octave.Percentage of ears with a response is shown as a function of time,calculated in 50-ms windows with 1/2 overlap. Panels showincreasing activator level from top to bottom. Thick line representspercentage of ears with a response to the 1.5-kHz probe tone. Thinline shows percentage of ears with a response to the low-frequencyprobe tone. Gray area shows percentage of ears with a response toboth probes simultaneously. Responses are arranged from top tobottom in order of increasing activator level.
FIG. 8. Group results for PH = 3.5 kHz and NW = 1/6 octave. Thelayout is as described in Figure 7.
GOODMAN AND KEEFE: Noise-Activated MEM and SFOAE 133
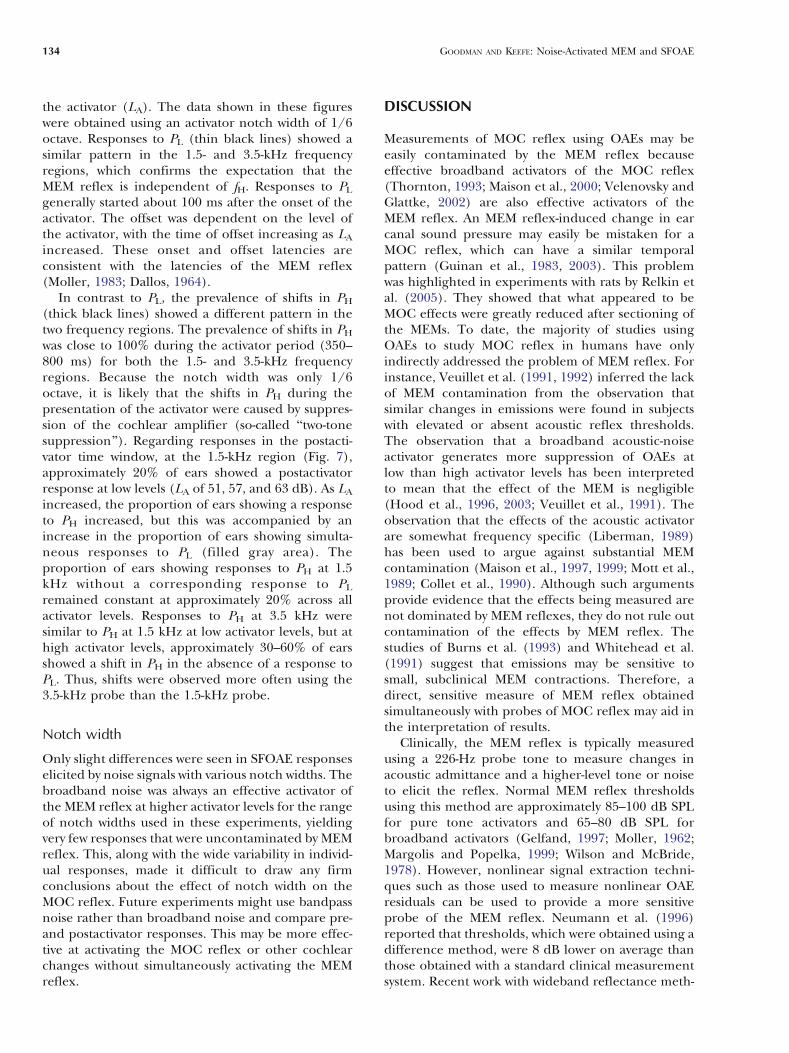
the activator (LA). The data shown in these figureswere obtained using an activator notch width of 1/6octave. Responses to PL (thin black lines) showed asimilar pattern in the 1.5- and 3.5-kHz frequencyregions, which confirms the expectation that theMEM reflex is independent of fH. Responses to PL
generally started about 100 ms after the onset of theactivator. The offset was dependent on the level ofthe activator, with the time of offset increasing as LA
increased. These onset and offset latencies areconsistent with the latencies of the MEM reflex(Moller, 1983; Dallos, 1964).
In contrast to PL, the prevalence of shifts in PH
(thick black lines) showed a different pattern in thetwo frequency regions. The prevalence of shifts in PH
was close to 100% during the activator period (350–800 ms) for both the 1.5- and 3.5-kHz frequencyregions. Because the notch width was only 1/6octave, it is likely that the shifts in PH during thepresentation of the activator were caused by suppres-sion of the cochlear amplifier (so-called Btwo-tonesuppression^). Regarding responses in the postacti-vator time window, at the 1.5-kHz region (Fig. 7),approximately 20% of ears showed a postactivatorresponse at low levels (LA of 51, 57, and 63 dB). As LA
increased, the proportion of ears showing a responseto PH increased, but this was accompanied by anincrease in the proportion of ears showing simulta-neous responses to PL (filled gray area). Theproportion of ears showing responses to PH at 1.5kHz without a corresponding response to PL
remained constant at approximately 20% across allactivator levels. Responses to PH at 3.5 kHz weresimilar to PH at 1.5 kHz at low activator levels, but athigh activator levels, approximately 30–60% of earsshowed a shift in PH in the absence of a response toPL. Thus, shifts were observed more often using the3.5-kHz probe than the 1.5-kHz probe.
Notch width
Only slight differences were seen in SFOAE responseselicited by noise signals with various notch widths. Thebroadband noise was always an effective activator ofthe MEM reflex at higher activator levels for the rangeof notch widths used in these experiments, yieldingvery few responses that were uncontaminated by MEMreflex. This, along with the wide variability in individ-ual responses, made it difficult to draw any firmconclusions about the effect of notch width on theMOC reflex. Future experiments might use bandpassnoise rather than broadband noise and compare pre-and postactivator responses. This may be more effec-tive at activating the MOC reflex or other cochlearchanges without simultaneously activating the MEMreflex.
DISCUSSION
Measurements of MOC reflex using OAEs may beeasily contaminated by the MEM reflex becauseeffective broadband activators of the MOC reflex(Thornton, 1993; Maison et al., 2000; Velenovsky andGlattke, 2002) are also effective activators of theMEM reflex. An MEM reflex-induced change in earcanal sound pressure may easily be mistaken for aMOC reflex, which can have a similar temporalpattern (Guinan et al., 1983, 2003). This problemwas highlighted in experiments with rats by Relkin etal. (2005). They showed that what appeared to beMOC effects were greatly reduced after sectioning ofthe MEMs. To date, the majority of studies usingOAEs to study MOC reflex in humans have onlyindirectly addressed the problem of MEM reflex. Forinstance, Veuillet et al. (1991, 1992) inferred the lackof MEM contamination from the observation thatsimilar changes in emissions were found in subjectswith elevated or absent acoustic reflex thresholds.The observation that a broadband acoustic-noiseactivator generates more suppression of OAEs atlow than high activator levels has been interpretedto mean that the effect of the MEM is negligible(Hood et al., 1996, 2003; Veuillet et al., 1991). Theobservation that the effects of the acoustic activatorare somewhat frequency specific (Liberman, 1989)has been used to argue against substantial MEMcontamination (Maison et al., 1997, 1999; Mott et al.,1989; Collet et al., 1990). Although such argumentsprovide evidence that the effects being measured arenot dominated by MEM reflexes, they do not rule outcontamination of the effects by MEM reflex. Thestudies of Burns et al. (1993) and Whitehead et al.(1991) suggest that emissions may be sensitive tosmall, subclinical MEM contractions. Therefore, adirect, sensitive measure of MEM reflex obtainedsimultaneously with probes of MOC reflex may aid inthe interpretation of results.
Clinically, the MEM reflex is typically measuredusing a 226-Hz probe tone to measure changes inacoustic admittance and a higher-level tone or noiseto elicit the reflex. Normal MEM reflex thresholdsusing this method are approximately 85–100 dB SPLfor pure tone activators and 65–80 dB SPL forbroadband activators (Gelfand, 1997; Moller, 1962;Margolis and Popelka, 1999; Wilson and McBride,1978). However, nonlinear signal extraction techni-ques such as those used to measure nonlinear OAEresiduals can be used to provide a more sensitiveprobe of the MEM reflex. Neumann et al. (1996)reported that thresholds, which were obtained using adifference method, were 8 dB lower on average thanthose obtained with a standard clinical measurementsystem. Recent work with wideband reflectance meth-
134 GOODMAN AND KEEFE: Noise-Activated MEM and SFOAE
ods also suggests that the MEM reflex threshold maybe activated at levels 10 dB lower than shown onclinical tests (Feeney et al., 2003). Based on theseresults, it was hypothesized that the nonlinear residualsignal extraction technique used in these experimentswould provide a sensitive probe of the MEM reflex. Anexamination of Figures 7 and 8 suggests that theMEM reflex was generally measured at noise activatorlevels of 63, 69, and 75 dB SPL. A direct comparisonof standard clinical and nonlinear extraction tech-niques was not an aim of this study, and detailedcomparisons were not made. However, it appears thatthe low-frequency probe tone with the nonlinearextraction technique identified MEM reflexes acrossthe expected range of activator levels.
An alternative method for determining the contri-bution of MEM reflexes to shifts in SFOAE probeswas reported by Guinan et al. (2003). Severalmeasurements were made at closely spaced frequen-cies, and the phase gradient of the responses wasexamined. In this method, a shift caused by an MEMreflex is expected to have a short group delay,corresponding to a shallow phase gradient, com-pared to the much longer delays of SFOAEs associ-ated with MOC-induced shifts (Shera and Guinan,1999). The threshold levels for elicitation of theMEM reflex reported by Muller-Wehlau et al. (2005)and Guinan et al. (2003) using the phase-gradienttechnique were similar to those obtained in thecurrent study. However, the low-frequency probemethod may hold some advantages over the phase-gradient method. First, the low-frequency probemethod allows simultaneous measurement of MEMreflex for each MOC measurement. This is importantbecause, as noted by Guinan et al. (2003), theactivation of MEM can vary across runs even whenstimulus levels are fixed. Because the phase-gradientmethod does not measure the two effects simulta-neously, it does not allow for interpretation of effectswhen activator levels are near the MEM reflexthreshold. Second, simultaneous-probe measure-ments may be less time consuming because the needto make individual measurements at several closelyspaced frequencies is eliminated. Third, with thesimultaneous-probe method, the MEM reflex can bedesignated as present or absent based on a statisticalSNR criterion. In contrast, the phase-gradient meth-od has an area of Bmixed^ effects that are difficult tointerpret, i.e., levels of activators where the phasegradient is in between the shallow slope expected forMEM reflex but not as steep as expected for anSFOAE. Fourth, the low-frequency probe methodallows examination of the temporal interaction ofSFOAE-based and MEM-mediated effects, which mayoccur in the same measurement. For example,responses like those shown in Figure 6d can be
interpreted in terms of an MEM component andother (possibly MOC-mediated) components, andthe time course of the MEM reflex can be seenrelative to that of the other components.
The method using a low-frequency probe andnonlinear extraction is limited by the sensitivity ofthe probe to middle-ear impedance changes. Largerrelative changes in impedance may occur at highervalues of f L, but then it is more likely that the shiftrepresents an OAE at that frequency. It was for thisreason that f L was chosen close to 0.25 kHz. Oneadjustable parameter in using the low-frequencyprobe is the choice of level. It must be high enoughso that the nonlinear residual at f L is above the noisefloor, but not so high to elicit a measurable SFOAEor to itself elicit an MEM or MOC reflex. Previouswork indicates that frequency integration occurs forMEM reflexes (Simmons, 1960; Sesterhenn andBreuninger, 1976; Blood and Greenberg, 1981;Stelmachowicz and Gorga, 1983; Kawase et al.,1997), as well as MOC reflexes (Berlin et al., 1993;Maison et al., 1997, 1998, 1999, 2000). Guinan et al.(2003) showed that DPOAE probes can partiallyactivate the MOC reflex, whereas low-level SFOAEprobes do not. The levels used in the present study(40 and 55 dB SPL) were lower than those typicallyused to measure DPOAEs clinically, and the toneswere widely separated in frequency, unlike the typicalseparation between DPOAE primary tones. Theactivator bandwidth in the present study was alreadyvery wide (approximately 6–7 kHz), so that theaddition of a single, low-level sinusoid would not beexpected to cause an appreciable change in thereflexes.
The PL level of 55 dB SPL used in this experimentwas chosen based on pilot data from three subjects.To make sure that the joint presentation of PH andPL did not appreciably affect the results, measure-ments were made using PH alone and PH + PL. Noneof the subjects showed significant differences in theamplitudes of the shifts obtained at PH with orwithout PL. Figure 9 shows representative data fromone subject. Three repetitions of each condition (PL
alone and PH + PL) are shown for two activator levels.In response to the lower activator level, a shift is seenonly during the presentation of the activator (300–800 ms). In response to the higher level activator, ashift is seen during the presentation of the activator,and the shift continues for approximately 700 msafter the offset of the activator. At both activatorlevels, there appears to be complete overlap in theshifts measured by PL alone and PH + PL.
Similar measurements were made to examine theeffect of PH on PL. As before, none of the subjectsshowed significant differences in the amplitudes ofthe shifts obtained at PL with or without PH. Figure 10
GOODMAN AND KEEFE: Noise-Activated MEM and SFOAE 135

shows representative data from one subject. Threerepetitions of each condition (PL alone and PH + PL)are shown for one activator level. A shift occurs with alatency of approximately 100 ms after the onset ofthe activator. The shift decays into the noise floorwithin 200 ms of activator offset. This time course isconsistent with an MEM reflex. There appears to becomplete overlap in the shifts measured by PL aloneand PH + PL. These overlaps of the measurementssuggest that the joint presentation of PL and PH atthe levels used in the present study did not apprecia-bly alter the MEM or MOC reflex strength.
It was assumed in devising the measurementparadigm that PL would be sensitive to MEM reflexesand not to SFOAEs, and that PH would be sensitive toSFOAEs and processes that modify the strength ofSFOAEs. These assumptions were met most of thetime. In one subject with a low noise floor and strongSFOAEs, the residual at PL showed a shift occurringless than 40 ms after the onset of the activator (notillustrated). This delay is too short to be caused byMEM reflex, suggesting an SFOAE. In other subjects,the residual at PH showed level and phase changesover time courses similar to the time course of theMEM reflex (as measured by PL). This occurred atfH = 1.5 kHz (as in Fig. 6c) as well as at fH = 3.5 kHz(not illustrated). Although the MEM reflex createsa shift in the source sound pressure primarily atlow frequencies, this does not rule out effects onemissions at higher frequencies. However, sucheffects can be differentiated from the noise-activatoreffect on SFOAEs because the longer onset latency ofMEM reflex effects is much longer than SFOAE travel
times. Consistent with observations of Burns et al.(1993) and Whitehead et al. (1991), the presence ofthese shifts measured at 3.5 kHz may indicate MEMreflex effects on SFOAE forward and/or reversetransmission.
Time constant of postactivator shifts
When higher activator levels were used, shifts in PH =3.5 kHz were often seen in the postactivator windowwithout a simultaneous shift in PL (Fig. 6a, b, e). Asdescribed in Results, when the time courses of theseshifts were characterized by a single exponentialfunction, the mean time constant was 516 ms (SD =186 ms, N = 28). This time constant is much too shortto be a Bslow^ efferent effect lasting tens of seconds(Sridhar et al., 1995; Cooper and Guinan, 2003), butis longer than expected for Bfast^ MOC reflexes,which rise and decay on the order of 100 ms(Wiederhold and Kiang, 1970; Sridhar et al., 1995;Guinan, 1996). A somewhat slower efferent effect forDPOAEs was demonstrated by Liberman et al. (1996)in cats and by Kim et al. (2001) in humans, showingdecreases in DPOAE amplitudes during continuousstimulation. Kim et al. used a two-exponentialfunction to fit this decrease and found a short timeconstant of 69 ms and a long time constant of 1510ms. The time constants of shifts in the postactivatorwindow found in the current data set fall betweenthese values.
The magnitudes of the shifts measured in thecurrent study for SFOAEs are similar to thosereported by Kim et al. (2001) for DPOAEs. Note,however, that the magnitudes appear similar onlywhen signal processing differences are taken into
FIG. 9. Representative pilot data from one subject at f H for twonoise activator levels. Results obtained using PH alone (dotted lines)and PH + PL (solid lines) are shown. Three repetitions of eachcondition are shown for two activator levels. f H = 1044 Hz and f L =298 Hz. PH was presented at a level of 37 dB SPL, and PL waspresented at a level of 55 dB SPL. Activators were presented at LA =60 and 72 dB SPL. Activator NW = 1/6 octave.
FIG. 10. Representative pilot data from one subject at f L for onenoise activator level. Results obtained using PL alone (dotted lines)and PL + PH (solid lines) are shown. Three repetitions of eachcondition are shown for LA = 68 dB SPL. Activator NW = 1/6 octave.Probe frequencies and levels were the same as in Figure 9.
136 GOODMAN AND KEEFE: Noise-Activated MEM and SFOAE

account: Kim et al. reported a median decrease of 0.4dB in the DPOAE cubic difference tone. A shift of 0.4dB in a 40-dB SPL SFOAE probe tone would yield a13.5-dB SPL residual using the nonlinear extractiontechnique. Most of the shifts observed in the currentstudy were between 10 and 20 dB SPL.
The results of the present study suggest caution ininterpreting the observed shifts as mediated by theMOC reflex. Liberman et al. (1996) showed in catsthat cochlear changes (1000-ms time constant) per-sisted after complete olivocochlear bundle section,suggesting that it was mediated by an internalcochlear process rather than the MOC reflex. It isunclear whether the shifts observed in the presentstudy are related to the slower shifts observed byLiberman et al. (1996) and Kim et al. (2001).
If the shifts in the present study are related to theslower DPOAE adaptation, they may arise fromintrinsic cochlear factors, such as changes in localchemical concentrations (e.g., K+; ATP, Ca2+) in theorgan of Corti, or the action of nonefferent synapsesbeneath OHCs (Thiers et al., 2002a,b). Adaptation ofstereocilia hair bundles may also play a role in theobserved shifts. Liberman et al. (2004) concludedthat DPOAEs can be produced in response to high-level stimuli without prestin-based OHC motility.Hair bundles typically display both fast (0.1–5 ms)and slow (tens to hundreds of milliseconds) adapta-tion components (Ricci, 2003). Ricci et al. (2002)described an additional slow adaptation componentin turtle auditory hair cells, which they termed theBsag.^ The sag describes hair-bundle adaptation withtime constants of 100–300 ms, an opposite polarity tofast adaptation, and an overshoot relative to originalposition at the end of a depolarizing voltage step.Sags were typically seen after relatively large depola-rizations, suggesting that they might exert an effect inresponse to high-level acoustic stimuli. If such sagsare present in mammalian hair bundle adaptation,they could play a role in the SFOAE shifts describedin this paper. Further study is required to understandthe sources of the shifts measured in the presentstudy.
Group results
The present results differ from those of Guinan et al.(2003), who reported MOC shifts 50 ms after the endof the activator in all ears tested. In a similarfrequency region ( f H = 1.5 kHz), this study showedshifts in the SFOAE without shifts in the low-frequency MEM probe for only 20% of subjects.Several factors may account for this discrepancy.First, Guinan et al. only reported data from subjectswith easily measurable efferent effects, whereas thecurrent study only required that subjects have normal
hearing and normal tympanograms. Second, subjectsin the Guinan et al. study were kept awake (Guinan,personal communication), whereas in the currentstudy, subject state was not explicitly controlled. Ithas been observed that the onset of sleep candecrease the contralateral suppression of transientemissions (Froehlich et al., 1993). However, it seemsunlikely that sleep was a major cause of the lack ofresponses to low-level activators seen in the currentstudy because many subjects remained awakethroughout the testing. Furthermore, the resultsshown in this report (activator of 1/6 octave notchwidth) were obtained at the beginning of recordingsessions, when subjects who did eventually sleepwould still have been awake. Third, the current studymeasured SFOAEs from the peak region of eachsubject’s SFOAE microstructure. Guinan et al. didnot specifically account for microstructure, but didchoose frequencies with large SFOAEs; therefore,this is unlikely to be a major source of difference inthe two studies. In both studies, the probe-tonefrequencies were selected to be distant from sponta-neous emissions. Fourth, a fewer number of averagesand a different detection criterion may have maderesponses more difficult to detect in the currentstudy. Finally, the duration of the activator was muchshorter in the current study than that reported byGuinan et al. (2003) (500 versus 2500 ms). It ispossible that the MOC reflex did not have time tobuild up as large an effect in the current study. Ofthese possibilities, subject selection, number ofaverages, detection criterion, and activator durationseem the most likely causes of the differences inresults.
CONCLUSIONS
A low-frequency (approximately 0.25 kHz) probetone presented simultaneously with a higher frequen-cy SFOAE probe may be an effective method formonitoring MEM reflex while obtaining an SFOAE ata higher probe frequency. Further work should beperformed to assess the sensitivity of the low-frequen-cy probe as a function of probe level. The 3.5-kHzregion appears to be a more sensitive frequencyregion than 1.5 kHz for measuring SFOAE shifts thatare uncontaminated by the MEM reflex. Shifts werepresent in only 3 of 15 subjects at activator levelsbelow 60 dB SPL. At higher levels, the majority ofsubjects showed SFOAE shifts, many of which wereunaccompanied by a simultaneous shift in the low-frequency probe. The source of these shifts isunclear, however, and it may be that intrinsiccochlear factors are responsible rather than MOCefferent reflexes. Until further studies elucidate the
GOODMAN AND KEEFE: Noise-Activated MEM and SFOAE 137
mechanisms of such shifts, it may be helpful toexercise caution in characterizing them as resultingfrom the action of the MOC reflex.
ACKNOWLEDGMENTS
The authors thank John Ellison for assistance with datacollection and Denis Fitzpatrick for writing the datacollection software. This work was supported by NIDCDgrants DC07023, DC03784, DC00013, and DC04662.
REFERENCES
BERLIN CI, HOOD LJ, WEN H, SZABO P, CECOLA RP, RIGBY P, JACKSON
DF. Contralateral suppression of non-linear click-evoked oto-acoustic emissions. Hear. Res. 71:1–11, 1993.
BLOOD IM, GREENBERG HJ. Low-level acoustic reflex thresholds.Audiology 20:244–250, 1981.
BUKI B, WIT HP, AVAN P. Olivocochlear efferent vs. middle-earcontributions to the alteration of otoacoustic emissions bycontralateral noise. Brain Res. 852:140–150, 2000.
BURNS EM, HARRISON W, BULEN JC, KEEFE DH. Voluntary contractionof middle ear muscles: effects on input impedance, energyreflectance, and spontaneous otoacoustic emissions. Hear. Res.67:117–127, 1993.
COLLET L, KEMP DT, VEUILLET E, DUCLAUX R, MOULIN A, MORGON A.Effect of contralateral auditory stimuli on active cochlear micro-mechanical properties in human subjects. Hear. Res. 43:251–262, 1990.
COOPER NP, GUINAN JJ. Separate mechanical processes underliefast and slow effects of medial olivocochlear efferent activity.J. Physiol. 548(1):307–312, 2003.
DALLOS P. Dynamics of the acoustic reflex: phenomenologicalaspects. J. Acoust. Soc. Am. 36:2175–2183, 1964.
DOLAN DF, GUO ME, NUTTALL AL. Frequency-dependent enhance-ment of basilar membrane velocity during olivocochlear bundlestimulation. J. Acoust. Soc. Am. 102:3587–3596, 1997.
FEENEY MP, KEEFE DH, MARRYOTT LP. Contralateral acoustic reflexthreshold for tonal activators using wideband reflectance andadmittance. J. Speech Lang. Hear. Res. 46:128–136, 2003.
FROEHLICH P, COLLET L, VALATX JL. Sleep and active cochlearmicromechanical properties in human subjects. Hear. Res.66(1):1–7, 1993.
GELFAND SA. Essentials in Audiology, 1st ed. Thieme, New York,1997.
GREEN DM, MCGILL WJ. On the equivalence of detection probabil-ities and well-known statistical quantities. Psychol. Rev. 77:294–301, 1970.
GUINAN JJ JR. Changes in stimulus frequency otoacoustic emissionsproduced by two-tone suppression and efferent stimulation incat. In: Dallos P, Geisler C, Matthews J, Ruggero M, Steele C(eds) The Mechanics and Biophysics of Hearing. Springer-Verlag, Madison, WI, pp 170–177, 1990.
GUINAN JJ JR. Physiology of olivocochlear efferents. In: Dallos P,Popper AN, Fay RR (eds) The Cochlea. Springer Verlag, NewYork, pp 435–502, 1996.
GUINAN JJ, GIFFORD ML. Effects of electrical stimulation of efferentolivocochlear neurons on cat auditory-nerve fibers. iii. Tuningcurves and thresholds at cf. Hear. Res. 37:29–45, 1988.
GUINAN JJ, WARR WB, NORRIS BE. Differential olivocochlear projec-tions from lateral vs. medial zones of the superior olivarycomplex. J. Comp. Neurol. 221:358–370, 1983.
GUINAN JJ, BACKUS BC, LILAONITKUL W, AHARONSON V. Medialolivocochlear efferent reflex in humans. Otoacoustic emission(OAE) measurement issues and the advantages of stimulusfrequency OAEs. J. Assoc. Res. Otolaryngol. 4:521–540, 2003.
HOOD LJ, BERLIN CI, HURLEY A, CECOLA RP, BELL B. Contralateralsuppression of transient-evoked otoacoustic emissions inhumans: intensity effects. Hear. Res. 101:113–118, 1996.
HOOD LJ, BERLIN CI, BORDELON J, ROSE K. Patients with auditoryneuropathy/dys-synchrony lack efferent suppression of tran-sient evoked otoacoustic emissions. J. Am. Acad. Audiol.14(6):302–313, 2003.
HUNG IJ, DALLOS P. Study of the acoustic reflex in human beings.I. Dynamic characteristics. J. Acoust. Soc. Am. 52:1168–1180,1973.
KAWASE T, HIDAKA H, TAKASAKA T. Frequency summation observed inthe human acoustic reflex. Hear. Res. 108:37–45, 1997.
KEEFE DH. Double-evoked otoacoustic emissions: I, measurementtheory and nonlinear coherence. J. Acoust. Soc. Am. 103:3489–3498, 1998.
KEEFE DH, LING R. Double-evoked otoacoustic emissions: II,intermittent noise rejection, calibration and ear-canal measure-ments. J. Acoust. Soc. Am. 103:3499–3508, 1998.
KIM DO, DORN PA, NEELY ST, GORGA MP. Adaptation of distor-tion product otoacoustic emission in humans. J. Assoc. Res.Otolaryngol. 2:31–40, 2001.
LIBERMAN MC. Rapid assessment of sound-evoked olivocochlearfeedback: suppression of compound action potentials bycontralateral sound. Hear. Res. 39:47–56, 1989.
LIBERMAN MC, PURIA S, GUINAN, JR JJ. The ipsilaterally evokedolivocochlear reflex causes rapid adaptation of the 2 f1–f2distortion product otoacoustic emission. J. Acoust. Soc. Am.99:3572–3583, 1996.
LIBERMAN MC, ZUO J, GUINAN, JR JJ. Otoacoustic emissions withoutsomatic motility: can stereocilia mechanics drive the mamma-lian cochlea? J. Acoust. Soc. Am. 116:1649–1655, 2004.
MAISON S, MICHEYL C, COLLET L. Medial olivocochlear efferentsystem in humans studied with amplitude-modulated tones.J. Neurophysiol. 77:1759–1768, 1997.
MAISON S, MICHEYL C, COLLET L. Contralateral frequency-modulatedtones suppress transient-evoked otoacoustic emissions inhumans. Hear. Res. 117:114–118, 1998.
MAISON S, MICHEYL C, COLLET L. Sinusoidal amplitude modulationalters contralateral noise suppression of evoked otoacousticemissions in humans. Neuroscience 91:133–138, 1999.
MAISON S, MICHEYL C, ANDEOL G, GALLEGO S, COLLET L. Activation ofmedial olivocochlear efferent system in humans: influence ofstimulus bandwidth. Hear. Res. 140:111–125, 2000.
MARGOLIS R, POPELKA G. Loudness and the acoustical reflex.J. Acoust. Soc. Am. 58:1330–1332, 1999.
MOLLER A. Acoustic reflex in man. J. Acoust. Soc. Am. 34:1524–1534, 1962.
MOLLER A. Auditory Physiology. Academic Press, New York, 1983.MOTT JB, NORTON SJ, NEELY ST, WARR WB. Changes in spontaneous
otoacoustic emissions produced by acoustic stimulation of thecontralateral ear. Hear. Res. 38:229–242, 1989.
MOUNTAIN DC. Changes in endolymphatic potential and crossedolivocochlear bundle stimulation alter cochlear mechanics.Science 210:71–72, 1980.
MULLER-WEHLAU M, MAUERMANN M, DAU T, KOLLMEIER B. The effectsof neural synchronization and peripheral compression on theacoustic-reflex threshold. J. Acoust. Soc. Am. 117:3016–3027,2005.
MURUGASU E, RUSSELL IJ. The effect of efferent stimulation onbasilar membrane displacement in the basal turn of the guineapig cochlea. J. Neurosci. 16:325–332, 1996.
NEUMANN J, UPPENKAMP S, KOLLMEIER B. Detection of the acousticreflex below 80 dB HL. Audiol. Neuro-otol. 1:359–369, 1996.
138 GOODMAN AND KEEFE: Noise-Activated MEM and SFOAE

OPPENHEIM AV, SCHAFER RW. Discrete-Time Signal Processing( 1sted. Prentice Hall, New Jersey, 1989.
RELKIN EM, STERNS A, PRIEVE BA, WOODS CI. Physiological mecha-nisms of onset adaptation and contralateral suppression ofdpoaes in the rat. J. Assoc. Res. Otolaryngol. 6:119–135, 2005.
RICCI A. Active hair bundle movements and the cochlear amplifier.J. Am. Acad. Audiol. 14:325–338, 2003.
RICCI AJ, CRAWFORD AC, FETTIPLACE R. Mechanisms of active hairbundle motion in auditory hair cells. J. Neurosci. 22:44–52,2002.
ROBERTSON D, GUMMER M. Physiological and morphological charac-terization of efferent neurons in the guinea pig cochlea. Hear.Res. 20:63–77, 1985.
SCHAIRER KS, FITZPATRICK D, KEEFE DH. Input–output functions forstimulus-frequency otoacoustic emissions in normal-hearingadult ears. J. Acoust. Soc. Am. 114:944–966, 2003.
SESTERHENN G, BREUNINGER H. The acoustic reflex at low sensationlevels. Audiology 15:523–533, 1976.
SHERA CA, GUINAN JJ JR. Evoked otoacoustic emissions arise byfundamentally different mechanisms: a taxonomy for mamma-lian oaes. J. Acoust. Soc. Am. 105:782–798, 1999.
SHERA CA, GUINAN JJ JR. Stimulus-frequency-emission group delay: atest of coherent reflection filtering and a window on cochleartuning. J. Acoust. Soc. Am. 113:2762–2772, 2003.
SIEGEL JH, KIM DO. Efferent control of cochlear mechanics?Olivocochlear bundle stimulation affects cochlear biomechan-ical non-linearity. Hear. Res. 6:172–182, 1982.
SIMMONS FB. Post-tetanic potentiation in the middle-ear-muscleacoustic reflex. J. Acoust. Soc. Am. 32:1589–1591, 1960.
SRIDHAR TS, LIBERMAN MC, BROWN MC, SEWELL WF. A novelcholinergic slow effect of olivocochlear stimulation on cochlearpotentials in the guinea pig. J. Neurosci. 15:3667–3678, 1995.
STELMACHOWICZ PG, GORGA MP. Investigation of frequency specificityof acoustic reflex facilitation. Audiology 22:128–135, 1983.
TAVARTKILADZE GA, FROLENKOV GI, ARTAMASOV SV. Ipsilateral suppres-sion of transient evoked otoacoustic emission: the role of the
medial olivocochlear system. Acta Oto-laryngol. 116:213–218,1996.
THIERS FA, BURGESS BJ, NADOL JB JR. Axodendritic and dendroden-dritic synapses within outer spiral bundles in a human. Hear.Res. 164:97–104, 2002a.
THIERS FA, BURGESS BJ, NADOL JB. Reciprocal innervation of outerhair cells in a human infant. J. Assoc. Res. Otolaryngol. 3:269–278, 2002b.
THORNTON N. Frequency analysis of the contralateral suppression ofevoked otoacoustic emissions by narrow-band noise. Br. J.Audiol. 27:281–289, 1993.
VELENOVSKY D, GLATTKE T. The effect of noise bandwidth on thecontralateral suppression of transient evoked otoacousticemissions. Hear. Res. 164:39–48, 2002.
VEUILLET E, COLLET L, DUCLAUX R. Effect of contralateral acousticstimulation on active cochlear micromechanical propertiesin human subjects: dependence on stimulus variables. J.Neurophysiol. 65:724–735, 1991.
VEUILLET E, COLLET L, MORGON A. Differential effects of ear-canalpressure and contralateral acoustic stimulation on evokedotoacoustic emissions in humans. Hear. Res. 61:47–55, 1992.
WARR WB (1992) Organization of olivocochlear efferent systemsin mammals. Mammalian Auditory Pathway: Neuroanatomy,Springer Handbook of Auditory Research. Springer Verlag,New York, pp 410–448.
WHITEHEAD ML, MARTIN GK, LONSBURY-MARTIN BL. Effects of thecrossed acoustic reflex on distortion-product otoacoustic emis-sions in awake rabbits. Hear. Res. 51:55–72, 1991.
WIEDERHOLD ML, KIANG NYS. Effects of electrical stimulation of thecrossed olivocochlear bundle on single auditory-nerve fibers inthe cat. J. Acoust. Soc. Am. 48:950–965, 1970.
WILSON RH, MCBRIDE LM. Threshold and growth of the acousticreflex. J. Acoust. Soc. Am. 631147–154, 1978.
ZWEIG G, SHERA CA. The origin of periodicity in the spectrum ofevoked otoacoustic emissions. J. Acoust. Soc. Am. 98:2018–2047, 1995.
GOODMAN AND KEEFE: Noise-Activated MEM and SFOAE 139