SIMULTANEOUS INCREASING OF THERMAL CONVERSIO N …
8
HEFAT2012 9 th International Conference on Heat Transfer, Fluid Mechanics and Thermodynamics 16 – 18 July 2012 Malta SIMULTANEOUS INCREASING OF THERMAL CONVERSION EFFICIENCY AND BMEP WHILE REDUCING EMISSIONS Victor GHEORGHIU* Department of Mechanical Engineering, Hamburg University of Applied Sciences, Germany, E-mail: [email protected] ABSTRACT The Downsizing of internal combustion engines (ICE) is al- ready recognized as a very suitable method for the concurrent enhancement of the indicated fuel conversion efficiency (IFCE) and the break mean effective pressure (BMEP) while also decreasing the CO 2 and NO x emissions [1], [2]. The Ultra-Downsizing concept was introduced in [3] as a still higher development stage of ICE and implemented by means of real Atkinson cycles, using asymmetrical crank mechanisms, combined with a very intensive multistage high- pressure turbocharging with intensive intercooling. This allows an increase of ICE performance while keeping the thermal and mechanical strain strength of engine components within the current usual limits. The investigations from [3] were carried out using the simu- lation tool BOOST (AVL Co). The three-stage turbocharging with intensive intercooling used in this process and the release of heat during combustion are controlled by numerous parame- ters. As a consequence, it is very difficult to harmonize them in order to optimize concurrently IFCE, BMEP and emissions. For this reason, the ideal V,p,T-model presented in [4] has been revised, improved and adapted to better meet the BOOST simu- lations. With help of this new, ideal V,p,T-model, it is possible to evaluate adequately the potential for improving the perfor- mance of Ultra-Downsizing. INTRODUCTION ICE downsizing is the simultaneous reduction of the dis- placed volume (usually by reducing the number of cylinders) while increasing the indicated mean pressure (IMEP) by means of turbocharging [1], [2]. This allows the preservation of power and torque performance while decreasing engine size. The result is that a) mechanical and thermal losses are reduced, b) the engine becomes lighter, leading to a drop in the overall weight of the vehicle, and c) the engine operates for a longer period of time within its optimum fuel consumption zone. The advantages offered by a) and b) hold true even for ICEs used in hybrid propulsion systems, while the advantage c) is already a feature of the full-hybrid vehicles. The level of downsizing determines the strength of thermal and mechanical strains of the engine components. In order to avoid exceeding the usual limits, one can reduce either the boost pressure or the volumetric compression ratio (VCR) accordingly. However, this prevents one from reaching the full potential of downsizing, while the IFCE and IMEP remain at a low level. The current ICEs have symmetrical (i.e. classical) crank mechanisms (i.e. with compression and expansion strokes of equal length) and follow the Seiliger (i.e. classical) thermody- namical cycles. Implementing real [3 Atkinson cycles require unequal strokes with a shorter compression stroke, which leads to a higher IFCE ]. Atkinson cycles have been used so far mostly with symmetrical crank mechanisms, where the intake valves are closed very late in the cycle [4]. Thus, a part of the charge sucked into the cylinder is pushed back into the intake pipes and the effective compression stroke is decreased. This quasi [4 implementation of Atkinson cycles shows no noticeable improvements of the IFCE and, hence, it will not be discussed in the course of this paper (see ] for details). Real Atkinson cycles can be implemented only with the help of asymmetrical [3 crank mechanisms. This allows to use concurrent very high boost pressures (to increase the IMEP) and higher VCR (to enhance the IFCE) and to set them much more independently of each other compared to Seiliger cycles ], [4]. Because an important part of the fresh charge compres- sion takes place beyond the cylinder, the high compressed fresh charge can be cooled intensively before it is sucked into the cylinder. The moderate compression occurring inside the cylin- der (i.e. with relative lower VCR) leads to lower temperature peaks during the combustion process and, consequently, to fewer NO x emissions. This approach has already been shown to work in several previous theoretical investigations based on the ideal [4 Seiliger and Atkinson cycles ]. These investigations did not take into consideration the effect of heat exchange and frictional losses on the cycle in order to make it easier to check the solution and to draw a comparison between the Seiliger and Atkinson cy- cles. The IFCE and IMEP results achieved by using this method
Transcript of SIMULTANEOUS INCREASING OF THERMAL CONVERSIO N …

HEFAT2012 9th International Conference on Heat Transfer, Fluid Mechanics and Thermodynamics
16 – 18 July 2012
Malta
SIMULTANEOUS INCREASING OF THERMAL CONVERSION EFFICIENCY AND
BMEP WHILE REDUCING EMISSIONS
Victor GHEORGHIU* Department of Mechanical Engineering,
Hamburg University of Applied Sciences, Germany, E-mail: [email protected]
ABSTRACT The Downsizing of internal combustion engines (ICE) is al-
ready recognized as a very suitable method for the concurrent enhancement of the indicated fuel conversion efficiency (IFCE) and the break mean effective pressure (BMEP) while also decreasing the CO2 and NOx emissions [1], [2].
The Ultra-Downsizing concept was introduced in [3] as a still higher development stage of ICE and implemented by means of real Atkinson cycles, using asymmetrical crank mechanisms, combined with a very intensive multistage high-pressure turbocharging with intensive intercooling. This allows an increase of ICE performance while keeping the thermal and mechanical strain strength of engine components within the current usual limits.
The investigations from [3] were carried out using the simu-lation tool BOOST (AVL Co). The three-stage turbocharging with intensive intercooling used in this process and the release of heat during combustion are controlled by numerous parame-ters. As a consequence, it is very difficult to harmonize them in order to optimize concurrently IFCE, BMEP and emissions. For this reason, the ideal V,p,T-model presented in [4] has been revised, improved and adapted to better meet the BOOST simu-lations. With help of this new, ideal V,p,T-model, it is possible to evaluate adequately the potential for improving the perfor-mance of Ultra-Downsizing.
INTRODUCTION
ICE downsizing is the simultaneous reduction of the dis-placed volume (usually by reducing the number of cylinders) while increasing the indicated mean pressure (IMEP) by means of turbocharging [1], [2]. This allows the preservation of power and torque performance while decreasing engine size. The result is that a) mechanical and thermal losses are reduced, b) the engine becomes lighter, leading to a drop in the overall weight of the vehicle, and c) the engine operates for a longer period of time within its optimum fuel consumption zone. The advantages offered by a) and b) hold true even for ICEs used in hybrid propulsion systems, while the advantage c) is already a feature of the full-hybrid vehicles.
The level of downsizing determines the strength of thermal and mechanical strains of the engine components. In order to avoid exceeding the usual limits, one can reduce either the boost pressure or the volumetric compression ratio (VCR) accordingly. However, this prevents one from reaching the full potential of downsizing, while the IFCE and IMEP remain at a low level.
The current ICEs have symmetrical (i.e. classical) crank mechanisms (i.e. with compression and expansion strokes of equal length) and follow the Seiliger (i.e. classical) thermody-namical cycles. Implementing real
[3
Atkinson cycles require unequal strokes with a shorter compression stroke, which leads to a higher IFCE ]. Atkinson cycles have been used so far mostly with symmetrical crank mechanisms, where the intake valves are closed very late in the cycle [4]. Thus, a part of the charge sucked into the cylinder is pushed back into the intake pipes and the effective compression stroke is decreased. This quasi
[4
implementation of Atkinson cycles shows no noticeable improvements of the IFCE and, hence, it will not be discussed in the course of this paper (see ] for details).
Real Atkinson cycles can be implemented only with the help of asymmetrical
[3
crank mechanisms. This allows to use concurrent very high boost pressures (to increase the IMEP) and higher VCR (to enhance the IFCE) and to set them much more independently of each other compared to Seiliger cycles
], [4]. Because an important part of the fresh charge compres-sion takes place beyond the cylinder, the high compressed fresh charge can be cooled intensively before it is sucked into the cylinder. The moderate compression occurring inside the cylin-der (i.e. with relative lower VCR) leads to lower temperature peaks during the combustion process and, consequently, to fewer NOx emissions.
This approach has already been shown to work in several previous theoretical investigations based on the ideal
[4 Seiliger
and Atkinson cycles ]. These investigations did not take into consideration the effect of heat exchange and frictional losses on the cycle in order to make it easier to check the solution and to draw a comparison between the Seiliger and Atkinson cy-cles. The IFCE and IMEP results achieved by using this method

are therefore unrealistically high and serve only as a general indication [4].
The paper [3] extends the previous investigations from [4] to real
The turbochargers (TC) are modeled for these investiga-tions in a simple manner, which describes the expansion pro-cess in the turbines (Tx) by means of their discharge coeffi-cients. The air compaction in the compressors occurs up to a maximum pressure ratio, which depends on the available tur-bine output. To be able to simulate cycles featuring very high boost pressures, three intercooled TC are placed in line (three-stage turbocharging, see Fig. 1).
Atkinson cycles by using the simulation tool BOOST (AVL Co). This tool allows to take into consideration the true geometrical sizes of the engine components (cylinder, valves, channels, pipes, manifolds, turbocharger, intercooler, silencer etc.) and the losses caused by friction and heat transfer along the intake and exhaust gas pipes. In addition, the power balance of turbochargers determines the actual boost pressure level of the engine.
Figure 1 BOOST Model of a four cylinder TC engine
Simple number denote pipes, Cx = cylinder, COx = cooler, TCx = turbo-chargers, PLx = plenum, Jx = junctions, CLx = cleaner, SBx = system bounda-
ries, Ex = engine and MPx = measuring points
The asymmetrical crank mechanism used here can realize the classical piston displacements for the Seiliger as well as for the Atkinson cycles with various asymmetries between the compression and expansion strokes. It can also enable the var-iation of VCR (see. Fig. 2).
Figure 2 Relative Displacements of the used Asymmetrical
Crank Mechanism The Atkinson (Atk) cycles are implemented here by varying the parameter g of the crank mechanism used. The dashed curve represents the null position where
a) the expansion and exhaust and b) the intake and compression strokes are identical. VCR, VER, VIR and VXR mean the volumetric compression,
expansion, intake and exhaust ratios.
In the case of supercharged ICE, the number of parameters
which influence the IFCE and BMEP is very high. As a consequence, the effort to achieve combinations of parameters which maximize the performances of the real (by BOOST) ICE cycle becomes much more difficult. For these reasons, ideal models of the V,p,T-Seiliger and -Atkinson cycles have been developed for this purpose (see [4] and Appendix).
Modeling by means of V,p,T-cycles has the advantage of allowing users to generate ideal ICE cycles which model more closely the real cycles than the classic ideal V- and V,p-cycles by observing their mechanical (pressure) and thermal limits. A simple V-cycle (Otto cycle), where the heat is released only in an isochoric manner (i.e. by constant volume), generates unrealistically high levels of maximum pressure and temperature on the cycle. The attempt to limit the maximum pressure level leads to the classic V,p-cycle [5], [6], where the heat is released in an isochoric and isobaric (constant pressure) manner. The V,p-cycles (i.e. classic Seiliger cycles) leads, for example, to very high temperature levels in the case of fully loaded supercharged engines. These levels are completely unrealistic.
In the ideal V,p,T-cycle the heat is partially released isochorically on the 2 – 3v change of states, isobarically on 3v – 3p and isothermally on 3p – 3 (see yellow states noted in bottom part of Fig. 3). The amounts of heat released isochorically and isobarically depend on the targets for maxi-

mum pressure and temperature on the cycle. The theoretical background of this new V,p,T-cycle is presented in detail in the Appendix.
GOALS OF THESE INVESTIGATIONS
To raise the IFCE, most of the working gas expansion should occur within the cylinder. If, however, the expansion process occurs entirely within the cylinder (ideally, a full ex-pansion occurs up to the ambient pressure), no additional boost pressure can be generated.
In order to increase the expansion part within the cylinder, the crank mechanism must provide a higher VER, which makes a long expansion stroke (and, therefore, an engine with a long piston displacement) necessary. However, that leads to high IFCE, but quite low indicated specific power (kW/L) and IMEP of the engine.
In order to increase both the IFCE and the IMEP, the engine must be turbocharged and the ratio between the expansions within the cylinder and within the turbines (i.e. between inter-nal and external expansion) must be optimized. To be able to optimize this ratio (i.e. between internal and external expan-sions) regardless of VCR, an asymmetrical crank mechanism is required by the real Atkinson cycles.
The goal of [3] and also of this paper is to look for the op-timum ratio between internal and external expansion, which allows us to increase the IFCE and BMEP while lowering the CO2 and NOx emissions.
The special goal of this paper is to evaluate the maximum improving potential of the Ultra-Downsizing performances of the cycles simulated in [3] by means of the BOOST.
SIMULATION SETTINGS The simulations of the piston displacements presented in
Fig. 2 are carried out using the BOOST model from Fig. 1 and V,p,T ideal model (see Appendix). The parameters and the performance of seven cycles are shown in following figures. Many parameters from all cycles are kept identical in order to make comparison easier.
Most parameters of the BOOST model are selected for a hypothetical engine and are kept unchanged
A simple Vibe function is selected in all BOOST simula-tions in order to model the combustion process. The different positions of the TDC in the Atkinson cycles are compensated by choosing a suitable start of combustion (SOC) so that com-bustion begins in all cycles uniformly at 15°CA before TDC.
for all simulations. This includes all geometrical dimensions (with the exception of the crank mechanism), valve timing, wall temperatures (300 K) and heat transfer coefficients (Re-analogy) of the pipes, as well as efficiencies and pressure losses of the intercoolers (target efficiency = 0.75, target pressure drop = 5 kPa) and friction coefficients in the pipes (0.019). Likewise, the efficiency of the turbochargers (compressor efficiency = 0.75, turbocharger overall efficiency = 0.5), as well as the blow by gap size of the cylinder, frictional characteristic curve of the engine and AFR.
The various simulation parameters are selected with the purpose of obtaining roughly the same maximum cylinder pres-sure in all cycles. In order to reach this state, the discharge coefficients of the three turbines in the BOOST simulations are
varied according to a) the influence of backpressure behind the cylinder (e.g., at the measuring point MP12 for cylinder 1; see Fig. 1) and to b) the boost pressure (e.g., at MP8 for cylinder 1). In order to reach approximately the same expansion rate in all three turbines, their discharge coefficients are set at the same level and compensated with the cross section ratios of the tur-bine output pipes. The discharge coefficient of the third turbine µT3 is the only parameter which was adapted for each cycle to meet the cylinder peak pressure limit, since this sets the other two discharge coefficients µT2 and µT1.
In the ideal V,p,T model (see Appendix), the thermal prop-erties of the working fluid (κc for unburned and κe for burned parts) are kept constant throughout the cycle. The entire fuel mass is added to the cylinder gas mass in the state 3v of the cycle. The mass contribution of the exhaust rest gas part is also taken into consideration. The available heat (from fuel combus-tion) decreases by the amount of heat transferred to cylinder wall. In this case, compression, combustion and expansion can be treated adiabatically. The backpressure behind the cylinder pT (equivalent of the MP12 from the BOOST model) is com-puted by means of energy balance at the turbocharger (WCuC = WTTu).
COMPARISON OF V,P,T AND BOOST SIMULATION RESULTS
In order to be able to compare the simulation results follow-ing parameter are carry over from the BOOST to V,p,T-model: pC, TC, pmax, Tmax, m1, mf, γ, κc, κe, Qwall (see Appendix for their meaning).
The diagrams of cylinder pressure over displacement vol-ume from Fig. 3 show a relative a good concordance for the high pressure part of the cycles. The heat release and heat trans-fer to cylinder wall are responsible for most of the differences. The V,p,T model features an optimal heat release, i.e. the max-imum achievable isochorically and isobarically parts for reach-ing the target values for maximum pressure and temperature on the cycle.
The gas exchange and turbocharging processes used in the V,p,T model are also optimal.
The parameter and performances of the BOOST and V,p,T cycle simulations are shown in Fig. 4.
The IFCE values of the V,p,T model follow the upward movement of VCR and VER values (the VCR and VER values of each g position of the crank shaft are presented in the legend of Fig. 2) principally because of the optimized heat release. The areas of ψ, 1-ψ-θ and θ from the diagram of heat release rates from Fig. 4 explain this tendency.
The residual gas mass (i.e. rest exhaust gas rate per cycle γ) in the V,p,T case is the result of this ideal model. However, when initializing the V,p,T simulations, the model uses the values from BOOST simulations (without iterations).
The differences between the pressure and temperature be-hind cylinder (i.e. in MP12 of the BOOST model, see Fig. 1) show the maximum potential of turbocharging in these operat-ing points.
The maxima of the cylinder pressure and temperature are kept identical in the BOOST and V,p,T simulations.

Figure 3 Cylinder pressure (logarithmic bottom) - displacement
volume (p,V) diagrams for Boost (with valves timing) and V,p,T (dashed curves) for three chosen Cycles
Legend: eo = exhaust open; ec = exhaust close; io = intake open; ic = intake close
Figure 4 Parameters and performances of BOOST and V,p,T
simulations
COMPARISON OF V,P,T WITH CONSTANT MAXIMAL TEMPERATURE AND BOOST SIMULATION RESULTS
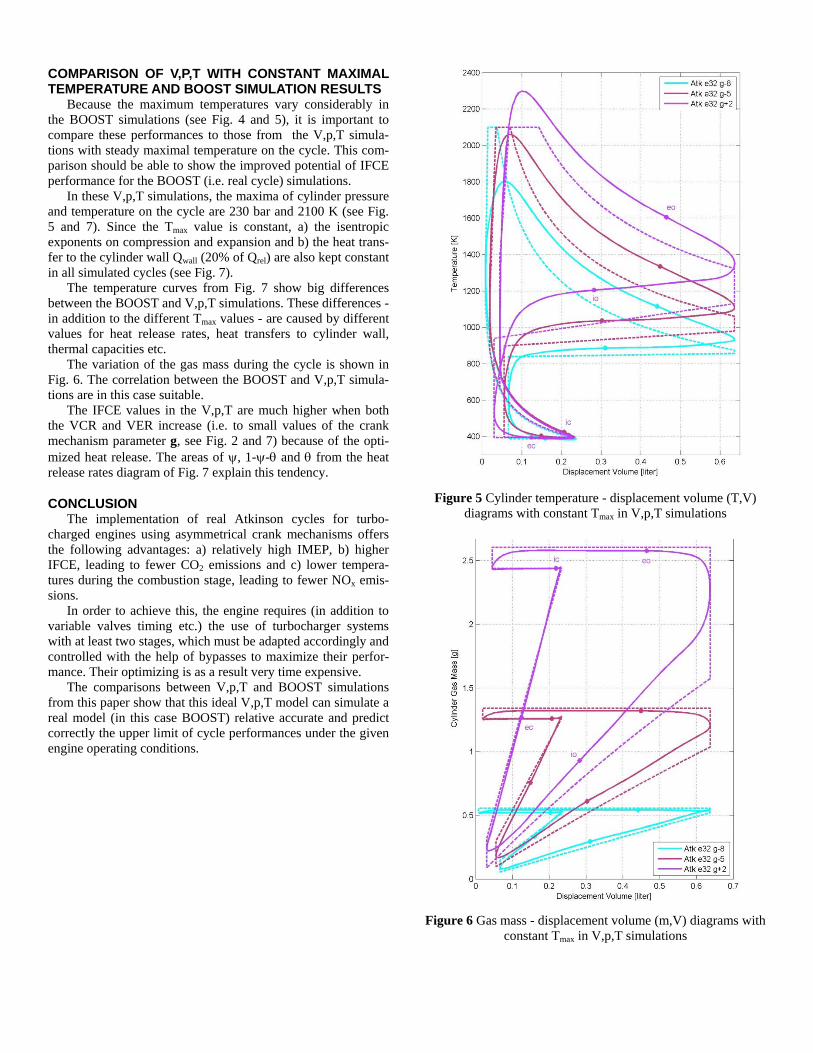
Because the maximum temperatures vary considerably in the BOOST simulations (see Fig. 4 and 5), it is important to compare these performances to those from the V,p,T simula-tions with steady maximal temperature on the cycle. This com-parison should be able to show the improved potential of IFCE performance for the BOOST (i.e. real cycle) simulations.
In these V,p,T simulations, the maxima of cylinder pressure and temperature on the cycle are 230 bar and 2100 K (see Fig. 5 and 7). Since the Tmax value is constant, a) the isentropic exponents on compression and expansion and b) the heat trans-fer to the cylinder wall Qwall (20% of Qrel) are also kept constant in all simulated cycles (see Fig. 7).
The temperature curves from Fig. 7 show big differences between the BOOST and V,p,T simulations. These differences - in addition to the different Tmax values - are caused by different values for heat release rates, heat transfers to cylinder wall, thermal capacities etc.
The variation of the gas mass during the cycle is shown in Fig. 6. The correlation between the BOOST and V,p,T simula-tions are in this case suitable.
The IFCE values in the V,p,T are much higher when both the VCR and VER increase (i.e. to small values of the crank mechanism parameter g, see Fig. 2 and 7) because of the opti-mized heat release. The areas of ψ, 1-ψ-θ and θ from the heat release rates diagram of Fig. 7 explain this tendency.
CONCLUSION The implementation of real Atkinson cycles for turbo-
charged engines using asymmetrical crank mechanisms offers the following advantages: a) relatively high IMEP, b) higher IFCE, leading to fewer CO2 emissions and c) lower tempera-tures during the combustion stage, leading to fewer NOx emis-sions.
In order to achieve this, the engine requires (in addition to variable valves timing etc.) the use of turbocharger systems with at least two stages, which must be adapted accordingly and controlled with the help of bypasses to maximize their perfor-mance. Their optimizing is as a result very time expensive.
The comparisons between V,p,T and BOOST simulations from this paper show that this ideal V,p,T model can simulate a real model (in this case BOOST) relative accurate and predict correctly the upper limit of cycle performances under the given engine operating conditions.
Figure 5 Cylinder temperature - displacement volume (T,V)
diagrams with constant Tmax in V,p,T simulations
Figure 6 Gas mass - displacement volume (m,V) diagrams with
constant Tmax in V,p,T simulations

Figure 7 Parameters and performances of BOOST and V,p,T
simulations
REFERENCES [1] Weinowski, R., Sehr A., Wedowski, S., Heuer, S., Hamm,
T., Tiemann, C., Future downsizing of S.I. engines - poten-tials and limits of 2- and 3-cylinder concepts, Vienna Motor Symposium 2009
[2] Korte, V., Lumsden, G., Fraser, N., Hall, J., 30% higher efficiency at 50% less displacement, MTZ 2010
[3] Gheorghiu, V., Ultra-Downsizing of Internal Combustion Engines: Simultaneous Increasing of Thermal Conversion Efficiency and Power while reducing emissions, HEFAT 2011, Mauritius
[4] Gheorghiu, V., CO2-Emission Reduction by Means of Enhancing the Thermal Conversion Efficiency of ICE Cycles, HEFAT 2010, Antalya, Turkey
[5] Heywood, JB, Internal Combustion Engine Fundamentals, MacGraw-Hill Book Company, 1988
[6] Pischinger, A., Kraβnig, G., Taucar, G., & Sams, Th., Thermodynamic of Internal Combustion Engines (German), Springer-Verlag, Wien New York, 1989

APPENDIX / DEFINITIONS Symbol Meaning Units
ε cV1
V2
Vin
Vcvolumetric compression ratio -
εeV5
V2
Ve
Vcvolumetric expansion ratio -
ε iV1
V7
Vin
Voutvolumetric intake ratio -
ε xV5
V6
Ve
Voutvolumetric exhaust ratio -
Vc V2 V3v cylinder volume at end of compression m3
cylinder volume at end ofexpansionVe V4 V5 Vmax m3
Vout V6 V7 cylinder volume at end of emptying m3
Vdisp Vmax 1 min 1εe
1ε x,
−
⋅ cylinder displacement m3
pmax p3v p3p maximal pressure on cycle Pa
Tmax T3p T3 maximal temperature on cycle K
p1 pC cylinder pressure in state 1 Pa
m1 cylinder gas mass in state 1 kg
T1p1 V1⋅
m1 R⋅cylinder temperature in state 1 K
V1 Vmaxε c
εe⋅ cylinder volume in state 1 m3
ma m1ε x 1−
ε x⋅ aspirated charge mass per cycle kg
mmax m1 mf+ maximal gas mas on cycle kg
mf fuel mass per cycle kg
γ exhaust rest gase rate per cycle -
λm1 1 γ−( )⋅
Lst mf⋅air-exces ratio (AFR) -
Lst stoichiometric air requirement ratio kgkg
κc κe, isentropic exponents and
isobaric (p) & isochoric (v) specificheat capacities on compression (c)resp. expansion (e)
-c°p.c c°v.c, J
kg K⋅c°p.e c°v.e,
R ideal gas constant Jkg K⋅
fuel lower heating & vaporisationheat valuesHu Hvap,
Jkg
APPENDIX / FORMULA
Formula for the ideal V,p,T-model
δ
Hu ηV⋅Qwall
mf+
λ Lst⋅
1 γ−
ε x
ε x 1−⋅ 1+
c°v.c⋅ T1⋅
ψκc 1−
δ ε c⋅ pC⋅
m1
mmax⋅
pmax
κe 1−
pC
κc 1−ε cκc
⋅−εe
VmaxQvap⋅+
⋅
m2 m1 p2 p1 ε cκc
⋅ V2V1
ε cT2 T1 ε c
κc 1−⋅
m3v mmax m1 11 γ−
λ Lst⋅
ε x 1−
ε x⋅+
⋅
p3v pmax V3v V2 T3vm1
mmax
pmax
pC⋅
T1
ε c⋅
θ 1 ψ−κe κc 1−( )⋅
κe 1−( ) δ⋅Tmax
T1
m1
mmax
pmax
pC⋅
1ε c⋅−
⋅−
m3p mmax V3p V3vTmax
T3v⋅ T3p T3 Tmax
m3 mmax V3mmax R⋅ Tmax⋅
pmaxexp
θ δ⋅ T1⋅
κc 1−( ) Tmax⋅
⋅
m4 mmax
V4 Vmax p4 p3V3
V4
κe
⋅ T4 T3V3
V4
κe 1−
⋅
WCuC c°p.cma Tu⋅
ηsC⋅
pC
pu
κc 1−
κc
1−
⋅
WTTu ηsT ma mf+( )⋅ c°p.e⋅ TT⋅ 1pu
pT
κe 1−
κe
−
⋅
WCuC WTTu k1 ηTC1 γ− λ Lst⋅+
λ Lst⋅⋅
κe
κe 1−⋅
κc 1−
κc⋅
1Tu⋅
pT p4pu
p4
κe 1−
κe1
k1 T4⋅
pC
pu
κc 1−
κc
1−
⋅+
κe
κe 1−
⋅

APPENDIX / DEFINITIONS Symbol Meaning Units
Qrel mf Hu⋅ cylinder released heat J
ηb released fuel energy completeness -
Qwall heat transfer to cylinder wall J
Qdisp Qrel ηb⋅ Qwall+ disposable heat on cycle J
pC charge pressure after cooler Pa
TC charge temperature after cooler K
pT pressure before turbine Pa
TT temperature before turbine K
pu ambient pressure Pa
relative released heat asmeasure of engine load δ
Qdisp
mmax c°v.c⋅ T1⋅-
Qdisp.v isochoric part of Qdisp J
ψQdisp.v
Qdispisochoric released heat fraction -
Qdisp.t isothermal part of Qdisp J
θQdisp.t
Qdispisothermal released heat fraction -
1 ψ− θ−Qdisp.p
Qdispisobaric released heat fraction -
Qdisp.p isobaric part of Qdisp J
indicated fuel conversion efficiencyIFCEη i
Wcycle−
Qrel-
Wcycle work on the all cycle J
piWcycle−
Vdispindicated mean pressure IMEP Pa
isentropic efficiency of compressor,turbine and turbochargerηsC ηsT, ηTC, -
WTTu turbine work between pT and pu J
WCuC compressor work between pu and pC J
APPENDIX / FORMULA
V5 Vmax p5 pT
T5 T4p5
p4
κe 1−
κe
⋅ TT T5 m5p5 V5⋅
R T5⋅
p6 p5 V6Vmax
ε xT6 2 T5⋅ T4−
m6p6 V6⋅
R T6⋅γ
m6
m1
WcyclepC Vmax⋅
κc 1−
ε c
εe⋅ ε c
κc 1−1−
⋅
pmax Vmax⋅
εe+
mmax−( ) R⋅ Tmax⋅ θ δ⋅mmax R⋅ T1⋅
κc 1−⋅−+
...
mmax R⋅ Tmax⋅
κe 1−
V3
Vmax
κe 1−
1−
⋅+
...
pT Vmax⋅ε x 1−
ε x⋅ pC Vmax⋅
ε c
εe
1ε x
−
⋅−+
...
ABBREVIATIONS AFR Air-Fuel Ratio BMEP Break Mean Pressure CA Crank Angle EOP Engine Operating Point ICE Internal Combustion Engine IFCE Indicated Fuel Conversion Efficiency IMEP Indicated Mean Pressure MPx Measuring Point x in BOOST model RE4T Relative Energy for Turbo charging SOC Start of Combustion TC Turbocharger Tx Turbine x (here x = 1..3) VCR Volumetric Compression Ratio VER Volumetric Expansion Ratio VIR Volumetric Intake Ratio VXR Volumetric Exhaust Ratio V,p,T Model of an ideal cycle where the heat is partially released isochorically, isobarically and isothermally eo Exhaust Valve Open ec Exhaust Valve Close io Intake Valve Open ic Intake Valve Close µTx Discharge Coefficient of Turbine x
![SIMULTANEOUS EQUATIONS (QUADRATIC) SOLUTIONS · 2017. 12. 19. · SIMULTANEOUS EQUATIONS SOLUTIONS (QUADRATIC) GCSE (+ IGCSE) EXAM QUESTION PRACTICE 1. [Edexcel, 2006] Simultaneous](https://static.fdocuments.us/doc/165x107/61216357d4e8c92bd4719ae9/simultaneous-equations-quadratic-solutions-2017-12-19-simultaneous-equations.jpg)