Simultaneous Detection of Copy Number and Copy-Neutral LOH Using a
8
Abstract The current SurePrint G3 Human Comparative Genomic Hybridization (CGH) platform has been extended to include a set of Single Nucleotide Polymorphism (SNP) probes on the same microarray. This allows for the simultaneous, high-resolution detection of copy number and copy-neutral variations and eliminates the need to run two separate microarray experiments. The same straightforward Agilent CGH workflow is used to prepare the samples for hybridization to the new SurePrint G3 Human CGH+SNP microarrays. Restriction digestion of genomic DNA allows genotyping of SNPs located in the enzymes’ recognition sites. After labeling and hybridization, CGH+SNP microarray data are analyzed using novel algorithms contained within Agilent’s Genomic Workbench software. In this application note, we measure SNP genotypes to discover copy-neutral lack or loss of heterozygosity (LOH), as well as copy number variations, to discover cytogenetic abnormalities associated with examples of known syndromes. We conclude that simultaneous high-quality, high- resolution copy number and LOH information can be obtained with the new SurePrint G3 Human CGH+SNP microarrays, available in various catalog and custom formats. Simultaneous Detection of Copy Number and Copy-Neutral LOH Using a Single Microarray Authors Paula Costa Jayati Ghosh Shane Giles Anniek De Witte Agilent Technologies, Inc. Santa Clara, CA USA Application Note
Transcript of Simultaneous Detection of Copy Number and Copy-Neutral LOH Using a
Abstract
The current SurePrint G3 Human Comparative Genomic Hybridization (CGH) platform has been extended to include a set of Single Nucleotide Polymorphism (SNP) probes on the same microarray. This allows for the simultaneous, high-resolution detection of copy number and copy-neutral variations and eliminates the need to run two separate microarray experiments. The same straightforward Agilent CGH workfl ow is used to prepare the samples for hybridization to the new SurePrint G3 Human CGH+SNP microarrays. Restriction digestion of genomic DNA allows genotyping of SNPs located in the enzymes’ recognition sites. After labeling and hybridization, CGH+SNP microarray data are analyzed using novel algorithms contained within Agilent’s Genomic Workbench software. In this application note, we measure SNP genotypes to discover copy-neutral lack or loss of heterozygosity (LOH), as well as copy number variations, to discover cytogenetic abnormalities associated with examples of known syndromes. We conclude that simultaneous high-quality, high-resolution copy number and LOH information can be obtained with the new SurePrint G3 Human CGH+SNP microarrays, available in various catalog and custom formats.
Simultaneous Detection of Copy
Number and Copy-Neutral LOH
Using a Single Microarray
Authors
Paula CostaJayati GhoshShane GilesAnniek De Witte
Agilent Technologies, Inc.
Santa Clara, CA USA
Application Note

2
Introduction
Accurate determination of copy number aberrations is important for understanding developmental disorders. Since array CGH was fi rst described in 1998 by Pinkel et al.1, many technical improvements have been made resulting in higher specifi city and sensitivity. Recently, oligo microarrays, which have a 1000-fold greater resolution than karyotypes, have revolutionized the fi eld of cytogenetics. Array CGH is now commonly used for investigating genomic DNA aberrations associated with various diseases in many cytogenetic labs.
Until recently, Agilent’s SurePrint G3 CGH Microarrays have provided ultra-high resolution copy number analysis but could not detect copy-neutral aberrations such as LOH or uniparental disomy (UPD). In LOH events, several mechanisms can be responsible for the loss of the wild-type allele at a heterozygous locus and the unmasking of
a recessive mutant allele.2 UPD occurs when both members of a chromosome pair or segments of a chromosome pair are inherited from one parent and no chromosomes are inherited from the other parent.3 If the chromosomes involved are imprinted such that the genes on these chromosomes are monoallelically active (i.e. only the maternal or paternal allele of the pair is expressed), the resulting phenotype will be abnormal. We now have developed a novel approach that provides high-resolution copy number analysis and LOH or UPD data on a single microarray. A subset of probes is used to measure SNPs in parallel with copy number by performing the standard CGH enzymatic workfl ow. In addition to high- quality copy number aberration discovery, the new Agilent SurePrint G3 CGH+SNP Microarrays also enable detection of copy-neutral LOH, UPD, consanguinity, and parental or sample origin in genetic studies.
Table 1. SurePrint G3 CGH+SNP 2x400K and 4x180K microarray specifi cations
Format 2x400K 4x180KDesign ID 028081 029830Total features 420,288 180,880Control feature count 6,700 8,121Distinct biological CGH probes 292,097 110,712Distinct biological SNP probes 118,955 59,647Distinct SNPs 64,484* 59,647Replicated probes (5x) 600 600Genome build hg19 hg19Non-unique probes 506 1,467Homology fi ltered probes 3,950 2,931Intragenic probes 210,298 49,963Intergenic probes 81,799 60,749Exonic probes 113,770 6,574Median probe spacing bp
- intragenic 4,453 21,264- intergenic 15,875 27,323- overall 7,170 25,288
Average probe spacing bp- overall 10,257 27,066
Refseq coverage (26,855)- at least one probe 24,639 16,867- at least one probe (+/-5kb) 25,245 20,847
*92% of SNPs use two SNP probes per SNP
3
Methods
Microarray design
The catalog 2x400K SurePrint G3 CGH+SNP array used in this study contains approximately 300,000 CGH probes and 120,000 SNP probes. The genotypes are measured by using two SNP probes per SNP and result in ~5–10 Mb resolution for LOH detection across the entire genome. The CGH probes are gene- and exon-biased (Table 1). The catalog 4x180K SurePrint G3 CGH+SNP array contains approximately 120,000 CGH probes and 60,000 SNP probes. The genotypes on this array are measured by using one SNP probe per SNP and also result in ~5–10 Mb resolution for LOH detection across the entire genome. The CGH probes consist of the entire ISCA (International Standards for Cytogenomic Arrays) Consortium 8x60K version probe set and an additional 60,000 backbone probes. The ISCA 8x60K has an even backbone probe coverage of 60 Kb and high-density coverage of ~500 targeted regions with the spacing of 5 Kb per probe or at least 20 probes per gene region. These targeted regions include telomere and unique centromere FISH clone regions, microdeletion/duplication regions, genes of known haploinsuffi ciency, and X-linked mental retardation regions. Custom SurePrint G3 CGH+SNP microarrays can be readily designed in eArray, a free web-based application, or eArray XD, the desktop version of eArray (Table 2). The eArray database houses more than 28 million CGH probes and probes for approximately 60,000 SNPs.
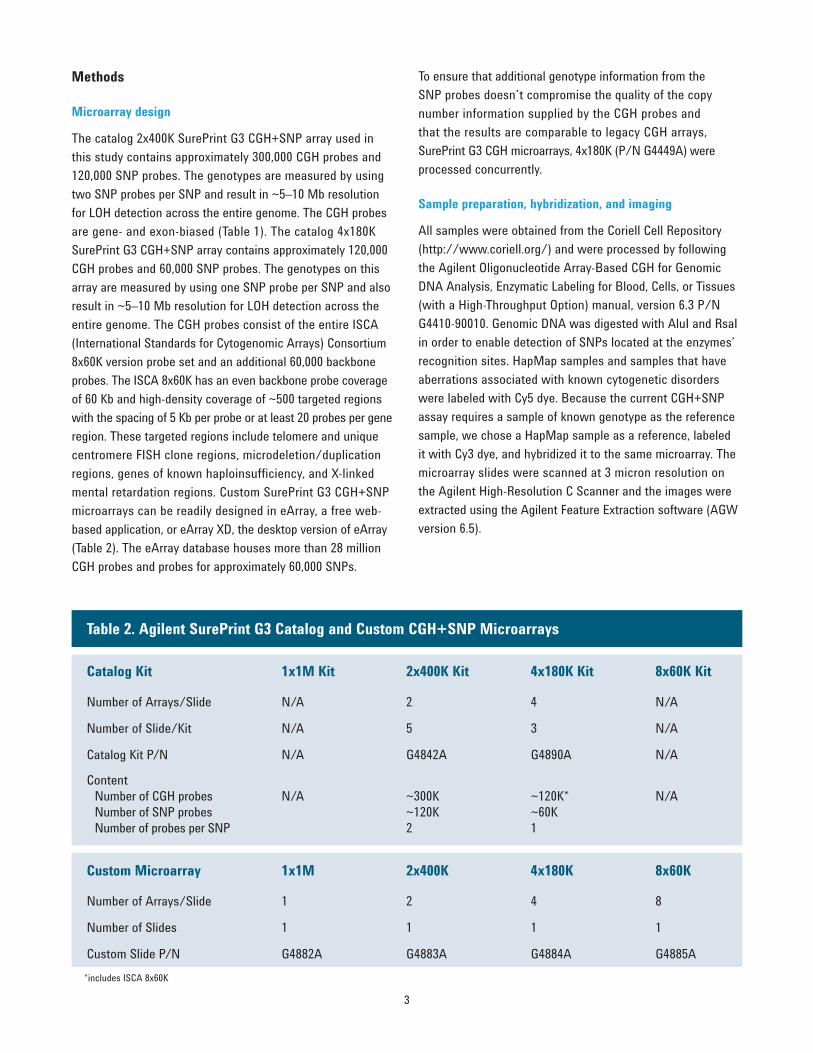
To ensure that additional genotype information from the SNP probes doesn’t compromise the quality of the copy number information supplied by the CGH probes and that the results are comparable to legacy CGH arrays, SurePrint G3 CGH microarrays, 4x180K (P/N G4449A) were processed concurrently.
Sample preparation, hybridization, and imaging
All samples were obtained from the Coriell Cell Repository (http://www.coriell.org/) and were processed by following the Agilent Oligonucleotide Array-Based CGH for Genomic DNA Analysis, Enzymatic Labeling for Blood, Cells, or Tissues (with a High-Throughput Option) manual, version 6.3 P/N G4410-90010. Genomic DNA was digested with AluI and RsaI in order to enable detection of SNPs located at the enzymes’ recognition sites. HapMap samples and samples that have aberrations associated with known cytogenetic disorders were labeled with Cy5 dye. Because the current CGH+SNP assay requires a sample of known genotype as the reference sample, we chose a HapMap sample as a reference, labeled it with Cy3 dye, and hybridized it to the same microarray. The microarray slides were scanned at 3 micron resolution on the Agilent High-Resolution C Scanner and the images were extracted using the Agilent Feature Extraction software (AGW version 6.5).
Table 2. Agilent SurePrint G3 Catalog and Custom CGH+SNP Microarrays
Catalog Kit 1x1M Kit 2x400K Kit 4x180K Kit 8x60K Kit
Number of Arrays/Slide N/A 2 4 N/A
Number of Slide/Kit N/A 5 3 N/A
Catalog Kit P/N N/A G4842A G4890A N/A
ContentNumber of CGH probesNumber of SNP probesNumber of probes per SNP
N/A ~300K~120K2
~120K*~60K1
N/A
Custom Microarray 1x1M 2x400K 4x180K 8x60K
Number of Arrays/Slide 1 2 4 8
Number of Slides 1 1 1 1
Custom Slide P/N G4882A G4883A G4884A G4885A* includes ISCA 8x60K

4
Results
SNP call rate and accuracy
To determine the SNP call rate, defi ned as the fraction of the SNPs called by the algorithm at 95% confi dence, and the SNP call accuracy, several HapMap samples with known genotypes were hybridized against another HapMap sample. In this experiment >95% of SNPs were called at a confi dence level of >95% (Figure 2), with >99% accuracy (Figure 3).
Novel algorithms for measuring total copy number and allele-specifi c copy number
The SNP probes span variant AluI or RsaI restriction enzyme recognition sites and measure the copy number of the uncut allele at those loci. The total copy number of the region encompassing the SNP site is measured by neighboring CGH probes. The copy number of the cut allele can be inferred from the total copy number and the copy number of the uncut allele.
SNP calls are made from the log ratios of the sample probe signal versus a genotyped internal reference, which compensates for labeling and hybridization bias. Since the reference genotype is known, the raw log2 ratios are “reference adjusted” to report absolute allele-specifi c copy numbers for SNP probes. SNPs with zero copies of uncut allele in the reference sample are ignored, and the algorithm subtracts 1 from the log2 ratios of SNPs with one copy in the reference sample. When using eArray to design a custom microarray, and when using one of the supported reference samples (NA12878, NA12891, NA18507, NA18517 or NA18579), the user can choose to avoid SNPs with zero reference copies on the array design. The reference-adjusted log ratios fall into three nearly Gaussian peaks corresponding to the copy numbers of the uncut alleles in the sample, which correspond to the three possible diploid genotypes for the SNPs: AA, AB, or BB (Figure 1).
Regions of copy-neutral LOH or UPD are then located by identifying genomic regions with a statistically signifi cant scarcity of heterozygous SNP calls.
1.2
1
0.8
0.6
0.4
0.2
0-7 -6 -5 -4 -3 -2 -1 0 1
Reference-adjusted Log2 ratio
DataGaussian fit: 0Gaussian fit: 1Gaussian fit: 2
2 uncut alleles: BB
1 uncut allele: AB
0 uncut alleles: AA
NA08687 vs NA12891 Gaussian fit
Figure 1. Reference-adjusted SNP log2 ratio distributions (probability density function). The black line is the distribution of measured log ratios. The cyan, green, and blue lines are 3 different Gaussian fi ts to the population of SNPs with 0 (AA), 1 (AB), and 2 (BB) copies of the uncut allele (A represents the cut allele and B represents the uncut allele).
1
0.9
0.8
0.7
0.6
0.5
0.4
0.3
0.2
0.1
0.0
Call rate
Confidence threshold
Frac
tion
calle
d
0.90 0.91 0.92 0.93 0.94 0.95 0.96 0.97 0.98 0.99 1
NA04592NA06231NA08687NA08785NA09208NA11005NA12740NA20408NA20409NA50122NA12878NA18517
Figure 2. Call rate for 12 samples hybridized against a single HapMap reference sample. More than 95% of SNPs were called at a confi dence level of >95% in all 12 samples. The black vertical lines correspond to p-value thresholds (confi dence levels) of 0.95 (95%) and 0.99 (99%).
1
0.999
0.998
0.997
0.996
0.995
0.994
0.993
0.992
0.991
0.990
Call accuracy
0.90 0.91 0.92 0.93 0.94 0.95 0.96 0.97 0.98 0.99 1Confidence threshold
NA12740NA12878NA18517
Figure 3. Call accuracy for 3 HapMap samples hybridized against a single HapMap reference sample. The call accuracy was >99% in all 3 samples. The black vertical lines correspond to p-value thresholds (confi dence levels) of 0.95 (95%) and 0.99 (99%).
5
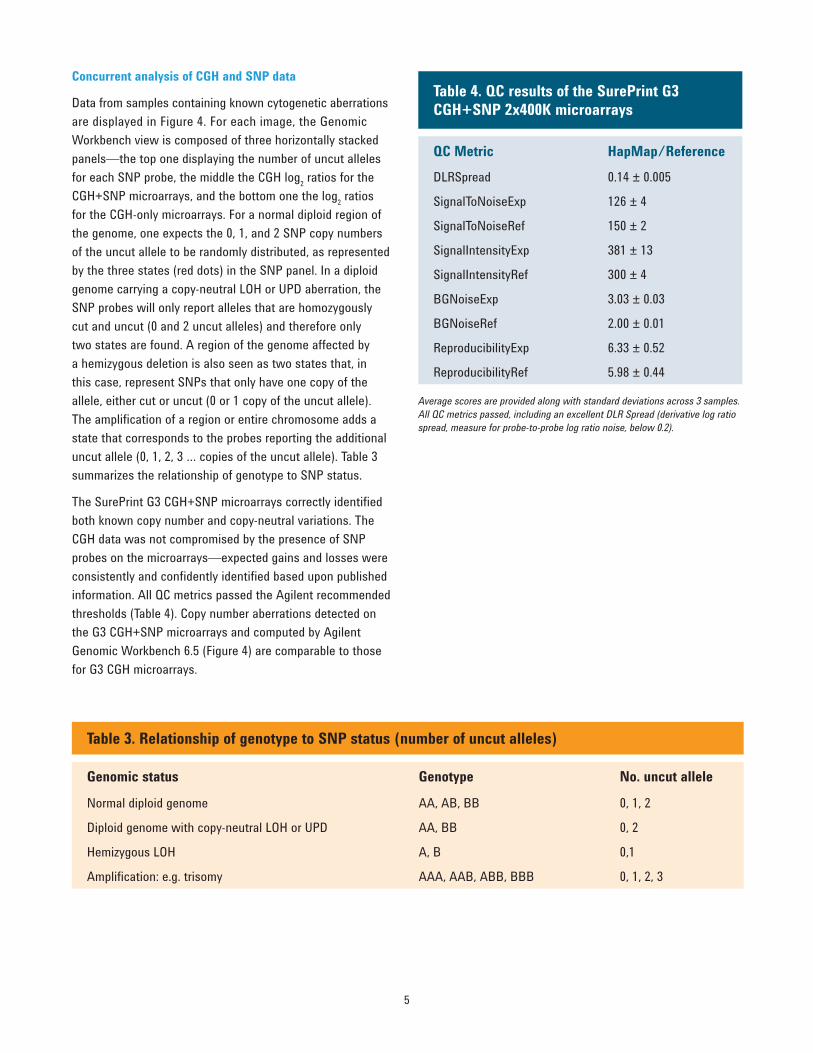
Concurrent analysis of CGH and SNP data
Data from samples containing known cytogenetic aberrations are displayed in Figure 4. For each image, the Genomic Workbench view is composed of three horizontally stacked panels—the top one displaying the number of uncut alleles for each SNP probe, the middle the CGH log2 ratios for the CGH+SNP microarrays, and the bottom one the log2 ratios for the CGH-only microarrays. For a normal diploid region of the genome, one expects the 0, 1, and 2 SNP copy numbers of the uncut allele to be randomly distributed, as represented by the three states (red dots) in the SNP panel. In a diploid genome carrying a copy-neutral LOH or UPD aberration, the SNP probes will only report alleles that are homozygously cut and uncut (0 and 2 uncut alleles) and therefore only two states are found. A region of the genome affected by a hemizygous deletion is also seen as two states that, in this case, represent SNPs that only have one copy of the allele, either cut or uncut (0 or 1 copy of the uncut allele). The amplifi cation of a region or entire chromosome adds a state that corresponds to the probes reporting the additional uncut allele (0, 1, 2, 3 … copies of the uncut allele). Table 3 summarizes the relationship of genotype to SNP status.
The SurePrint G3 CGH+SNP microarrays correctly identifi ed both known copy number and copy-neutral variations. The CGH data was not compromised by the presence of SNP probes on the microarrays—expected gains and losses were consistently and confi dently identifi ed based upon published information. All QC metrics passed the Agilent recommended thresholds (Table 4). Copy number aberrations detected on the G3 CGH+SNP microarrays and computed by Agilent Genomic Workbench 6.5 (Figure 4) are comparable to those for G3 CGH microarrays.
Average scores are provided along with standard deviations across 3 samples. All QC metrics passed, including an excellent DLR Spread (derivative log ratio spread, measure for probe-to-probe log ratio noise, below 0.2).
Table 4. QC results of the SurePrint G3 CGH+SNP 2x400K microarrays
QC Metric HapMap/Reference DLRSpread 0.14 ± 0.005
SignalToNoiseExp 126 ± 4
SignalToNoiseRef 150 ± 2
SignalIntensityExp 381 ± 13
SignalIntensityRef 300 ± 4
BGNoiseExp 3.03 ± 0.03
BGNoiseRef 2.00 ± 0.01
ReproducibilityExp 6.33 ± 0.52
ReproducibilityRef 5.98 ± 0.44
Table 3. Relationship of genotype to SNP status (number of uncut alleles)
Genomic status Genotype No. uncut allele
Normal diploid genome AA, AB, BB 0, 1, 2
Diploid genome with copy-neutral LOH or UPD AA, BB 0, 2
Hemizygous LOH A, B 0,1
Amplifi cation: e.g. trisomy AAA, AAB, ABB, BBB 0, 1, 2, 3

6
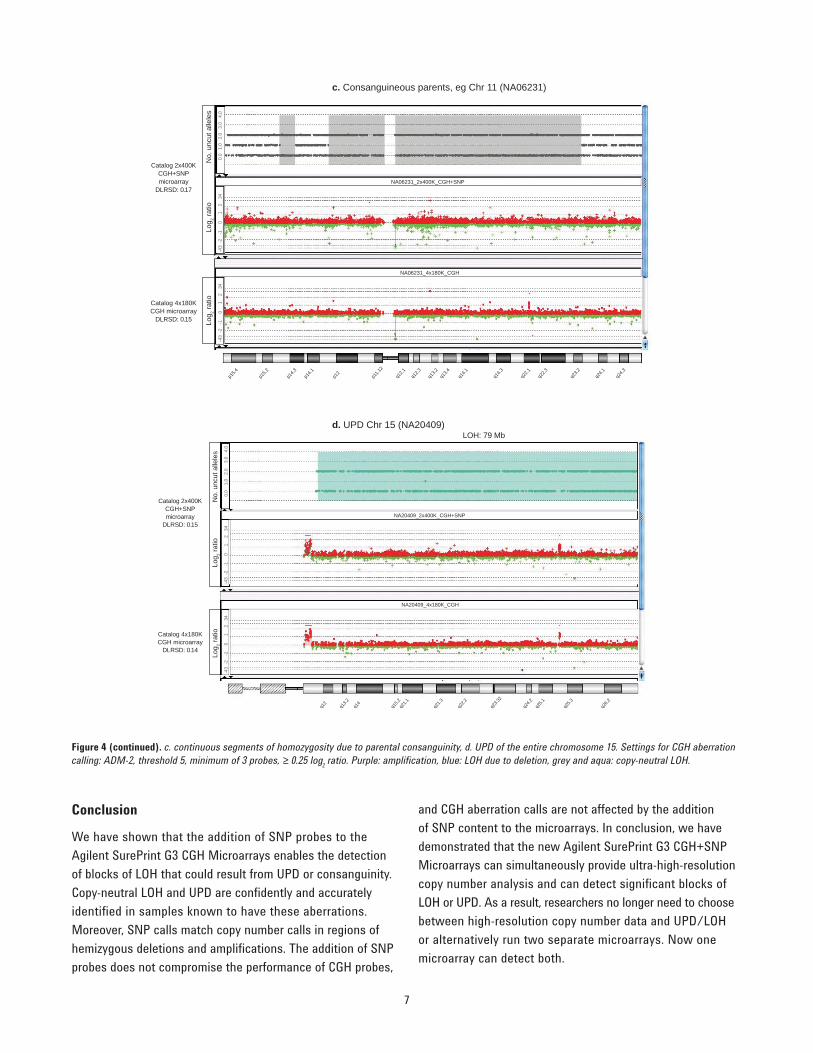
A trisomy of chromosome 21 was identifi ed in one sample (Figure 4a). Several LOH regions as small as ~5 Mb were detected. One sample with a hemizygous deletion was accurately profi led by the CGH and SNP probes (Figure 4b). In one case, extended segments of homozygosity were
NA04592_2x400K_CGH+SNP
NA04592_4x180K_CGH
q21.1
q21.3
q22.1
2
q22.2
Catalog 2x400K CGH+SNP microarray
DLRSD: 0.14
0.0
1.0
2.0
3.0
4.0
-43
-2
-1
0 1
2 34
-43
-2
-1
0 1
2 34
Catalog 4x180K CGH microarray
DLRSD: 0.13
Log 2 r
atio
Log 2 r
atio
No.
unc
ut a
llele
s
NA09208_2x400K_CGH+SNP
NA09208_4x180K_CGH
Catalog 2x400K CGH+SNP microarray
DLRSD: 0.15
Catalog 4x180K CGH microarray
DLRSD: 0.14
p13.2
p12
q12
q21.2
q21.3
2
q22
q23.2
q24.1
q24.3
q25.2
0.
0 1.
0 2.
0 3.
0 4.
0-4
3 -2
-1
0
1 2
34-4
3 -2
-1
0
1 2
34
Log 2 r
atio
Log 2 r
atio
No.
unc
ut a
llele
s
found throughout the genome as a consequence of parental consanguinity (Figure 4c). In an additional case, the UPD observed was associated with an individual known to have genomic aberrations associated with Angelman syndrome (Figure 4d).
Figure 4. Agilent Genomic Workbench view of the SNP data (number of uncut alleles, top panels), the CGH data (log2 ratios, middle panels) for the CGH+SNP arrays, and the CGH data for the CGH-only arrays (log2 ratios, bottom panels) in affected chromosomes: a. trisomy of chromosome 21, b. hemizygous deletion in chromosome 17 (continued on opposite page).
a. Trisomy Chr 21 (NA04592)Ampli cation: 37 Mb
b. Hemizygous deletion Chr 17 (NA09208)LOH: 5.8 Mb
7
NA06231_2x400K_CGH+SNP
NA06231_4x180K_CGH
Catalog 2x400K CGH+SNP microarray
DLRSD: 0.17
Catalog 4x180K CGH microarray
DLRSD: 0.15
p15.4
p15.2
p14.3
p14.1
p12
p11.1
2
q12.1
q12.3
q13.2
q13.4
q14.1
q14.3
q22.1
q22.3
q23.2
q24.1
q24.3
0.
0 1.
0 2.
0 3.
0 4.
0-4
3 -2
-1
0
1 2
34-4
3 -2
-1
0
1 2
34
Log 2 r
atio
Log 2 r
atio
No.
unc
ut a
llele
s
Catalog 2x400K CGH+SNP microarray
DLRSD: 0.15
Catalog 4x180K CGH microarray
DLRSD: 0.14
q12
q13.2
q14
q15.2
q21.1
q21.3
q22.2
q23.3
2
q24.2
q25.1
q25.3
q26.2
NA20409_2x400K_CGH+SNP
NA20409_4x180K_CGH
0.
0 1.
0 2.
0 3.
0 4.
0-4
3 -2
-1
0
1 2
34-4
3 -2
-1
0
1 2
34
Log 2 r
atio
Log 2 r
atio
No.
unc
ut a
llele
s
Conclusion
We have shown that the addition of SNP probes to the Agilent SurePrint G3 CGH Microarrays enables the detection of blocks of LOH that could result from UPD or consanguinity. Copy-neutral LOH and UPD are confi dently and accurately identifi ed in samples known to have these aberrations. Moreover, SNP calls match copy number calls in regions of hemizygous deletions and amplifi cations. The addition of SNP probes does not compromise the performance of CGH probes,
and CGH aberration calls are not affected by the addition of SNP content to the microarrays. In conclusion, we have demonstrated that the new Agilent SurePrint G3 CGH+SNP Microarrays can simultaneously provide ultra-high-resolution copy number analysis and can detect signifi cant blocks of LOH or UPD. As a result, researchers no longer need to choose between high-resolution copy number data and UPD/LOH or alternatively run two separate microarrays. Now one microarray can detect both.
Figure 4 (continued). c. continuous segments of homozygosity due to parental consanguinity, d. UPD of the entire chromosome 15. Settings for CGH aberration calling: ADM-2, threshold 5, minimum of 3 probes, ≥ 0.25 log2 ratio. Purple: amplifi cation, blue: LOH due to deletion, grey and aqua: copy-neutral LOH.
c. Consanguineous parents, eg Chr 11 (NA06231)
d. UPD Chr 15 (NA20409)LOH: 79 Mb

For more information and to learn more:www.agilent.com/genomics
Find an Agilent customer center in your country: www.agilent.com/genomics/contact
U.S. and Canada [email protected]
Asia Pacifi [email protected]
Agilent Technologies shall not be liable for errors contained herein or for incidental or consequential damages in connection with the furnishing, performance, or use of this material.
References
1. Pinkel et al. Nat Genet. 1998;20(2):207–11.
2. Cavanee et al. Nature. 1983;305(5937):779–84.
3. Engel. Am J Med Genet. 1980;6(2):137–43.
Required Agilent CGH Processing Components
Description Part Number
SureTag Complete DNA Labeling Kit 5190-4240
Human Cot-1 DNA 5190-3393
Agilent Oligo aCGH Hybridization Kit (25) or (100)
5188-5220 or 5188-5380
Agilent Oligo aCGH Wash Buffer 1 and 2 Set
5188-5226
Hybridization Chamber, stainless G2534A
Hybridization Chamber Gasket Slides Varies by array format and quantity
Hybridization Oven G2545A
Hybridization Oven Rotator Rack G2530-60029
SureScan Microarray Scanner G4900DA
Agilent CytoGenomics G1662AA–G1667AA
For Research Use Only. Not for use in diagnostic procedures.
© Agilent Technologies, Inc. 2011, 2015 Printed in the USA, December 18, 2015 5990-6274ENPR7000-0064