Simulator: A Preliminary Study Rocío Prado Vega Eye ... · Netherlands, 3 Rotterdam Eye Hospital...
14
Obstacle Avoidance, Visual Detection Performance, and Eye-Scanning Behavior of Glaucoma Patients in a Driving Simulator: A Preliminary Study Rocío Prado Vega 1 , Peter M. van Leeuwen 1 , Elizabeth Rendón Vélez 1 , Hans G. Lemij 2,3 , Joost C. F. de Winter 1* 1 Department of BioMechanical Engineering, Delft University of Technology, Delft, The Netherlands, 2 Rotterdam Ophthalmic Institute (ROI), Rotterdam, The Netherlands, 3 Rotterdam Eye Hospital (REH), Rotterdam, The Netherlands Abstract The objective of this study was to evaluate differences in driving performance, visual detection performance, and eye-scanning behavior between glaucoma patients and control participants without glaucoma. Glaucoma patients (n = 23) and control participants (n = 12) completed four 5-min driving sessions in a simulator. The participants were instructed to maintain the car in the right lane of a two-lane highway while their speed was automatically maintained at 100 km/h. Additional tasks per session were: Session 1: none, Session 2: verbalization of projected letters, Session 3: avoidance of static obstacles, and Session 4: combined letter verbalization and avoidance of static obstacles. Eye-scanning behavior was recorded with an eye-tracker. Results showed no statistically significant differences between patients and control participants for lane keeping, obstacle avoidance, and eye-scanning behavior. Steering activity, number of missed letters, and letter reaction time were significantly higher for glaucoma patients than for control participants. In conclusion, glaucoma patients were able to avoid objects and maintain a nominal lane keeping performance, but applied more steering input than control participants, and were more likely than control participants to miss peripherally projected stimuli. The eye-tracking results suggest that glaucoma patients did not use extra visual search to compensate for their visual field loss. Limitations of the study, such as small sample size, are discussed. Citation: Prado Vega R, van Leeuwen PM, Rendón Vélez E, Lemij HG, de Winter JCF (2013) Obstacle Avoidance, Visual Detection Performance, and Eye-Scanning Behavior of Glaucoma Patients in a Driving Simulator: A Preliminary Study. PLoS ONE 8(10): e77294. doi:10.1371/journal.pone.0077294 Editor: Sanjoy Bhattacharya, Bascom Palmer Eye Institute, University of Miami School of Medicine;, United States of America Received June 4, 2013; Accepted September 1, 2013; Published October 16, 2013 Copyright: © 2013 Prado Vega et al. This is an open-access article distributed under the terms of the Creative Commons Attribution License, which permits unrestricted use, distribution, and reproduction in any medium, provided the original author and source are credited. Funding: The research of Joost de Winter was supported by the Dutch Technology Foundation (Stichting voor de Technische Wetenschappen), the Applied Science Division of the Netherlands Organisation for Scientific Research (Nederlandse Organisatie voor Wetenschappelijk Onderzoek), and the Technology Program of the Ministry of Economic Affairs. The funders had no role in study design, data collection and analysis, decision to publish, or preparation of the manuscript. Competing interests: The authors have declared that no competing interests exist. * E-mail: [email protected] Introduction Glaucoma can produce severe visual impairment and is the second leading cause of blindness [1]. It has been estimated that 60 million people are currently afflicted with glaucoma, and this number is expected to increase as the population ages [2]. Many glaucoma patients tend to self-regulate their driving activity by avoiding difficult situations such as driving in the dark and rain, or during peak hours [3,4]. However, some glaucoma patients with advanced visual field loss continue to drive [4] and may endanger themselves and others. Several studies have shown that glaucoma patients are overrepresented in self-reported and police-registered motor vehicle collisions [5-9]. Results from an on-road driving test showed that glaucoma patients (n = 20) performed common driving maneuvers (e.g., entering traffic, turning, negotiating intersections, and parking) as adequately as age-matched controls (n = 20) [10]. However, the study also showed that a driving instructor intervened more often when glaucoma patients drove than when control subjects drove (60% vs. 20% of participants, respectively). The interventions were related to potentially unsafe driving behaviors, such as failure to see and yield to a pedestrian or an oncoming vehicle, and failure to see and stop at a stop sign. In another on-road study, it was found that glaucoma patients with more binocular field loss performed worse at dynamic tasks such as taking turns and lane changing [11]. Recently, research interest has increased in determining valid fitness-to-drive criteria for glaucoma patients [12]. On- road tests are traditionally regarded as the gold standard in driving assessment [13]. However, human examiners have limited inter-rater reliability [14-16] and even if examiners were PLOS ONE | www.plosone.org 1 October 2013 | Volume 8 | Issue 10 | e77294
Transcript of Simulator: A Preliminary Study Rocío Prado Vega Eye ... · Netherlands, 3 Rotterdam Eye Hospital...

Obstacle Avoidance, Visual Detection Performance, andEye-Scanning Behavior of Glaucoma Patients in a DrivingSimulator: A Preliminary StudyRocío Prado Vega1, Peter M. van Leeuwen1, Elizabeth Rendón Vélez1, Hans G. Lemij2,3, Joost C. F. deWinter1*
1 Department of BioMechanical Engineering, Delft University of Technology, Delft, The Netherlands, 2 Rotterdam Ophthalmic Institute (ROI), Rotterdam, TheNetherlands, 3 Rotterdam Eye Hospital (REH), Rotterdam, The Netherlands
Abstract
The objective of this study was to evaluate differences in driving performance, visual detection performance, andeye-scanning behavior between glaucoma patients and control participants without glaucoma. Glaucoma patients (n= 23) and control participants (n = 12) completed four 5-min driving sessions in a simulator. The participants wereinstructed to maintain the car in the right lane of a two-lane highway while their speed was automatically maintainedat 100 km/h. Additional tasks per session were: Session 1: none, Session 2: verbalization of projected letters,Session 3: avoidance of static obstacles, and Session 4: combined letter verbalization and avoidance of staticobstacles. Eye-scanning behavior was recorded with an eye-tracker. Results showed no statistically significantdifferences between patients and control participants for lane keeping, obstacle avoidance, and eye-scanningbehavior. Steering activity, number of missed letters, and letter reaction time were significantly higher for glaucomapatients than for control participants. In conclusion, glaucoma patients were able to avoid objects and maintain anominal lane keeping performance, but applied more steering input than control participants, and were more likelythan control participants to miss peripherally projected stimuli. The eye-tracking results suggest that glaucomapatients did not use extra visual search to compensate for their visual field loss. Limitations of the study, such assmall sample size, are discussed.
Citation: Prado Vega R, van Leeuwen PM, Rendón Vélez E, Lemij HG, de Winter JCF (2013) Obstacle Avoidance, Visual Detection Performance, andEye-Scanning Behavior of Glaucoma Patients in a Driving Simulator: A Preliminary Study. PLoS ONE 8(10): e77294. doi:10.1371/journal.pone.0077294
Editor: Sanjoy Bhattacharya, Bascom Palmer Eye Institute, University of Miami School of Medicine;, United States of America
Received June 4, 2013; Accepted September 1, 2013; Published October 16, 2013
Copyright: © 2013 Prado Vega et al. This is an open-access article distributed under the terms of the Creative Commons Attribution License, whichpermits unrestricted use, distribution, and reproduction in any medium, provided the original author and source are credited.
Funding: The research of Joost de Winter was supported by the Dutch Technology Foundation (Stichting voor de Technische Wetenschappen), theApplied Science Division of the Netherlands Organisation for Scientific Research (Nederlandse Organisatie voor Wetenschappelijk Onderzoek), and theTechnology Program of the Ministry of Economic Affairs. The funders had no role in study design, data collection and analysis, decision to publish, orpreparation of the manuscript.
Competing interests: The authors have declared that no competing interests exist.
* E-mail: [email protected]
Introduction
Glaucoma can produce severe visual impairment and is thesecond leading cause of blindness [1]. It has been estimatedthat 60 million people are currently afflicted with glaucoma, andthis number is expected to increase as the population ages [2].Many glaucoma patients tend to self-regulate their drivingactivity by avoiding difficult situations such as driving in thedark and rain, or during peak hours [3,4]. However, someglaucoma patients with advanced visual field loss continue todrive [4] and may endanger themselves and others. Severalstudies have shown that glaucoma patients areoverrepresented in self-reported and police-registered motorvehicle collisions [5-9].
Results from an on-road driving test showed that glaucomapatients (n = 20) performed common driving maneuvers (e.g.,
entering traffic, turning, negotiating intersections, and parking)as adequately as age-matched controls (n = 20) [10]. However,the study also showed that a driving instructor intervened moreoften when glaucoma patients drove than when controlsubjects drove (60% vs. 20% of participants, respectively). Theinterventions were related to potentially unsafe drivingbehaviors, such as failure to see and yield to a pedestrian or anoncoming vehicle, and failure to see and stop at a stop sign. Inanother on-road study, it was found that glaucoma patients withmore binocular field loss performed worse at dynamic taskssuch as taking turns and lane changing [11].
Recently, research interest has increased in determiningvalid fitness-to-drive criteria for glaucoma patients [12]. On-road tests are traditionally regarded as the gold standard indriving assessment [13]. However, human examiners havelimited inter-rater reliability [14-16] and even if examiners were
PLOS ONE | www.plosone.org 1 October 2013 | Volume 8 | Issue 10 | e77294

always consistent and in agreement with all other examiners,there would still be limitations in the reliability and validity of on-road testing, due to random traffic and weather conditions, aswell as local differences in road infrastructure. In a recentreview, Medeiros et al. [12] proposed driving simulators as atool for evaluating driving performance of glaucoma patients.Driving simulators may be able to predict on-road driving safetybecause they provide the visual and auditory sensations thatmimic those encountered in real car driving, while providinghigh controllability and repeatability.
A number of previous studies have evaluated drivingperformance of glaucoma patients in a driving simulator. Szlyket al. [17] compared 25 patients having mild to moderateglaucoma with 29 normally-sighted control participants ofequivalent age. The patient and control groups performedindistinguishably on most of the driving simulator indices (e.g.,mean speed, number of lane boundary crossings, number ofsimulator accidents), but a substantial difference was found inbrake response times, where patients pressed the brake pedalmore rapidly after the presentation of a stop sign (2.19 s forpatients vs. 4.81 s for control participants, p < 0.001). Theauthors suggested that this effect was not caused by differentvisual abilities of the two groups per se, but by the patientsbeing vigilant and trying to react immediately, whereas thecontrol group adopted a longer wait time, reaching a pointcloser to the intersection. In a later study [9], 40 glaucomapatients with a wide range of visual field loss were comparedwith 17 normally-sighted control participants as to theirperformance on an 8-min evaluation course, while beinginstructed to drive as they normally would and to obey trafficrules. The results showed that the glaucoma group had ahigher incidence of accidents in the simulator. More recently,Rosen et al. [8] tested 45 glaucoma patients and 76participants without glaucoma in a driving simulator. Comparedto the control group, the glaucoma patients demonstrated alonger time delay during car following, and had a longerreaction time and missed more targets on a detection task.This detection task involved targets that were randomlypresented in the right or left peripheral visual field, while theparticipant performed a task requiring central fixation (carfollowing with variable speed of the lead vehicle). In the studyby Rosen et al., 93% of the glaucoma patients had mild tomoderate glaucoma. The authors stated that further researchshould be performed with patients having severe glaucoma,and that it is important to clarify the relationship between depthand location of visual field defects in simulators.
The aim of the present study was to evaluate differencesbetween patients with mild to severe glaucoma and controlparticipants regarding their driving performance, visualdetection performance, and eye-scanning behavior in asimulator. In agreement with Haymes et al. [10], we speculatedthat glaucoma patients are able to adequately keep the car onthe road and avoid collisions, but are less likely to detectunexpected events in the periphery. A test was designed toevaluate lane keeping and obstacle avoidance, as well asdetection of projected letters. The projected letters wereregarded as surrogates for unexpected events occurring in theenvironment. In addition, the relationship between task
performance and visual field loss was investigated. Wespeculated that more severe visual field defects would result ina worse letter detection performance.
Previous research suggests that persons with hemianopsiaor with an artificially restricted field of view adjust their headmovements and eye-scanning behavior as a compensationtechnique for the loss of visual information [18-21]. A drivingsimulator study by Coeckelbergh et al. [22] reported thatparticipants with peripheral visual field defects who passed anon-road driving test made more head movements whenapproaching an intersection in the driving simulator than thosewho failed the on-road test. However, no statistically significantcorrelations were found between visual field loss and headmovements. In a recent exploratory study using video-basedhazard-perception tasks, Crabb et al. [23] reported thatglaucoma patients made more eye movements (i.e., shorterfixations, and more saccades and fixations per second, but withequivalent saccade amplitudes) than control participants. Theauthors interpreted that patients, unconsciously or consciously,make these eye movements as a compensation for theirrestricted field of view. A preliminary driving simulator study byLockhart et al. [24] found no statistically significant differencesin head position variability and number of eye fixations to areasof interest (i.e., mirrors, dashboard, etc.) between drivers withperipheral visual field loss and drivers with normal vision. In ourstudy, we explored patients’ eye-scanning behavior toinvestigate whether visual compensation occurred in glaucomapatients during driving.
Materials and Methods
Ethics statementThe research adhered to the tenets of the Declaration of
Helsinki. This study was approved by the Medical EthicsCommittee of the Erasmus Medical Centre, Rotterdam and theHuman Research Ethics Committee of the Delft University ofTechnology. All individuals gave their written informed consent.
ParticipantsTwenty-five glaucoma patients with Primary Open Angle
Glaucoma (POAG) and 14 control participants withoutglaucoma were recruited from the Rotterdam OphthalmicInstitute (ROI) from an ongoing longitudinal follow-up study intoglaucoma imaging.
Participants were measured with standard automatedperimetry (SAP) by means of the Humphrey Field Analyzer II(Carl Zeiss Meditec, model number 750), with the 24-2Swedish Interactive Threshold Algorithm (SITA; SoftwareVersion: 4.2.2). The exclusion criteria for all participants were:(1) having a best-corrected visual acuity worse than 6/12 on aSnellen Chart in at least one eye (2), having a refractive erroroutside the -10.0 to +5.0 diopters range (3), having hadcataract surgery in the previous 12 months before theexperiment (4), having had previous refractive or vitreoretinalsurgery (5), presenting evidence of diabetic retinopathy,macular edema, or other vitreoretinal disease (6), having hadprevious keratoplastic surgery. There were no age cut-offsduring recruitment. We attempted to invite patients and controls
Glaucoma Patients in a Driving Simulator
PLOS ONE | www.plosone.org 2 October 2013 | Volume 8 | Issue 10 | e77294
of corresponding ages, with the aim to keep the mean age ofboth groups approximately equal.
Glaucoma patients had a confirmed diagnosis based on opticnerve damage and a visual field loss according to the followingmeasures: (1) Glaucoma Hemifield Test (GHT) result outsidenormal limits, and (2) 3 or more adjacent points depressed at p< 0.05 or 1 or more points at p < 0.01 in the total deviation plot.Patients with an eye disease other than glaucoma that mightaffect the visual field (including greater than mild cataract) orwith secondary glaucoma were not included. In order to testvarious types of visual field loss, the patients were selectedbased on their scotoma pattern as follows: (1) defects in the lefteye only (n = 4), (2) defects in the right eye only (n = 7), (3)defects in alternated regions (defects in the upper field of oneof the eyes and the lower field of the fellow eye) (n = 5), (4)defects in the upper visual field of both eyes (n = 6), and (5)defects in the lower visual field of both eyes (n = 3). The controlparticipants had a visual field within normal limits in the GHTand no history of ocular disease.
Procedures and driving instructionsPrior to the simulator test, participants filled out a 37-item
multiple-choice questionnaire in Dutch language. Thisquestionnaire consisted of 8 general items (e.g., age, gender,medication use, estimated health, worry about sight), 5 itemsabout difficulties with daily activities, 10 items about drivinghistory and self-rated driving performance (e.g., mileage,number of accidents, number of fines, driving skills), 12 itemsabout violations and errors while driving, 1 item about preferreddriving modality, and 1 item about experience with cruisecontrol. The items were based on the Driving HabitsQuestionnaire [25], the National Eye Institute-VisualFunctioning Questionnaire (NEI-VFQ) Driving Subscale [26],and the Manchester Driver Behaviour Questionnaire (DBQ)[27,28].
Next, the participants performed reaction time tests on adesktop computer, and received a video instruction of 3.5minutes. The video described general indications for controllingthe car and the tasks per session.
Participants then seated inside the driving cabin, and put onthe seat belt in order to maintain the body in a relativelyconstant position with respect to the screen. Next, participantscarried out a series of head movements and eye movements tocalibrate the eye-tracker. Participants then drove a trainingsession, followed by an optional break, and the driving testconsisting of four sessions. The sessions, including the trainingsession, lasted 278 s each. After each session, participantsfilled out the NASA-TLX questionnaire for measuring workload.
The environment for all sessions consisted of a two-lanehighway without on- and off-ramps. The highway containedseveral slight bends and a 270 degree left curve of 300 mradius. The highway had a total length of 7534 m and a lanewidth of 3.6 m. No other moving vehicles shared the road withthe participant.
The participants were asked to drive in the right lane of thetwo-lane highway. The control of the car consisted of steeringonly; the participants did not use the pedals or gear lever. The
car accelerated automatically until reaching a constant speedof 100 km/h (reached 17 s after the car was started).
In session 1, the road was empty. In session 2, the road wasalso empty, and the participants performed a letter detectiontask as secondary task. Participants had to verbalize equallysized (5 cm height) green colored (RGB 16%, 100%, 16%)letters appearing on the projected environment. The lettersautomatically disappeared 4 s after their appearance, andintervals between the letters varied between 3 and 6 s. The firstletter appeared 6 s after the session was started. Thirty-twoletters per session were projected at 25 differentpreprogrammed coordinates on the screen.
Based on the positions of the participants’ eyes with respectto the screen as measured during the experiment, weestimated the horizontal and vertical peripheral eccentricities ofthe projected letters. The mean horizontal angle acrossparticipants between a line through the leftmost projected letterand the origin of gaze (i.e., the point between both eyes) and aline perpendicular to the screen through the origin of gaze was-6.4 degrees (SD = 1.4). For the rightmost projected letter thishorizontal angle was 36.1 (SD = 2.3) degrees. The verticalmean angles of the lowest and highest projected letters wereestimated at -2.9 (SD = 2.3) and 16.8 (SD = 2.7) degrees,respectively. Note that the nonzero standard deviations arisefrom individual differences in seating position and eye height.
In session 3, the participants had to evade nine staticobstacles by changing to the left lane. The obstacles werepositioned in the center of the right lane, and were threebicycles, three pairs of bicycles, and three cars. Theparticipants encountered the obstacles at the following times inseconds: 19.7, 49.2, 61.7, 83.4, 121.8, 135.1, 226.0, 236.8,and 267.9 (corresponding distances in meters: 350, 1171,1521, 2125, 3193, 3563, 6095, 6395, and 7262).
In session 4, the participants had to both perform the lettertask and evade the same nine obstacles as in session 3. Thetimes and positions in which the letters and obstacles appearedin session 4 were identical to those in sessions 2 and 3,respectively. The actual letter characters were different fromsession 2. In the training session, the participants had to evadefive static obstacles located at the positions corresponding tothe 2nd, 4th, 6th, 8th, and 9th obstacles of sessions 3 and 4.The distance between the car and obstacle at which obstaclesbecame perceivable (due to the finite resolution of the LCDprojector) was estimated at 135 m.
Demographic and driving habit dataThe following items were selected from the 37-item
questionnaire: (1) age, (2) gender, (3) worry about sight (1 =never, 7 = always), (4) medication use, (5) number of collisionsinvolving damage in the past 36 months, as a driver, (6)number of kilometers driven in the past 12 months, (7) drivingfrequency in the past 12 months (1 = every day, 7 = never),and (8) cruise control experience (no or yes). These items wereconsidered relevant for assessing the (non)equivalence of theglaucoma group versus the control group.
Glaucoma Patients in a Driving Simulator
PLOS ONE | www.plosone.org 3 October 2013 | Volume 8 | Issue 10 | e77294

Visual field measuresThe monocular visual fields were merged into an integrated
visual field (IVF) by determining the best monocular sensitivityfor 52 corresponding positions around visual fixation.Furthermore, a measure of sensitivity loss was calculated forthe monocular (better eye and worse eye) and integrated visualfields, based on a method reported by Szlyk et al. [9].Sensitivity measures represented the percentage of 13 points(i.e., 52/4) falling below a 25 dB sensitivity threshold for thequadrants of the visual field (upper left, upper right, lower left,and lower right). The mean deviation (MD) per eye wasrecorded as well for each participant.
Reaction timeParticipants performed the Deary-Liewald reaction time task,
consisting of a simple reaction time (SRT) and a choicereaction time (CRT) task [29]. Reaction time is associated withhealth and general cognitive ability [29], and studies suggestthat similar neurodegenerative mechanisms may underlie bothglaucoma and cognitive decline [8,30,31]. The reaction timetasks were included to verify whether glaucoma and controlgroups had equal ability on this elementary cognitive task.
Driving simulatorA fixed-base interactive driving simulator (Green Dino,
Wageningen, The Netherlands) was used. The simulator cabinwas equipped with the following components: steering wheel,ignition key, gear lever, single seat, and pedals. The feedbackof the steering wheel was provided by a passive spring system.Surround sound was used to simulate wind, tires, and enginenoise. The virtual environment, including dashboard and rear-view mirror, was projected onto the central screen (1.09 m X0.77 m) by means of an LCD projector (NEC VT676) providingan image of 1024 x 768 pixels. With the exception of projectedside mirrors, the lateral screen projections were not used inorder to reduce driving simulator discomfort [32]. The total fieldof view (FOV) perceived by the participant was approximately70 degrees horizontally and 50 degrees vertically, dependingon the distance between the seat and the screen.
Driving performance measuresThe steering angle and vehicle position were recorded with a
sampling frequency of 60 Hz. High frequency noise from thesteering wheel angle was lowpass filtered (Butterworth, 2ndorder) with two cutoff frequencies: 0.5 Hz and 2 Hz. Themaximum frequency with which a human can steer is about 1to 2 Hz [33]. Hence, 2 Hz is an appropriate cutoff frequency toremove sensor noise, whereas a cutoff frequency of 0.5 Hzfilters out high-frequency steering inputs (e.g., fierce steeringaround obstacles) and focuses on the driver’s steeringoscillations.
The following measures were calculated per session:
• Steering activity (SA) (deg/s) was defined as the averagespeed of the steering wheel angle [34]. This metric was definedin two different ways: based on the steering angle filtered withhigh (SA-high; 2 Hz) and low (SA-low; 0.5 Hz) cutofffrequencies. SA-high and SA-low were calculated for obstacle
periods (defined as sections starting 150 m before and ending200 m after obstacles) and outside obstacle periods,regardless of whether the obstacles were actually present inthat session. Steering activity can be seen as a measure ofdriving style, where low steering activity indicates smoothsteering, and a high steering activity describes active steering.
• Standard deviation of lateral position (SDLP) (m) is acommonly used measure, describing the vehicle’s swerving onthe road. A high SDLP value indicates imprecise lane keeping[35,36].
• Longitudinal distance to obstacle (LongDtO) (m), ameasure of reaction with respect to the static obstacles, with ahigher value indicating that the participant reacted earlier.LongDtO was defined as the longitudinal distance between thecenter of the obstacle and center of participant’s vehicle whenthe latter crossed the road center (i.e., the line between the twolanes). The mean of the nine obstacles was calculated.
• Lateral position to obstacle (LatDtO) (m), the lateraldistance between the center of the obstacle and the center ofthe participant’s vehicle when passing the obstacle. The meanof the nine obstacles was calculated.
• A collision was defined as a lateral distance between thecenter of the participant’s vehicle and the center of an obstacleof less than 1.6 m (contact implied from the car’s dimensions)while driving alongside the obstacle. Note that physical impactwould never occur because the participants’ car could moveunimpeded through the obstacles.
Letter task measuresThe projector (EPSON EPN30) used for the letter stimuli was
mounted on top of the projector used for projecting the virtualenvironment. Sessions 2 and 4 were recorded with amicrophone that was unobtrusively fixed to the simulator’scabin. Times of voice events were extracted automatically fromthe auditory signal. The reaction time was defined as theelapsed time between the letter appearance and the voiceevent. A letter was considered as detected if the participantcalled out any sound within the time in which the letter wasprojected until one second after its disappearance. Accordingly,the number of misses, and the average letter reaction time(LRT) per session were obtained. Spearman correlationsbetween the letter measures (number of misses and reactiontime) and the sensitivity-loss percentages were calculated forthe glaucoma group.
Eye-scanning measuresA remote eye tracker (Smart Eye 5.9, Sweden) was used to
measure eye gaze during driving. The eye tracker consisted ofthree Sony XC-HR50 cameras equipped with two infraredilluminators mounted below the virtual scenery of the drivingsimulator. Data was recorded with a sampling frequency of 60Hz and was lowpass filtered (Butterworth, 2nd order) with a 20Hz cutoff frequency.
The following eye-scanning measures were calculated persession:
Glaucoma Patients in a Driving Simulator
PLOS ONE | www.plosone.org 4 October 2013 | Volume 8 | Issue 10 | e77294

• Percentage of time that gaze was directed at the screen’stop and bottom, as a measure of visual attention (see Figure 1for an illustration).
• Number of fixations per second, a measure of the visualsearch strategy of participants [23]. Fixations were definedaccording to a dispersion-based method with a threshold of 3degrees and a minimum fixation duration of 150 m [37,38].
• Mean saccade amplitude (mm), a measure of visualscanning, calculated as the mean distance betweensubsequent fixations [23,39].
Self-reported workloadA Dutch version of the NASA-TLX [40], a common
questionnaire in driving simulator research (e.g., [41,42]), wasused to verify whether glaucoma patients and controlparticipants experienced similar workload. The NASA TLXincludes the following six items: mental demand, physicaldemand, temporal demand, performance, effort, andfrustration. Scores were marked on a 21-tick bar ranging from 1= very low to 21 = very high (1 = perfect and 21 = failure for theperformance item). A total score was calculated by averagingthe six items and expressing the results on a scale from 0%(lowest rating on all items) to 100% (highest rating on allitems).
Statistical testsGroup comparisons (glaucoma patients vs. control
participants) were conducted by means of a two-sample t-testassuming that the two samples came from normal distributionswith unknown and unequal variances (also known as Welch’s t-test). Differences between sessions were evaluated by meansof a paired t-test. Associations between variables wereevaluated using the Spearman correlation coefficient. Analyses
were two-tailed and the α value (i.e., the false positive rate)was set at 0.05.
No α correction for multiple testing was made, because oursample size was relatively small. Fielder et al. [43] explainedthat “it remains a statistical fact that measures that decrease αwill often increase β”.Mudge et al. [44] argued that researchersshould aim to minimize the combined probability (or cost) ofType I errors (i.e., false positives) and Type II errors (i.e., falsenegatives). Mudge et al. showed that when the sample size issmaller, a more liberal α value should be set to minimize thetotal probability of error. We argued that setting the α valuebelow 0.05 would disproportionally increase β, the falsenegative rate.
Results
Excluded dataThe data from two glaucoma patients and two control
participants was excluded from the analyses. Theseparticipants experienced simulator discomfort during thetraining session and were at that point withdrawn from theexperiment. Accordingly, data from 35 participants were usedfor further analyses.
Eye-scanning recordings may be inaccurate because of thesystem’s inability to detect facial features or pupils. Thisproblem can be aggravated by reflections and physicalobstructions of a participant’s glasses. The data from twoparticipants were excluded after visual inspection of the videorecordings from the eye-tracking system. Their data wasremoved because the eye-tracker measured erratic gazepatterns contradicting pupil movements. Data samplescorresponding to 0.5 s before and after blinks, missing datavalues, and data segments of less than 1 s were removed.Eye-tracking data of participants was completely excluded, if
Figure 1. Illustration of top and bottom regions (inside dashed rectangles) used for calculating the eye-scanningmeasures. doi: 10.1371/journal.pone.0077294.g001
Glaucoma Patients in a Driving Simulator
PLOS ONE | www.plosone.org 5 October 2013 | Volume 8 | Issue 10 | e77294

one or more sessions had more than 60% removed data. Intotal, the data from 8 participants (7 patients, 1 control) wasexcluded from further eye-scanning analyses.
Descriptive statisticsTable 1 shows descriptive statistics for both groups. There
was no statistically significant difference for mileage, drivingfrequency, SRT, and CRT between the glaucoma group andthe control group. Participants from the control group reportedto be more experienced with cruise control, and were less likelyto wear glasses during the experiment than glaucoma patients.Three participants (one patient and two control participants)had participated in a pilot test 7 months prior to thisexperiment. Two of the glaucoma patients reported to be underthe influence of ophthalmic medication that may affect driving.
Driving performance of glaucoma group vs. controlgroup
The results from the driving measures averaged oversessions are presented in Table 2. The glaucoma groupdisplayed significantly higher steering activity than the controlgroup on the following three metrics: SA-high (obstacleperiods), SA-low (non-obstacle periods), and SA-low (obstacleperiods). There were no statistically significant differencesbetween the two groups for SA-high (non-obstacle periods),SDLP, LongDtO, and LatDtO.
Figure 2 illustrates the difference between low and highsteering activity. For illustrative purposes, the participant withthe minimum and the participant with maximum value of SA-high in session 4 were selected. The corresponding SA-highvalues for these two participants (one control participant, andone glaucoma patient, respectively) were 1.28 deg/s and 2.70deg/s for the non-obstacle periods, and 1.54 deg/s and 6.91deg/s for the obstacle periods. Figure 3 illustrates the lateralposition for the same two participants in session 4. Thecorresponding SDLP values for the non-obstacle periods were
Table 1. Means (standard deviations in parentheses) for participants’ characteristics, mean deviation of the visual field, andreaction times from the Deary-Liewald task.
Measure Control group Glaucoma group (n = 12) (n = 23) pAge (years) 65.7 (9.4) 65.1 (12.2) 0.877Gender (% women) 25 35 0.560Percentage of IVF points < 25 dB 1.9 (2.7) 42.4 (25.3) 1.1*10-7
Mean deviation OD -0.09 (0.86) -10.72 (8.98) 1.0*10-5
Mean deviation OS -0.16 (1.16) -13.99 (7.04) 2.3*10-9
Wore glasses during test (% of participants) 25 70 0.012Single reaction time (s) 0.29 (0.05) 0.30 (0.04) 0.696Choice reaction time (s) 0.52 (0.11) 0.54 (0.06) 0.494Annual mileage (km)1 11,478 (9,080) 8,909 (8,694) 0.429Driving frequency (1 = every day, 7 = never)1 2.08 (1.73) 2.78 (1.83) 0.277Worry about sight (1 = never, 7 = always)1 1.33 (0.65) 2.43 (0.99) 4.3*10-4
Number of collisions in past 36 months1 0.17 (0.39) 0.35 (0.49) 0.242Experience with cruise control (% of participants)1 67 26 0.0271 Self-reported data; IVF = integrated visual field; dB = decibel; OD = oculus dexter (right eye); OS = oculus sinister (left eye).doi: 10.1371/journal.pone.0077294.t001
Table 2. Means (standard deviations in parentheses) for participants’ driving measures.
Measure Control group Glaucoma group p (n = 12) (n = 23) Standard deviation of lateral position (SDLP), non-obstacle periods (S1-S4) (m) 0.43 (0.16) 0.37 (0.08) 0.262Steering Activity-high, non-obstacle periods (S1-S4) (deg/s) 1.92 (0.50) 2.21 (0.65) 0.159Steering Activity-high, obstacle periods (S3,S4) (deg/s) 3.00 (0.69) 3.86 (1.17) 0.010Steering Activity-low, non-obstacle periods (S1-S4) (deg/s) 0.99 (0.14) 1.16 (0.18) 0.004Steering Activity-low, obstacle periods (S3,S4) (deg/s) 1.70 (0.34) 2.27 (0.53) 5.0*10-4
Longitudinal distance to obstacle (LongDtO) (S3, S4) (m) 51 (12) 55 (11) 0.319Lateral position to obstacle (LatDtO) (S3, S4) (m) 3.01 (0.35) 3.07 (0.28) 0.583
S3 = session 3; S4 = session 4; S1-S4 = sessions 1 to 4.doi: 10.1371/journal.pone.0077294.t002
Glaucoma Patients in a Driving Simulator
PLOS ONE | www.plosone.org 6 October 2013 | Volume 8 | Issue 10 | e77294

0.73 m for the participant with low steering activity and 0.46 mfor the participant with high steering activity. It can be seen inFigure 3 that the person with low steering activity took longer togo back to the right lane after avoiding the obstacle, had largerlane center errors, and had smaller lateral margins aroundobstacles, than the participant with high steering activity.
The analyses indicated that there were no collisions for anyof the participants. Within the group of 23 glaucoma patients,none of the correlations between the percentage of depressedIVF points and the driving performance measures listed inTable 2 reached statistical significance (p > 0.2 for allcorrelations).
Letter task performance of glaucoma group vs. controlgroup
The glaucoma group missed significantly more letters andhad a significantly longer letter reaction time than the controlgroup (Table 3). Within the group of 23 glaucoma patients,people with a larger percentage of depressed IVF points hadlonger reaction times (ρ = 0.62, p = 0.001) and a highernumber of letter misses (ρ = 0.67, p = 5.0*10-4).
Eye-scanning of glaucoma group vs. control groupTable 4 shows that participants from both groups hardly
looked at the top and bottom regions of the screen. Table 4further shows that there were no statistically significantdifferences between the glaucoma group and the control groupfor the eye-scanning measures. Figure 4 illustrates the medianpercentage of time per session that gaze was directed at theupper and lower regions of the screen. There were nostatistically significant differences between the two groups forany session.
An additional exploratory analysis showed that participantswith a larger percentage of IVF points depressed below the 25dB sensitivity threshold tended to gaze less to the top (ρ =-0.41, p = 0.033) and bottom parts (ρ = -0.35, p = 0.076) of thescreen in sessions 1 to 4 combined (n = 27). Similarly,participants with a lower mean deviation (dB) were less likely togaze to the top and bottom parts of the screen (ρ = 0.41, p =0.033 for the top part; ρ = 0.43, p = 0.025 for the bottom part;MD of both eyes averaged).
Figure 5 illustrates the eye-scanning behavior of a typicalparticipant during session 2. The participant directed his gazemostly to the focus of expansion (i.e., the point on the horizonfrom which, when being in forward motion, the optic flow seemsto emanate), directed attention to the letters shortly after theybecame visible, and immediately directed attention back to the
Figure 2. Steering angle versus time of two selected participants in session 4. One selected participant had very activesteering, whereas the other had very smooth steering. The steering angle was filtered with a cutoff frequency of 2 Hz. Positive =steering to left, negative = steering to right. The dotted vertical lines indicate when the participant passed one of the nine staticobstacles.doi: 10.1371/journal.pone.0077294.g002
Glaucoma Patients in a Driving Simulator
PLOS ONE | www.plosone.org 7 October 2013 | Volume 8 | Issue 10 | e77294
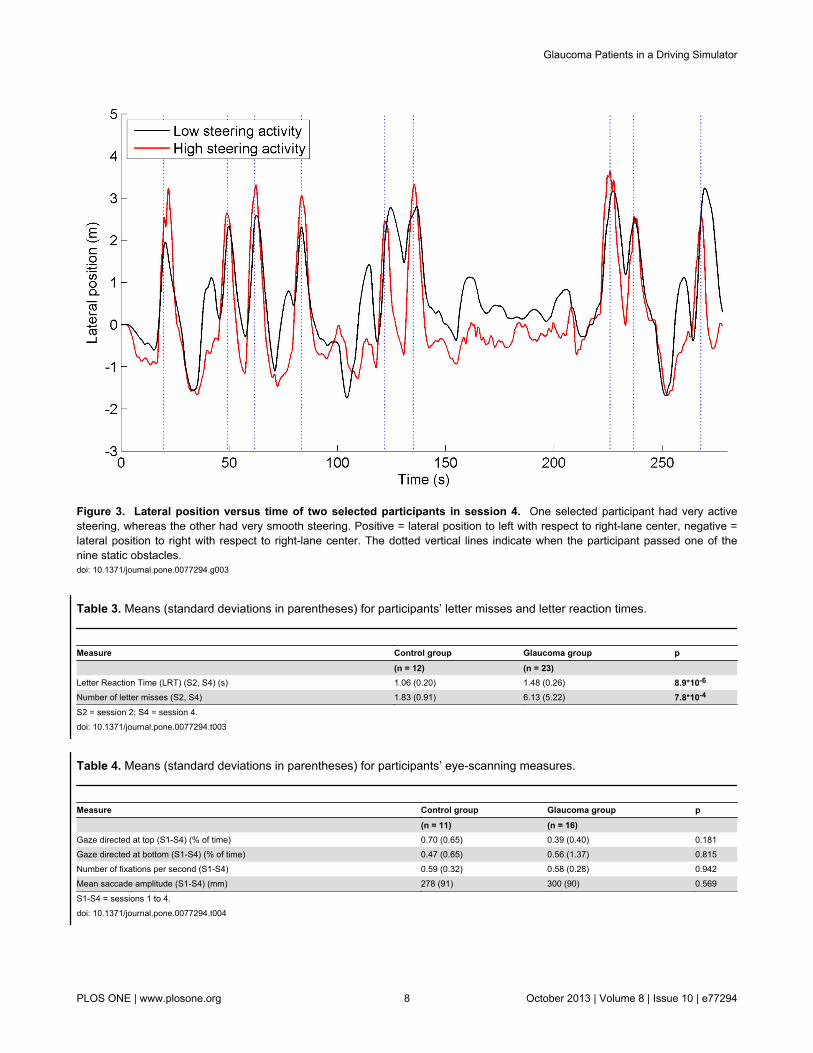
Figure 3. Lateral position versus time of two selected participants in session 4. One selected participant had very activesteering, whereas the other had very smooth steering. Positive = lateral position to left with respect to right-lane center, negative =lateral position to right with respect to right-lane center. The dotted vertical lines indicate when the participant passed one of thenine static obstacles.doi: 10.1371/journal.pone.0077294.g003
Table 3. Means (standard deviations in parentheses) for participants’ letter misses and letter reaction times.
Measure Control group Glaucoma group p (n = 12) (n = 23) Letter Reaction Time (LRT) (S2, S4) (s) 1.06 (0.20) 1.48 (0.26) 8.9*10-6
Number of letter misses (S2, S4) 1.83 (0.91) 6.13 (5.22) 7.8*10-4
S2 = session 2; S4 = session 4.doi: 10.1371/journal.pone.0077294.t003
Table 4. Means (standard deviations in parentheses) for participants’ eye-scanning measures.
Measure Control group Glaucoma group p (n = 11) (n = 16) Gaze directed at top (S1-S4) (% of time) 0.70 (0.65) 0.39 (0.40) 0.181Gaze directed at bottom (S1-S4) (% of time) 0.47 (0.65) 0.56 (1.37) 0.815Number of fixations per second (S1-S4) 0.59 (0.32) 0.58 (0.28) 0.942Mean saccade amplitude (S1-S4) (mm) 278 (91) 300 (90) 0.569
S1-S4 = sessions 1 to 4.doi: 10.1371/journal.pone.0077294.t004
Glaucoma Patients in a Driving Simulator
PLOS ONE | www.plosone.org 8 October 2013 | Volume 8 | Issue 10 | e77294

center region. This participant did not display noticeable activevisual search in between letter projections; the percentage ofsession time that this participant spent looking toward the topand bottom regions was 0.45% and 0.00%, respectively.
Self-reported workload of glaucoma group vs. controlgroup
There was no statistically significant difference between thecontrol group and the glaucoma group for the mean self-reported workload across the four sessions (p = 0.894). Themean workload score for the control group and glaucomagroup was 25% (SD = 18%) and 24% (SD = 15%),respectively. Figure 6 shows the mean workload reported byglaucoma patients and control participants per session. For thecontrol group, there was a non-significant decrease of workloadfor session 1 versus session 4 (p = 0.233), whereas for thepatient group the workload percentage significantly increased(p = 1.3*10-4).
Correlations between sensitivity loss and letter taskperformance
The correlation matrix between sensitivity loss and lettermeasures is reported in Table 5. Quadrants from the uppervisual field were strongly correlated with letter misses and letterreaction times (LRT). The quadrants in the lower visual fieldyielded relatively weak correlations with the letter measures.The IVF and better-eye VFs showed stronger correlations withletter performance than the worse-eye VF.
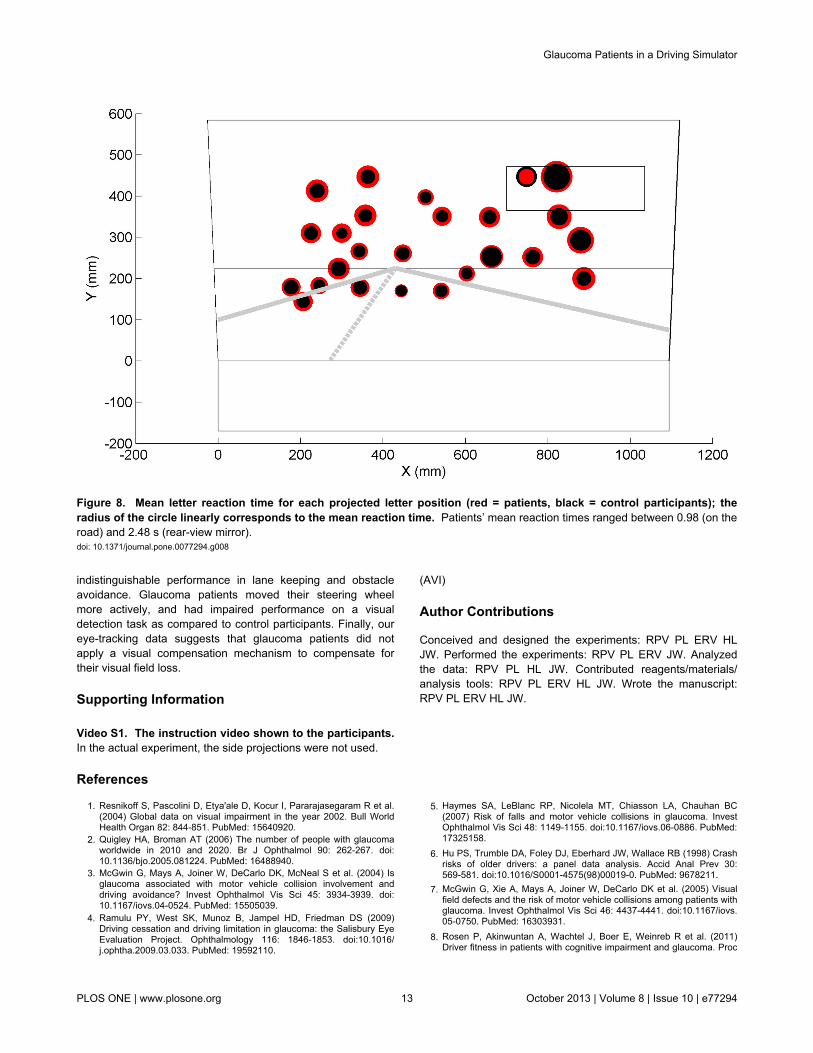
Figures 7 and 8 show the positions on the simulator’s screenwhere letters were prone to be missed by participants andpositions where participants showed higher reaction times,respectively. Most missed letters were those projected in theperipheral regions whereas the most successfully verbalizedletters were those confined to the road region.
Discussion
The aim of this study was to evaluate differences in drivingand visual detection performance between patients with mild tosevere glaucoma and control participants without glaucoma.Eye-scanning behavior was evaluated considering that it mayrepresent a compensation technique for visual field loss.
Glaucoma patients performed indistinguishably from controlparticipants on evading obstacles and keeping the car centeredin the lane. However, the steering activity was higher forglaucoma patients than for controls. According to the optimalcontrol theory of manned-vehicle systems, a human whoperforms a continuous tracking task can emphasize a targetcriterion, such as minimizing error with respect to a target orminimizing control effort [45]. The present results suggest thatthe patients gave more attention to minimizing lane keepingerror (i.e., keeping the car centered in the lane), while thecontrol group emphasized steering smoothness. These resultsare in line with Szlyk et al. [17] who found that glaucomapatients reacted faster than control participants after beingpresented with a stop sign. Szlyk et al. attributed this finding topatients’ hypervigilance, as this group might have been moreconcerned than control subjects that their driving performance
Figure 4. Median of percentage of time that gaze was directed at the top and bottom regions of the screen, per session(L = letter task, O = obstacle avoidance task). doi: 10.1371/journal.pone.0077294.g004
Glaucoma Patients in a Driving Simulator
PLOS ONE | www.plosone.org 9 October 2013 | Volume 8 | Issue 10 | e77294

was being evaluated. However, our results may also beinterpreted as the effect of reduced visual field in glaucomapatients. The patients may have missed relevant optical cuesthat are used for perception of distance and heading, andaccordingly, the increased steering activity of patients maysuggest that they had more difficulty performing the drivingtask.
Participants directed their gaze mostly to the focus ofexpansion, and no differences in eye-scanning behavior weredetected between the two groups. In fact, our results indicatedthat participants with more severe visual field defects tended tolook less to the upper and lower parts of the screen. Thisfinding contradicts the idea that glaucoma patients compensatefor their visual field loss by displaying increased visual searchwhile driving, see 23 for a hazard perception study. During aclassical hazard-perception task, participants are observers ofa scenario, whereas in our driving simulator, participants had tocontrol a vehicle themselves. Participants in a driving simulatormay not be inclined to look away from the road center, as doingso imposes a risk of collision or loss of control of the vehicle. Itshould be noted however, that our sample size, and thereforestatistical power, was small.
The patient group missed substantially more letters than thecontrol group. The result is consistent with Szlyk et al. [9] whoreported that compensation mechanisms for patients with
severe glaucoma are not effective for unpredictable eventsarising from the periphery. Our result is also in agreement withglaucoma patients’ deficiency in detecting unexpected objects(e.g., pedestrians) in real driving as found by Haymes et al. [5],and with patients’ impaired performance on a peripheraldetection task as observed in a driving simulator study byRosen et al. [8]. Glaucoma patients’ difficulty with aspects ofcar driving that involve reacting to unexpected events mayexplain their elevated motor vehicle collision involvement rates.It was interesting that both groups were prone to missing lettersprojected inside the rear-view mirror. This was probably due tothe mirror’s delineation causing low letter conspicuity incomparison to letters projected on a relatively uniform sky.
Our results showed that participants directed their gazemostly toward the point of expansion. No letters were projectedsubstantially below this region, which may explain why letterdetection performance was strongly correlated with theparticipants’ upper visual field loss. Defects in the integratedand better-eye visual fields were more strongly correlated withletter detection performance than worse-eye metrics. Thisresult is in line with studies showing that the IVF effectivelyapproximates the binocular visual field and is a valid predictorof task performance [46,47], and with Saunders et al. [48]showing that the better eye visual field is a strong marker oflegal fitness to drive. Note, however, that the integrated
Figure 5. Distance between gaze and focus of expansion (FOE; static point on the screen) versus time, for one typicalparticipant during session 2 (from the control group). The line is red when driving on a curved road segment; the line is bluewhen driving on a straight road segment. Distances from the projected letters to the FOE are indicated by horizontal black lines.Distances from the FOE to the rear-view mirror, speedometer, and side mirrors are 450 mm, 300 mm, and 600 mm, respectively.doi: 10.1371/journal.pone.0077294.g005
Glaucoma Patients in a Driving Simulator
PLOS ONE | www.plosone.org 10 October 2013 | Volume 8 | Issue 10 | e77294

monocular visual field may be different than actual obstacleperception in the far temporal peripheries. In our study, 8 of the32 letters were projected outside the IVF margin of 21 degrees(i.e., the 8 rightmost letters). It is further noted that thepercentage of depressed points for the IVF and the better eyewere strongly correlated (ρ = 0.96, n = 35), which explains whytheir correlations with letter misses were highly similar (cf.Table 5).
The TLX questionnaire revealed no difference in subjectiveworkload between the two groups. However, the progressive
addition of tasks yielded an increase of workload in glaucomapatients, while no increase was observed in the control group.A factor which may explain the observed increase in reportedworkload among glaucoma patients is that the patients mayhave had different expectations toward the test than the controlparticipants. It is possible that patients expected a challengingtask given their visual impairment, and therefore rated session1 as extraordinarily easy. As soon as more tasks (obstacleavoidance, letter detection) were added, the situation becamemore demanding for them and workload was rated as higher.
Figure 6. Mean self-reported workload per session (L = letter task, O = obstacle avoidance task). doi: 10.1371/journal.pone.0077294.g006
Table 5. Spearman correlation coefficients between glaucoma patients’ (n = 23) visual field loss (percentage of points below25 dB sensitivity threshold per quadrant of the visual field), and number of letter misses and letter reaction time.
VF location VF type Letter misses LRTUpper-left IVF 0.842 0.574Upper-right IVF 0.791 0.451Lower-left IVF 0.237 0.333Lower-right IVF 0.216 0.308Upper-left Worse eye 0.501 0.263Upper-right Worse eye 0.481 0.231Lower-left Worse eye -0.061 0.156Lower-right Worse eye -0.068 0.211Upper-left Better eye 0.832 0.631Upper-right Better eye 0.748 0.504Lower-left Better eye 0.302 0.344Lower-right Better eye 0.297 0.378
p < 0.05 for ρ ≥ 0.42; LRT = letter reaction time; VF = visual field.doi: 10.1371/journal.pone.0077294.t005
Glaucoma Patients in a Driving Simulator
PLOS ONE | www.plosone.org 11 October 2013 | Volume 8 | Issue 10 | e77294

A driving simulator study by Engström et al. [49] found thatincreasing cognitive task demands (by means of the AuditoryContinuous Memory Task) resulted in increased gazeconcentration towards the road center, a phenomenon morecommonly known as tunnel vision or cognitive tunneling. Theincrease of self-reported workload among glaucoma patientsmay be a factor explaining why they were more likely to missperipherally projected letters than control participants.
The control group reported to be more experienced withcruise control than the glaucoma group. Cruise controlexperience might have influenced our results, considering thatdriving speed was automatically controlled in our experiment.Future research may have to consider cruise controlexperience as an inclusion criterion. Generally, participants’computer skills and experience with technological noveltiesmay need to be controlled in future research.
Previous driving simulator studies [17,22] have shown thatdrivers compensate for their degraded visual ability by reducingtheir driving speed. In our study, the automated longitudinalcontrol of the vehicle provided a highly controlled and uniformenvironment for all participants (i.e., equal task demands, samespatial-temporal appearance of objects and letters). Ourapproach prevented compensation by means of speed. Theuse of speed as a compensatory mechanism among glaucomapatients will have to be studied in future research.
Driving simulators are able to provide performance metricsthat are predictive of real driving (e.g., [50]). However, drivingsimulators offer a limited degree of fidelity, and can causesimulator sickness in some participants. Some types of visualinformation, such as stereopsis, glare, and accommodationdistance, were not provided by our simulator, nor did oursimulator provide vestibular motion feedback. Furthermore,although the projected letters were useful to test participants’reactions to unexpected events, letters do not occur in real-world driving environments. Future research could investigateglaucoma patients’ detection of naturally occurring events, bymeans of a driving simulator or an on-road test. Note, however,that on-road tests are known to pose serious challengesregarding experimental control and sensor data quality [51].
It should be considered that the driving sessions comprisedless than 20 min of total driving time, while normal on-roaddriving may involve hours of sustained attention. Futureresearch could explore the effects of fatigue during longertesting periods.
Finally, we note that our sample size was modest, therebyrisking false positive and false negative findings [52]. It isrecommended to carry out a replication study with a largersample size, particularly for verifying the findings that are at theborderline of statistical significance.
In conclusion, our driving simulator study showed thatglaucoma patients and control participants had statistically
Figure 7. Mean number of letter misses for each projected letter position (red = patients, black = control participants); theradius of the circle linearly corresponds to the mean number of letter misses. Patients’ mean number of missed lettersranged between 0% (on the road) and 78% (rear-view mirror).doi: 10.1371/journal.pone.0077294.g007
Glaucoma Patients in a Driving Simulator
PLOS ONE | www.plosone.org 12 October 2013 | Volume 8 | Issue 10 | e77294
indistinguishable performance in lane keeping and obstacleavoidance. Glaucoma patients moved their steering wheelmore actively, and had impaired performance on a visualdetection task as compared to control participants. Finally, oureye-tracking data suggests that glaucoma patients did notapply a visual compensation mechanism to compensate fortheir visual field loss.
Supporting Information
Video S1. The instruction video shown to the participants.In the actual experiment, the side projections were not used.
(AVI)
Author Contributions
Conceived and designed the experiments: RPV PL ERV HLJW. Performed the experiments: RPV PL ERV JW. Analyzedthe data: RPV PL HL JW. Contributed reagents/materials/analysis tools: RPV PL ERV HL JW. Wrote the manuscript:RPV PL ERV HL JW.
References
1. Resnikoff S, Pascolini D, Etya'ale D, Kocur I, Pararajasegaram R et al.(2004) Global data on visual impairment in the year 2002. Bull WorldHealth Organ 82: 844-851. PubMed: 15640920.
2. Quigley HA, Broman AT (2006) The number of people with glaucomaworldwide in 2010 and 2020. Br J Ophthalmol 90: 262-267. doi:10.1136/bjo.2005.081224. PubMed: 16488940.
3. McGwin G, Mays A, Joiner W, DeCarlo DK, McNeal S et al. (2004) Isglaucoma associated with motor vehicle collision involvement anddriving avoidance? Invest Ophthalmol Vis Sci 45: 3934-3939. doi:10.1167/iovs.04-0524. PubMed: 15505039.
4. Ramulu PY, West SK, Munoz B, Jampel HD, Friedman DS (2009)Driving cessation and driving limitation in glaucoma: the Salisbury EyeEvaluation Project. Ophthalmology 116: 1846-1853. doi:10.1016/j.ophtha.2009.03.033. PubMed: 19592110.
5. Haymes SA, LeBlanc RP, Nicolela MT, Chiasson LA, Chauhan BC(2007) Risk of falls and motor vehicle collisions in glaucoma. InvestOphthalmol Vis Sci 48: 1149-1155. doi:10.1167/iovs.06-0886. PubMed:17325158.
6. Hu PS, Trumble DA, Foley DJ, Eberhard JW, Wallace RB (1998) Crashrisks of older drivers: a panel data analysis. Accid Anal Prev 30:569-581. doi:10.1016/S0001-4575(98)00019-0. PubMed: 9678211.
7. McGwin G, Xie A, Mays A, Joiner W, DeCarlo DK et al. (2005) Visualfield defects and the risk of motor vehicle collisions among patients withglaucoma. Invest Ophthalmol Vis Sci 46: 4437-4441. doi:10.1167/iovs.05-0750. PubMed: 16303931.
8. Rosen P, Akinwuntan A, Wachtel J, Boer E, Weinreb R et al. (2011)Driver fitness in patients with cognitive impairment and glaucoma. Proc
Figure 8. Mean letter reaction time for each projected letter position (red = patients, black = control participants); theradius of the circle linearly corresponds to the mean reaction time. Patients’ mean reaction times ranged between 0.98 (on theroad) and 2.48 s (rear-view mirror).doi: 10.1371/journal.pone.0077294.g008
Glaucoma Patients in a Driving Simulator
PLOS ONE | www.plosone.org 13 October 2013 | Volume 8 | Issue 10 | e77294

Int Driv Symp Hum Factors Driv Assess Train Veh Des. pp. pp.233-240
9. Szlyk JP, Mahler CL, Seiple W, Edward DP, Wilensky JT (2005) Drivingperformance of glaucoma patients correlates with peripheral visual fieldloss. J Glaucoma 14: 145-150. doi:10.1097/01.ijg.0000151686.89162.28. PubMed: 15741817.
10. Haymes SA, LeBlanc RP, Nicolela MT, Chiasson LA, Chauhan BC(2008) Glaucoma and on-road driving performance. Invest OphthalmolVis Sci 49: 3035-3041. doi:10.1167/iovs.07-1609. PubMed: 18326696.
11. Bowers A, Peli E, Elgin J, McGwin G Jr, Owsley C (2005) On-roaddriving with moderate visual field loss. Optom Vis Sci 82: 657-667. doi:10.1097/01.opx.0000175558.33268.b5. PubMed: 16127330.
12. Medeiros FA, Weinreb RN, Boer ER, Rosen PN (2012) Drivingsimulation as a performance-based test of visual impairment inglaucoma. J Glaucoma 21: 221-227. doi:10.1097/IJG.0b013e3182071832. PubMed: 21467952.
13. Rizzo M, Jermeland J, Severson J (2002) Instrumented vehicles anddriving simulators. Gerontechnology 1: 291-296.
14. Akinwuntan AE, DeWeerdt W, Feys H, Baten G, Arno P et al. (2003)Reliability of a road test after stroke. Arch Phys Med Rehabil 84:1792-1796. doi:10.1016/S0003-9993(03)00767-6. PubMed: 14669185.
15. Baughan C, Simpson H (2002). Graduated Licensing: A review of somecurrent systems. TRL Research Report 529 UK: Transport ResearchLaboratory.
16. Hunt LA, Murphy CF, Carr D, Duchek JM, Buckles V et al. (1997)Environmental cueing may affect performance on a road test for driverswith dementia of the Alzheimer type. Alzheimer Dis Assoc Disord 11:13-16. doi:10.1097/00002093-199700112-00003. PubMed: 9194962.
17. Szlyk JP, Taglia DP, Paliga J, Edward DP, Wilensky JT (2002) Drivingperformance in patients with mild to moderate glaucomatous clinicalvision changes. J Rehabil Res Dev 39: 467-482. PubMed: 17638144.
18. Bowers AR, Mandel AJ, Goldstein RB, Peli E (2009) Driving withhemianopia, I: Detection performance in a driving simulator. InvestOphthalmol Vis Sci 50: 5137-5147. doi:10.1167/iovs.09-3799. PubMed:19608541.
19. Kasper EF, Haworth LA, Szoboszlay ZP, King RD, Halmos ZL (1997)Effects of in-flight field-of-view restriction on rotorcraft pilot headmovement. Proc SPIE: 34-45.
20. Gallimore JJ, Brannon NG, Patterson FR (1998) The effects of field-of-view on pilot head movement during low level flight. Proc SPIE: 6-10.
21. Szoboszlay Z, Haworth L, Reynolds T, Lee A, Halmos Z (1995) Effectof field-ofview restriction on rotocraft pilot workload and performance:preliminary results. Proc SPIE: 142-153.
22. Coeckelbergh TR, Brouwer WH, Cornelissen FW, Van Wolffelaar P,Kooijman AC (2002) The effect of visual field defects on drivingperformance: a driving simulator study. Arch Ophthalmol 120:1509-1516. doi:10.1001/archopht.120.11.1509. PubMed: 12427065.
23. Crabb DP, Smith ND, Rauscher FG, Chisholm CM, Barbur JL et al.(2010) Exploring eye movements in patients with glaucoma whenviewing a driving scene. PLOS ONE 5: e9710. doi:10.1371/journal.pone.0009710. PubMed: 20300522.
24. Lockhart J, Boyle LN, Wilkinson M (2009) Driving With Visual FieldLoss: An Exploratory Simulation Study. DOT HS 811 062. NationalHighway Traffic Safety Administration.
25. Owsley C, Stalvey B, Wells J, Sloane ME (1999) Older drivers andcataract: driving habits and crash risk. J Gerontol A Biol Sci Med Sci54: M203-M211. doi:10.1093/gerona/54.4.M203. PubMed: 10219012.
26. Parrish RK (1996) Visual impairment, visual functioning, and quality oflife assessments in patients with glaucoma. Trans Am Ophthalmol Soc94: 919–1028. PubMed: 8981717.
27. De Winter JC (2013) Predicting self-reported violations among novicelicense drivers using pre-license simulator measures. Accid Anal Prev52: 71-79. doi:10.1016/j.aap.2012.12.018. PubMed: 23298709.
28. Reason J, Manstead A, Stradling S, Baxter J, Campbell K (1990) Errorsand violations on the roads: a real distinction? Ergonomics 33:1315-1332. doi:10.1080/00140139008925335. PubMed: 20073122.
29. Deary IJ, Liewald D, Nissan J (2011) A free, easy-to-use, computer-based simple and four-choice reaction time programme: the Deary-Liewald reaction time task. Behav Res Methods 43: 258-268. doi:10.3758/s13428-010-0024-1. PubMed: 21287123.
30. Kirby E, Bandelow S, Hogervorst E (2010) Visual impairment inAlzheimer's disease: a critical review. J Alzheimers Dis 21: 15-34.PubMed: 20182034.
31. McKinnon SJ (2003) Glaucoma: ocular Alzheimer’s disease. FrontBiosci 8: s1140-s1156. doi:10.2741/1172. PubMed: 12957857.
32. Lin J-W, Duh HB, Parker DE, Abi-Rached H, Furness TA (2002) Effectsof field of view on presence, enjoyment, memory, and simulatorsickness in a virtual environment. Proc IEEE Virtual Real Conf. pp. pp.164-171
33. McRuer DT, Jex HR (1967) A review of quasi-linear pilot models. IEEETrans Hum Factors Electron: 231-249.
34. Saffarian M, Happee R, De Winter J (2012) Why do drivers maintainshort headways in fog? A driving-simulator study evaluating feeling ofrisk and lateral control during automated and manual car following.Ergonomics 55: 971-985. doi:10.1080/00140139.2012.691993.PubMed: 22804738.
35. Brookhuis KA, Waard DD, Fairclough SH (2003) Criteria for driverimpairment. Ergonomics 46: 433-445. doi:10.1080/001401302/1000039556. PubMed: 12745694.
36. Dijksterhuis C, Brookhuis KA, De Waard D (2011) Effects of steeringdemand on lane keeping behaviour, self-reports, and physiology. Asimulator study. Accid Anal Prev 43: 1074-1081. doi:10.1016/j.aap.2010.12.014. PubMed: 21376904.
37. Salvucci DD, Goldberg JH (2000) Identifying fixations and saccades ineye-tracking protocols. Proc Symp Eye Tracking Res App. pp. 71-78.
38. Hornof AJ, Halverson T (2002) Cleaning up systematic error in eye-tracking data by using required fixation locations. Behav Res MethodsInstrum Comput 34: 592-604. doi:10.3758/BF03195487. PubMed:12564562.
39. Underwood G, Crundall D, Chapman P (2011) Driving simulatorvalidation with hazard perception. Transp Res Part F Traffic PsycholBehav 14: 435-446. doi:10.1016/j.trf.2011.04.008.
40. Hart SG (2006) NASA-task load index (NASA-TLX); 20 years later.Proc Hum Fact Ergon Soc Annu Meet. pp. pp. 904-908
41. Horberry T, Anderson J, Regan MA, Triggs TJ, Brown J (2006) Driverdistraction: the effects of concurrent in-vehicle tasks, road environmentcomplexity and age on driving performance. Accid Anal Prev 38:185-191. doi:10.1016/j.aap.2005.09.007. PubMed: 16226211.
42. de Winter JC, Mulder M, Van Paassen MM, Abbink DA, Wieringa PA(2008) A two-dimensional weighting function for a driver assistancesystem. IEEE Trans Syst Man Cybern B Cybern 38: 189-195. doi:10.1109/TSMCB.2007.908860. PubMed: 18270090.
43. Fiedler K, Kutzner F, Krueger JI (2012) The long way from α-errorcontrol to validity proper: Problems with a short-sighted false-positivedebate. Perspect Psychol Sci 7: 661-669. doi:10.1177/1745691612462587.
44. Mudge JF, Baker LF, Edge CB, Houlahan JE (2012) Setting an optimalα that minimizes errors in null hypothesis significance tests. PLOS ONE7: e32734. doi:10.1371/journal.pone.0032734. PubMed: 22389720.
45. Jagacinski RJ, Flach J (2011) Control theory for humans: Quantitativeapproaches to modeling performance. Taylor & Francis.
46. Crabb DP, Fitzke FW, Hitchings RA, Viswanathan AC (2004) Apractical approach to measuring the visual field component of fitness todrive. Br J Ophthalmol 88: 1191-1196. doi:10.1136/bjo.2003.035949.PubMed: 15317714.
47. Owen VM, Crabb DP, White ET, Viswanathan AC, Garway-Heath DF etal. (2008) Glaucoma and fitness to drive: using binocular visual fields topredict a milestone to blindness. Invest Ophthalmol Vis Sci 49:2449-2455. doi:10.1167/iovs.07-0877. PubMed: 18515585.
48. Saunders LJ, Russell RA, Crabb DP (2012) Practical landmarks forvisual field disability in glaucoma. Br J Ophthalmol 96: 1185-1189. doi:10.1136/bjophthalmol-2012-301827. PubMed: 22797319.
49. Engström J, Johansson E, Östlund J (2005) Effects of visual andcognitive load in real and simulated motorway driving. Transp Res PartF Traffic Psychol Behav 8: 97-120. doi:10.1016/j.trf.2005.04.012.
50. Lee HC, Cameron D, Lee AH (2003) Assessing the drivingperformance of older adult drivers: on-road versus simulated driving.Accid Anal Prev 35: 797-803. doi:10.1016/S0001-4575(02)00083-0.PubMed: 12850081.
51. Santos J, Merat N, Mouta S, Brookhuis K, De Waard D (2005) Theinteraction between driving and in-vehicle information systems:Comparison of results from laboratory, simulator and real-world studies.Transp Res Part F Traffic Psychol Behav 8: 135-146. doi:10.1016/j.trf.2005.04.001.
52. Ioannidis JP (2005) Why most published research findings are false.PLOS Med 2: e124. doi:10.1371/journal.pmed.0020124. PubMed:16060722.
Glaucoma Patients in a Driving Simulator
PLOS ONE | www.plosone.org 14 October 2013 | Volume 8 | Issue 10 | e77294


![Ravel: Bolero 1st Bassoon solo · Berlioz: Symphonie Fantastique 2nd Bassoon mvt 4: 2m. before reh. 52 to 2m. after reh. 53 mvt 5: 8m. after reh. 63 to reh. 65 [] []](https://static.fdocuments.us/doc/165x107/5e8d468bdfea1718003f649b/ravel-bolero-1st-bassoon-solo-berlioz-symphonie-fantastique-2nd-bassoon-mvt-4.jpg)