Simulations with NX - drbinde.de 9781569904794 Color Plots.pdf · ˜Color plots The examination of...
16
Reiner Anderl, Peter Binde Simulations with NX Kinematics, FEA, CFD, EM and Data Management. With numerous examples of NX 9 ISBN (Buch): 978-1-56990-479-4 ISBN (E-Book): 978-1-56990-480-0 For further information and order see http://www.hanser-fachbuch.de/978-1-56990-479-4 or contact your bookseller. © Carl Hanser Verlag, München
Transcript of Simulations with NX - drbinde.de 9781569904794 Color Plots.pdf · ˜Color plots The examination of...

Additional Chapter: Color Plots
Reiner Anderl, Peter Binde
Simulations with NX
Kinematics, FEA, CFD, EM and Data Management. With numerousexamples of NX 9
ISBN (Buch): 978-1-56990-479-4
ISBN (E-Book): 978-1-56990-480-0
For further information and order see
http://www.hanser-fachbuch.de/978-1-56990-479-4
or contact your bookseller.
© Carl Hanser Verlag, München

Color plots
The CAD model of the Opel RAK2 forms the basis for the learning tasks: The fi gure shows some sample images.

Color plots
The examination of convergence helps in assessing the accuracy.
192 188 245
315
At a singularity, stresses increase without limits.
The deformation should be checked fi rst.

Color plots
The nonscaled representation of the deformation shows that in our case small deformations occur.
von Mises stresses in the region of interest: The quality of results is plausible but the meshing is too coarse.
The critical areas of the mesh should be inspected visually.

Color plots
A successful convergence validation with the typical behavior of the stresses: The averaged stres-ses are approaching from below to the theoretical result. The unaveraged stresses overshoot the exact result to then approach from top.

Color plots
At a singularity, the stress continues to rise with a fi ner mesh.

Color plots
The temperature profi le in the rocket is the result.
The heat fl ux shows the locations at which the heat fl ow is accumulated.

Color plots
Forming simulation of a sheet metal: The metal sheet is plastically formed by two L-shaped tools.
An impact simulation with plastic deformation, that also takes the dynamic infl uence into account.
The deformation of the longitudinal beam is plausible.

Color plots
The highest stresses arise in a transition area of the cross section.
In the order of magnitude, the hand analysis and the FEM results agree. The diff erences are explai-nable: FEM results are more detailed and accurate than classical machine elements formulas.
The von Mises stresses calculated on the frame

Color plots
The additional cross beam has a slightly stress-reducing eff ect.
The safest course is to present the largest of the four calculated stress points.

Color plots
Animated natural frequency results allow the wave forms to be understood.
In modal analysis, the stress profi le can be specifi ed only qualitatively.
The result of contact pressure with tetrahedral meshes trembles a little. This can be improved through better meshings in the second part of this task.

Color plots
The von Mises stresses
Le� is the simple tetrahedron mesh, right the high quality mesh. At the top is the contact pressure, at the bottom the von Mises stress. The uniformity of the contact pressure is better for the high quality mesh. Otherwise results are very similar.
Color plots
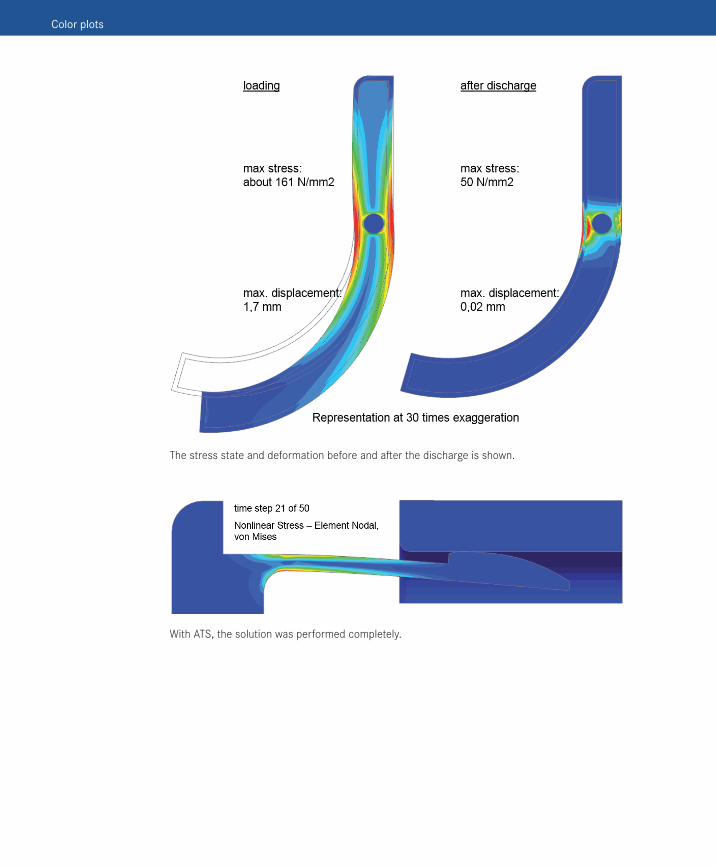
The stress state and deformation before and a� er the discharge is shown.
With ATS, the solution was performed completely.

Color plots
With the convergence graphs it can be judged whether the computation converges or diverges. For each calculated balance equation residuals arise, which are small deviations. With the course of the residuals, the solving process is controlled.
Via the button Graph, Traced Flow Results various graphs are shown in the solution monitor with the course of all requested interim results. These graphs are updated with each time step. Speed and pressure on the end face of the profi le end up with calm behavior.
Important rules for the evaluation of the Y+ result

Color plots
The total pressure always decreases in fl ow direction. Reasons therefore are the fl ow losses in every fl ow.
The static pressure distribution is plausible for an airfoil.
Calculated velocities in units of km/h

Color plots
The display with arrows helps for analyzing the fl ow directions. The velocity distribution shows the wake space, where the fl ow detaches from the profi le.
This is the stress result of the mini FEM analysis with NX Teamcenter.