
Real-time Wellbore Stability Analysis: An Observation from ...
Research ArticleSimulation of Wellbore Stability duringUnderbalanced Drilling Operation
Reda Abdel Azim
Chemical and Petroleum Engineering Department American University of Ras Al Khaimah Ras Al Khaimah UAE
Correspondence should be addressed to Reda Abdel Azim redaabdelazimaurakacae
Received 13 June 2017 Accepted 2 July 2017 Published 15 August 2017
Academic Editor Myung-Gyu Lee
Copyright copy 2017 Reda Abdel Azim This is an open access article distributed under the Creative Commons Attribution Licensewhich permits unrestricted use distribution and reproduction in any medium provided the original work is properly cited
The wellbore stability analysis during underbalance drilling operation leads to avoiding risky problems These problems include(1) rock failure due to stresses changes (concentration) as a result of losing the original support of removed rocks and (2) wellborecollapse due to lack of support of hydrostatic fluid column Therefore this paper presents an approach to simulate the wellborestability by incorporating finite element modelling and thermoporoelastic environment to predict the instability conditionsAnalytical solutions for stress distribution for isotropic and anisotropic rocks are presented to validate the presented modelMoreover distribution of time dependent shear stresses around the wellbore is presented to be compared with rock shear strengthto select appropriate weight of mud for safe underbalance drilling
1 Introduction
Very recent studies highlighted that the wellbore instabilityproblems cost the oil and gas industry above 500$ndash1000$million each year [1] The instability conditions are related torocks response to stress concentration around the wellboreduring the drilling operation That means the rock maysustain the induced stresses and the wellbore may remainstable without collapse or failure if rock strength is enormous[2] Factors that lead to formation instability are coming fromthe temperature effect (thermal) which is thermal diffusivityand the differences in temperature between the drilling mudand formation temperatureThis can be described by the factthat if the drilling mud is too cold this leads to decreasingthe hoop stressThese variations in hoop stress have the sameeffect of tripping while drilling which generates swab andsurge and may lead to both tensile and shear failure at thebottom of the well
The interaction between the drilling fluidswith formationfluid will cause pressure variation around the wellbore whichresults in time dependent stresses changes locally [3] There-fore in this paper the interaction between geomechanics andformation fluid [4] is taken into consideration to analyze timedependent rocks deformation around the wellbore
Another study shows that the two main effects causingcollapse failure are as follows (1) poroelastic influence ofequalized pore pressure at the wellbore wall and (2) thethermal diffusion between wellbore fluids and formationfluids [3ndash5]
Numerous scientists presented powerful models to simu-late the effect of poroelastic thermal and chemical effects byvarying values of formation pore pressure rock failure situa-tion and critical mud weight [3 6]These models mentionedthat controlling the component of the water present in thedrilling fluid results in controlling thewellbore stabilityMoreor less there are many parameters that could be controlledduring the drilling operation as unfavorable in situ condition[7 8] In addition mud weight (MW)equivalent circulationdensity (ECD) mud cake (mud filtrate) hole inclination anddirection and drillingtripping practice are considered themain parameters that affect wellbore mechanical instability[9 10]
The factors that affect the mechanical stability aremembrane efficiency water activity interaction betweenthe drilling fluid and shale formation the thermal expan-sion thermal diffusivity and the differences in temperaturebetween the drilling mud and formation temperature [11 12]
HindawiJournal of Applied MathematicsVolume 2017 Article ID 2412397 12 pageshttpsdoiorg10115520172412397
2 Journal of Applied Mathematics
This paper presents a realistic model to evaluate wellborestability and predict the optimum ECD window to preventwellbore instability problems
2 Derivation of Governing Equation forThermoporoelastic Model
The equations used to simulate thermoporoelastic couplingprocess are momentum mass and energy conservationThese equations are presented in detail in this section
21 Momentum Conservation The linear momentum bal-ance equation in terms of total stresses can be written asfollows
nabla sdot 120590 + 120588119892 = 0 (1)
where 120590 is the total stress 119892 is the gravity constant and 120588 isthe bulk intensity of the porous media The intensity shouldbe written for two phases liquid and solid as follows
120588 = 120593120588119897 + (1 minus 120593) 120588119904 (2)
Equation (1) can be written in terms of effective stress asfollows
nabla sdot (1205901015840 minus 119901119868) + 120588119892 = 0 (3)
where 120590 is the effective stress 119901 is the pore pressure and119868 is the identity matrix This equation for the stress-strainrelationship does not contain thermal effects and to includethe thermoelasticity the equation can be written as follows
1205901015840 = 119862 (120576 minus 120572119879Δ119879 times 119868) (4)
where 119862 is the fourth-order stiffness tensor of materialproperties 120576 is the total strain 120572119879 is the thermal expan-sion coefficient and Δ119879 is the temperature difference Theisotropic elasticity tensor 119862 is defined as
119862 = 120582120575119894119895120575119896119897 + 2119866120575119894119896120575119895119897 (5)
where 120575 is the Kronecker delta and 120582 is the Lame constant 119866is the shear modulus of elasticity The constitutive equationfor the total strain-displacement relationship is defined asfollows
120576 = 12 (nabla997888rarr119906 + (nabla997888rarr119906)119879) (6)
where 997888rarr119906 is the displacement vector and nabla is the gradientoperator
22 Mass Conservation The fluid flow in deformable andsaturated porous media can be described by the followingequation
119878119904 120597119901120597119905 + 120573nabla sdot (120597997888rarr119906120597119905 ) + nabla sdot 119902 minus 120572119879 120597119879120597119905 = 119876 (7)
where 120573 is the Biots coefficient and assumed to be = 10 in thisstudy 119901 is the pore fluid pressure 119879 is the temperature 120572119879 is
the thermal expansion coefficient 119902 is the fluid flux and 119876 isthe sinksource and 119878119904 is the specific storage which is definedby
119878119904 = (1 minus 120593119870119904 ) + (120593119870119897) (8)
where 119870119904 is the compressibility of solid and 119870119897 is thecompressibility of liquid The fluid flux term (119902) in the massbalance in (7) can be described by usingDarcyrsquos flow equationbecause the intensity has been assumed constant in this study
119902 = minus119896120583 (nabla119901 minus 120588997888rarr119892) (9)
where 119896 is the permeability of the domain The Cubic law isused in determining fracture permeability
23 Energy Conservation The energy balance equation forheat transport through porous media can be described asfollows
(120588119888119901)eff 120597119879120597119905 + nabla sdot 119902119879 = 119876119879 (10)
where 119902119879 is the heat flux119876119879 is the heat sinksource term and120588119888119901 is the heat storage and equals
(120588119888119901)eff = 120593 (119888119901120588)liquid + (1 minus 120593) (119888119901120588)solid (11)
In this study conduction and convection heat transfers areconsidered during numerical simulation The heat flux termin (10) can be written as
119902119879 = minus120582effnabla119879 + (119888119901120588)liquid V sdot 119879 (12)
where V is the velocity of the fluid The first term on theright hand side of (12) is the conduction term and the secondterm is the convective heat transfer term and 120582eff is theeffective heat conductivity of the porous medium which canbe defined as
120582eff = 120593120582liquid + (1 minus 120593) 120582solid (13)
24 Discretization of the Equations First one discretizesthe thermoporoelastic governing equations by using Greensrsquotheorem [13] to derive equations weak formulations Theweak form of mass energy and momentum balance in (1)(7) and (10) can be written as follows respectively
intΩ119908119878119904 120597119901120597119905 119889Ω + intΩ 119908119879120572nabla sdot
120597997888rarr119906120597119905 119889Ω + intΩ 119908120573120597119879120597119905
minus intΩnabla119908119879 sdot 119902119867119889Ω + int
Γ119902119867
119908 (119902119867 sdot 119899) 119889Γminus intΩ119908119876119867119889Ω = 0
(14)
Journal of Applied Mathematics 3
intΓ119889
119908119887119898119878119904 120597119901120597119905 119889Γ + intΓ119889 119908120572120597119887119898120597119905 119889Γ + intΓ119889 119908120573
120597119879120597119905 119889Γminus intΓ119889
nabla119908119879 sdot (119887ℎ119902119867) 119889Ω + intΓ119902119867
119908119887ℎ (119902119867 sdot 119899) 119889Γ+ intΓ119889
119908119902+119867119889Γ + intΓ119889
119908119902minus119867119889Γ = 0(15)
intΩ119908119888119901120588120597119879120597119905 119889Ω + intΩ 119908119888119901120588119902119867 sdot nabla119879119889Ωminus intΩnabla119908119879 sdot (minus120582nabla119879) 119889Ω + int
Γ119902
119879
119908 (minus120582nabla119879 sdot 119899) 119889Γminus intΩ119908119879119876119879119889Ω = 0
(16)
intΓ119889
119908119887119898119888119897119901120588119897 120597119879120597119905 119889Γ + intΓ119889 119908119888119897119901120588119897119887ℎ119902119867 sdot nabla119879119889Γ
minus intΓ119889
nabla119908119879 sdot (minus119887119898120582119897nabla119879) 119889Γ+ intΓ119902
119879
119908(minus119887119898120582119897nabla119879 sdot 119899) 119889Γ + intΓ119889
119908119902+119879119889Γ+ intΓ119889
119902minus119879119889Γ = 0
(17)
intΩnabla119904119908119879 sdot (1205901015840 minus 120572119901119868) 119889Ω minus int
Ω119908119879 sdot 120588119892119889Ω
minus intΓ119905
119908119879 sdot 997888rarr119905 119889Γ minus intΓ119889
119908+119879 sdot 997888rarr119905 +119889119889Γminus int119908minus119879 sdot 997888rarr119905 minus119889119889Γ = 0
(18)
where 119908 is the test function Ω is the model domain Γ isthe domain boundary 119905 is the traction vector superscripts+minus refer to the value of the corresponding parameters onopposite sides of the fracture surfaces respectively 119878119904 is thespecific storage 119899 is the porosity 119902119867 is the volumetric Darcyflux 120573 is the thermal expansion coefficient 119876119867 is the fluidsinksource term between the fractures 119902119879 is the heat flux119888119901 is the specific heat capacity 119887119898 and 119887ℎ are mechanicaland hydraulic fracture apertures 119876119879 is the heat sinksourceterm 120572 is the thermal expansion coefficient 120582 is the thermalconductivity and 119889 refers to the fracture plane
Then the Galerkin method is used to spatially discretizethe weak forms of (14) to (18) The primary variables of thefield problem are pressure 119901 temperature 119879 and displace-ment vector 119906 All of these variables are approximated byusing the interpolation function in finite element space asfollows
119906 = 119873119906119906119901 = 119873119901119901119879 = 119873119879119879
(19)
Table 1 Reservoir inputs used for validation of poroelastic numer-ical model using circular homogenous reservoir
Parameter ValuePoisson ratio 02Youngrsquos modulus 40GPaMaximum horizontal stress 40MPa (5800 psi)Minimum horizontal stress 379MPa (5500 psi)Wellbore pressure (119875119908) 689MPa (1000 psi)Initial reservoir pressure (119875119894) 379MPa (5500 psi)Fluid bulk module (119870119891) 25 GPaFluid compressibility 10 times 10minus5 Paminus1
Biotrsquos coefficient 10Fluid viscosity 3 times 10minus4 PasdotsMatrix permeability 9869 times 10minus18m2 (001md)Wellbore radius 01mReservoir outer radius 1000m
1000
800
600
400
200
010008006004002000
Y
ℎ
H
X
Figure 1 Two-dimensional circular reservoir shape used for valida-tion of poroelastic numerical model with 120590119867 = 399MPa and 120590ℎ =379MPa 119875119903 = 379MPa and Δ119901 = 31MPa
where119873 is the corresponding shape function and 119906 119901 and 119879are the nodal unknowns values
3 Validation of Poroelastic Numerical Model
The verification of poroelastic numerical model against ana-lytical solutions (see Appendix) is presented in this section Atwo-dimensional model of circular shaped reservoir with anintact wellbore of 1000m drainage radius and 01m wellboreradius is used (see Figure 1)The reservoir input data used arepresented in Table 1 The numerical model is initiated withdrained condition obtained by using Kirschrsquos problem [14]These conditions with the analytical solution equations for
4 Journal of Applied Mathematics
Input data
Mesh construction and element numbering
Solve for temperature at element corners only based on the
previous calculated pore pressure
Solve for displacement and pore pressure
Apply patch convergent method to
calculate stress distribution at nodes
Required time step
reached
Calculate stress
distribution at Gaussian
points
No
Iteration
Iterationconverge
Yes
No
Loop over each iteration required to
converge
Yes Print the results
lt 00001
Figure 2 Flow chart describes how the nodal unknowns are solved using iterations process
drained condition for the given pore pressure displacementand stresses [15 16] are presented in the Appendix Flowchart describes the solution process for pressure and dis-placement for poroelastic model and also for temperature forthermoporoelastic frameworks is presented in Figure 2 Thenumerical results obtained are plotted against the analyticalsolutions in Figures 3ndash6
For the verification purpose a number of assumptions aremade
Initial State In this study zero time (initial state) is assumedto represent drained situation in which pore pressure isstabilized
Boundary Conditions They are boundary conditions for theporoelastic model in this model
Rock and Fluid Properties In the numerical model Youngrsquosmodulus Poissonrsquos ratio porosity permeability and total sys-tem compressibility as well as viscosity of fluid are assumed
Journal of Applied Mathematics 5
0
1000
2000
3000
4000
5000
6000
Pore
pre
ssur
e (ps
i)
1 Day_Analytical1 Month_Analytical1 Year_Analytical
1 Day_Numerical1 Month_Numerical1 Year_Numerical
1 10 100 100001Radial position along x- axis (m)
1 hr_Analytical1 hr_Numerical
Figure 3 Pore pressure as a function of radius and time inporoelastic medium with 120590119867 = 5800 psi and 120590ℎ = 5500 psi 119875119903 =5500 psi 119875119908 = 1000 psi 119896119909 = 001md and 119896119910 = 001md
0
0002
0004
0006
0008
001
x d
ispla
cem
ent (
m)
1 10 100 100001Radial position along x-axis (m)
1 Day_Analytical1 Month_Analytical1 Year_Analytical
1 Day_Numerical1 Month_Numerical1 Year_Numerical
1 hr_Analytical1 hr_Numerical
Figure 4 119883-displacement along 119909-axis as a function of time inporoelastic medium with 120590119867 = 5800 psi and 120590ℎ = 5500 psi 119875119903 =5500 psi 119875119908 = 1000 psi 119896119909 = 001md and 119896119910 = 001md
to be independent of time and space in order to be consistentwith the analytical solutions
As can be seen from Figure 3 the numerical resultsmatch well with the analytical solutions Due to discontinuityof initial state and the first time step in the numericalprocedure a small mismatch is observed between numerical
0
1000
2000
3000
4000
5000
6000
7000
Radi
al st
ress
(Psi)
1 10 100 100001Radial position along x axis (m)
1 Day_Analytical1 Month_Analytical1 Year_Analytical
1 Day_Numerical1 Month_Numerical1 Year_Numerical
1 hr_Analytical 1 hr_Numerical
Figure 5 119883-component of radial stresses as a function of time inporoelastic medium with 120590119867 = 5800 psi and 120590ℎ = 5500 psi 119875119903 =5500 psi 119875119908 = 1000 psi 119896119909 = 001md and 119896119910 = 001md
4000
4500
5000
5500
6000
6500
7000
Hoo
p str
ess (
Psi)
1 10 100 100001Radial position along x-axis (m)
1 Day_Analytical1 Month_Analytical1 Year_Analytical
1 Day_Numerical1 Month_Numerical1 Year_Numerical
1 hr_Analytical 1 hr_Numerical
Figure 6 119883-component of tangential stresses as a function of timein poroelastic medium with 120590119867 = 5800 psi and 120590ℎ = 5500 psi 119875119903 =5500 psi 119875119908 = 1000 psi 119896119909 = 001md and 119896119910 = 001md
and analytical solutions for 119905 = 1 hr It is evident that foran initial drained condition and horizontal permeabilityanisotropy no directional dependence of the change in porepressure is observed despite the anisotropic horizontal stressstate
6 Journal of Applied Mathematics
3
2
1
00 05 1 15 2 25 3 35 4
Y
X
Figure 7 Pore pressure contour map after 1 hr of fluid production(for near-wellbore region) with 120590119867 = 5800 psi and 120590ℎ = 5500 psi 119875119903= 5500 psi 119875119908 = 1000 psi 119896119909 = 001md and 119896119910 = 001md
In Figure 4 the numerical results for displacement have asmall mismatch with the analytical solutions This is due tothe method (Patch Recovery Method) that has been used todistribute initial reservoir displacement and calculating thechange in in situ stresses with time
In Figure 5 the numerical results show a good agreementwith the exact solutions for different time and orientationsFor all cases as expected 120590119909 approaches the maximumhorizontal in situ stress (5800 psi) at far field (away fromwellbore) The discontinuity of 120590119909 at wellbore wall is dueto the imposed pressure boundary condition It is assumedthat wellbore pressure is equal to the reservoir pressure atzero time in order to simulate drained initial state It is alsoobserved that as time progresses the size of the area which isaffected by the change in 120590119909 increases This is due to changein pore pressure
In Figure 6 numerical results of 120590119910 match well with thatof the analytical solutions for different time As expected 120590119910approaches the minimum horizontal in situ stress (5500 psi)at far field (away from wellbore)
The results of pore pressure and effective stress after onehour of production are presented in Figures 7ndash9 in reservoirentire region These figures (Figures 7ndash9) clarify how thepressure and stresses are changing from the wall of thewellbore to the reservoir boundary
4 Failure Criteria
Shear failure will occur if
12059010158403 lt minus1198790 (20)
where 12059010158403 the lowest principle is effective stress and 1198790 is therock tensile strength
Y
X
08
06
04
02
01080604020
Figure 8 119883-component of radial stresses contour map after 1 hr offluid production (for near-wellbore region) with 120590119867 = 5800 psi and120590ℎ = 5500 psi 119875119903 = 5500 psi 119875119908 = 1000 psi 119896119909 = 001md and 119896119910 =001md
Y
X
08
06
04
02
01080604020
Figure 9119883-component of tangential stresses contourmap after 1 hrof fluid production (for near-wellbore region) with 120590119867 = 5800 psiand 120590ℎ = 5500 psi 119875119903 = 5500 psi 119875119908 = 1000 psi 119896119909 = 001md and 119896119910= 001md
Using Mohr-Coulomb criteria shear failure criteria aremet when
120591net = 12 cos120593 (12059010158401 (1 minus sin120593) minus 12059010158403 (1 + sin120593)) gt 1198780 (21)
where 12059010158401 is the highest principle effective stress 120591net is thenet shear stress 120593 is the angle of internal friction and 1198780 isthe rock shear strength Once the maximum principle stresssurpasses the rock shear strength rock failure takes place atthewellboreTherefore evaluating the highest principle stress
Journal of Applied Mathematics 7
Overbalancedsupport pressure
Underbalanced no support pressure
11
33PwPw
Shear yielding
Figure 10 Shear yielding occurs for underbalanced conditions due to the absence of a support pressure on the borehole wall [16]
is important criterion to predict rock failure for analysis ofwellbore stability [16]
Drilling with underbalanced technique where thebottom-hole pressure is lower than the formation porepressure regularly promotes borehole instability Thus itis important to design and determine the ideal range ofthe bottom-hole pressure during underbalanced drillingoperation to avoid generating hydraulic fractures differentialsticking or undesirable level of formation damage [17] (seeFigure 10)
5 Case Study
This test case has been taken from a field located in southernpart of Iran The operator is considered a well drilled at anapproximate depth of 4000 ft the recorded pore pressuregradient from the DST test analysis is 77 lbgal The rockmechanical data used for wellbore stability analysis aredetermined from triaxial test on core samples and presentedin Table 2 The wellbore stability analysis has been executedusing underbalance technique Therefore the reduction inpore pressure during the drilling process will directly affectthe horizontal and shear stresses To avoid either loss ofcirculation problems or borehole failure the mud pressureshould be less than the formation fracture pressure andgreater than its collapse pressure Therefore it is mandatoryto predict the changes of stresses values as reservoir pressuredrops In this case study the mud weight recommended to beused is 5 lbgal
To do this analysis a finite element mesh has beengenerated as the one presented in Figure 1 and it was refinedaround the wellbore The boundary conditions have beenassigned to the model and Mohr-Coulomb criteria [18] areused for the simulation to predict the stresses and porepressure distribution with time around the wellbore
6 Results and Discussion
Breakout shear failure occurred during underbalance drillingoperation therefore it is very important to predict the failureat the wellbore wall using failure criteria Because of pore
Table 2 Case study input data
Mechanical parametersPoisson ratio (]) 02Bulk Youngrsquos modulus (119864) 44GPaMaximum horizontal stress (120590119867) 168MPa (2436 psi)Minimum horizontal stress (120590ℎ) 14MPa (2030 psi)Wellbore pressure (119875119908) 689MPa (1000 psi)Hydraulic parametersInitial reservoir pressure (119875119894) 111MPa (1610 psi)Fluid bulk module (119870119891) 045GPaFluid compressibility 10 times 10minus5 Paminus1
Biotrsquos coefficient 10Physical parametersFluid viscosity 3 times 10minus4 PasdotsFluid density 1111 kgm3
Matrix permeability 9869 times 10minus18m2(001md)
Porosity (120601) 01Wellbore radius 015mReservoir outer radius 1000mFormation temperature (119879119891) 375 oKDrilling mud temperature (119879119898) 330 oKThermal osmosis coefficient (119870119879) 1 times 10minus11m2s KThermal expansion coefficient of fluid (120572119891) 3 times 10minus4 1KThermal diffusivity (119862119879) 11 times 10minus6m2sThermal expansion coefficient of solid (120572119904) 18 times 10minus5 1K
pressure dissipation the failure becomes time dependent asthe net shear stress increases with time at the borehole wall
It can be seen from Figure 11 that the net shear stress isthe lowest for the time before starting of the underbalancedrilling operationThen at thewellborewall it can be noticedthat the net shear stress drops suddenly after 4 s of the drillingoperation In addition at this time the net shear stress valueis higher than net shear stress for long time of the drilling
8 Journal of Applied Mathematics
Initial
10 days
minus1
0
1
2
3
4
5
6
7
Net
shea
r stre
ss (M
Pa)
02 025 03 035 04 045 05015Position on the y-axis (m)
30 hr8min
30 s75 s4 s
Figure 11 119884-component of net shear stresses as a function of timein poroelastic medium with 120590119867 = 168MPa and 120590ℎ = 14MPa 119875119903 =11MPa 119875119908 = 97MPa 119896119909 = 001md 119896119910 = 001md and 119879119898 = 330K
0
2
4
6
8
10
12
14
16
Max
imum
hor
izon
tal s
tress
(MPa
)
02 025 03 035 04 045 05015Position on the y-axis (m)
Initial
10 days30 hr8min
30 s75 s4 s
Figure 12 119884-component of maximum horizontal stresses as afunction of time in poroelastic medium with 120590119867 = 168MPa and 120590ℎ= 14MPa 119875119903 = 11MPa 119875119908 = 97MPa 119896119909 = 001md 119896119910 = 001md and119879119898= 330K
operation This effect of short time of drilling operation onthe net shear stress value is uncertain as this time may betoo short to allow failure to be devolved But in this casestudy by comparing the net shear stress value with the rockshear strength we found its value lower than the rock shearstrength (14MPa) This proves that the failure will not occurusing mud weight of 5 lbgal Figures 12 13 and 14 show 119910-stresses at the wellbore wall
Distribution of the net shear stress along 119910-axis for thecooling (119879119898 lt 119879119891) effect of mud during the underbalancedrilling operation is presented in Figure 15 From this figure
minus3
minus2
minus1
0
1
2
3
Min
imum
hor
izon
tal s
tress
(MPa
)
02 025 03 035 04 045 05015Position on the y-axis (m)
Initial
10 days30 hr8min
30 s75 s4 s
Figure 13 119884-component of minimum horizontal stresses as afunction of time in poroelastic medium with 120590119867 = 168MPa and 120590ℎ= 14MPa 119875119903 = 11MPa 119875119908 = 97MPa 119896119909 = 001md 119896119910 = 001md and119879119898 = 330K
Y
X
05
04
03
02
01
005040302010
Figure 14 119884-component of net shear stresses at 119905 = 30 s inporoelastic medium with 120590119867 = 168MPa and 120590ℎ = 14MPa 119875119903 =11MPa 119875119908 = 97MPa 119896119909 = 001md 119896119910 = 001md and 119879119898 = 330K
it can be seen that the net shear stress accumulated at thewellbore wall and increases the probability of failure of thewell If the breakout occurs it will initiate near the wellborenot at the wall bore wall (see Figure 15) If there is a breakoutthe shear forces will cause rock to fall into the wellboreand in this case the well status becomes unstable (wellboreinstability) But in this case study the net shear stress istoo low to cause failure and this well will not suffer frominstability problems even for long drilling period Figures 1617 and 18 show 119910-stresses at the wellbore wall with the effectof mud cooling
The cooling process near the wellbore can alter thestresses significantly and leads to increasing the total stressesand the pore pressure drop inside the formation those
Journal of Applied Mathematics 9
02 025 03 035 04 045 05015Position on the y-axis (m)
minus2
minus1
0
1
2
3
4
5
6
Net
shea
r stre
ss (M
Pa)
Initial
10 days30 hr8min
30 s75 s4 s
Figure 15 119884-component of net shear stresses as a function of timein poroelastic medium with 120590119867 = 168MPa and 120590ℎ = 14MPa 119875119903 =11MPa 119875119908 = 97MPa 119896119909 = 001md 119896119910 = 001md and 119879119898 = 300K
02 025 03 035 04 045 05015Position on y-axis (m)
minus3
minus2
minus1
0
1
2
3
4
Min
imum
hor
izon
tal s
tress
(Mpa
)
Initial
10 days30 hr8min
30 s75 s4 s
Figure 16 119884-component of minimum horizontal stresses as afunction of time in poroelastic medium with 120590119867 = 168MPa and 120590ℎ= 14MPa 119875119903 = 11MPa 119875119908 = 97MPa 119896119909 = 001md 119896119910 = 001md and119879119898 = 300K
increasing in total stresses and pore pressure cause increasingin the effective stresses near the wellbore (see Figures 1517 and 18) As time increases the mud temperature willequilibrate with its surroundings so that the formationshigher in the section being drilled are subjected to theincreased temperature of the mud Heating process leads toreducing the pore pressure and net shear stresses near thewellbore (see Figures 11 and 13)
The formation cooling increases the pore pressure (seeFigure 19) near the wellbore wall at the beginning of thedrilling operation (for 4 s 75 s and 30 s) This is due tothermal osmosis process that results in fluid movement out
0
2
4
6
8
10
12
14
16
Max
imum
hor
izon
tal s
tress
(Mpa
)
02 025 03 035 04 045 05015Position on y-axis (m)
Initial
10 days30 hr8min
30 s75 s4 s
Figure 17 119884-component of maximum horizontal stresses as afunction of time in poroelastic medium with 120590119867 = 168MPa and 120590ℎ= 14MPa 119875119903 = 11MPa 119875119908 = 97MPa 119896119909 = 001md 119896119910 = 001md and119879119898 = 300K
02 025 03 035 04 045 05015Position along y axis (m)
969810
102104106108
11112114116
Pore
pre
ssur
e (M
pa)
Initial
10 days30 hr8min
30 s75 s4 s
Figure 18 Pore pressure as a function of radius and time inporoelastic medium with 120590119867 = 168MPa and 120590ℎ = 14MPa 119875119903 =11MPa 119875119908 = 97MPa 119896119909 = 001md 119896119910 = 001md and 119879119898 = 300K
of the formation Then the transient response causes porepressure on the 119910-axis to decrease
Figure 20 shows a relationship between the mud weightand accumulated shear stress around the wellbore It can beseen from the figure that with using mud weight of 75 ppgthe net shear stress (16MPa) becomes greater than the rockstrength (14MPa) Therefore to avoid wellbore breakoutsMohr-Coulomb failure criterion indicates that the safe mudweight used in this case study is between 55 and 75 ppg
10 Journal of Applied Mathematics
Table 3 General description of the problem
Inner boundary Outer boundary Wellbore pressure Pore pressure Maximum horizontalstress
Minimum horizontalstress
119903119908 119903119890 = infin 119875119908 119875 = 119875119894119894119899119905 120590119867 120590ℎ
Y
X
05
04
03
02
01
005040302010
Figure 19 119884-component of net shear stresses at 119905 = 30 s inporoelastic medium with 120590119867 = 2436 psi and 120590ℎ = 2030 psi 119875119903 =1610 psi 119875119908 = 1421 psi 119896119909 = 001md 119896119910 = 001md and 119879119898 = 300K
Net
shea
r stre
ss (M
Pa)
02468
1012141618
45 5 55 6 65 7 75 84Mud weight (ppg)
Figure 20 Relationship between mud weight and net shear stress(iteration process)
7 Conclusion
An integrated thermoporoelastic numerical model has beenpresented in this paper to predict the stresses distribution andthe instability problem around the wall of the wellbore Themodel has been validated against the analytical model
Behaviour of the stresses around the wellbore in under-balance drilling operation is very sensitive to the mudweight and mechanical properties of the rock as well Thepore pressure and stresses around the wellbore are signifi-cantly affected by the thermal effects Thus when the mudtemperature is lower than the formation temperature thepore pressure changes and the net shear stresses values areincreased around the wellbore which increase the probability
ℎ
ℎ
HH
Pw
P = PCHCN
Figure 21 Schematic of the problem
of occurrence of the instability problem if its values becomegreater than the rock shear strength
Appendix
Elastic Deformation of a Pressurized Wellborein a Drained Rock Subjected to Anisotropic InSitu Horizontal Stress (Kirschrsquos Problem)
General description of the problem is tabulated in Table 3and schematic of the problem is illustrated in Figure 21 Thisproblem accounts for the concept of effective stress
(i) Analytical pressure is
119901 (119903 119905) = 119901119894 + (119901119908 minus 119901119894) 119892 (119903 119905) (A1)
(ii) Analytical radial stress is
120590119903119903 (119903 120579) = 120590119867 + 120590ℎ2 (1 minus 11990321199081199032 )
+ 120590119867 minus 120590ℎ2 (1 + 311990341199081199034 minus 411990321199081199032 ) cos (2120579)
+ 119901119908 11990321199081199032 + 2120578 (119901119908 minus 119901119894) 119903119908119903 ℎ (119903 119905)
(A2)
Journal of Applied Mathematics 11
(iii) Analytical tangential stress is
120590120579120579 (119903 120579) = 120590119867 + 120590ℎ2 (1 + 11990321199081199032 )
minus 120590119867 minus 120590ℎ2 (1 + 311990341199081199034 ) cos (2120579)
minus 119901119908 11990321199081199032
minus 2120578 (119901119908 minus 119901119894) (119903119908119903 ℎ (119903 119905) + 119892 (119903 119905)) 119892 (119903 119904) = 1198700 (120585)1199041198700 (120573) ℎ (119903 119904) = 1119904 [ 1198701 (120585)1205731198700 (120573) minus
1199031199081199031198701 (120573)1205731198700 (120573)]
(A3)
(iv) Radial displacement is
119906119903 (119903 120579) = 1199034119866 (1205901015840119867 + 1205901015840ℎ)(1 minus 2V +11990321199081199032 )
+ 1199034119866 (1205901015840119867 minus 1205901015840ℎ)times (11990321199081199032 (4 minus 4V minus
11990321199081199032 ) + 1) cos (2120579)
minus 119901101584011990821198661199032119908119903 minus 120578119866119903119908 (119901119908 minus 119901119894) ℎ (119903 119905)
(A4)
(v) Tangential displacement is
119906120579 (119903 120579) = minus 1199034119866 (1205901015840119867 minus 1205901015840ℎ)sdot (11990321199081199032 (2 minus 4V minus
11990321199081199032 ) + 1) sin (2120579) (A5)
(vi) Analytical temperature is
119879 (119903 119905) = 119879119900 + (119879119908 minus 119879119900) 119871minus1 11199041198700 (119903radic1199041198880)1198700 (119903119908radic1199041198880) (A6)
where 119892 is the Laplace transformation of 119892 and
120585 = 119903radic 119904119888 120573 = 119903119908radic119904119888
(A7)
and1198700 and1198701 are the first-order modified Bessel function ofthe first and second kind Laplace inversion is solved using themethod presented byDetournay andCheng [15]The solutionin time is achieved by the following formula
The Laplace transformation can be inverted using
119891 (119903 119905) asymp ln 2119905119873sum119899=1
119862119899 asymp119891 (119903 119899 ln 2119905 ) (A8)
where (ln) represents the natural logarithm and
119862119899 = (minus1)119899+1198732sdot min(1198991198732)sum119896=lfloor(119899+1)2rfloor
1198961198732 (2119896)(1198732 minus 119896)119896 (119896 minus 1) (119899 minus 119896) (2119896 minus 119899) (A9)
Conflicts of Interest
The author declares that he has no conflicts of interest
References
[1] S Rafieepour C Ghotbi and M R Pishvaie ldquoThe effects ofvarious parameters onwellbore stability during drilling throughshale formationsrdquo Petroleum Science and Technology vol 33 no12 pp 1275ndash1285 2015
[2] GChenM E ChenevertMM Sharma andMYu ldquoA study ofwellbore stability in shales including poroelastic chemical andthermal effectsrdquo Journal of Petroleum Science and Engineeringvol 38 no 3-4 pp 167ndash176 2003
[3] H Roshan and S S Rahman ldquoAnalysis of pore pressure andstress distribution around awellbore drilled in chemically activeelastoplastic formationsrdquoRockMechanics and Rock Engineeringvol 44 no 5 pp 541ndash552 2011
[4] M Hodge K L Valencia Z Chen and S S Rahman ldquoAnalysisof time-dependent wellbore stability of underbalanced wellsusing a fully coupled poroelastic modelrdquo in Proceedings of theSPE Annual Technical Conference and Exhibition ATCE 2006Focus on the Future pp 3274ndash3278 September 2006
[5] M Gomar I Goodarznia and S R Shadizadeh ldquoA transientfully coupled thermo-poroelastic finite element analysis ofwellbore stabilityrdquo Arabian Journal of Geosciences vol 8 no 6pp 3855ndash3865 2014
[6] M Aslannezhad A Khaksar manshad and H Jalalifar ldquoDeter-mination of a safemudwindowand analysis ofwellbore stabilityto minimize drilling challenges and non-productive timerdquoJournal of Petroleum Exploration and Production Technologyvol 6 no 3 pp 493ndash503 2016
[7] S Salehi G Hareland and R Nygaard ldquoNumerical simulationsof wellbore stability in under-balanced-drillingwellsrdquo Journal ofPetroleum Science and Engineering vol 72 no 3-4 pp 229ndash2352010
[8] W K Heiduc and S-W Wong ldquoHydration swelling of water-absorbing rocks a constitutive modelrdquo International Journal forNumerical and Analytical Methods in Geomechanics vol 20 no6 pp 403ndash430 1996
[9] P McLellan and C Hawkes ldquoBorehole stability analysis forunderbalanced drillingrdquo Journal of Canadian Petroleum Tech-nology vol 40 no 5 pp 31ndash38 2001
[10] M R McLean and M A Addis ldquoWellbore stability theeffect of strength criteria on mud weight recommendationsrdquoin Proceedings of the SPE Annual Technical Conference andExhibition pp 9ndash17 September 1990
12 Journal of Applied Mathematics
[11] M F Kanfar Z Chen and S S Rahman ldquoRisk-controlledwellbore stability analysis in anisotropic formationsrdquo Journal ofPetroleum Science and Engineering vol 134 pp 214ndash222 2015
[12] T Ma and P Chen ldquoA wellbore stability analysis model withchemical-mechanical coupling for shale gas reservoirsrdquo Journalof Natural Gas Science and Engineering vol 26 pp 72ndash98 2015
[13] S De and K J Bathe ldquoThe method of finite spheresrdquo Computa-tional Mechanics vol 25 no 4 pp 329ndash345 2000
[14] G Kirsch ldquoTheory of elasticity and application in strength ofmaterialsrdquo Zeitschrift des Vereins Deutscher Ingenieure vol 42no 29 pp 797ndash807 1898
[15] E Detournay and A-D Cheng ldquoPoroelastic response of a bore-hole in a non-hydrostatic stress fieldrdquo International Journal ofRockMechanics andMining Sciences amp Geomechanics Abstracts1988
[16] H Stehfest ldquoAlgorithm 368 numerical inversion of Laplacetransformsrdquo Communications of the ACM vol 13 no 1 pp 47ndash49 1970
[17] B S Aadnoy and M E Chenevert ldquoStability of highly inclinedboreholes (includes associated papers 18596 and 18736)rdquo SPEDrilling Engineering vol 2 no 4 pp 364ndash374 1987
[18] R T Ewy ldquoWellbore-stability predictions by use of a modifiedlade criterionrdquo SPE Drilling and Completion vol 14 no 2 pp85ndash91 1999
Submit your manuscripts athttpswwwhindawicom
Hindawi Publishing Corporationhttpwwwhindawicom Volume 2014
MathematicsJournal of
Hindawi Publishing Corporationhttpwwwhindawicom Volume 2014
Mathematical Problems in Engineering
Hindawi Publishing Corporationhttpwwwhindawicom
Differential EquationsInternational Journal of
Volume 2014
Applied MathematicsJournal of
Hindawi Publishing Corporationhttpwwwhindawicom Volume 2014
Probability and StatisticsHindawi Publishing Corporationhttpwwwhindawicom Volume 2014
Journal of
Hindawi Publishing Corporationhttpwwwhindawicom Volume 2014
Mathematical PhysicsAdvances in
Complex AnalysisJournal of
Hindawi Publishing Corporationhttpwwwhindawicom Volume 2014
OptimizationJournal of
Hindawi Publishing Corporationhttpwwwhindawicom Volume 2014
CombinatoricsHindawi Publishing Corporationhttpwwwhindawicom Volume 2014
International Journal of
Hindawi Publishing Corporationhttpwwwhindawicom Volume 2014
Operations ResearchAdvances in
Journal of
Hindawi Publishing Corporationhttpwwwhindawicom Volume 2014
Function Spaces
Abstract and Applied AnalysisHindawi Publishing Corporationhttpwwwhindawicom Volume 2014
International Journal of Mathematics and Mathematical Sciences
Hindawi Publishing Corporationhttpwwwhindawicom Volume 201
The Scientific World JournalHindawi Publishing Corporation httpwwwhindawicom Volume 2014
Hindawi Publishing Corporationhttpwwwhindawicom Volume 2014
Algebra
Discrete Dynamics in Nature and Society
Hindawi Publishing Corporationhttpwwwhindawicom Volume 2014
Hindawi Publishing Corporationhttpwwwhindawicom Volume 2014
Decision SciencesAdvances in
Journal of
Hindawi Publishing Corporationhttpwwwhindawicom
Volume 2014 Hindawi Publishing Corporationhttpwwwhindawicom Volume 2014
Stochastic AnalysisInternational Journal of
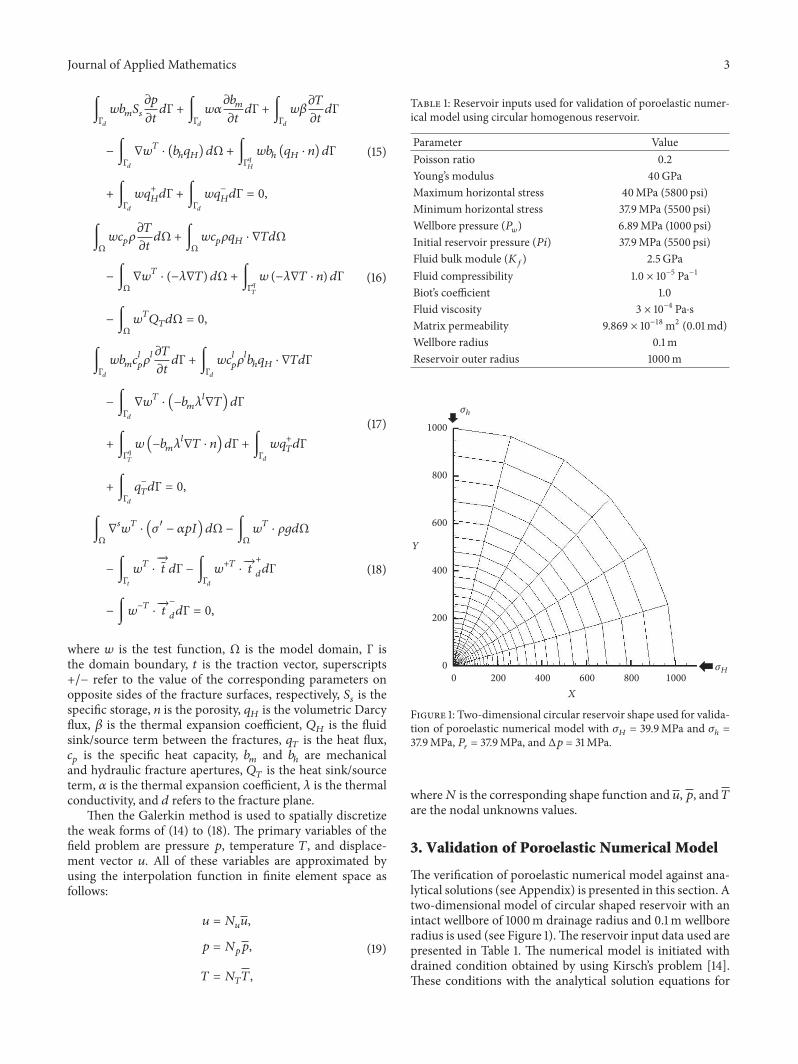
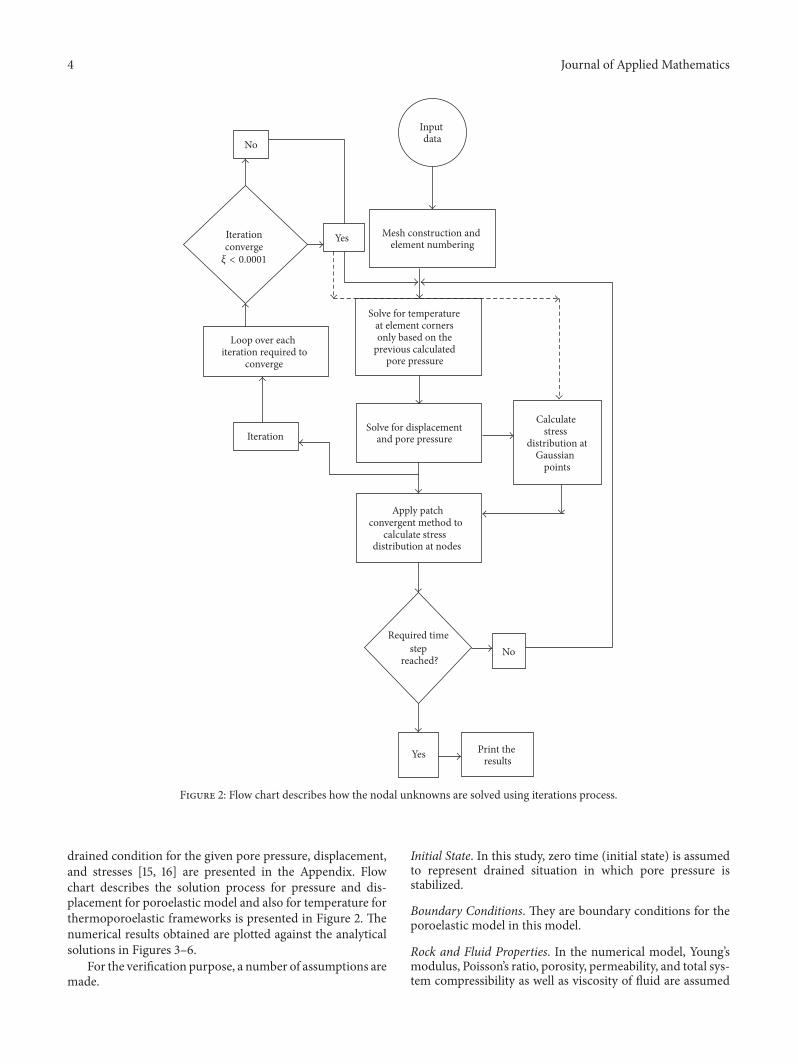
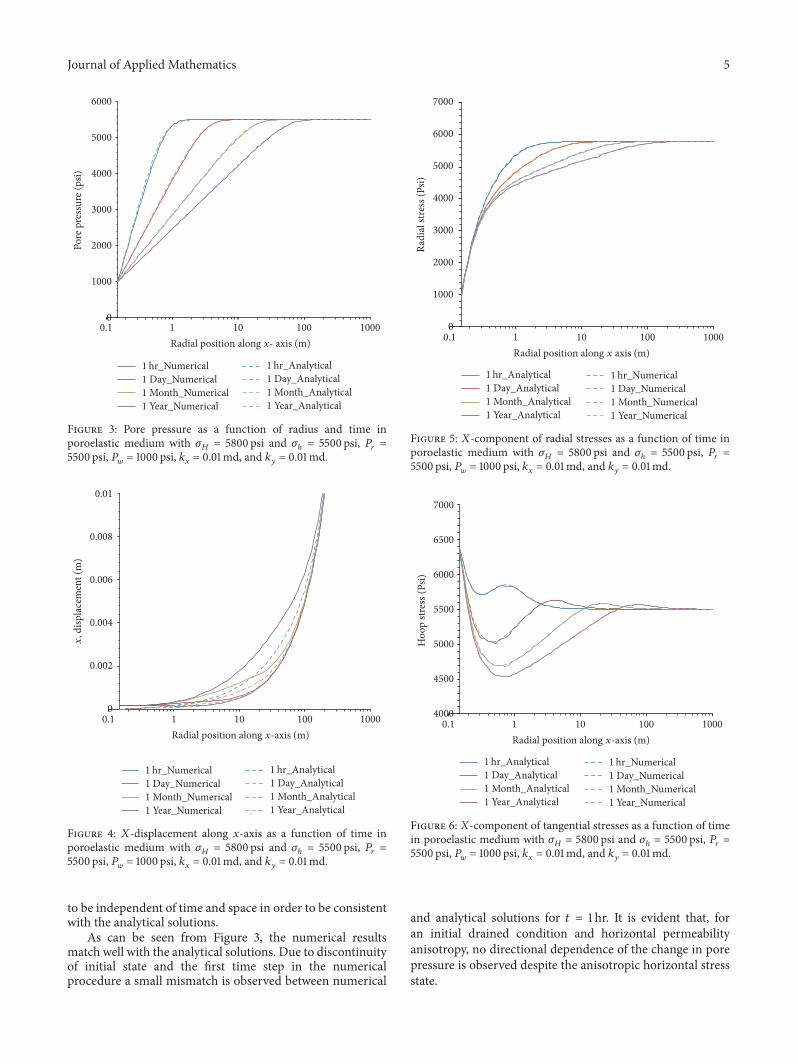
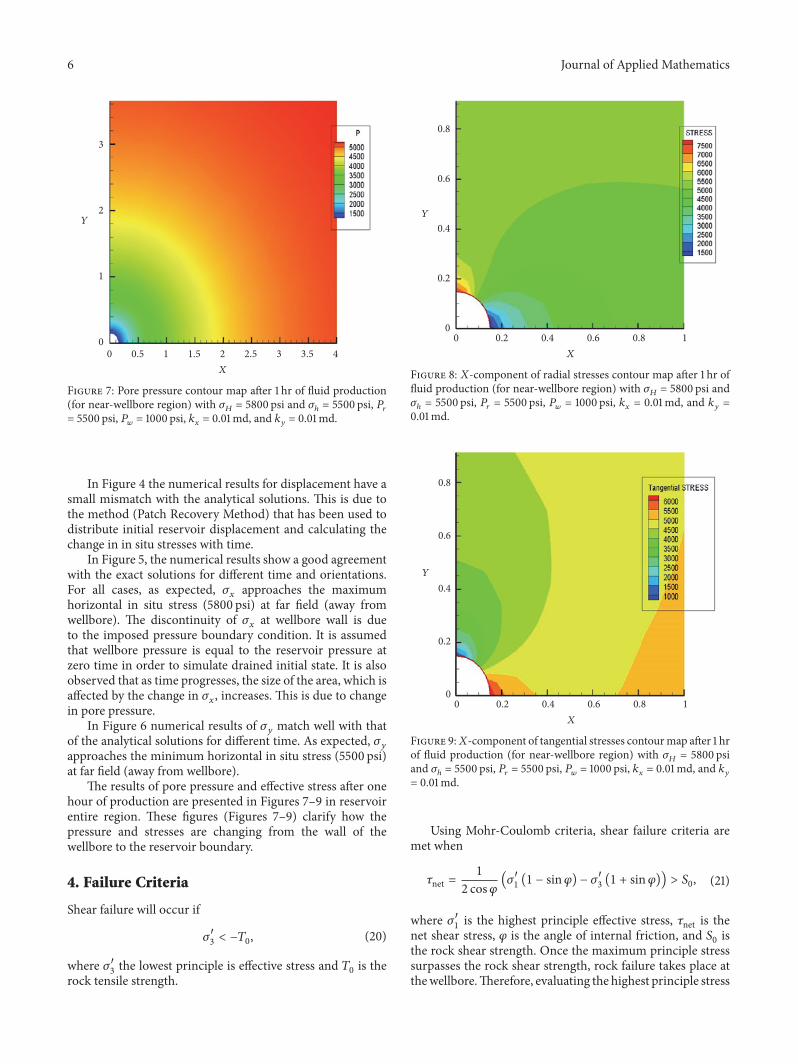
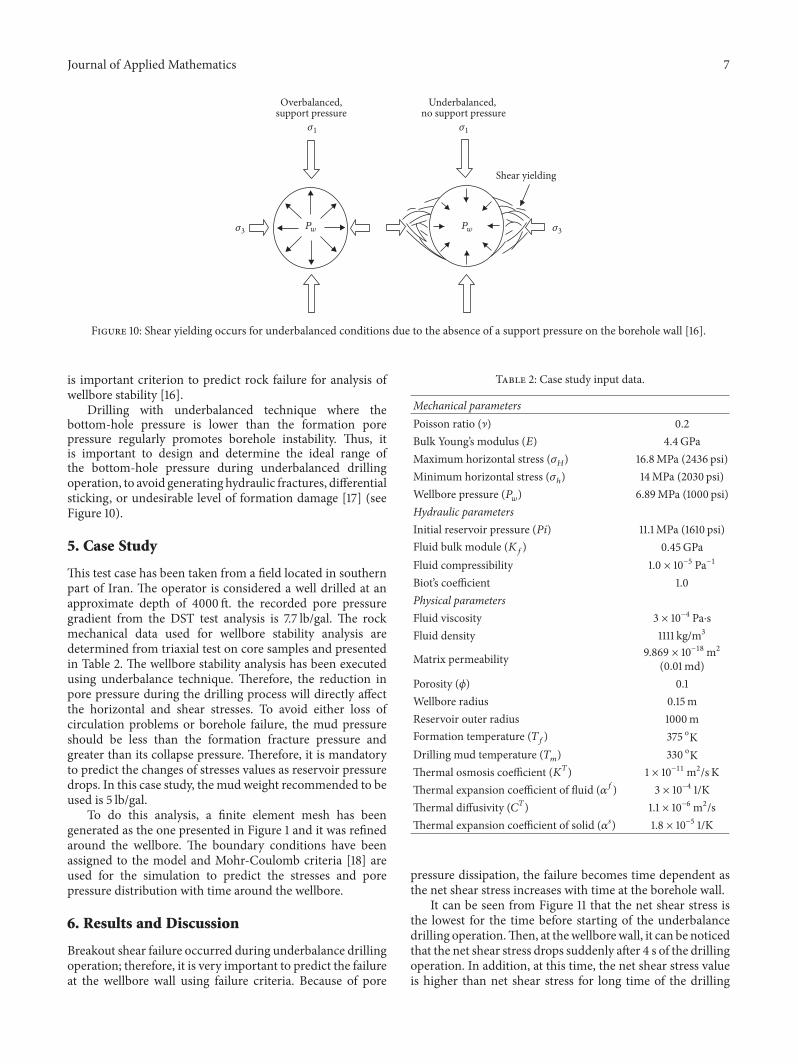
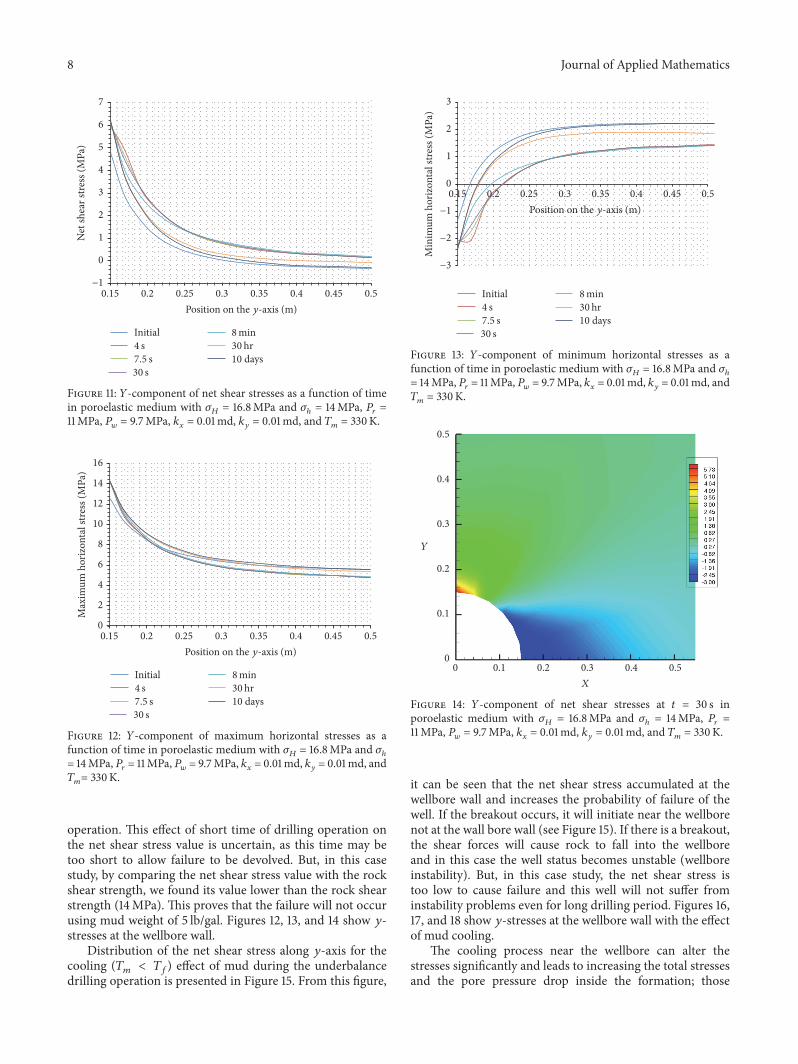
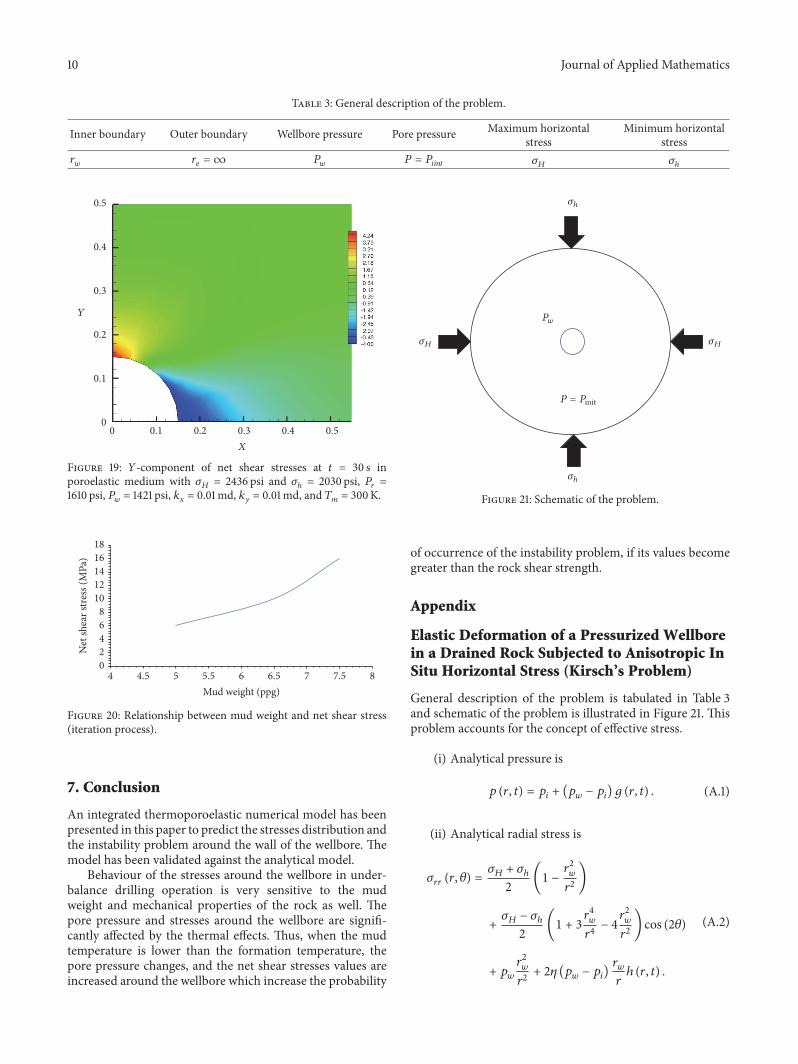
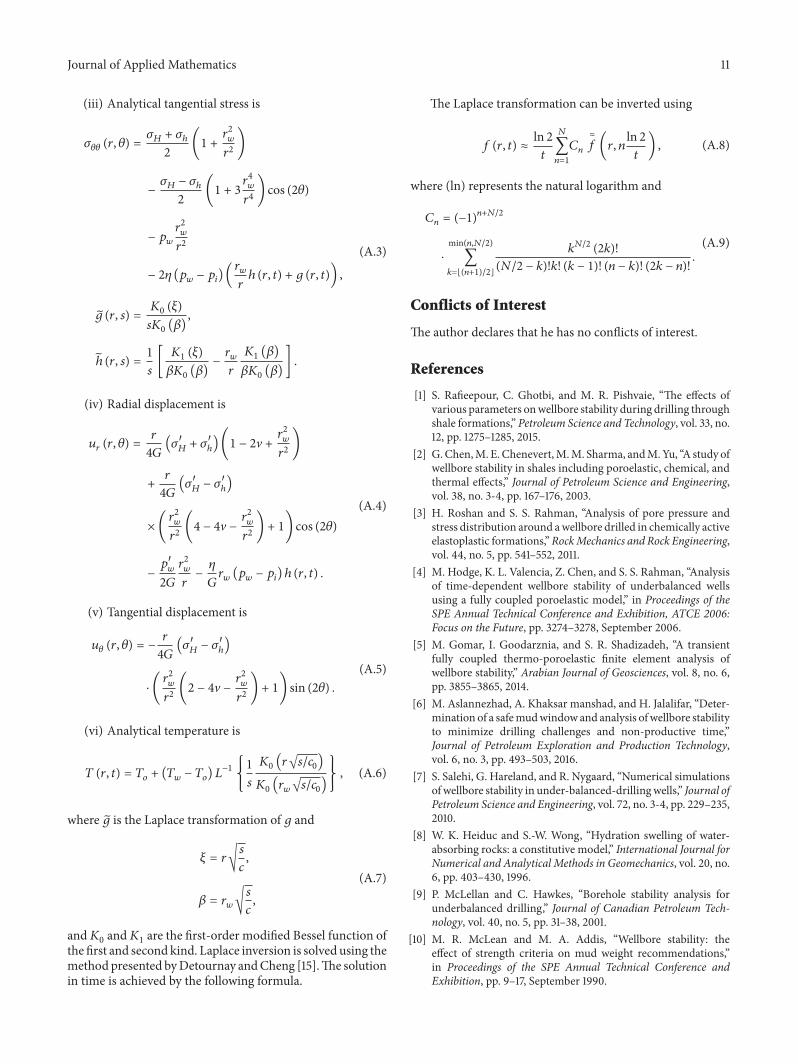
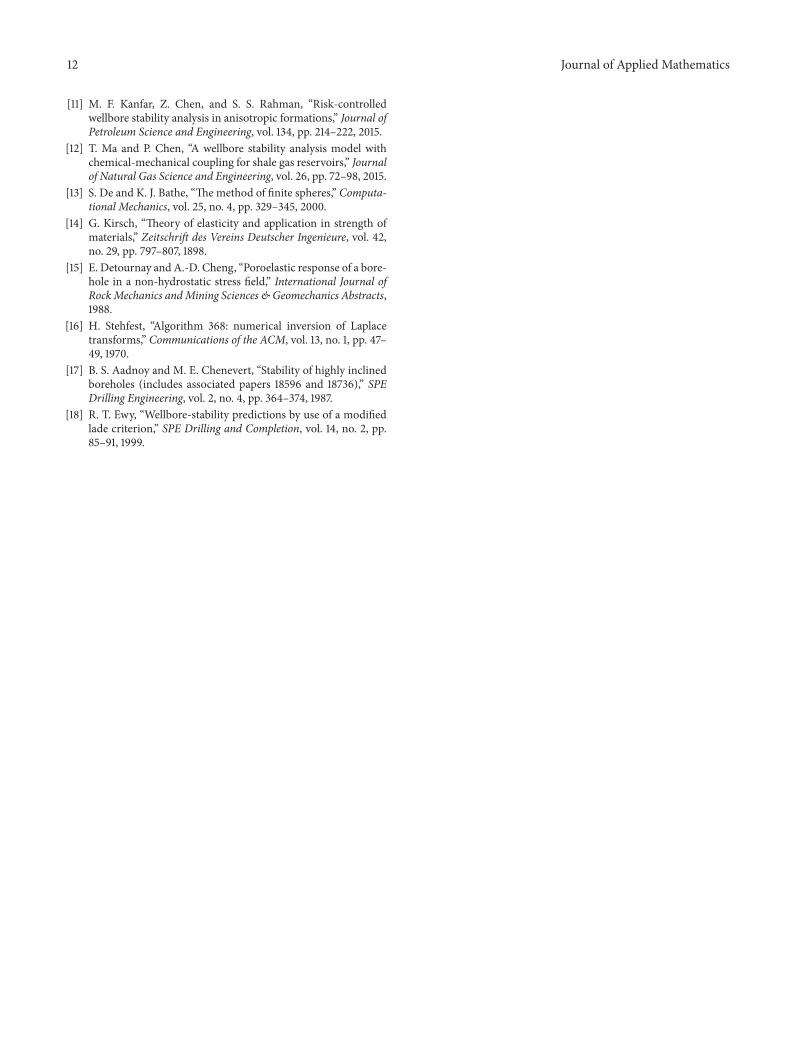