Simulation of the interaction of macro-particles with the LHC proton beam
13
Simulation of the interaction of macro-particles with the LHC proton beam Zhao Yang, EPFL 14.6.2011
-
Upload
dai-herring -
Category
Documents
-
view
28 -
download
2
description
Simulation of the interaction of macro-particles with the LHC proton beam. Zhao Yang, EPFL 14.6.2011. Equation of motion. Introduction. The purpose of simulation. Study the influence of magnetic field/mass of particle/number of protons in the - PowerPoint PPT Presentation
Transcript of Simulation of the interaction of macro-particles with the LHC proton beam

Simulation of the interaction of macro-particles with the LHC proton beam
Zhao Yang, EPFL14.6.2011
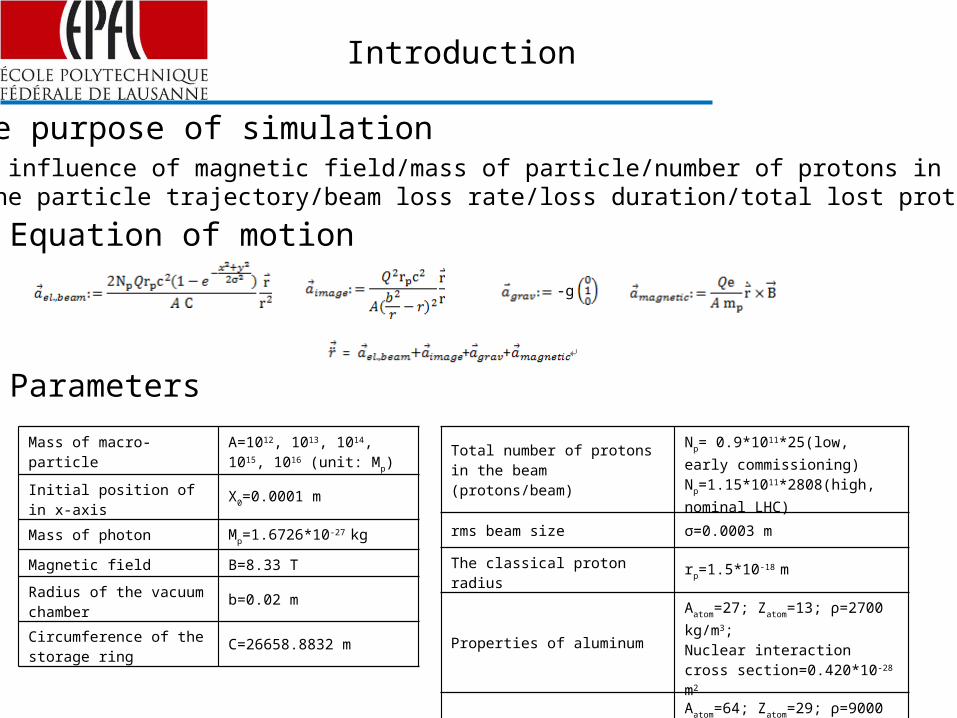
Equation of motion
Parameters
Introduction
The purpose of simulationStudy the influence of magnetic field/mass of particle/number of protons in the beam on the particle trajectory/beam loss rate/loss duration/total lost protons.
Mass of macro-particle A=1012, 1013, 1014, 1015, 1016 (unit: Mp)
Initial position of in x-axis X0=0.0001 m
Mass of photon Mp=1.6726*10-27 kg
Magnetic field B=8.33 T
Radius of the vacuum chamber b=0.02 m
Circumference of the storage ring C=26658.8832 m
Total number of protons in the beam (protons/beam)
Np= 0.9*1011*25(low, early commissioning)Np=1.15*1011*2808(high, nominal LHC)
rms beam size σ=0.0003 m
The classical proton radius rp=1.5*10-18 m
Properties of aluminumAatom=27; Zatom=13; ρ=2700 kg/m3;Nuclear interaction cross section=0.420*10-28 m2
Properties of copperAatom=64; Zatom=29; ρ=9000 kg/m3;Nuclear interaction cross section=0.553*10-28 m2
-g

Aluminum Macro-particle
Influence of magnetic field on particle trajectory. Np=0.9*1011*25A equals to 1012~1015, B equals to 0 T, 8.33 T and 80 T (Blue, red and green)
The X-Y trajectory gets close to the Y-axis as the mass of particle decreases and the magnetic field intensity is increased. The strong magnetic field may result in a cyclotron oscillation of the particle. The period of this oscillation is reduced for increasing magnetic field and smaller particle mass.
0 .02 0 .01 0 .01 0 .02X co ord inate m
0 .02
0 .01
0 .01
0 .02Y co ord inate m
0 .02 0 .01 0 .01 0 .02X co ord inate m
0 .02
0 .01
0 .01
0 .02Y co ord inate m
0 .02 0 .01 0 .01 0 .02X co ord inate m
0 .02
0 .01
0 .01
0 .02Y co ord inate m
0 .02 0 .01 0 .01 0 .02X co ord inate m
0 .02
0 .01
0 .01
0 .02Y co ord inate m
A=1012 A=1013 A=1014 A=1015

Aluminous Macro-particle
Influence of magnetic field on beam loss rate. Np=0.9*1011*25A equals to 1012~1015, B equals to 0 T, 8.33 T and 80 T (Blue, red and green)
The maximum of loss rate of the 1st crossing is independent of magnetic field; it increases with increasing mass A.
The maximum of loss rate of the 2nd crossing increases with increasing magnetic field strength. It decreases with increasing mass at normal magnetic field strength.
0 .02 0 .04 0 .06 0 .08 0 .10 0 .12 0 .14t ime s
60
50
40
30
20
10
0
logbeamlossrate 0 .02 0 .04 0 .06 0 .08 0 .10 0 .12 0 .14
t ime s
80
60
40
20
0
logbeamlossrate
0 .02 0 .04 0 .06 0 .08 0 .10 0 .12 0 .14t ime s
200
150
100
50
0
logbeamlossrate 0 .02 0 .04 0 .06 0 .08 0 .10 0 .12 0 .14
t ime s
500
400
300
200
100
0
logbeamlossrate
A=1012 A=1013
A=1014 A=1015
The reason for a strange behavior of the loss rate in the case A=1014 B=80 T is unclear.
3.306 3.015
-38.337
-40.958
4.731 4.525
-63.448
-66.453
6.123 5.582
-123.319
-126.780
7.470-48.090
-323.12
-326.67
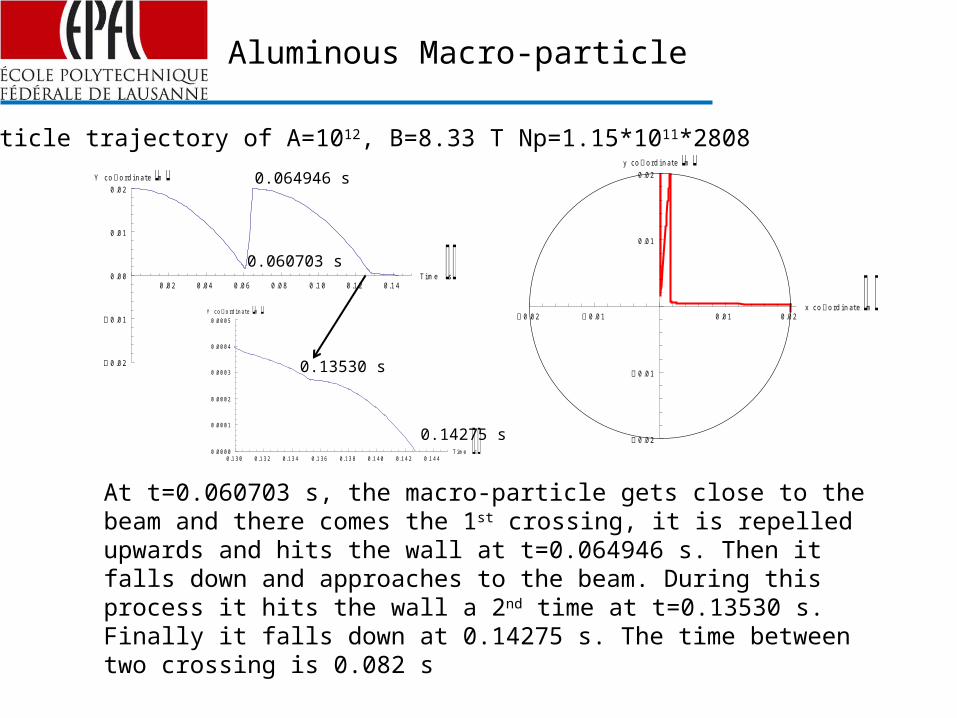
Aluminous Macro-particle
Particle trajectory of A=1012, B=8.33 T Np=1.15*1011*2808
0 .02 0 .04 0 .06 0 .08 0 .10 0 .12 0 .14Time s
0 .02
0 .01
0 .00
0 .01
0 .02Y co o rd inate m
0 .02 0 .01 0 .01 0 .02x co ord inate m
0 .02
0 .01
0 .01
0 .02y co ord inate m
At t=0.060703 s, the macro-particle gets close to the beam and there comes the 1st crossing, it is repelled upwards and hits the wall at t=0.064946 s. Then it falls down and approaches to the beam. During this process it hits the wall a 2nd time at t=0.13530 s. Finally it falls down at 0.14275 s. The time between two crossing is 0.082 s
0 .130 0 .132 0 .134 0 .136 0 .138 0 .140 0 .142 0 .144Time s0 .0000
0 .0001
0 .0002
0 .0003
0 .0004
0 .0005Y co o rd inate m
0.060703 s
0.064946 s
0.13530 s
0.14275 s

Aluminous Macro-particle
Plot the figures of beam loss rate for a varying total number of protons in the beam. We determine the maximum of each beam loss rate curve, and fit the curve around this maximum. Then we calculate the total number of lost protons.
The maximum of each beam loss rate curve is fitted by the function log10y=a+bx+cx2
Original plots Fitting curves
0 .06 0 .08 0 .10 0 .12 0 .14t ime s
10
5
0
5
logbeamlossrate
0 .06 0 .08 0 .10 0 .12 0 .14t ime s
10
5
0
5
logbeamlossrate 0 .06 0 .08 0 .10 0 .12 0 .14
t ime s
20
15
10
5
0
5
logbeamlossrate Np=1.15*1011*2808 Np=1.15*1011*1600
Np=1.15*1011*400

Aluminous Macro-particle
1.15*1011*400
1.15*1011*800
1.15*1011*1200
1.15*1011*
16001.15*1011*2000
1.15*1011
*24001.15*1011*2808
1012 0.01817 0.00596 0.00304 0.00185 0.00124 0.00088 0.00064
1013 0.66941 0.22633 0.11814 0.07401 0.05136 0.03800 0.02931
1014 24.208 8.42792 4.4614 2.82042 1.96902 1.46463 1.13349
1015 852.43 307.582 165.652 105.871 74.4822 55.7332 43.3389
1016 29039.1 10939.9 6014.88 3894.48 2765.25 2083.8 1629.73
The number of lost protons calculated with sigma=0.0003 m and B=8.33T

Aluminous Macro-particle
Plots of lost protons versus Np with different particle masses
The solid lines are the original plots, the dotted line are the fitting ones.The number of lost protons is fitted by the function y=1/(a+bx+cx2) when the mass is relatively small.
1000 1500 2000 2500number o f bunches
0 .002
0 .004
0 .006
0 .008
0 .010
Los t p ro tons
1000 1500 2000 2500number o f bunches
0 .1
0 .2
0 .3
0 .4
Los t p ro tons
1000 1500 2000 2500number o f bunches
5
10
15
Los t p ro tons
A=1012 A=1013
A=1014
Aluminous Macro-particle
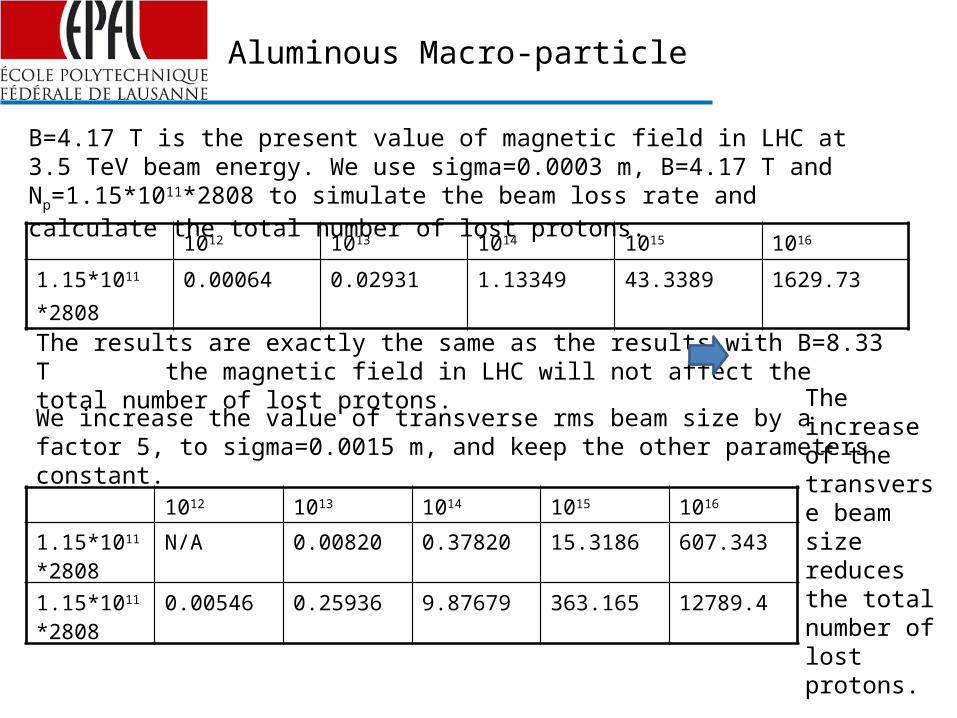
B=4.17 T is the present value of magnetic field in LHC at 3.5 TeV beam energy. We use sigma=0.0003 m, B=4.17 T and Np=1.15*1011*2808 to simulate the beam loss rate and calculate the total number of lost protons.
1012 1013 1014 1015 1016
1.15*1011
*28080.00064 0.02931 1.13349 43.3389 1629.73
The results are exactly the same as the results with B=8.33 T the magnetic field in LHC will not affect the total number of lost protons.
We increase the value of transverse rms beam size by a factor 5, to sigma=0.0015 m, and keep the other parameters constant.
1012 1013 1014 1015 1016
1.15*1011*2808
N/A 0.00820 0.37820 15.3186 607.343
1.15*1011*2808
0.00546 0.25936 9.87679 363.165 12789.4
The increase of the transverse beam size reduces the total number of lost protons.
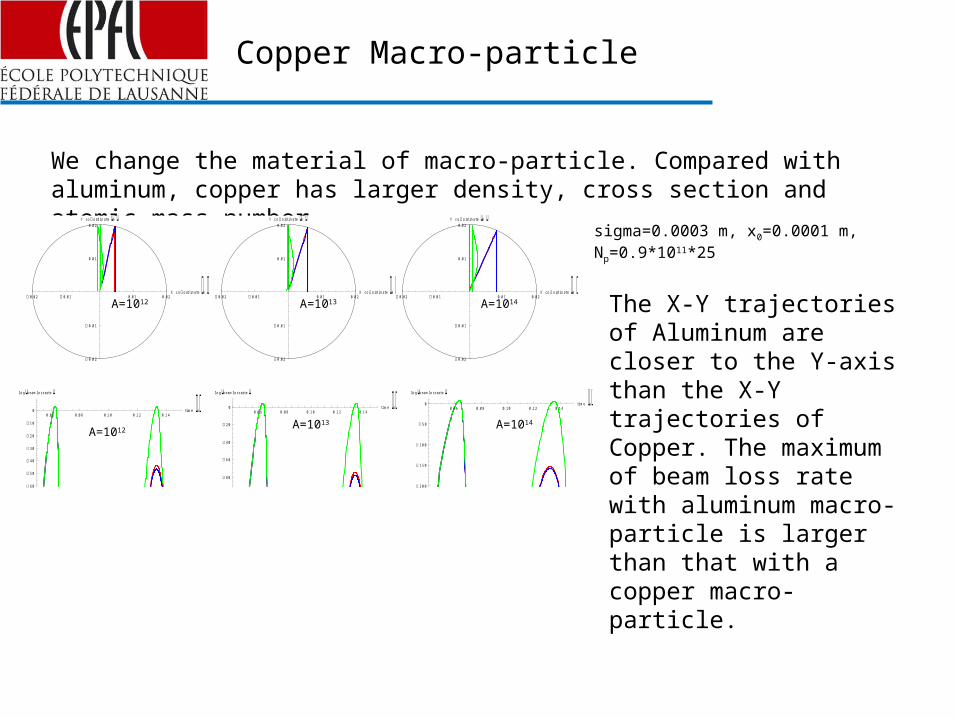
Copper Macro-particle
We change the material of macro-particle. Compared with aluminum, copper has larger density, cross section and atomic mass number.
0 .02 0 .01 0 .01 0 .02X co ord inate m
0 .02
0 .01
0 .01
0 .02Y co ord inate m
0 .02 0 .01 0 .01 0 .02X co ord inate m
0 .02
0 .01
0 .01
0 .02Y co ord inate m
0 .02 0 .01 0 .01 0 .02X co ord inate m
0 .02
0 .01
0 .01
0 .02Y co ord inate m
0 .06 0 .08 0 .10 0 .12 0 .14t ime s
80
60
40
20
0
logbeamlossrate 0 .06 0 .08 0 .10 0 .12 0 .14
t ime s
60
50
40
30
20
10
0
logbeamlossrate 0 .06 0 .08 0 .10 0 .12 0 .14
t ime s
200
150
100
50
0
logbeamlossrate
A=1012
A=1012
A=1013
A=1013
A=1014
A=1014
sigma=0.0003 m, x0=0.0001 m, Np=0.9*1011*25
The X-Y trajectories of Aluminum are closer to the Y-axis than the X-Y trajectories of Copper. The maximum of beam loss rate with aluminum macro-particle is larger than that with a copper macro-particle.

Copper Macro-particle
We plot the curves of beam loss rate versus time, then calculate the loss duration and the total number of lost protons for the 1st crossings
Total lost protons obtained for varying value of mass A and total protons intensity Np (B=8.33 T).
x0=0.0001 m, B=8.33 T, A=1012, 1014 and 1016
0 .06 0 .08 0 .10 0 .12 0 .14t ime s
10
5
0
5
logbeamlossrate
0 .06 0 .08 0 .10 0 .12 0 .14t ime s
10
5
0
5
logbeamlossrate
0 .06 0 .08 0 .10 0 .12 0 .14t ime s
10
5
0
5
logbeamlossrate Np=1.15*1011*2808 Np=1.15*1011*1600 Np=1.15*1011*400
1.15*1011*400 1.15*1011*1600 1.15*1011*28081012 0.01424 0.00141 0.000451014 18.7440 2.21784 0.895631016 22099.9 3030.90 1276.52
1.15*1011*400 1.15*1011*1600 1.15*1011*28081012 0.00094 0.00051 0.000301014 0.00198 0.00154 0.001381016 0.00297 0.00243 0.00224
Loss duration obtained for varying mass A and total proton intensity Np in unit of second (B=8.33 T).
The loss duration is almost independent of the material of the macro-particle. The total number of lost protons for a copper particle is smaller than that for an aluminum particle.
Final conclusions
• The time separation between first and second crossing is consistent with some beam observations of multiple successive events. However, the losses at the second crossing are always much lower than for the first crossing, which is different from actual observations.
• The computed peak losses should be compared with the quench threshold which corresponds to about 107 protons / second.
• Effect of magnetic force on the macro-particle motion is weak and can be neglected, even for a field of 8.33 T.
• The loss duration and the number of lost protons decrease with higher total beam intensity; the losses roughly in inverse proportion.
• Increasing the beam size by a factor of 5 reduces the total proton loss by about a factor of 3. This might be part of the explanation why events have not been important at LHC injection.
Future work may extend this discussion to some other materials and to other macro-particle shapes, e.g. to needle-like objects.

The end
Thank you


![Proton–proton and proton–antiproton differential elastic …...Elastic scattering and diffraction dissociation Measurement) at the LHC Collaboration [30–35]. Furthermore, different](https://static.fdocuments.us/doc/165x107/60e2a38bc9ae1d4e2f17cd71/protonaproton-and-protonaantiproton-differential-elastic-elastic-scattering.jpg)