Simulation of the Dynamic Interaction of Large Offshore Wind
14
Simulation of the Dynamic Interaction of Large Offshore Wind Farms with the Electric Power System Dipl.-Ing. Friedrich Koch 1 , +49-203/379-3211, [email protected] , Prof. Dr.-Ing. habil. Istvan Erlich 1 , +49-203/379-1032, [email protected] , Dr.-Ing. Fekadu Shewarega 1 , +49-203/379-3993, [email protected] , and Dr.-Ing. Udo Bachmann 2 , +49-30/5150-3309, [email protected] . (1) Gerhard-Mercator-University - Bismarckstr. 81, 47057 Duisburg, Germany (2) Vattenfall Europe Transmission Ltd. - Chausseestr. 23, 10115 Berlin, Germany Abstract The paper describes the effect of large wind parks on the frequency of the interconnected system on which they are operating. The features of the well-tested and widely used power system simulation package Power System Dynamics (PSD) were expanded in such a way that all commonly used wind generators and their control structures can be simulated and their interaction with the interconnected system can be studied. Additionally, the effect of the landscape and atmospheric condition at the location of the wind unit on the output power has been incorporated into the simulation. The result reveals that the stochastic nature of the wind power output causes significant frequency fluctuation. Without a countermeasure, the fluctuating power would tie up a disproportionately large component of the primary control power reserve of the interconnected system. The paper describes the available options for the integration of large wind parks in the task of frequency control. 1 - Introduction The Federal Government of Germany has set itself the target of doubling the current share of the renewable energy until the year 2010. That would mean that the share of the renewable energy in the overall energy consumption would reach 12.5%. Clearly wind energy will play a central role in the attainment of this ambitious objective. With the suitable onshore sites already dwindling and the problem of acceptance of wind turbines by the population due to noise, cast shadow and landscape encroachment, offshore sites seem to be increasingly attaining significance. This fact has been underscored by a German government strategy paper [1], which estimates that the total installed wind capacity in the offshore sites will have reached 20 to 30 GW with an annual generation of 85 TWh energy by the year 2030. Traditionally the practice has been to install individual wind units scattered in the countryside with a relatively small in-feed power (a few ten MW). The interconnection of such units to the power supply system commonly took place at the medium voltage level. Direct connection to the high voltage network, if any, was a rather rare exception.
Transcript of Simulation of the Dynamic Interaction of Large Offshore Wind

Simulation of the Dynamic Interaction of Large Offshore Wind Farms with the Electric Power System
Dipl.-Ing. Friedrich Koch1, +49-203/379-3211, [email protected],
Prof. Dr.-Ing. habil. Istvan Erlich1, +49-203/379-1032, [email protected],
Dr.-Ing. Fekadu Shewarega1, +49-203/379-3993, [email protected], and
Dr.-Ing. Udo Bachmann2, +49-30/5150-3309, [email protected].
(1) Gerhard-Mercator-University - Bismarckstr. 81, 47057 Duisburg, Germany
(2) Vattenfall Europe Transmission Ltd. - Chausseestr. 23, 10115 Berlin, Germany
Abstract The paper describes the effect of large wind parks on the frequency of the interconnected system on which they are operating. The features of the well-tested and widely used power system simulation package Power System Dynamics (PSD) were expanded in such a way that all commonly used wind generators and their control structures can be simulated and their interaction with the interconnected system can be studied. Additionally, the effect of the landscape and atmospheric condition at the location of the wind unit on the output power has been incorporated into the simulation. The result reveals that the stochastic nature of the wind power output causes significant frequency fluctuation. Without a countermeasure, the fluctuating power would tie up a disproportionately large component of the primary control power reserve of the interconnected system. The paper describes the available options for the integration of large wind parks in the task of frequency control.
1 - Introduction
The Federal Government of Germany has set itself the target of doubling the current share of the renewable energy until the year 2010. That would mean that the share of the renewable energy in the overall energy consumption would reach 12.5%. Clearly wind energy will play a central role in the attainment of this ambitious objective.
With the suitable onshore sites already dwindling and the problem of acceptance of wind turbines by the population due to noise, cast shadow and landscape encroachment, offshore sites seem to be increasingly attaining significance. This fact has been underscored by a German government strategy paper [1], which estimates that the total installed wind capacity in the offshore sites will have reached 20 to 30 GW with an annual generation of 85 TWh energy by the year 2030.
Traditionally the practice has been to install individual wind units scattered in the countryside with a relatively small in-feed power (a few ten MW). The interconnection of such units to the power supply system commonly took place at the medium voltage level. Direct connection to the high voltage network, if any, was a rather rare exception.

2
The current trend, however, points towards building larger wind parks. Due to the magnitude of the combined power to be injected into the network by the wind parks, direct interconnection to the extra high voltage network will be unavoidable, and consequently the wind parks should for all practical purposes be treated like the conventional power plants. This leads to a diametrically opposing operational requirement on the wind park vis-à-vis the interconnected system. Whereas wind units, for example, are currently required to be disconnected from the network in the event of an emergency such as short-circuit, major frequency or voltage changes, it must in the future be required of large wind parks to remain connected over a wider voltage and frequency band to help stave off the ensuing emergency and are, as a result, bound to be subjected to a sizeable short circuit current.
Compared to the conventional power plants, wind parks exhibit certain singular characteristics, and the fluctuating power output, which emanates from the stochastic nature of wind speed, being the most significant among these. Further, aerodynamic processes such as gusty wind, mutual shadowing, etc. cause the output power to change in a matter of seconds. The permanent adjustment of the rotor for maximum energy yield limits the options available for a wind unit to deal with such adverse conditions on its own.
Due to their sheer size, the envisaged offshore wind parks could add another dimension to the problems mentioned above.
2 - Statement of the problem
The main objective of this study is the investigation of the dynamic interaction between the upcoming offshore wind parks and a power system to which these wind parks will be connected. The investigated power system has an installed onshore wind generation capacity of about 3,550 MW, with the total load and thus generation capacity of the simulated system being approx. 33 GW.
Measurements with regard to power output at the individual onshore wind units are readily available on a continuous basis. But the onshore sites, scattered as they are over a wide geographic area, make the task of developing an overall picture with regard to the total wind power transfer into the system difficult and such data are available only at intermittent time intervals. As a result, there is an information deficit in the time behaviour of the power flow in the intervening periods.
In addition to the main objective mentioned above, the study aims at simulating the interplay between wind and conventional power plants and observing the relevant variables continuously over a time interval ranging a few minutes.
Although the discussions to follow revolve around a real power system model, the results of the case study can be used to deduce generalised statements with regard to the impact of the ever-increasing share of wind power on the overall performance of the interconnected network.
3 - Brief survey of the base case scenario
The envisaged offshore sites in the Baltic Sea will represent a change in the existing network in that a concentrated stochastic power is to be injected. However, the cumulative power of the existing onshore sites will still be much higher than the
3
planned offshore sites. For this reason, in an initial step, the current scenario with regard to wind power distribution originating from the current onshore sites will be briefly reviewed.
The supply area of the investigated power system encompasses five geographical areas, North, Middle, West, South-East and South-West.
The test power system consist of 73 synchronous generators, 128 transformers, 282 nodes and 200 lines and represent a part of the interconnected European power systems.
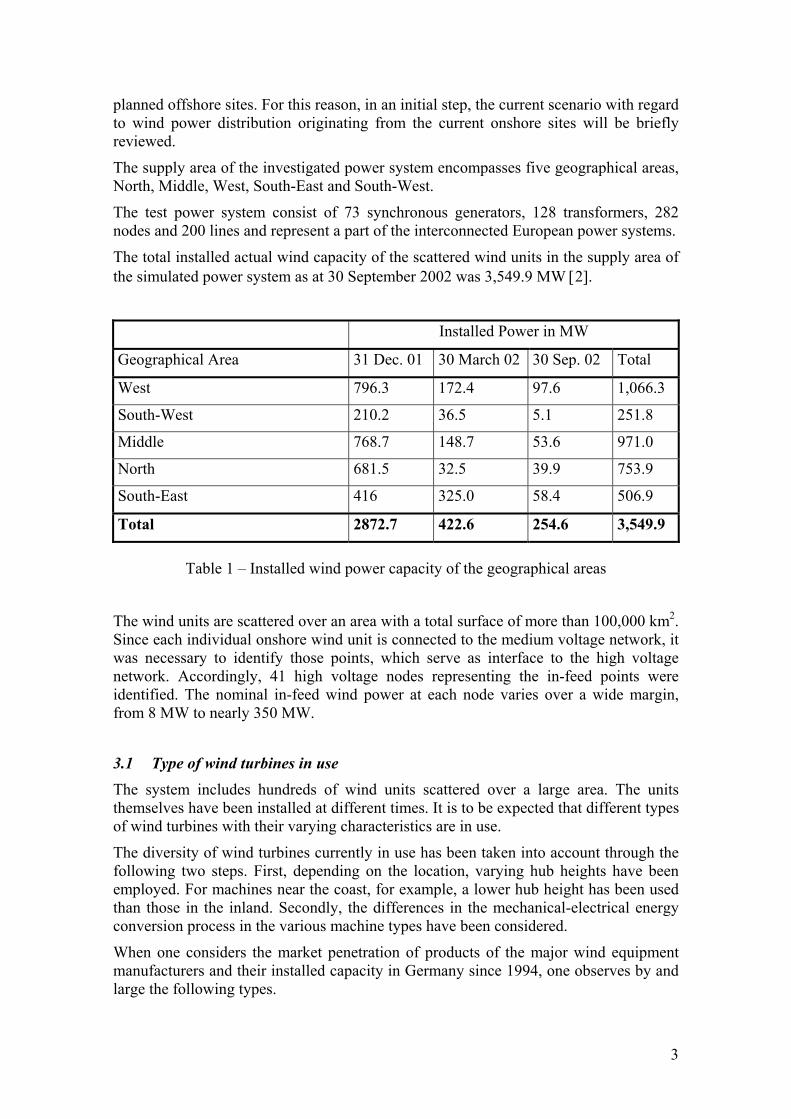
The total installed actual wind capacity of the scattered wind units in the supply area of the simulated power system as at 30 September 2002 was 3,549.9 MW [2].
Installed Power in MW
Geographical Area 31 Dec. 01 30 March 02 30 Sep. 02 Total
West 796.3 172.4 97.6 1,066.3
South-West 210.2 36.5 5.1 251.8
Middle 768.7 148.7 53.6 971.0
North 681.5 32.5 39.9 753.9
South-East 416 325.0 58.4 506.9
Total 2872.7 422.6 254.6 3,549.9
Table 1 – Installed wind power capacity of the geographical areas
The wind units are scattered over an area with a total surface of more than 100,000 km2. Since each individual onshore wind unit is connected to the medium voltage network, it was necessary to identify those points, which serve as interface to the high voltage network. Accordingly, 41 high voltage nodes representing the in-feed points were identified. The nominal in-feed wind power at each node varies over a wide margin, from 8 MW to nearly 350 MW.
3.1 Type of wind turbines in use The system includes hundreds of wind units scattered over a large area. The units themselves have been installed at different times. It is to be expected that different types of wind turbines with their varying characteristics are in use.
The diversity of wind turbines currently in use has been taken into account through the following two steps. First, depending on the location, varying hub heights have been employed. For machines near the coast, for example, a lower hub height has been used than those in the inland. Secondly, the differences in the mechanical-electrical energy conversion process in the various machine types have been considered.
When one considers the market penetration of products of the major wind equipment manufacturers and their installed capacity in Germany since 1994, one observes by and large the following types.

4
• Pitch controlled + synchronous machine with inverter (SM)
• Pitch controlled + doubly-fed induction machine (DFIM)
• Pitch controlled +cage-rotor with pole switching (SCIM)
Since the behaviour in a steady-state operation of a wind unit with a synchronous machine or a doubly-fed induction machine can be considered identical, distinction will be made only between variable speed (SM, DFIM) and quasi constant speed (SCIM) generators.
Of those machines installed during the period from 1994-2002 in Germany, the number of variable speed machines is three times greater than constant speed machines [3].
This ratio was applied at every high voltage node so that in the final analysis a uniform distribution can be achieved throughout the supply area and no arbitrary preference of one type over the other occurs.
4 - Simulation of wind energy conversion systems
The observation of the interaction of wind parks with the interconnected system and the conventional generating plants in it requires models of the various types of wind energy conversion systems as well the model of the interconnected system itself.
4.1 Simulation with the software package Power System Dynamics (PSD) The simulation was carried out with the software package Power System Dynamics (PSD) as a platform [4].
The PSD is a simulation package for the investigation of dynamic phenomena of large electric power systems from short to long time intervals. To simulate the dynamic response of large systems over such a broad time spectrum, the solution of the algebraic and differential equations describing the system requires efficient numerical methods. Furthermore, modelling details should be adaptable to the time interval for which the dynamic phenomenon is being investigated. The PSD is an outgrowth of several years of research aimed at meeting these requirements.
The PSD utilises commonly used models for power system components such as generators, transmission lines, loads, etc. Utilising the special characteristics of the models, the computational efficiency has been optimised to the extent possible. For components such as generator controllers, where alternative technical solutions are employed, user-defined models can be used. For this purpose a universal, block-oriented language with an extensive block library has been provided.
As a result of the rapid growth of wind power in the recent past, it was necessary to expand the features of the PSD so that the simulation of the transient behaviour of wind parks operating on an interconnected system is possible. Fig. 1 gives the overall structure of the PSD including these additional features.
A brief account of how the energy conversion mechanism in the rotor blades as well as the electrical machine including the inverter and its control structure were simulated in PSD follows.

5
4.2 Simulation of the wind turbine For the simulation of all relevant electrical machines, the pre-programmed models available in the PSD were used.
The power conversion process in a wind unit is strongly influenced by the geometry of the rotor blade. It is possible that the type of wind turbines used in different wind parks can differ significantly. Since the output power varies cubically with the wind velocity, the aerodynamic behaviour of the rotor is of particular interest. Accordingly, the power coefficient, which relates the actual output power to the tip speed ratio, as well as the control structures of the inverter were freely simulated with the block-oriented programming language in PSD. For further details see [5].
Figure 1 – Model and structure of the software package (PSD) used for the study
4.3 Wind speed model
For the wind speed model to tally with the reality, it was important to take -to the extent possible- the meteorological and topographical characteristics of the wind park sites into consideration.
In the study, a wind speed model, which incorporates a base wind velocity and a uniformly distributed random component as well as a component for the simulation of gusts and ramp-type wind velocity changes, has been implemented. The model being a two-dimensional model, local abnormalities can be simulated [6].
ii iu
i∆
I t e r a t i o n
Electrical MachinesControl Systems
Tm
fdu
Voltage- and
Governor Control
''iI
Network
'jI
''..I
iu
netf
Electric
Power
System 1
AdmY−
ASM j
),,( Rmuxfx ASM=•
)(' xgASM=kI
SM i
),,,( fdT umuxfx SM=•
),('' uI i xgSM=
Pitch Control
Rm
'..I
ku
netf
kk iu
k
kpω
Pitch-, P, Q-
Control
Rm
fqu
fdu
'kI
'..I
Non-linear Load
jp
i
i
pω
DFIM k
),,,( fR umuxfx DFIM=•
)(' xgDFIM=kI

6
Using the data cluster of the landscape, average wind velocity, surface roughness und turbulence intensity representative wind velocities were generated [7].
As the system, which this study underlies, incorporates a total surface area of over 100,000 km2, the exact simulation of each and every wind unit location and taking into account the varying surface roughness and turbulence intensity caused by the elevation of the terrain surrounding the wind units is not possible. Accordingly, the individual regions were assigned typical surface attributes such as ocean, sand, low grass or crop. Built-up areas and forests, however, were considered only to a limited degree.
In order to obtain a representative wind power input by the scattered onshore wind units, which are lumped together in the 41 in-feed points described above, therefore, it was necessary to generate a large number of wind speeds corresponding to the individual units feeding the high voltage node. The same applies to the simulated offshore wind parks, which comprise of a number of (under circumstances hundreds of) individual units spread out over an area of up to 80 km2.
As an example, the wind speed variations in an offshore park containing 100 units is given in Fig. 2.
13
16
19
22
20 40 60 80 100 120 140 160 180 200t in s
v in m/s
Fig. 2 – Wind speeds at different generator locations of one offshore wind park
containing 100 units
5 - Simulation of the entire system
Before simulations were carried out over an extended period of time and conclusions were drawn, the validity of the models and in deed the entire approach was tested by crosschecking the results obtained from the model with a snap-reading of the actual data in the network.
For this purpose, the wind velocity data of a particularly windy day at 12:00 hours [8] was used. The combined output power of the onshore sites computed using the model the instant mentioned above was found to be approx. 2,200 MW.

7
The planned offshore additions include five wind parks with a combined nominal power output of 3500 MW [9] in the long run. In this simulation, however, the short-term option of 1500 MW installed capacity has been used. Using this model, the combined output power of the offshore wind parks at the above-mentioned point in time would be approx. equal to the nominal power, which, of course, cannot be crosschecked as yet.
6 - Results of the simulation
With the necessary algorithms assembled and integrated into PSD, the next task was to study the time behaviour of the wind parks in interplay with the system onto which they are synchronised.
Fig. 3 depicts the power being injected to the network by the wind units at the 41 high voltage buses. Please note that for each node a pair of curves are given, one for the continuous speed and the other for the variable speed machine. The latter exhibits a smoother time behaviour than the former.
0.0
0.2
0.4
0.6
0.8
1.0
1.2
20 40 60 80 100 120 140 160 180 200t in s
P in p. u.
Figure 3 – Onshore wind power generation in 41 connection nodes
The pattern seems to be quite erratic and does not lend itself to any meaningful discussion. Fig. 4 shows the combined wind power being supplied into the network by the onshore wind sites. However, the output power of the wind parks in the northern part shows a much better degree of constancy. This is because this region is the nearest to the sea. In all other parts the picture is mixed.

8
P in MW
0
30
60
90
120
150
180
20 400
MiddleNorth
20 100 t in s 200 20 100 t in s 200
P in MW
0
30
60
90
120
20 400
South-EastWest
20 100 t in s 200 20 100 t in s 200
P in MW
0
5
10
15
20 400
South-West
20 100 t in s 200
Figure 4 – Combined wind powersupplied by the onshore wind sitesin the five areasNorth Middle West South-East South-West

9
Already an average pattern is visible at the geographical level, which becomes more pronounced when the output power of all onshore sites is lumped together. It follows from Fig. 5 that the units in the regions North, Middle and South-East are operating at near full capacity and those in West producing just a quarter of the installed capacity. The output of units in South-West is almost negligibly small.
The corresponding curve for the offshore sites is given in Fig. 6. Two of the five parks have a nominal power output of 450 MW each and the other three have a capacity of 200 MW each.
P in MW
0
200
400
600
800
1000
20 40 60 80 100 120 140 160 180 200t in s
West
South-West
Middle
North
South-East
Fig. 5 - Output power of all onshore sites lumped together
P in MW
150
200
250
300
350
400
450
500
20 40 60 80 100 120 140 160 180 200t in s
Fig. 6 - Output power of the simulated five offshore wind farms

10
6.1 Effect of the wind power on system frequency The frequency excursion for the base scenario, i.e. with only the current onshore sites in operation and covering a time interval of some 3 minutes is given in Fig 7. During this period, a maximum frequency deviation of 34.1 mHz has been observed.
It should be emphasised at this point that the actual picture in the network looks somewhat different. The test network is being treated in this simulation as an independent system, but in reality it is part of a much bigger European network. Any adverse effect on system frequency arising from the wind power will translate itself in ratio to the much bigger overall power in the European network and not in ratio to the power in the test system alone.
The frequency fluctuation including the planned offshore sites is also plotted in Fig. 7. With the offshore sites in the system, the maximum frequency excursion will reach up to 56.6 mHz.
The current practice is to leave the task of frequency maintenance to the conventional plants. With the share of the wind power making significant strides, this option seems to be increasingly unrealistic. Because the wind power developments are taking place at a cost of developments elsewhere in the conventional power sector.
As a result, the combined swing power available in the conventional plants in the future may not be large enough to offset these variations and keep the frequency constant. The wind farms themselves will at some stage be called upon to contribute towards the task of system frequency maintenance.
Technically, this does not pose a major challenge. The wind turbine merely needs to be equipped with a control structure specifically designed with this objective in mind. Additionally, the wind unit must maintain a reserve power just like the conventional plants that can then be used to reduce frequency deviation. The reserve power is maintained by adjusting the pitch angle for partial power output forgoing part of the wind power that could be tapped.
∆f in mHz
-40
-30
-20
-10
0
10
20
30
20 40 60 80 100 120 140 160 180 200t in s
Only onshore wind power without FC
Onshore and offshore wind power without FC
Onshore wind power without FC andoffshore wind power with FC
Fig. 7 – Impact of wind power on system frequency with and without frequency control (FC)

11
For practical reasons, only the planned offshore parks were considered for inclusion into the task of system frequency maintenance in this study. The existing onshore individual units are, by and large, smaller and scattered and the co-ordinated influencing of the system frequency is not as significant as the concentrated offshore wind farm with its hundreds of MW. Additionally the onshore wind turbines are already installed, to incorporate them into the task of frequency control they need to be refitted, which would require an extraordinary effort. This alternative is referred to as FC in the following diagrams. To demonstrate the effect that this will have on the system frequency, 3% of the nominal output power of the wind farm was maintained as a reserve and used to offset frequency fluctuation. This value was chosen arbitrarily. The reduction of the frequency deviation that can be achieved is shown in Fig. 7.
6.2 Discussion of the results The first conclusion that can be drawn is a rather straightforward one. Due to the stochastic nature of the wind speed and, as a result, the wind power, the electrical power fed into the system exhibits variations. This gives rise to a degree of non-stationary situation even during normal operating conditions.
The significance of this fluctuation is that it also takes place in the time frame of seconds, and to offset its effect a spinning reserve is required.
The primary control power maintained at conventional power plants is not specifically intended to deal with problems arising as a result of another generator with a random power output characteristic operating in parallel. In fact, it is a power that needs to be mustered by all system generators jointly to stave off a contingency situation such as loss of major generation in the system. Currently, the primary control power in the interconnected European network is ±3000 MW, and based on its comparative size, the network simulated in this study would be required to maintain a primary control capability of ±150 MW [10].
For an insignificant stochastic wind component, its adverse effect may be considered negligible. But when the envisaged offshore wind parks are up and running, the effect this will have on system frequency becomes significant.
As long as the increase in the share of wind power takes place only in some individual countries, the problem manifests itself not in the form of system frequency fluctuation but in fluctuating power exchange with countries having low wind power component. In this case, instead of the frequency control a fast-acting (in the ms-range active) power flow control in the tie lines would be required.
During the simulated time interval (3 min.), the wind power input into the system negotiates a wide variation (Fig. 8) reaching a peak discrepancy of 121 MW with only onshore sites and 150 MW with the onshore and offshore sites connected to the system. With frequency control and the defined reserve power (3%) at the wind farms, this discrepancy is reduced to 57 MW, and the maximum frequency deviation (shown in Fig. 7) becomes 17 mHz only.
It was found out that of the maximum power deviation of 121 MW, approx. 53 MW will be absorbed due to the self-regulating effect of the load, while the remainder, viz. ca. 68 MW needs to be taken care of by the primary control. That would mean ca. 23% would be used up for the reduction of the power mismatch in case only the onshore wind farms are interconnected. This figure would even go up to 28 % when the

12
envisaged offshore sites become operational, and a frequency control in conjunction with 3% power reserve in the offshore sites would bring the mismatch down to less than 11 % of the primary power capability.
∆P in MW
-80
-60
-40
-20
0
20
40
60
80
100
20 40 60 80 100 120 140 160 180 200t in s
Only onshore wind power without FC
Onshore and offshore wind power without FC
Onshore wind power without FC and offshore wind power with FC
Fig. 8 – Wind power fluctuation with and without frequency control (FC)
The resulting change in the output power of the onshore and offshore wind farms with and without frequency control is given in Fig. 9. The total output of the onshore and offshore sites show how the output characteristic of the wind power generation is smoothening by using the frequency control.
P in MW
3600
3650
3700
3750
3800
20 40 60 80 100 120 140 160 180 200t in s
Onshore and offshore wind power without FC
Onshore and offshore wind power with FC
Fig. 9 - Total wind power output with and without frequency control (FC)

13
7 - Conclusion
The development of wind power has made major strides in the past decade and the rapid development is set to continue for the foreseeable future. However, the impact of this ever-increasing share of the wind power on the overall system performance is a subject, which still does not draw the attention it deserves.
In this study, through the expansion of the features of the widely used power system simulation package PSD, the effect of the stochastic nature of the wind power in-feed on the frequency of an interconnected system has been simulated. During the simulated time interval (3 min.), the wind power input into the system made a wide variation reaching a peak discrepancy of 150 MW with the existing onshore and envisaged offshore sites connected to the system.
Based on its comparative size, the network used in this study and to which the wind parks are connected would be required to maintain a primary reserve capability of ±150 MW. Of this reserve capability, ca. 23 % would be used up for the reduction of the power mismatch caused by the present onshore wind farms, and the figure would even go up to 28% when the envisaged offshore sites become operational.
The discrepancy was found to be only less than 11%, when a frequency control at the offshore wind farms is used and a reserve power of 3% is maintained. It should be noted that maintaining a power reserve is a trade-off between the ability to control the frequency and forgoing part of the wind energy yield. However, a power reserve of 3% leads to only 0.8% reduction in the energy production for this particular scenario. The result demonstrates that there are a range of options for solving the problem of frequency fluctuation as a result of large wind parks operating on the interconnected system. One possibility is maintaining the status quo, i.e. assigning the task of frequency maintenance to the conventional plants. Since a wind unit of a given capacity demands more control power than a conventional generator of equal capacity, the primary control reserve needs to be increased disproportionately if this option is to be adopted. Alternatively, in accordance with costs-by-cause principle, with a proper design or retrofitting, wind parks can be made to tackle the problem on their own. The combination of the two options, i.e. the wind parks controlling the frequency to a degree and the rest being taken over by the conventional plants is also another alternative solution.
References [1] http://www.bmu.de/download/dateien/windenergie_strategie_br_020100.pdf
[2] http://www.wind-energie.de
[3] http://www.iwr.de
[4] Erlich I., 1995, Analysis and Simulation of the Dynamic Behavior of Electrical Power Systems (Analyse und Simulation des dynamischen Verhaltens von Elektroenergiesystemen), Habilitation-Thesis, Technical University of Dresden, Department of Electrical Engineering.
[5] Slootweg J.G., Polinder H., Kling W.L., 2001, Initialization of Wind Turbine Models in Power System Dynamics Simulations, IEEE Porto Power Tech Conference.

14
[6] Amlang B., Arsudis D., Leonhard W., 1992, Electrical Power Supply with Wind Turbines (Elektrische Energieversorgung mit Windkraftanlagen), Federal Ministry for the education and development (BMBF) Final report no. 032 – 8265 - B.
[7] Anderson P. M., Bose A., 1983, Stability Simulation of Wind Turbine Systems, IEEE/PES Summer meeting, Los Angeles, pp. 3791 - 3795.
[8] http://www.wetter.com
[9] Paul N., 2002, Offshore Projects in North and Baltic Sea (Offshore-Projekte in Nord- und Ostsee), Sonne, Wind & Wärme, No.7.
[10] http://transmission.vattenfall.de/files/PDF/ausschreibung_regelenergie.pdf