SIMULATION OF SOILING IN AN ARTIFICIAL DUSTING DEVICE - COMSOL
21
© Fraunhofer ISE Fraunhofer-Institute for Solar Energy Systems ISE SIMULATION OF SOILING IN AN ARTIFICIAL DUSTING DEVICE Elisabeth Klimm, Summer Kochersperger, K-A Weiß Fraunhofer Institute for Solar Energy Systems ISE COMSOL Coference Lausanne, 23.10.2018 www.ise.fraunhofer.de
Transcript of SIMULATION OF SOILING IN AN ARTIFICIAL DUSTING DEVICE - COMSOL

© Fraunhofer ISE
Fraunhofer-Institute for Solar Energy Systems ISE
SIMULATION OF SOILING IN AN ARTIFICIAL DUSTING DEVICE
Elisabeth Klimm, Summer Kochersperger, K-A Weiß
Fraunhofer Institute for Solar Energy Systems ISE
COMSOL CoferenceLausanne, 23.10.2018
www.ise.fraunhofer.de

© Fraunhofer ISE
2
Service Life Analysis
Investigation of
Quality and Durability
of PV-modules, solar thermal collectors and components
Durability testing
Standardization
Outdoor facilities with diff. climates Moderate Alpine Arid Maritime
High-resolution climate monitoring and recording
Load mapping
Outdoor Performance
Group Service Life AnalysisFraunhofer ISE
Based on data from outdoor exposure
Development of procedures
Simulation of degradation mechanisms in accelerated aging tests
Identification of degradation indicators Materials Components
Development of non-destructive test methods
Efficient, flexible test procedures
Accelerated Testing Analytics

© Fraunhofer ISE
3
Testmodules from Fraunhofer ISE
ITC test site – Instituto tecnologico de CanariasSEDE De POZO IZQUIERDO, Gran Canaria, Spain
6
Influcences: local weathering, surfaces, degradation, particle physics and chemistry, …
(Schill et al. 2011)Date
Rel
ativ
e ef
ficie
ncy
8 months - 80 %
2 rainevents
Soiling of PV modulesExample of soiling on Gran Canaria, Spain
dirty vs. clean
Multi-physics issue

© Fraunhofer ISE
4
Local dependency of soiling in desertsFEM: A tool to improve the understanding
Use Numerical Simulation to
enhance experimental times
choose suitable locations and
constitution of solar energy
power plants
in terms of soiling mitigation
Sayyah et al. (2014) Energy yield loss caused by dust deposition on photovoltaic panels

© Fraunhofer ISE
5
FEM Simulation Approach Going indoor - for better control of boundary conditions
Reproducible conditions and actual set- up, fast to verify, fast to learn, ..
FEM Model:
Geometry of actual artificial soiling device
Conservation of momentum
inlet velocity = outlet velocity
“Wind” speeds chosen to match desert wind, set to ~ 5 m/s and kept stable during test and simulation Inlet
Outlet
CAD rendering of the artificial dusting device
Indoor test set-up for homogen-eoussoiling
In-house developed dusting device
Pressure [bar]
Inlet Velocity [m/s]
Outlet Velocity [m/s]
1.5 bar 5.7 5.5

© Fraunhofer ISE
6
FEM Simulation Approach Simulation of the Lab Test
Comsol 5.3
© Fraunhofer ISE
7
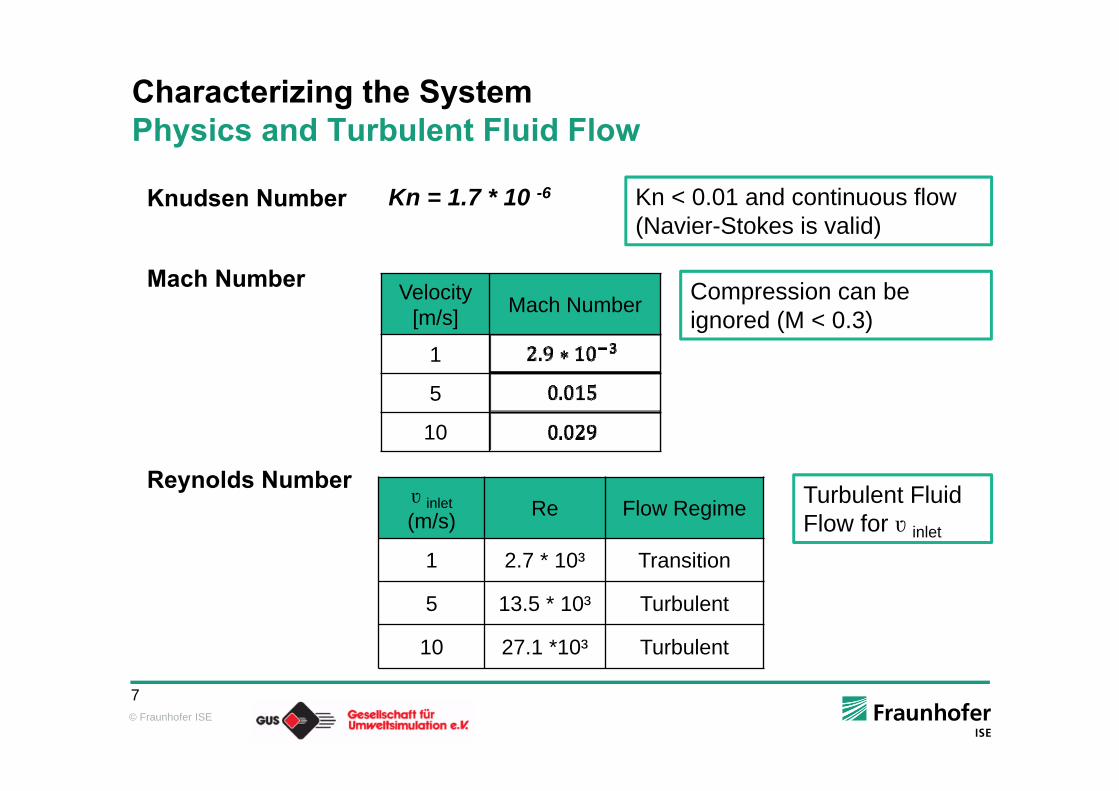
Knudsen Number
Mach Number
Reynolds Number
Characterizing the SystemPhysics and Turbulent Fluid Flow
ʋ inlet(m/s) Re Flow Regime
1 2.7 * 10³ Transition
5 13.5 * 10³ Turbulent
10 27.1 *10³ Turbulent
Kn < 0.01 and continuous flow(Navier-Stokes is valid)
Compression can be ignored (M < 0.3)
Turbulent Fluid Flow for ʋ inlet
Kn = 1.7 * 10 -6
Velocity [m/s] Mach Number
1
5
10

© Fraunhofer ISE
8
Characterizing the SystemTranslation into COMSOL Language

© Fraunhofer ISE
9
FEM Simulation of artificial soiling deviceGeometry of Models
2D Geometry
3D Geometry
3D-Model cut alongthe plane ofsymmetry to simplifythe simulation

© Fraunhofer ISE
10
Scale Size DimensionsMesh 2D
Size 1
Size 3
Meshing was completed in
sections
Comparison of Scale Size
Functions
1
3
6
SectionsS 1 S2 S3

© Fraunhofer ISE
11
StatisticsMesh 2D: Comparison of Skewness in Sizes 1 and 3
0.3 0.35 0.4 0.45 0.5 0.55 0.6 0.65 0.7 0.75 0.8 0.85 0.9 0.95 1
Mesh Size 1
0.3 0.35 0.4 0.45 0.5 0.55 0.6 0.65 0.7 0.75 0.8 0.85 0.90 0.95 1
Mesh Size 3
Histogram of Number of Elements vs. Element Quality30002500200015001000500
45000400003500030000250002000015000100005000
Number of Elements 14 698
Computation Time 3 Min
Average Element Quality 0.9148
Number of Elements 98 282Computation Time 20 MinAverage Element Quality 0.9419
Computer: Intel i7 processor-6700 CPU with 8GB RAM

© Fraunhofer ISE
12
FEM SimulationResults 2D: Surface velocities (ʋ inlet =10 m/s), Mesh Size 3
12
10
8
6
4
2
m/s

© Fraunhofer ISE
13
FEM SimulationResults 2D: 2D Geometry interpretation
Physics transfered to 3D Model, which will allow for correct round inlet and outlets to be studied.

© Fraunhofer ISE
14
FEM SimulationMesh 3D
Resolution and Quality of different mesh sizes analyzed
Size 3 sufficient and selected
Mesh Size 1
Mesh Size 3
90
80
70
60
50
40
30
20
90
80
70
60
50
40
30
20
Wall Resolution
Statistic Mesh 3
Elements 2 509 493
Ave Element Quality
0.6842
Comp. Time 19 h
Statistic Mesh 1
Elements 1 244 645
Ave Element Quality
0.6946
Comp. Time 8,5 h

© Fraunhofer ISE
15
FEM SimulationResults 3D: Stream line velocities, Mesh size 3
m/s
10
9
8
7
6
5
4
3
2
1

© Fraunhofer ISE
16
FEM SimulationValidation (ʋ inlet = 5 m/s )
Double Outlet
Dust InletW
all
Area to measure dust deposition

© Fraunhofer ISE
17
SummaryNumerical Soiling Simulation
Successfull CFD simulation of laboratory soiling tests with COMSOL 5.3a
2D model is not sufficient enough to capture results
3D model necessary for accurate results
6 h computation time for 3D model
Mesh Scale Size Geometries functions (Size 3) can successfully aid in obtaining better results

© Fraunhofer ISE
18
Outlook Environmental dependent multi-physics simulation
Wind
ʋ
s
Substrate (Glass Cover of PV module)
Particle-Substrate-Interaction I Particle-Particle-Interaction

© Fraunhofer ISE
19
Thanks for your attention
Fraunhofer-Institute for Solar Energy Systems ISE
Elisabeth Klimm
www.ise.fraunhofer.de

© Fraunhofer ISE
20
OutlookSolutions for Particle Trajectories with 1000 particles
2D Results are not sufficient; Results with and without fluid-particle interaction show almost no difference
3D Model of particle tracing shows promising first results
2D Mode (c.t.: 1 hour)
3D Model(c.t.: 12 hours)
With kind support and technical assistance of COMSOL

© Fraunhofer ISE
21
Solutions for Particle DepositionModels from COMSOL
https://www.youtube.com/watch?v=mCvHQsAkBu0
Source
Deposition > Geometry adaption
https://www.youtube.com/watch?v=TgtVcDyUmf4
Source
Deposition > Geometry adaption
2D Model 3D Model