Simulation of particle size distribution with a global ... · PDF file7692 F. Yu and G. Luo:...
20
Atmos. Chem. Phys., 9, 7691–7710, 2009 www.atmos-chem-phys.net/9/7691/2009/ © Author(s) 2009. This work is distributed under the Creative Commons Attribution 3.0 License. Atmospheric Chemistry and Physics Simulation of particle size distribution with a global aerosol model: contribution of nucleation to aerosol and CCN number concentrations F. Yu and G. Luo Atmospheric Sciences Research Center, State University of New York, 251 Fuller Road, Albany, New York 12203, USA Received: 30 March 2009 – Published in Atmos. Chem. Phys. Discuss.: 30 April 2009 Revised: 18 September 2009 – Accepted: 28 September 2009 – Published: 16 October 2009 Abstract. An advanced particle microphysics model with a number of computationally efficient schemes has been in- corporated into a global chemistry transport model (GEOS- Chem) to simulate particle number size distributions and cloud condensation nuclei (CCN) concentrations in the at- mosphere. Size-resolved microphysics for secondary parti- cles (i.e., those formed from gaseous species) and sea salt has been treated in the present study. The growth of nucle- ated particles through the condensation of sulfuric acid va- por and equilibrium uptake of nitrate, ammonium, and sec- ondary organic aerosol is explicitly simulated, along with the scavenging of secondary particles by primary particles (dust, black carbon, organic carbon, and sea salt). We calculate sec- ondary particle formation rate based on ion-mediated nucle- ation (IMN) mechanism and constrain the parameterizations of primary particle emissions with various observations. Our simulations indicate that secondary particles formed via IMN appear to be able to account for the particle number concen- trations observed in many parts of the troposphere. A com- parison of the simulated annual mean concentrations of con- densation nuclei larger than 10 nm (CN10) with those mea- sured values show very good agreement (within a factor of two) in near all 22 sites around the globe that have at least one full year of CN10 measurements. Secondary particles appear to dominate the number abundance in most parts of the tropo- sphere. Calculated CCN concentration at supersaturation of 0.4% (CCN0.4) and the fraction of CCN0.4 that is secondary (f sec CCN ) have large spatial variations. Over the middle lati- tude in the Northern Hemisphere, zonally averaged CCN0.4 decreases from ∼400–700 cm -3 in the boundary layer (BL) to below 100 cm -3 above altitude of ∼4 km, the correspond- Correspondence to: F. Yu ([email protected]) ing f sec CCN values change from 50–60% to above ∼70%. In the Southern Hemisphere, the zonally averaged CCN0.4 is below 200 cm -3 and f sec CCN is generally above 60% except in the BL over the Southern Ocean. 1 Introduction Atmospheric particles perturb the Earth’s energy budget indi- rectly by acting as cloud condensation nuclei (CCN) and thus changing cloud properties and influencing precipitation. The magnitude of the aerosol indirect radiative forcing (IRF) rep- resents the dominate uncertainty in assessing climate change (NRC, 2005; IPCC, 2007; Chin et al., 2009). The aerosol in- direct radiative forcing is largely determined by the number abundance of particles that can act as CCN (e.g., Twomey, 1977; Albrecht, 1989; Charlson et al., 1992). An increase in the number and a decrease in the size of cloud droplets (for fixed liquid water content) resulted from the increase of aerosol number concentrations will increase cloud opti- cal depth and cloud albedo (first indirect aerosol effect). The change of cloud drop number concentration that results from the increase in aerosol concentration can also affect the cloud liquid water content, cloud amount, cloud lifetime, and pre- cipitation efficiency (second indirect aerosol effect). At a given supersaturation ratio, CCN number concentrations de- pend on the number size distribution and composition of at- mospheric particles. Pan et al. (1998) showed that aerosol size parameters are the leading contributors to the uncertainty of calculated IRF by anthropogenic sulfate aerosols and sug- gested that a size-resolved global aerosol model should be an important step toward reducing the uncertainty. The particles in the troposphere either come from in-situ nucleation (i.e, secondary particles) or direct emission (i.e., Published by Copernicus Publications on behalf of the European Geosciences Union.
Transcript of Simulation of particle size distribution with a global ... · PDF file7692 F. Yu and G. Luo:...

Atmos. Chem. Phys., 9, 7691–7710, 2009www.atmos-chem-phys.net/9/7691/2009/© Author(s) 2009. This work is distributed underthe Creative Commons Attribution 3.0 License.
AtmosphericChemistry
and Physics
Simulation of particle size distribution with a global aerosol model:contribution of nucleation to aerosol and CCN numberconcentrations
F. Yu and G. Luo
Atmospheric Sciences Research Center, State University of New York, 251 Fuller Road, Albany, New York 12203, USA
Received: 30 March 2009 – Published in Atmos. Chem. Phys. Discuss.: 30 April 2009Revised: 18 September 2009 – Accepted: 28 September 2009 – Published: 16 October 2009
Abstract. An advanced particle microphysics model witha number of computationally efficient schemes has been in-corporated into a global chemistry transport model (GEOS-Chem) to simulate particle number size distributions andcloud condensation nuclei (CCN) concentrations in the at-mosphere. Size-resolved microphysics for secondary parti-cles (i.e., those formed from gaseous species) and sea salthas been treated in the present study. The growth of nucle-ated particles through the condensation of sulfuric acid va-por and equilibrium uptake of nitrate, ammonium, and sec-ondary organic aerosol is explicitly simulated, along with thescavenging of secondary particles by primary particles (dust,black carbon, organic carbon, and sea salt). We calculate sec-ondary particle formation rate based on ion-mediated nucle-ation (IMN) mechanism and constrain the parameterizationsof primary particle emissions with various observations. Oursimulations indicate that secondary particles formed via IMNappear to be able to account for the particle number concen-trations observed in many parts of the troposphere. A com-parison of the simulated annual mean concentrations of con-densation nuclei larger than 10 nm (CN10) with those mea-sured values show very good agreement (within a factor oftwo) in near all 22 sites around the globe that have at least onefull year of CN10 measurements. Secondary particles appearto dominate the number abundance in most parts of the tropo-sphere. Calculated CCN concentration at supersaturation of0.4% (CCN0.4) and the fraction of CCN0.4 that is secondary(f sec
CCN) have large spatial variations. Over the middle lati-tude in the Northern Hemisphere, zonally averaged CCN0.4decreases from∼400–700 cm−3 in the boundary layer (BL)to below 100 cm−3 above altitude of∼4 km, the correspond-
Correspondence to:F. Yu([email protected])
ing f secCCN values change from 50–60% to above∼70%. In
the Southern Hemisphere, the zonally averaged CCN0.4 isbelow 200 cm−3 andf sec
CCN is generally above 60% except inthe BL over the Southern Ocean.
1 Introduction
Atmospheric particles perturb the Earth’s energy budget indi-rectly by acting as cloud condensation nuclei (CCN) and thuschanging cloud properties and influencing precipitation. Themagnitude of the aerosol indirect radiative forcing (IRF) rep-resents the dominate uncertainty in assessing climate change(NRC, 2005; IPCC, 2007; Chin et al., 2009). The aerosol in-direct radiative forcing is largely determined by the numberabundance of particles that can act as CCN (e.g., Twomey,1977; Albrecht, 1989; Charlson et al., 1992). An increasein the number and a decrease in the size of cloud droplets(for fixed liquid water content) resulted from the increaseof aerosol number concentrations will increase cloud opti-cal depth and cloud albedo (first indirect aerosol effect). Thechange of cloud drop number concentration that results fromthe increase in aerosol concentration can also affect the cloudliquid water content, cloud amount, cloud lifetime, and pre-cipitation efficiency (second indirect aerosol effect). At agiven supersaturation ratio, CCN number concentrations de-pend on the number size distribution and composition of at-mospheric particles. Pan et al. (1998) showed that aerosolsize parameters are the leading contributors to the uncertaintyof calculated IRF by anthropogenic sulfate aerosols and sug-gested that a size-resolved global aerosol model should be animportant step toward reducing the uncertainty.
The particles in the troposphere either come from in-situnucleation (i.e, secondary particles) or direct emission (i.e.,
Published by Copernicus Publications on behalf of the European Geosciences Union.

7692 F. Yu and G. Luo: Simulation of particle size distribution with a global aerosol model
primary particles). Nucleation frequently observed through-out the troposphere is believed to be an important source ofatmospheric particles (e.g., Yu et al., 2008). While freshlynucleated particles have a size of only a few nanometers,a non-trivial fraction of these particles is known to be ableto grow to CCN size under favorable conditions. A numberof recent studies have employed global size-resolved aerosolmicrophysics models to study the contributions of primaryand secondary particles to CCN concentrations.
Different parameterizations of primary particle emissionshave been reported to have substantial impact on pre-dicted CCN abundance (Adams and Seinfeld, 2002, 2003;Spracklen et al., 2005a; Pierce and Adams, 2006; Pierce etal., 2007). For example, Adams and Seinfeld (2003) showedthat a few percent of anthropogenic sulfur emitted as particu-late sulfate (to represent the sub-grid nucleation process) in-creases CCN concentrations in polluted areas by up to∼200–500%. Spracklen et al. (2005b) showed that global mean sul-fate and sea salt derived CCN concentrations change by upto 27% in marine boundary layer and by more than 100%over some continental regions when the fraction of anthro-pogenic SO2 emitted as particulates is increased from 0 to5%. Pierce et al. (2007) showed that the inclusion of car-bonaceous aerosol particles (assumed to have number me-dian diameter of∼25 nm) can increase CCN concentrations(0.2%) by 65–90% in the globally averaged surface layer.While these results highlight the potential important contri-bution of primary particles to CCN in some regions, they can-not be used to infer that the contribution of secondary parti-cles is not important because of the large uncertainties in thesize and amount of primary particles (note that primary sul-fate particles in these studies are actually secondary particlesnucleated in sub-grid plumes). More importantly, the abovementioned studies are likely to significantly under-estimatethe contribution of secondary particles to CCN because thenucleation rates in these studies are calculated with H2SO4-H2O binary homogeneous nucleation (BHN) theory which isknown to predict negligible secondary particle formation inthe lower troposphere and cannot explain nucleation eventsfrequently observed around the globe (Yu and Turco, 2008).Pierce and Adams (2009) showed that uncertainties in nu-cleation, primary emissions and secondary organic aerosol(SOA) condensation may all influence predictions of CCNand emphasized the necessity to reduce the uncertainties inthese processes in order to better understand the aerosol in-direct effect.
The global aerosol simulations reported in Spracklenet al. (2006, 2008), Makkonen et al. (2008), and Pierceand Adams (2009), based on an empirically parameterizedactivation-type nucleation mechanism (linear dependence ofnucleation rateJ on sulfuric acid gas concentration:J=A
[H2SO4] with A as pre-factor), showed that boundary layer(BL) nucleation is necessary to improve the agreement be-tween modeled and observed particle number concentrations.Spracklen et al. (2008) concluded that BL nucleation is an
important global source of CCN and increases global BLCCN concentrations at 0.2% supersaturation by 3–20% andCCN at 1% supersaturation by 5–50%. Based on their sen-sitivity study, Makkonen et al. (2008) pointed out that thepredicted CCN concentrations are sensitive to the choice ofthe nucleation mechanism.
Wang and Penner (2009) assessed how nucleation affectsthe CCN concentration and aerosol indirect forcing, usinga global aerosol model that calculates the nucleation in andabove the boundary layer with an empirical activation-typenucleation scheme and binary homogeneous nucleation the-ory, respectively. Wang and Penner (2009) showed thatthe inclusion of an empirical BL activation-type nucleationmechanism increases the global average CCN concentrationsin the BL by 31.4% without primary sulfate particle emis-sion and by 5.3% with primary sulfate particle emission.Wang and Penner (2009) also found that the aerosol indirectradiative forcing from various treatments of aerosol nucle-ation ranges from−1.22 to−2.03 W/m2 and emphasized theimportance of better quantifying aerosol nucleation mecha-nisms in reducing uncertainty in the assessment of aerosolindirect radiative forcing.
It is clear from these recent studies (e.g., Spracklen et al.,2006, 2008; Makkonen et al., 2009; Wang and Penner, 2009)that nucleation is an important source of global CCN andthat aerosol indirect effect is sensitive to the nucleation pro-cess. It should be noted that the activation-type nucleationmechanism employed in these studies is a regression param-eterization of nucleation events observed in a number of lo-cations. The values of pre-factor (A) derived from differ-ent sets of nucleation measurements vary significantly (upto three orders of magnitude) (Riipinen et al., 2007; Kuanget al., 2008), indicating that parameters other than [H2SO4]also affect atmospheric nucleation rates. Due to the over-prediction of the activation nucleation scheme (derived em-pirically from surface observation) at high altitudes, the ap-plication of this scheme is generally limited to the boundarylayer (Spracklen et al., 2008; Makkonen et al., 2009; Wangand Penner, 2009). A more robust nucleation mechanismwith clear physics and state-of-the-art thermodynamics is ap-parently needed to improve the representation of the nucle-ation process in the global atmosphere.
Based on an up-to-date kinetically consistent ion-mediatednucleation (IMN) model incorporating recently availablethermodynamic data and schemes, Yu (2006) concluded thations can lead to significant particle formation not only inthe upper troposphere but also in the lower troposphere (in-cluding the boundary layer). The involvement of ions in at-mospheric particle formation has been unequivocally con-firmed by the 3-year ion mobility measurements (Hirsikkoet al., 2007) and 1-year measurements of the excess chargeon freshly nucleated particles taken in boreal forests (Laaksoet al., 2007; Gagne et al., 2008), although the relative con-tribution of ion and neutral nucleation remains controversial.Kulmala and colleagues argued that IMN contributes only
Atmos. Chem. Phys., 9, 7691–7710, 2009 www.atmos-chem-phys.net/9/7691/2009/

F. Yu and G. Luo: Simulation of particle size distribution with a global aerosol model 7693
up to ∼10% to the boreal forest nucleation (Laakso et al.,2007; Kulmala et al., 2007; Gagne et al., 2008; Boy et al.,2008). However, Yu and colleagues concluded that IMN ap-pears to be the dominant nucleation mechanism in at leasta large fraction of nucleation events observed in the borealforests (Yu and Turco, 2008; Yu et al., 2008, and associ-ated ACPD online open discussions). Detailed and well-constrained case studies (Yu and Turco, 2008) indicate that,for most of well-defined nucleation events observed duringan intensive field campaign in Hyytiala, Finland, the predic-tions based on the IMN model are in good agreement withfield data for a range of variables, including critical nucle-ation sizes, size-dependent overcharging ratios, concentra-tions of 1.8–3 nm stable clusters and 3–6 nm particles, as wellas their diurnal variations. Yu and Turco (2008) concludedthat, beyond a reasonable level of uncertainty, IMN appearsto be the dominant nucleation mechanism in at least a largefraction of nucleation events observed in boreal forests.
The main objective of the present paper is to study the con-tribution of IMN mechanism, which has been constrained bya variety of up-to-date thermodynamic data and supported byrecent field measurements in boreal forests, to global particlenumber abundance. To achieve the objective, an advancedparticle microphysics (APM) model has been coupled witha global chemistry transport model using assimilated mete-orology (GEOS-Chem) to simulate the spatial and temporalvariations of particle number size distribution in the globalatmosphere. The details of the coupled model and key fea-tures are described in Sect. 2. Section 3 presents modelingresults and comparisons with measurements. Summary anddiscussion are given in Sect. 4.
2 Description of models, approaches, and key features
2.1 Advanced Particle Microphysics (APM) model
The APM model is an advanced multi-type, multi-component, size-resolved microphysics code developed fora wide range of applications. The current APM model is theresult of past development and validation effort aimed at ex-plaining atmospheric particle observations (e.g., Turco et al.,1979; Hamill et al., 1982; Toon et al., 1988; Jacobson et al.,1994; Jacobson and Turco, 1995; Yu and Turco, 1997, 2008;Yu, 1998). The basic microphysical processes that are treatedin the model include nucleation, condensation/evaporation,coagulation, thermodynamic equilibrium with local humid-ity, and dry deposition. In coupling with GEOS-Chem, size-dependent schemes for wet-deposition (washout and rainout)have been implemented. The APM model is very flexible inspecifying the number of bins (sections), number of compo-sitions, and number of types of aerosols to be simulated.
The current version of the APM model is highly mod-ularized and formatted as a stand-alone box model. Forapplications when computing cost is not a limitation, the
APM model can be customized to treat complex and detailedaerosol systems with high size resolution. For example, inthe cases of studying particle formation and evolution in air-craft plumes and in ambient atmosphere, the model can dis-tinguish particles with different charging states and composi-tions (Yu, 1998; Yu and Turco, 1997, 2008) and can resolveliquid and frozen contrail particles formed from particles ofdifferent compositions (Yu, 1998; Karcher and Yu, 2009).In these applications, particles ranging in size from molecu-lar (diameter∼0.6 nm) to larger than 10µm are representedby hundreds of sectional bins using a discrete-sectional binstructure, and the size-dependent electrostatic effect on par-ticle microphysics can be considered (Yu, 2006).
To treat size-resolved aerosol microphysics in a 3-dimensional model, computing cost becomes a significantlimitation. Based on our experience with past applicationsof the APM model as a box model and our understandingof key processes/parameters controlling aerosol microphys-ical properties, we have designed and implemented a num-ber of schemes/algorithms that improve the computing effi-ciency for 3-D application. Pre-calculated look-up tables areextensively used for nucleation rate and coagulation kernelcalculations which substantially reduce the computing time.The bin resolution can be variable which means that we canchoose high size resolution for a certain size range (of inter-est) while using low resolution for other size ranges. This en-ables us to use a reasonable number of bins to cover a widesize range while optimizing size resolution. The model al-lows the different microphysical processes to be calculated atdifferent time steps and automatically decides the optimumtime steps for computing efficiency without sacrificing accu-racy.
2.2 GEOS-Chem model
The GEOS–Chem model is a global 3-D model of atmo-spheric composition driven by assimilated meteorologicalobservations from the Goddard Earth Observing System(GEOS) of the NASA Global Modeling Assimilation Of-fice (GMAO). The GEOS-Chem model includes a detailedsimulation of tropospheric ozone-NOx-hydrocarbon chem-istry as well as of aerosols and their precursors (Park etal., 2004). A detailed description of the model (includ-ing the treatment of various emission sources, chemistryand aerosol schemes) can be found in the model webpage(http://acmg.seas.harvard.edu/geos/index.html).
Meteorological factors used in GEOS–Chem include sur-face properties, humidity, temperature, winds, cloud prop-erties, heat flux and precipitation. The present version ofGEOS-Chem (v8-01-03) is fully compatible with the GMAOGEOS–5 operational data product. The GEOS-5 data, in-cluding cloud fields, have 6-h temporal resolution (3-hourresolution for surface fields and mixing depths), 0.5◦
×0.667◦
horizontal resolution, and 72 vertical sigma levels extendingfrom the surface to approximately 0.01 hPa. The horizontal
www.atmos-chem-phys.net/9/7691/2009/ Atmos. Chem. Phys., 9, 7691–7710, 2009
7694 F. Yu and G. Luo: Simulation of particle size distribution with a global aerosol model
resolution can be degraded and vertical layers merged forcomputational efficiency. It is noteworthy that GEOS-5 hasa higher vertical resolution in the lower troposphere (14 ver-tical levels below 2 km) than that of GEOS-3 (9 levels below2 km) and GEOS-4 (5 levels below 2 km).
In addition to sulfate, nitrate, and ammonium aerosols(Park et al., 2004), the GEOS-Chem model also considersblack carbon (BC) and primary organic carbon (POC) (Parket al., 2003), SOA (Park et al., 2003; Liao et al., 2007), dust(Fairlie et al., 2007), and sea salt (Alexander et al., 2005).The mass of dust is separated into four sizes (Fairlie et al.,2007) while that of sea salt is divided into two sizes (Alexan-der et al., 2005). Aerosol and gas-phase simulations are cou-pled through secondary inorganic and organic particle for-mation, heterogeneous chemistry (Evans and Jacob, 2005),and aerosol effects on photolysis rates (Martin et al., 2003).The ISORROPIA thermodynamic equilibrium model (Neneset al., 1998) is used to calculate partitioning of total ammo-nia and nitric acid between the gas and aerosol phases, whileSOA is produced from the oxidation of biogenic hydrocar-bons following the scheme of Chung and Seinfeld (2002)with updates detailed in Liao et al. (2007). The publiclyreleased version of GEOS-Chem (v8-01-03) simulates themass concentrations of particles of different types or compo-sitions but does not treat size-resolved aerosol microphysics.
2.3 GEOS-Chem coupled with APM model:key features
In order to study the spatial and temporal variations of globalCCN abundance, the size-resolved aerosol microphysics hasto be handled properly within the global model. We havecoupled the APM model with a recently released version ofGEOS-Chem (v8-01-03). In the present study, size-resolvedmicrophysics for sulfate and sea salt aerosols is considered.The formation of new particles is calculated with the state-of-the-art ion-mediated nucleation mechanism. The contri-butions of nitrate, ammonium, and SOAs to sulfate particlegrowth are considered through equilibrium uptake. The scav-enging of sulfate particles by other types of particles (seasalt, BC, POC, and dust) is considered. The emission inven-tories and parameterizations, as well as key features of thecoupled model related to size-resolved aerosol microphysicsare described below. The emission discussion focuses on ouradditions/updates to what have been included in the originalGEOS-Chem model.
2.3.1 Emissions
2.3.1.1 Sulfur emission inventories and parameterizationof primary sulfate particle emission
In this study, the global sulfur emission is based on the Emis-sions Database for Global Atmospheric Research (EDGAR)inventory (Olivier et al., 2001), while the emissions over
United States, Mexico and East Asia are replaced by theEnvironmental Protection Agency (EPA/NEI99) inventory,the Big Bend Regional Aerosol and Visibility Observational(BRAVO) Study emissions inventory (Mark et al., 2003),and the Transport and Chemical Evolution over the Pacific(TRACE-P) inventory (Streets et al., 2003), respectively. Wehave scaled the EDGAR sulfur emission over Europe basedon the information presented in Vestreng et al. (2007). Dueto the uncertainty of the emissions from sporadically eruptingvolcanoes, we only consider the continuously active volcanoemission.
Most recent global aerosol simulations assume that 0–5%of anthropogenic sulfur species is emitted as sulfuric acidor sulfate while the rest as SO2 (Adams and Seinfeld, 2002,2003; Spracklen et al., 2005a; Pierce and Adams, 2006;Pierce et al., 2007; Wang and Penner, 2009). While thisfraction of sulfate mass has been called primary sulfate, itis actually secondary in nature because it is used to accountfor the sub-grid plume scale SO2 oxidation and new par-ticle formation and growth (e.g., Spracklen et al., 2005a).The primary sulfate is generally distributed into two lognor-mal modes with geometric mean diameters (dg) of 10 nm(nucleation mode) and 70 nm (accumulation or condensationmode) with standard deviations (σ ) of 1.6 and 2.0, respec-tively (Whitby, 1978). All the above mentioned studies citedeither Binkowski and Shankar (1995) or Whitby (1978) toassume that 15% of primary sulfate mass is emitted in thenucleation mode while the rest in the accumulation mode.Actually, it appears that Binkowski and Shankar (1995) alsocited the work of Whitby (1978) for the number. How-ever, Whitby (1978), based on the observations presented inWhitby et al. (1978), showed that the fraction of primary sul-fate in the nucleation mode is 5% (instead of widely used15%) while the remaining (95%) of sulfate (formed in sub-grid SO2 plumes) condenses directly onto existing particles.
In the present study, to account for the sub-grid secondaryparticle formation, we assume that 2.5% of anthropogenicsulfur is emitted as sulfate (the number suggested in Den-tener et al., 2006) and the fractions of the primary sulfatedistributed to the nucleation and accumulation modes are 5%and 95%, respectively (Whitby et al., 1978). It should bepointed out that 95% of primary sulfate mass condenses onthe existing particles (or accumulation mode particles) andthus doesn’t form new particles. In our simulation, this 95%of primary sulfate mass is added to the sulfate mass associ-ated with BC and POC particles. To look into the effect ofsub-grid nucleation, we carry out a sensitive study assumingall anthropogenic sulfur is emitted as SO2.
2.3.1.2 Sea salt emission
In the original version of GEOS-Chem (v8-01-03), seasalt emissions, both of accumulation mode particles (0.1–0.5µm) and coarse mode particles (0.5–10µm), are calcu-lated with the parameterization of Gong et al. (1997). In
Atmos. Chem. Phys., 9, 7691–7710, 2009 www.atmos-chem-phys.net/9/7691/2009/

F. Yu and G. Luo: Simulation of particle size distribution with a global aerosol model 7695
the present study, the recent parameterization of Clark etal. (2006) is employed to calculate the size-resolved sea saltemission.
2.3.1.3 Emissions of carbonaceous aerosol
Carbonaceous aerosol emissions mainly result from fossilfuel and bio-fuel combustion, and biomass burning. The de-fault carbonaceous emissions inventory in GEOS-Chem in-cludes anthropogenic emission based on the work of Bondet al. (2004), biofuels based on Yevich and Logan (2003),and biomass emission from GEOS-Chem inventory (Parket al., 2003). The base year of the Bond et al. (2004)emissions is 1996 for fossil fuel and the fire counts during1999–2000 for biomass burning. The biomass burning car-bonaceous aerosol can also use annually averaged inventory(Bond et al., 2004) or monthly averaged emissions from theGlobal Fire Emissions Database Version 2 (GFED2) biomassburning emissions. In this study, anthropogenic carbona-ceous emission used Bond et al. (2004)’s fossil and bio-fuel inventories, while biomass burning emission is basedon GFED2’s monthly open fire inventory. Carbonaceousaerosols in GEOS-Chem are divided into hydrophilic and hy-drophobic categories. The model assumes that 20% of blackcarbon and 50% of organic carbon from anthropogenic emis-sions are hydrophilic and the rest are hydrophobic. Conver-sion of hydrophobic to hydrophilic carbonaceous aerosolstakes place with an e-folding time of 1.2 days based onCooke et al. (1999). The scheme provides a good simulationof soluble species concentrations in the United States (Parket al., 2003; 2004) and in North American and Asian outflow(Li et al., 2005; Park et al., 2005).
In the original version of GEOS-Chem, the emissionheights of carbonaceous aerosols, both anthropogenic andbiomass burning emissions, are evenly divided into themodel boxes within the boundary layer. Observations indi-cate that biomass burning injects carbonaceous aerosols tohigh latitudes due to the buoyancy and shallow convection(Dentener et al., 2006). In this study, we parameterize theinjection heights according to the fractional distribution ofemission heights for wild-land fires described by Dentener etal. (2006).
2.3.1.4 Emission of other species
The size-dependent emission of dust particles is calcu-lated with the dust emission module described in Fairlie etal. (2007). Global ammonia and NOx sources are as de-scribed by Park et al. (2006). The emissions of volatile or-ganic compounds are as described in Liao et al. (2007).
2.3.2 Representation of major particles in the coupledmodel
2.3.2.1 Sulfate (or secondary) particles
We use 40 sectional bins to represent sulfate (or secondary)particles covering dry diameters ranging from 0.0012µm to12µm. The first bin of sulfate particles corresponds to thesizes of freshly nucleated particles in the atmosphere whichgenerally have a dry diameter of∼1.2 nm (Yu and Turco,2008), therefore no parameterization is needed to scale thenucleated particles to the first bin particles.
Figure 1 shows the bin structure for sulfate particles andthe normalized number of particles emitted into each bin(1Ni/1logDpi) perµg of primary sulfate emitted based onthe parameterizations described in Sect. 2.3.1.1. The binstructure or width of each bin can be clearly seen from Fig. 1.As mentioned earlier, the bin resolution in the APM modelcan be variable so we can use a higher resolution for thesize range of our interest. The numerical diffusion is gener-ally small when the number of bins per decade of size spaceis >10 (Jacobson et al., 1994; Yu, 1998). For the GEOS-Chem-APM coupled model, we have 30 bins for 0.0012–0.12µm (dry diameter) range and another 10 bins for 0.12–12µm, leaving a high resolution for the size range importantto the growth of nucleated particles to CCN (i.e.,∼15 binsper decade). The variable bin structure enables us to coverfull particle size range and have good resolution in the sizerange important for the study (in the current case nucleationmode and CCN particles) while maintaining a reasonable to-tal number of bins (and hence computing cost).
Based on the two log-normal distributions shown in Fig. 1,per µg of primary sulfate emission adds 2.08×10¹⁰ of par-ticles to the nucleation mode (5% mass) and 3.55×10⁸ ofparticles to the accumulation mode (95% mass). Our modelhas the option to treat the accumulation mode sulfate mass asnew particles (increase in number concentration) or as masscondensed to the existing particles (no increase in numberconcentration). As noted in Sect. 2.3.1.1, the sulfate massin the accumulation mode is the mass condensing on the ex-isting particles and thus doesn’t form new particles (i.e., noincrease in number concentration). In the present study, this95% of primary sulfate mass is added to the sulfate mass as-sociated with primary BC and OC particles. It should also benoted that even those nucleation mode particles, while calledprimary sulfates, are actually secondary particles associatedwith sub-grid new particle formation in SO2 plumes.
2.3.2.2 Sea salt
Primary emission is the only source of sea salt particleswhich generally have dry diameters larger than∼10 nm.Based on our assessment of size-resolved sea salt emissionobservations and parameterizations (O’Dowd et al., 1997;Clark et al., 2006), sea salt particles with dry diameters
www.atmos-chem-phys.net/9/7691/2009/ Atmos. Chem. Phys., 9, 7691–7710, 2009

7696 F. Yu and G. Luo: Simulation of particle size distribution with a global aerosol model
1
10-4
10-3
10-2
10-1
100
101
102
103
104
105
106
107
108
109
1010
1011
10-3
10-2
10-1
100
101
Dry Diameter (μm)
ΔNi/
Δlog
Dp
per
μg
of e
mit
ted
sulf
ate
(# p
er μ
g)
1 5 10 15 20 25 30 35 40
i
Nucleation mode (5% mass, Dg= 10 nm, σ = 1.6)
Condensation mode (95% mass, Dg= 70 nm, σ = 2)
Figure 1.
Fig. 1. Bin structure for sulfate particles and normalized number of primary sulfate particles emitted into each bin (1Ni/1logDpi) perµg ofsulfate emitted. The bin indices are marked with red numbers in the bottom of the figure. Bin resolution is variable, with 30 bins allocated for0.0012–0.12µm range (dry diameter) and another 10 bins for 0.12–12µm range. The bin middle sizes are marked with dots and the edgesare shown in rectangle columns. The bin structure is chosen to have relatively high resolution for the size range important to the growth ofnucleated particles (a few nanometers) to CCN (dry diameters:∼30–80 nm). See text for discussion about the parameterization of primarysulfate emissions.
2
10-3
10-2
10-1
100
101
Dry Diameter (μm)
0
1
2
3
4
5
dF/d
logD
p (
m
-2 s
-1)
U10 = 9 m/s
�
10 5
Figure 2. Fig. 2. Bin structure for sea salt particles and the normalized num-
ber flux of sea salt particles (dF/dlogdr in # m−2 s−1) based on theparameterization of Clarke et al. (2006) with wind speed at a heightof 10 m (U10)=9 m/s. Bin resolution is variable and 10 bins areused for 0.012–0.12µm (dry diameter) range and another 10 binsfor 0.12–12µm. The middle sizes are marked with dots and theedges are shown in rectangle columns. The bin structure is chosento have relatively high resolution for the size range important to thecontribution of sea salt to CCN number abundance.
smaller than∼10 nm are negligible both in term of numberand mass concentration, and there is no need to representsmall size sea salt particles in the model. In the present study,the size-resolved sea salt emission is based on the parame-terization of Clarke et al. (2006). We use 20 sectional binsto represent sea salt, covering dry diameters from 0.012 to12µm. Figure 2 shows bin structure for sea salt and normal-ized number flux of sea salt particles (dF/dlogdr in #/m2s)based on the parameterization of Clarke et al. (2006). Thepeak in number-based flux is around∼0.045µm. Bin res-olution is variable and 10 bins are used for 0.012–0.12µm(dry diameter) range and another 10 bins for 0.12–12µm.The bin structure is chosen to have relatively high resolutionfor the size range important to the contribution of sea salt toCCN number abundance.
2.3.2.3 Primary BC and OC (BCOC) particles
In GEOS-Chem, the total mass of hydrophobic BC, hy-drophilic BC, hydrophobic OC, and hydrophilic OC aretracked during the emission, transport, deposition, and scav-enging processes. In the present study, we do not imple-ment the size-resolved microphysics for primary BCOC. Pri-mary BCOC particles generally have a log-normal distribu-tion, and we derive the BCOC number concentrations fromthe simulated mass and assumed size distributions. Exist-ing measurements indicate that the size of BCOC from fossil
Atmos. Chem. Phys., 9, 7691–7710, 2009 www.atmos-chem-phys.net/9/7691/2009/
F. Yu and G. Luo: Simulation of particle size distribution with a global aerosol model 7697
fuel (BCOCFF ) consumption is quite different from thosefrom biofuel and biomass burning (BCOCBB ) (Dentener etal., 2006). Dentener et al. (2006) recommended a mode di-ameter of 30 nm and standard deviation of 1.8 for BCOCFF ,and mode diameter of 80 nm and standard deviation of 1.8for BCOCBB . Based on our review of the relevant literature,the mode diameters recommended by Dentener et al. (2006)appear to be much smaller than what have been observed(including the data presented in Fig. C1 of Dentener et al.,2006). The log-normal mode diameter of BCOCFF is gener-ally ∼60 nm (Kittelson et al., 2000, 2006; Eastwood, 2007;Weimer et al., 2009) while that of BCOCBB is ∼150 nm(e.g., Anderson et al., 1996; also see Fig. C1 in Denteneret al., 2006).
To properly calculate the contribution of BCOC to thenumber concentration of total particles as well as CCN,we separate BCOC into two categories (i.e., BCOCFF andBCOCBB ) and each category has four tracers (i.e., hydropho-bic BC, hydrophilic BC, hydrophobic OC, and hydrophilicOC). In the present study, BCOCFF is assumed to have a log-normal distribution with number median diameter of 60 nmand standard deviation of 1.8, and BCOCBB is assumed tohave a log-normal distribution with number median diame-ter of 150 nm and standard deviation of 1.8. We assume thatonly hydrophilic BC and OC can serve as CCN.
2.3.2.4 Secondary organic aerosol (SOA)
The schemes used to represent and simulate SOA forma-tion in GEOS-Chem have been described in Chung and Se-infeld (2002) and Liao et al. (2007). Monoterpenes andother reactive volatile organic compounds (ORVOCs) are di-vided into five hydrocarbon classes according to the valuesof their experimentally measured aerosol yield parameters.The semi-volatile gas phase products from the oxidation ofvarious hydrocarbons (including isoprene) by OH, O3, andNO3 are lumped into four tracers (SOG1, SOG2, SOG3,and SOG4), and all aerosol phase products are aggregatedinto four corresponding tracers (SOA1, SOA2, SOA3, andSOA4). The partition of SOGs onto seed aerosols, whichinclude primary organic carbon, sulfate, ammonium, nitrate,and sea salt, is considered in GEOS-Chem.
2.3.2.5 Dust
Dust particles in GEOS-Chem are represented by 4 sizesections (diameters: 0.2–2.0, 2.0–3.6, 3.6–6.0, and 6.0–12.0µm) (Ginoux et al., 2004).
2.3.2.6 Sulfate mass scavenged by other types of particles
While secondary sulfate particles (containing nitrate, ammo-nium, and SOAs through equilibrium uptake or partition)are ubiquitous in the atmosphere and appear to dominate thenumber concentrations in many regions, the primary particles(BC, POC, dust, and sea salt) could be important and even
dominant in some regions. The scavenging of secondary par-ticles by primary particles is an important process in gov-erning the total particle number concentrations. In order toassess the relative contribution of secondary versus primaryparticles to CCN budget, the scavenging of secondary parti-cles by primary particles has to be properly considered. Inthe present study, the coagulation scavenging of secondarysulfate particles by primary particles are simulated using fourseparate tracers (BCsulfate, OCsulfate, sea saltsulfate, anddust sulfate) to keep track of the bulk sulfate mass associatedwith BC, OC, sea salt, and dust, respectively. It should benoted that we add the sulfate mass to primary particles aftercoagulation even when the sulfate particles are larger than theprimary particles, which may lead to the underestimation ofthe contribution of secondary particles to CCN. In additionto coagulation, condensation (of sulfuric acid) and in-cloudSO2 oxidation also contribute to BCsulfate, OCsulfate, seasalt sulfate, and dustsulfate. When some of BC, OC, seasalt, and dust are removed from the atmosphere via dry andwet deposition, the corresponding portion of sulfate associ-ated with these particles are also removed. The equilibriumuptake of nitrate, ammonium, and SOAs by the sulfate massassociated with primary particles and the resulting changein the sizes of primary particles are considered in our sim-ulation and CCN calculation. We distribute the sulfate (andassociated SOA, nitrate, ammonium) to the bulk populationsaccording to the surface areas of primary particles.
2.3.3 Key microphysical processes controlling particlesize distributions
2.3.3.1 Nucleation
Nucleation is one of the key process controlling particle num-ber distribution and CCN number abundance. In this study,we focus on the ion-mediated nucleation (IMN) because it isphysically-based and constrained by recently available lab-oratory data (Yu, 2006), can explain most of the nucleationevents observed in boreal forests (Yu and Turco, 2008), andpredicts global nucleation distributions in reasonable consis-tency (in terms of both spatial patterns and absolute magni-tude) with land-, ship-, and aircraft-based observations (Yuet al., 2008).
As pointed out in the Introduction, several recent stud-ies used the empirical formula to represent boundary layernucleation while employed binary homogeneous nucleationtheory for nucleation calculation above boundary layer (e.g.,Spracklen et al., 2008; Makkonen et al., 2009; Wang andPenner, 2009). A major difference of present study is that weapply the same physics-based IMN mechanism to the wholeatmosphere. The IMN model takes into account the varia-tions of [H2SO4], temperature, relative humidity, ionization,and surface area of pre-existing particles on global new par-ticle formation. The deterministic physics underlying theIMN mechanism allows the spatial and temporal variations
www.atmos-chem-phys.net/9/7691/2009/ Atmos. Chem. Phys., 9, 7691–7710, 2009

7698 F. Yu and G. Luo: Simulation of particle size distribution with a global aerosol model
of secondary particle formation (via IMN) and its contribu-tion to total particle number concentration and CCN abun-dance in the whole atmosphere to be quantified in a consis-tent way.
For IMN rate calculation, we employ look-up tables pre-generated from detailed kinetic IMN model (Yu, 2009), Witha simple multiple-variable interpolation subroutine, IMN ineach grid box can be calculated accurately (the error betweeninterpolated and full model values within a few percentage)and efficiently (Yu, 2009).
2.3.3.2 Condensation and equilibrium partition
Existing particles (especially nucleated particles) experiencesize changes through uptake or desorption of precursor gases.In the present study, the condensation of H2SO4 on particlesis explicitly resolved while the uptake of nitrate, ammonium,and condensable secondary organic compounds are consid-ered through equilibrium partition. The inorganic equilib-rium is calculated based on ISOROPIA (Nenes et al., 1998)and organic partition is calculated based on the Chung andSeinfeld (2002)’s scheme. The amounts of nitrate, ammo-nium, and SOA partitioned to sulfate particles in each bin andsulfate mass associated with primary particles are assumedto be proportional to the corresponding sulfate mass. There-fore, our model takes into account the effect of nitrate, am-monium, and SOA uptake on sulfate particle growth, whichis important to assess the contribution of nucleated particlesto CCN.
In the current model, secondary particles have three differ-ent sizes: the first one is the sulfate core size (i.e., the size ofsulfate only, defined in bin structure shown in Fig. 1), the sec-ond one is the dry size (sulfate + uptaken equilibrium nitrate,ammonium, and SOA), and the third is the wet size account-ing for hygroscopic growth (see Sect. 2.3.3.4). Wet size isused to calculate rates (surface area, condensation sink, coag-ulation coefficient, deposition rate, and scavenging rate) formicrophysical simulations. The particles are moving acrossbins only when their core sizes change (through H2SO4 con-densation and in-cloud oxidation).
Nucleation and condensation processes compete for sul-furic acid vapor, and a time step of 15 min is used for theintegrated calculations of H2SO4 vapor production, nucle-ation, and condensation. Number concentration of particlesis conserved during growth.
2.3.3.3 Coagulation
Coagulation is a process in which particles of various sizesand compositions collide with each other and coalesce toform larger particles. In the atmosphere, coagulation is animportant process scavenging small particles and turning ex-ternally mixed particles into internally mixed particles. In thepresent model, the mass conserving semi-implicit numericalscheme of Jacobson et al. (1994) is employed to solve the self
coagulation of size-resolved sulfate and sea salt particles, aswell as the scavenging of sulfate particles by sea salt, dust,BC, and POC particles.
Coagulation is the most time-consuming process amongvarious size-resolved microphysical processes (nucleation,growth, coagulation, and deposition). The reason is that co-agulation involves particles of different sizes and thus addstwo additional dimensions (size of particle A and size of par-ticle B) into 3-dimensional spatial grid system. For exam-ple, for 40 bins of sulfate, coagulation among sulfate par-ticles is equivalent to solving 40×40=1600 reaction equa-tions. In contrast, growth and deposition processes are 1-dimensional in particle size space thus only need to solve40 equations for size-resolved sulfate particles. The interac-tions among particles of different types or compositions alsoadd to the number of equations to be solved. For example,the interaction of 40-bin sulfate with 20-bin sea salt will add40×20=800 equations. To reduce the computing cost of 3-Dsectional aerosol microphysics model, it is important to op-timize the coagulation calculation. In the APM model, wehave implemented two schemes which substantially reducethe coagulation computing expenses. The first scheme is touse pre-generated lookup tables for coagulation kernel calcu-lations and the second one is to use a variable time-step forcoagulation calculations (Yu, 1998).
2.3.3.4 Hygroscopic growth, gravitational settling, anddry deposition
Hygroscopic growth of particles are calculated based ongrowth factor parameterizations of Li et al. (2001) for inor-ganic components, of Varutbangkul et al. (2006) for SOA,and of Gerber (1985) for sea salt. With these parameter-izations, we can obtain the wet size of different particlesfor the simulations of various microphysical processes. Thesize-dependent gravitational settling velocities are based onthe scheme given in Zhang et al. (2001). Dry depositionof aerosols in GEOS-CHEM is calculated using the updatedresistance-in-series approach of Wesely (1989).
2.3.3.5 Wet deposition and cloud processing
Wet deposition in GEOS-Chem, as described in Liu etal. (2001), includes scavenging in convective updrafts, rain-out and washout from convective anvils and large-scale pre-cipitation, and returning to the atmosphere following evap-oration. Below we discuss our modifications to the wet de-position scheme, aimed to take advantage of the additionaltracers treated in the coupled model.
For size-resolved sulfate and sea salt particles, we assumethat particles larger than the activation diameter are subjectedto removal via in-cloud scavenging (rainout). The activationdiameters for large-scale (0.19% supersaturation) and con-vective precipitation (0.75% supersaturation) are assumedto be 0.082µm and 0.032µm (dry diameter), respectively
Atmos. Chem. Phys., 9, 7691–7710, 2009 www.atmos-chem-phys.net/9/7691/2009/
F. Yu and G. Luo: Simulation of particle size distribution with a global aerosol model 7699
(Trivitayanurak et al., 2008). Scavenging in convective up-drafts is also limited to those activated particles (dry diame-ter larger than 0.032µm). We calculate the removal rate ofsulfate and sea salt particles by falling rain droplets usingthe size-resolved washout rate parameterization developedby Henzing et al. (2006), which calculates precipitation scav-enging coefficients as a function of aerosol particle size andprecipitation intensity.
The production of sulfate via in-cloud chemistry includesreactions with both hydrogen peroxide and ozone (Park etal., 2004). We distribute sulfate mass produced by in-cloudaqueous oxidation to particles of different types (includingsea salt, BC, POC, and dust particles) or bins (for sulfateparticles) according to the corresponding number concentra-tions of activated particles. Aqueous chemistry in stratiformand convective clouds is not distinguished in GEOS-Chem.Following the approach of Trivitayanurak et al. (2008), wedistribute sulfate produced by in-cloud aqueous oxidation tothose particles with dry diameter larger than 0.057µm (anaverage of aerosol activation diameters in stratiform and con-vective clouds).
2.3.4 Computing cost of the GEOS-Chem-APM model
In our study, all simulations are running on 8-CPU Linuxworkstations with the 2.2 Ghz Dual Quad-Core AMDOpteron Processor 2354. The model system is compiled us-ing OpenMP (http://www.openmp.org) for running in paral-lel. The original GEOS-Chem v8-01-03 code has 54 tracers,and it takes 24.23 h for one year full-chemistry simulations at4◦
×5◦ horizontal resolutions and 47 layers (GEOS-5 data).The coupled GEOS-Chem-APM model has 127 tracers (73additional tracers: 40 for sulfate, 20 for sea salt, one forH2SO4 gas, 4 tracers for BC/OC from fossil fuel, 4 tracers forBC/OC from biomass/bio-fuel, and 4 for sulfate attached todust, BC, primary OC, and sea salt particles). With full size-resolved microphysics (nucleation, condensation, coagula-tion, deposition, and scavenging) and chemistry, it takes thecoupled model (127 tracers) 52.35 h for the same year simu-lations on the same machine. In other words, our efficient mi-crophysics schemes allow the increase in the computing costper 100% increase in number of tracers (associated with par-ticle size information) to (52.35/24.23-1)/(127/54-1)=86%.Such a relatively small increase in the computing cost asso-ciated with full size-resolved microphysics is desirable andmakes the future coupling of APM model with global cli-mate model feasible.
3 Results
The results presented in this section are based on oneyear (2006) simulation of GEOS-Chem (version 8-01-03with a horizontal resolution of 4◦×5◦ and 47 layers up to0.01 hpa, GEOS-5 meteorological fields) coupled with the
APM model. The original GEOS-Chem model (54 tracers)was spun up for one year and then the coupled model (127tracers) was spun up for two additional months. All the re-sults presented in the manuscript have not been normalizedto standard condition (1 atm, 298K).
3.1 Spatial distributions of aerosol number concentra-tions: simulation and comparison with measure-ments
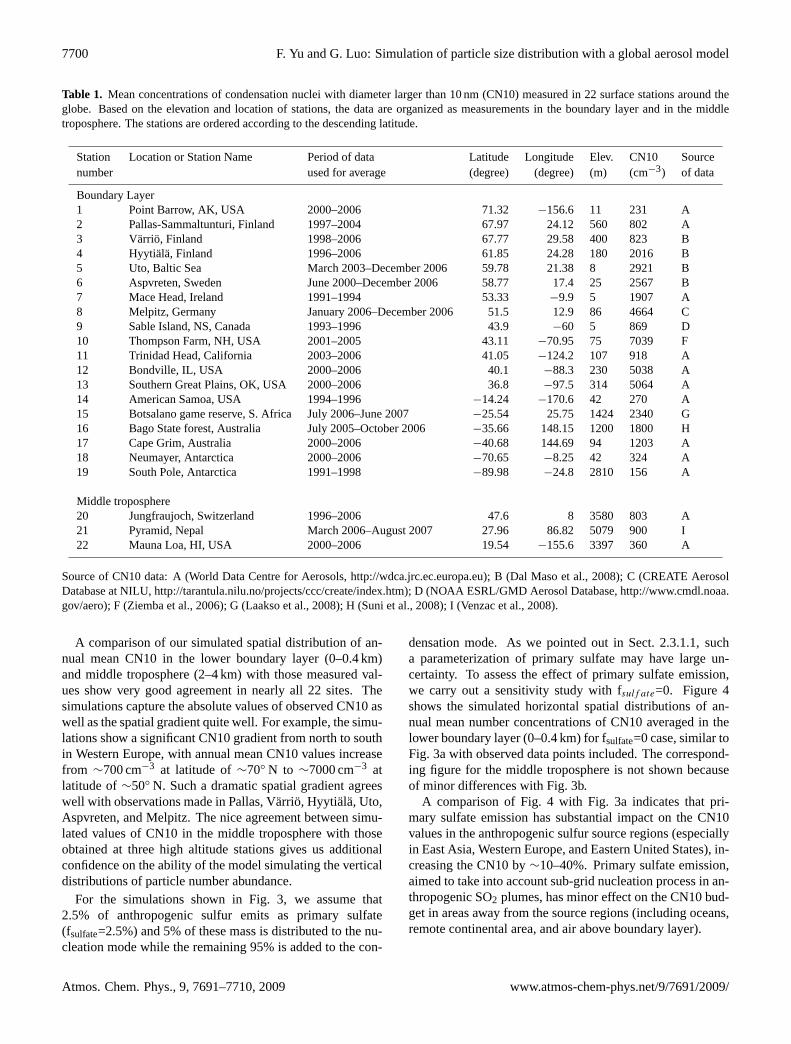
Number concentrations of atmospheric particles have beenmeasured in many parts of globe, and a number of sta-tions have continuous and long-term (multiple-year) mea-surements. To compare simulated results with observations,we compiled a list of surface observations that have at leastone full year of particle number concentration measurements.We limit the measurements to those taken outside urban ar-eas because the present simulation is not designed to resolvethe urban scale pollution. Table 1 summarizes mean con-centrations of condensation nuclei larger than 10 nm (CN10)from various sources which we have found to date and thecorresponding station information. While GEOS-Chem usessigma coordinates, it cannot resolve some sub-grid topogra-phies because of its horizontal resolution. Among the 22stations used in this study, three of them are considered tosample middle tropospheric air based on their elevation andlocation.
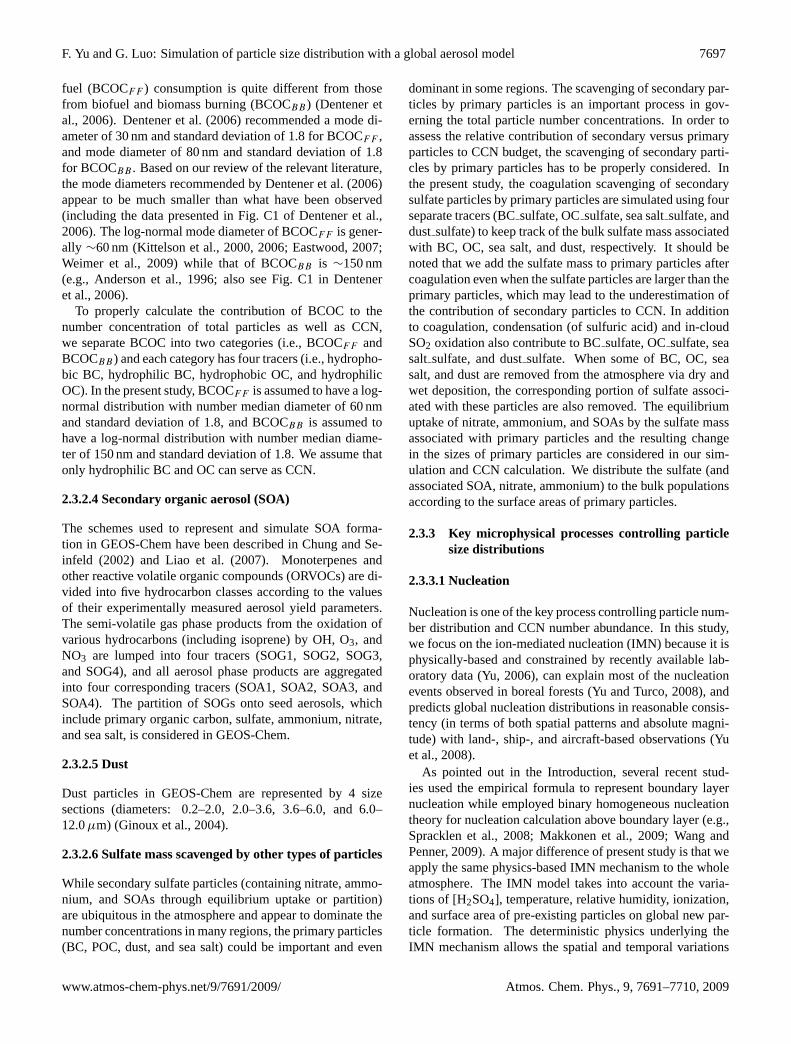
Figure 3 presents the simulated horizontal spatial distribu-tions of annual mean number concentrations of CN10 aver-aged within two altitude ranges: (a) Lower boundary layer(0–0.4 km), and (b) Middle troposphere (2–4 km). The frac-tion of anthropogenic sulfur emitted as sulfate is assumedto be 2.5%. The observed annual or multiple-year averagedCN10 values given in Table 1 are also overlaid on the plotsfor comparison.
It is clear from Fig. 3a that high concentrations of CN10in the boundary layer are generally confined to regions withlarge anthropogenic emissions. Annual mean CN10 canreach above 10 000 cm−3 in certain areas of United Statesand China. Over large area of Europe, annual mean CN10is over 3000 cm−3 with largest value reaches∼8000 cm−3.In the marine boundary layer (MBL) far from anthropogenicsources, CN10 is generally below 700 cm−3 and can be aslow as∼200 cm−3. Antarctic and Arctic boundary layer hasthe lowest CN10 with values around a few hundreds per cm3.
Figure 3b indicates that CN10 concentrations in the mid-dle troposphere (2–4 km) are much lower and the high con-centration regions no longer have a clear association with an-thropogenic source regions except in a few locations. CN10values in the 2–4 km altitude ranges are relatively high in thetropic and sub-tropic regions (30◦ S–45◦ N) with the annualmean values in the range of∼400–700 cm−3. Similar to theboundary layer, CN10 values in the middle troposphere overArctic regions are lowest (below∼200 cm−3).
www.atmos-chem-phys.net/9/7691/2009/ Atmos. Chem. Phys., 9, 7691–7710, 2009
7700 F. Yu and G. Luo: Simulation of particle size distribution with a global aerosol model
Table 1. Mean concentrations of condensation nuclei with diameter larger than 10 nm (CN10) measured in 22 surface stations around theglobe. Based on the elevation and location of stations, the data are organized as measurements in the boundary layer and in the middletroposphere. The stations are ordered according to the descending latitude.
Station Location or Station Name Period of data Latitude Longitude Elev. CN10 Sourcenumber used for average (degree) (degree) (m) (cm−3) of data
Boundary Layer1 Point Barrow, AK, USA 2000–2006 71.32 −156.6 11 231 A2 Pallas-Sammaltunturi, Finland 1997–2004 67.97 24.12 560 802 A3 Varrio, Finland 1998–2006 67.77 29.58 400 823 B4 Hyytiala, Finland 1996–2006 61.85 24.28 180 2016 B5 Uto, Baltic Sea March 2003–December 2006 59.78 21.38 8 2921 B6 Aspvreten, Sweden June 2000–December 2006 58.77 17.4 25 2567 B7 Mace Head, Ireland 1991–1994 53.33 −9.9 5 1907 A8 Melpitz, Germany January 2006–December 2006 51.5 12.9 86 4664 C9 Sable Island, NS, Canada 1993–1996 43.9 −60 5 869 D10 Thompson Farm, NH, USA 2001–2005 43.11 −70.95 75 7039 F11 Trinidad Head, California 2003–2006 41.05 −124.2 107 918 A12 Bondville, IL, USA 2000–2006 40.1 −88.3 230 5038 A13 Southern Great Plains, OK, USA 2000–2006 36.8 −97.5 314 5064 A14 American Samoa, USA 1994–1996 −14.24 −170.6 42 270 A15 Botsalano game reserve, S. Africa July 2006–June 2007 −25.54 25.75 1424 2340 G16 Bago State forest, Australia July 2005–October 2006 −35.66 148.15 1200 1800 H17 Cape Grim, Australia 2000–2006 −40.68 144.69 94 1203 A18 Neumayer, Antarctica 2000–2006 −70.65 −8.25 42 324 A19 South Pole, Antarctica 1991–1998 −89.98 −24.8 2810 156 A
Middle troposphere20 Jungfraujoch, Switzerland 1996–2006 47.6 8 3580 803 A21 Pyramid, Nepal March 2006–August 2007 27.96 86.82 5079 900 I22 Mauna Loa, HI, USA 2000–2006 19.54 −155.6 3397 360 A
Source of CN10 data: A (World Data Centre for Aerosols,http://wdca.jrc.ec.europa.eu); B (Dal Maso et al., 2008); C (CREATE AerosolDatabase at NILU,http://tarantula.nilu.no/projects/ccc/create/index.htm); D (NOAA ESRL/GMD Aerosol Database,http://www.cmdl.noaa.gov/aero); F (Ziemba et al., 2006); G (Laakso et al., 2008); H (Suni et al., 2008); I (Venzac et al., 2008).
A comparison of our simulated spatial distribution of an-nual mean CN10 in the lower boundary layer (0–0.4 km)and middle troposphere (2–4 km) with those measured val-ues show very good agreement in nearly all 22 sites. Thesimulations capture the absolute values of observed CN10 aswell as the spatial gradient quite well. For example, the simu-lations show a significant CN10 gradient from north to southin Western Europe, with annual mean CN10 values increasefrom ∼700 cm−3 at latitude of∼70◦ N to ∼7000 cm−3 atlatitude of∼50◦ N. Such a dramatic spatial gradient agreeswell with observations made in Pallas, Varrio, Hyytiala, Uto,Aspvreten, and Melpitz. The nice agreement between simu-lated values of CN10 in the middle troposphere with thoseobtained at three high altitude stations gives us additionalconfidence on the ability of the model simulating the verticaldistributions of particle number abundance.
For the simulations shown in Fig. 3, we assume that2.5% of anthropogenic sulfur emits as primary sulfate(fsulfate=2.5%) and 5% of these mass is distributed to the nu-cleation mode while the remaining 95% is added to the con-
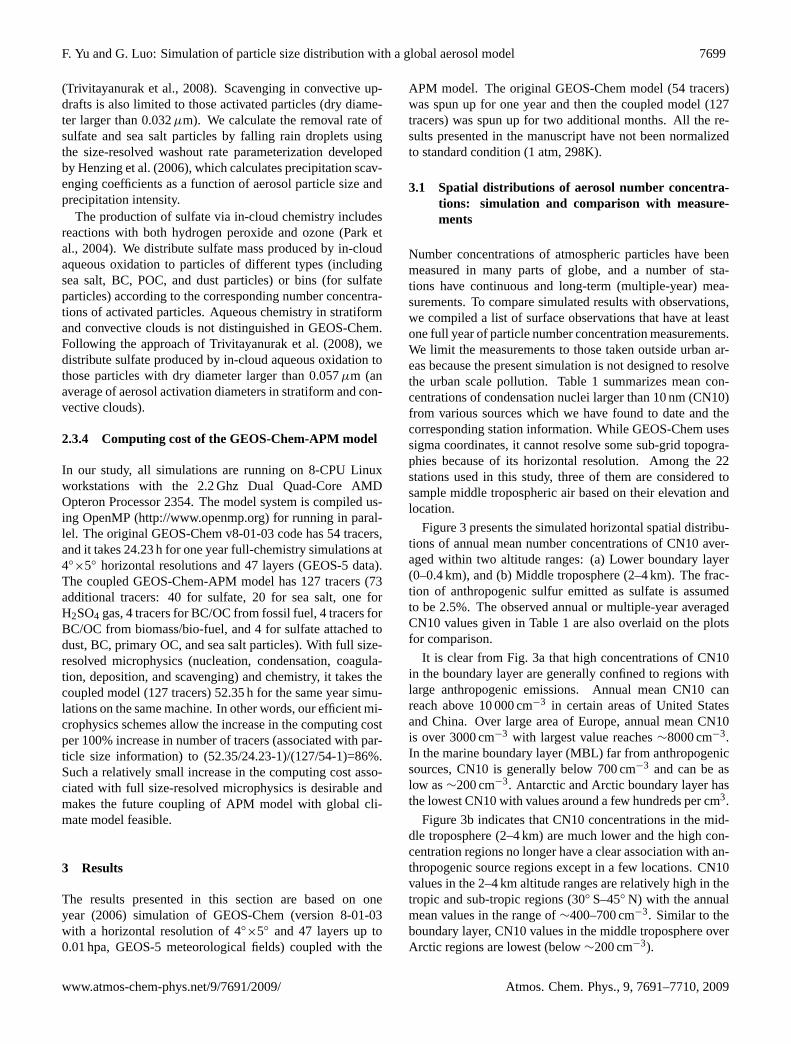
densation mode. As we pointed out in Sect. 2.3.1.1, sucha parameterization of primary sulfate may have large un-certainty. To assess the effect of primary sulfate emission,we carry out a sensitivity study with fsulf ate=0. Figure 4shows the simulated horizontal spatial distributions of an-nual mean number concentrations of CN10 averaged in thelower boundary layer (0–0.4 km) for fsulfate=0 case, similar toFig. 3a with observed data points included. The correspond-ing figure for the middle troposphere is not shown becauseof minor differences with Fig. 3b.
A comparison of Fig. 4 with Fig. 3a indicates that pri-mary sulfate emission has substantial impact on the CN10values in the anthropogenic sulfur source regions (especiallyin East Asia, Western Europe, and Eastern United States), in-creasing the CN10 by∼10–40%. Primary sulfate emission,aimed to take into account sub-grid nucleation process in an-thropogenic SO2 plumes, has minor effect on the CN10 bud-get in areas away from the source regions (including oceans,remote continental area, and air above boundary layer).
Atmos. Chem. Phys., 9, 7691–7710, 2009 www.atmos-chem-phys.net/9/7691/2009/

F. Yu and G. Luo: Simulation of particle size distribution with a global aerosol model 7701
3
Figure 3.
Fig. 3. Simulated horizontal spatial distributions of annual mean number concentrations of particles larger than 10 nm (CN10) averagedwithin two altitude ranges:(a) Lower boundary layer (0–0.4 km),(b) Middle troposphere (2–4 km). The observed annual or multiple yearaveraged CN10 values given in Table 1 are also overlapped on the plots for comparison. 2.5% of anthropogenic sulfur is assumed to beemitted as sulfate.
A more specific comparison of simulated CN10 with ob-served values is presented in Fig. 5 where the simulated val-ues are plotted against corresponding observed values at 22sites listed in Table 1. As shown in Fig. 3, the simulatedannual mean CN10 values agree quite well with observedones, within a factor of two for all the sites except one. Thesimulated CN10 at South Great Plains (station # 13 in Ta-ble 1) is∼40% of the observed annual mean value, indicatingthat the current model under-predicts the new particle forma-tion (or primary particle emission) in the region. The exactreason of such a substantial under-prediction remains to beinvestigated.
Figure 5 further shows that the emission of 2.5% of an-thropogenic sulfur as primary sulfate has minor effects forsites far away from source regions but can increase the an-nual mean CN10 by around 10–40% in or near source re-gions. Inclusion of a few percentage of primary sulfate emis-sion, aimed to take into account the sub-grid scale nucleation,appears to improve the agreements of simulated CN10 withobserved values in high anthropogenic sulfur source regionssuch as in Western Europe and Eastern United States. Theremaining paper will focus on the case with fsulfate=2.5%.
www.atmos-chem-phys.net/9/7691/2009/ Atmos. Chem. Phys., 9, 7691–7710, 2009

7702 F. Yu and G. Luo: Simulation of particle size distribution with a global aerosol model
4
Figure 4. Fig. 4. Same as Fig. 3a except with no primary sulfate emission.
5
100 1000 10000Observed CN10 (#/cm
3)
100
1000
10000
Sim
ulat
ed C
N10
(#/
cm3 )
primary sulfate emission: 0% (dots) and 2.5% (triangles)
Lower boundary layer (0−0.4 km)Middle tropopshere (2−4 km)Lower boundary layer (0−0.4 km)Middle tropopshere (2−4 km)
Figure 5.
Fig. 5. Comparison of simulated and observed annually averagednumber concentrations of condensation nuclei larger than 10 nm(CN10) at 22 sites listed in Table 1. The solid line shows a 1:1 ratioand the dashed lines show ratios of 2:1 and 1:2. Filled circles arefor the case with no primary sulfate emission (i.e., fsulf ate = 0) andunfilled triangles are for the case with 2.5% of anthropogenic sul-fur emitted as sulfate (i.e., fsulfate=2.5%). The symbols in black andblue denote the sites in lower boundary layer (0–0.4 km) while thosein red and green denote values in middle troposphere (2–4 km).
3.2 Relative contribution of secondary versus primaryparticles to total aerosol number abundance
We showed in Sect. 3.1 that our model simulations agree wellwith observed number concentrations of particles larger than10 nm. Both formation of secondary particles (i.e., nucle-ation) and direct emission of primary particles contribute toatmospheric particle number abundance. It will be interest-ing to understand the role of new particle formation in parti-cle number budget in different parts of the globe.
Figure 6 presents the simulated horizontal (averaged inthree lowest model layers representing the lower boundarylayer) and vertical (zonal-averaged) spatial distributions ofannual mean ion-mediated nucleation rate (JIMN ), total num-ber concentration of condensation nuclei larger than 3 nm(CN3), and the fraction of CN3 that is secondary (f sec
CN3). Thespatial distribution of JIMN in the boundary layer (Fig. 6a)is generally consistent with our previous study (Yu et al.,2008), showing that ion-mediated nucleation in the bound-ary layer (in consistent with a number of land and ship basednucleation measurements, Yu et al., 2008) is largely con-fined to two broad latitude belts (∼20◦ N–70◦ N, ∼30◦ S–90◦ S) and nucleation rates over continentals are generallymuch higher than those in MBL. Vertically we’ve seen sig-nificant JIMN differences between the present and previousstudies in the upper troposphere. Figure 3b shows thatthe high JIMN values located in the tropical upper tropo-sphere between 400–200 mb, with peak annual mean valuesof ∼0.1–0.2 cm−3 s−1. In the previous study that didn’t con-sider size-resolved microphysics (Yu et al., 2008), the peakJIMN exceeds 1 cm−3 s−1 in the tropic regions above 200 mb,which is most likely associated with the under-prediction of
Atmos. Chem. Phys., 9, 7691–7710, 2009 www.atmos-chem-phys.net/9/7691/2009/

F. Yu and G. Luo: Simulation of particle size distribution with a global aerosol model 7703
6
Figure 6.
Fig. 6. Horizontal ((a), (c), (e): average over first three model layers above Earth’s surface) and vertical ((b), (d), (f): sigma=pressure/surfacepressure) distributions of annual mean values of ion-mediated nucleation rate (JIMN ), total concentration of particle larger than 3 nm (CN3),and fraction of CN3 that is secondary.
condensation sink and over-prediction of H2SO4 vapor con-centrations in the tropical upper troposphere.
The spatial distribution of CN3 (Fig. 6c–6d) depends notonly on new particle formation rates (Fig. 6a–6b) but alsoon primary particle emissions, particle transport and scav-enging processes. Figure 6c and 6d indicate that the regionswith high CN3 values are generally associated with high nu-cleation zones but it is also clear that transport, scavenging,and primary emission have substantial impact on CN3 val-ues in some regions. For example, in tropical MBL, while
nucleation is negligible, transport results in an annual meanCN3 values of 200–1000 cm−3. The vertical gradient in CN3over tropic regions (Fig. 6d) confirms the downward trans-port of particles formed in the upper troposphere. Primaryparticle emissions also add substantial amounts of particlenumbers in East Asia and Western Europe. The low CN3zone (around 60◦ S) in the Southern Ocean BL is due to thescavenging of nucleated particles by sea salt particles. Verti-cally, there are two regions of high zonally-averaged annualmean CN3 (Fig. 6d): one in the tropical upper troposphere
www.atmos-chem-phys.net/9/7691/2009/ Atmos. Chem. Phys., 9, 7691–7710, 2009
7704 F. Yu and G. Luo: Simulation of particle size distribution with a global aerosol model
7
Figure 7.
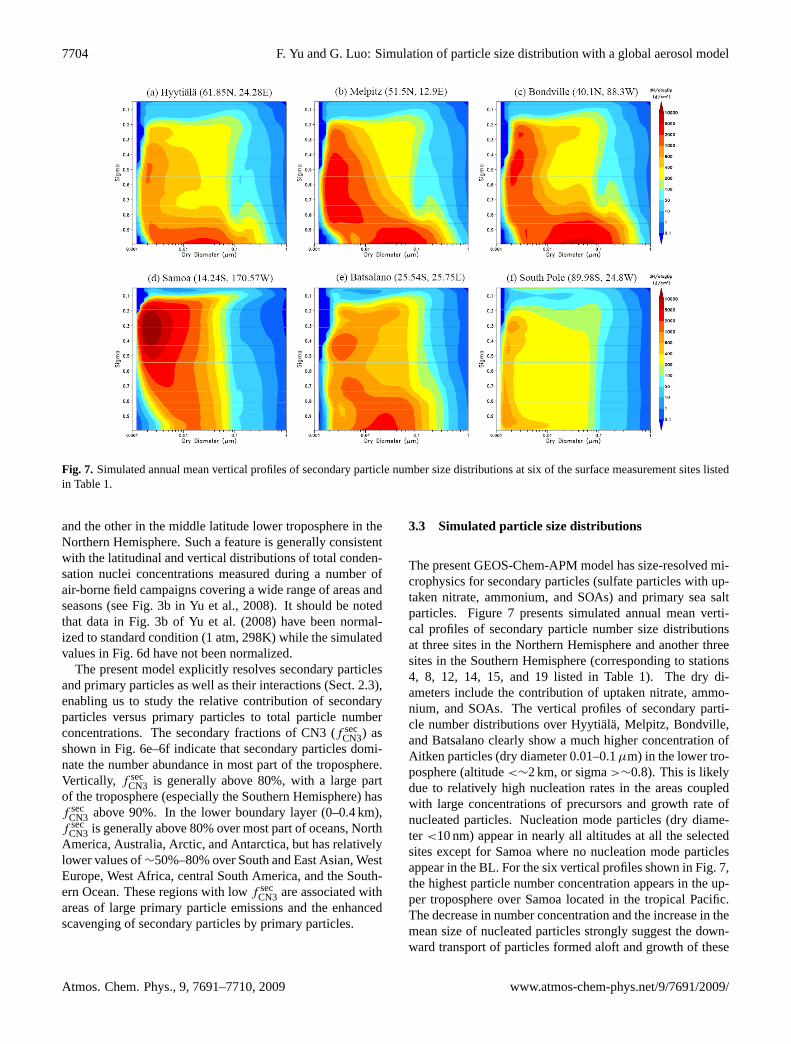
Fig. 7. Simulated annual mean vertical profiles of secondary particle number size distributions at six of the surface measurement sites listedin Table 1.
and the other in the middle latitude lower troposphere in theNorthern Hemisphere. Such a feature is generally consistentwith the latitudinal and vertical distributions of total conden-sation nuclei concentrations measured during a number ofair-borne field campaigns covering a wide range of areas andseasons (see Fig. 3b in Yu et al., 2008). It should be notedthat data in Fig. 3b of Yu et al. (2008) have been normal-ized to standard condition (1 atm, 298K) while the simulatedvalues in Fig. 6d have not been normalized.
The present model explicitly resolves secondary particlesand primary particles as well as their interactions (Sect. 2.3),enabling us to study the relative contribution of secondaryparticles versus primary particles to total particle numberconcentrations. The secondary fractions of CN3 (f sec
CN3) asshown in Fig. 6e–6f indicate that secondary particles domi-nate the number abundance in most part of the troposphere.Vertically, f sec
CN3 is generally above 80%, with a large partof the troposphere (especially the Southern Hemisphere) hasf sec
CN3 above 90%. In the lower boundary layer (0–0.4 km),f sec
CN3 is generally above 80% over most part of oceans, NorthAmerica, Australia, Arctic, and Antarctica, but has relativelylower values of∼50%–80% over South and East Asian, WestEurope, West Africa, central South America, and the South-ern Ocean. These regions with lowf sec
CN3 are associated withareas of large primary particle emissions and the enhancedscavenging of secondary particles by primary particles.
3.3 Simulated particle size distributions
The present GEOS-Chem-APM model has size-resolved mi-crophysics for secondary particles (sulfate particles with up-taken nitrate, ammonium, and SOAs) and primary sea saltparticles. Figure 7 presents simulated annual mean verti-cal profiles of secondary particle number size distributionsat three sites in the Northern Hemisphere and another threesites in the Southern Hemisphere (corresponding to stations4, 8, 12, 14, 15, and 19 listed in Table 1). The dry di-ameters include the contribution of uptaken nitrate, ammo-nium, and SOAs. The vertical profiles of secondary parti-cle number distributions over Hyytiala, Melpitz, Bondville,and Batsalano clearly show a much higher concentration ofAitken particles (dry diameter 0.01–0.1µm) in the lower tro-posphere (altitude<∼2 km, or sigma>∼0.8). This is likelydue to relatively high nucleation rates in the areas coupledwith large concentrations of precursors and growth rate ofnucleated particles. Nucleation mode particles (dry diame-ter <10 nm) appear in nearly all altitudes at all the selectedsites except for Samoa where no nucleation mode particlesappear in the BL. For the six vertical profiles shown in Fig. 7,the highest particle number concentration appears in the up-per troposphere over Samoa located in the tropical Pacific.The decrease in number concentration and the increase in themean size of nucleated particles strongly suggest the down-ward transport of particles formed aloft and growth of these
Atmos. Chem. Phys., 9, 7691–7710, 2009 www.atmos-chem-phys.net/9/7691/2009/

F. Yu and G. Luo: Simulation of particle size distribution with a global aerosol model 7705
8
Figure 8.
Fig. 8. Meridional distributions of(a) sea salt and(b) secondary particle number size distributions in the Atlantic MBL (0–0.4 km) atlongitude of 30◦ W.
particles during descent in the tropical regions. While mostsecondary particles are smaller than 0.1µm, we do see thata substantial fraction of nucleated particles can grow to thesize range that can act as CCN (∼0.03–0.08µm, dependingon the water supersaturation).
Figure 8 shows secondary particle and primary sea saltparticle number size distributions in the Atlantic MBL atdifferent latitudes along the line of longitude=30◦ W. Sul-fate particles generally dominate the number concentrationexcept around 60◦ S over the Southern Ocean. The ultra-fine mode of sea salt can be clearly seen. Secondary par-ticles appear to have bi-modal structure, one Aitken modesmaller than 0.1µm and another accumulation mode largerthan 0.1µm. There exist two zones of high secondary parti-cle concentration over the Pacific∼30◦ S and 45◦ N whichare associated with transport of pollutants from the conti-nents (also see Fig. 6c).
3.4 Global spatial distribution of CCN concentrationand the contribution of secondary particles
In the real atmosphere, the number of aerosols activatedto become cloud droplets depends on particle size distri-bution, composition, and water vapor supersaturation (S),and thus is expected to have significant spatial and tempo-ral variations. Based on the simulated size distributions ofsecondary particles and sea salt particles in addition to as-sumed sizes of other primary particles (BC, OC, and dust),we can calculate the spatial distribution of CCN concentra-tion at a given supersaturation. Figure 9 show the predictedCCN concentration at S=0.4% (CCN0.4) and the fraction ofsecondary particle CCN (f sec
CCN) in the boundary layer (0–1 km). Corresponding zonal average vertical profiles areshown in Fig. 10. S=0.4%, representing an average S inthe atmosphere, is chosen here because many CCN mea-
surements gave CCN at S=0.4% (Andreae, 2009). Similarhorizontal and vertical distributions of CCN concentrationsandf sec
CCN at S=0.2% and S=0.8% are given in the Supple-mentary Materialhttp://www.atmos-chem-phys.net/9/7691/2009/acp-9-7691-2009-supplement.pdf.
Similar to the spatial distribution of total aerosol numberconcentrations (Figs. 3 and 6c), high CCN regions in thelower troposphere are generally confined to main continents.The highest value of CCN0.4 in the BL locates in East Asia,with peak concentration exceeding 2000 cm−3. CCN0.4 inthe BL over Eastern United States and a large part of Europehas values above 700 cm−3. In the MBL, CCN0.4 is muchlower with lowest CCN0.4 values of below 40 cm−3 locatedin South Pacific (∼30◦ S). Over the tropical MBL away fromcontinental influence, CCN0.4 is generally below 70 cm−3.The band of relatively high CCN0.4 over the Southern OceanMBL (around 60◦ S) is a result of high sea salt emission asso-ciated with strong wind. CCN0.4 in the BL of North Atlanticis above 100 cm−3 which is a factor∼2 higher than thosein remote MBL, indicating a substantial impact of anthro-pogenic emission on CCN in the region (also see Fig. 8). Ourpresent simulations indicate that annual mean CCN0.4 val-ues in the Antarctic BL are below 40 cm−3 while those in theArctic BL are in the range of 70–100 cm−3. Our simulatedCCN0.4 distributions are generally consistent with CCN0.4observations compiled by Andreae (2009), although most ofCCN measurements only lasted for a short period of time.This study focuses on annual mean values. Comparisons ofsimulated CCN0.4 with those observed at the specific monthor season will be the subject of future research.
The fraction of CCN0.4 in the BL that is secondary (f secCCN)
has large spatial variations. As expected,f secCCN has similar
horizontal spatial pattern as that off secCN3 (Fig. 6c) but is a
factor of∼1.5 smaller thanf secCN3. Generally more than 60%
of CCN0.4 in the BL over the tropical oceans, Antarctica,
www.atmos-chem-phys.net/9/7691/2009/ Atmos. Chem. Phys., 9, 7691–7710, 2009

7706 F. Yu and G. Luo: Simulation of particle size distribution with a global aerosol model
9
Figure 9.
Fig. 9. Predicted annual mean CCN concentration at supersatura-tion of 0.4% (CCN0.4) and the fraction of CCN0.4 that is secondary(f sec
CCN) in the boundary layer (0–1 km).
Eastern United States, Europe, and North Atlantic are sec-ondary. f sec
CCN is between 20%–60% in the BL of SouthAmerica, West Africa, East and South Asia, and the associ-ated continental outflow regions.f sec
CCN has lowest values ofbelow 20% in the Southern Ocean BL due to large predictedsea salt emissions in the region.
Vertically, CCN0.4 generally decreases with increasingaltitudes while f sec
CCN increases with increasing altitudes(Fig. 10). Over the middle latitude in the Northern Hemi-sphere, zonally averaged CCN0.4 decreases from∼400–700 cm−3 in the BL to below 100 cm−3 above altitude of∼4 km (sigma∼0.6), and the correspondingf sec
CCN valueschange from 50–60% to above∼70%. It is interesting tonote that CCN0.4 has relatively lower values (20–40 cm−3)in the middle and upper troposphere over the tropical regionsalthough the region contains the highest concentration of ul-trafine particles (Fig. 6d). In the Southern Hemisphere, thezonally averaged CCN0.4 is below 200 cm−3 and f sec
CCN isgenerally above 60% except in the Southern Ocean BL.
It should be noted that CCN shown in Figs. 9–10 are for S=0.4%. CCN concentrations andf sec
CCNwill generally increase with increasing S because sec-ondary particles become more dominant at smaller
10
Figure 10.
Fig. 10. Zonally-averaged latitudinal and vertical distributions ofannual mean values of CCN0.4 andf sec
CCN.
sizes (Fig. 6, also see Figs. S1–S2 in the Supple-mentary Materialhttp://www.atmos-chem-phys.net/9/7691/2009/acp-9-7691-2009-supplement.pdf). As can be ex-pected, our simulated spatial distributions of CCN concen-trations andf sec
CCN are subject to uncertainties because of theuncertainties in the calculations of nucleation rates and theparameterizations of primary particles as well as other chem-ical and microphysical processes. Comparisons with CCNmeasurements and other observed aerosol properties (for ex-ample, the fraction of particles containing refractive cores)will help to identify and reduce the uncertainties.
4 Summary and discussion
The magnitude of the aerosol indirect radiative forcing (IRF)represents the dominant uncertainty in assessing climatechange. A number of previous studies emphasize the impor-tance of representing size-resolved particle microphysics in
Atmos. Chem. Phys., 9, 7691–7710, 2009 www.atmos-chem-phys.net/9/7691/2009/

F. Yu and G. Luo: Simulation of particle size distribution with a global aerosol model 7707
global models and reducing uncertainties in the sources (nu-cleation and emission) of atmospheric particles. In this study,an advanced particle microphysics (APM) model has beenincorporated into a global chemistry transport model (GEOS-Chem) to simulate the number size distribution of tropo-spheric particles, focusing on the contribution of secondaryparticles to total aerosol number and CCN abundance.
We use 40 sectional bins to represent sulfate particles and20 bins to represent sea salt, with higher bin resolution inthe size range important for CCN calculation. The growth ofnucleated sulfate particles through the condensation of sulfu-ric acid vapor and equilibrium uptake of nitrate, ammonium,and SOAs is explicitly simulated in the coupled model. Thepresent model does not treat the size-resolved microphysicsfor BC, primary OC (POC), and dust. Nevertheless, the scav-enging of secondary sulfate particles by primary particles(dust, BC, POC, and sea salt) is considered. BC and POCparticles from fossil fuel are separated from those associatedwith open fire and bio-fuel because of the large differencesin the emission height and the sizes of BC and POC particlesfrom these two different sources.
We calculate new particles formation based on the state-of-the-art ion-mediated nucleation (IMN) model and con-strain the primary particle emissions with various measure-ments. Based on our simulations, the annual mean num-ber concentrations of tropospheric particles have clear spa-tial patterns and vary from a few hundreds per cm3 to morethan 10 000 per cm3. Zones of high particle number concen-tration are generally confined to regions with large anthro-pogenic emissions in the boundary layer but shift to tropicalregions in the upper troposphere, which is consistent withmany in-situ observations. A comparison of our simulatedannual mean concentrations of condensation nuclei largerthan 10 nm (CN10) with those measured values show verygood agreement in near all 22 sites around the globe thathave at least one full year of CN10 measurements. The simu-lations capture the absolute values of observed CN10 (withina factor of two) as well as the spatial gradient quite well.
Our simulations indicate that secondary particles formedvia IMN appear to be able to account for the particle num-ber concentrations observed in many parts of the troposphere.The emission of 2.5% of anthropogenic sulfur as primary sul-fate (aimed to take into account the sub-grid scale nucleation)has minor effect on total particle number concentration in theregions remote from source regions but can increase the an-nual mean CN10 by around 10–40% in or near source re-gions. Secondary particles appear to dominate the numberabundance in most parts of the troposphere (> ∼80%), es-pecially over oceans and above the boundary layer over land(>∼90%). Primary particles can contribute up to∼20–50%of total particle numbers in and near strong source regions.
The simulated particle number distributions indicate that,while most of secondary particle are smaller than 0.1µm,a non-trivial fraction of nucleated particles can grow to thesize range that can act as CCN. Calculated CCN concentra-
tion at supersaturation of 0.4% (CCN0.4) and the fraction ofCCN0.4 that is secondary (f sec
CCN) have large spatial varia-tions. Generally more than 60% of CCN0.4 in the BL overthe tropical oceans, Antarctica, the Eastern United States,Europe, and the North Atlantic are secondary.f sec
CCN is be-tween 20%–60% in the BL of South America, West Africa,East and South Asia, and the associated continental outflowregions. In the Southern Hemisphere, the zonally averagedCCN0.4 is<200 cm−3 andf sec
CCN is generally above 60% ex-cept in the Southern Ocean BL. Over the middle latitudesin the Northern Hemisphere, zonally averaged CCN0.4 de-creases from∼400–700 cm−3 in the BL to below 100 cm−3
above altitudes of∼4 km, the correspondingf secCCN values
change from 50–60% to above∼70%.The present study shows the importance of secondary par-
ticles in the global total aerosol and CCN budget. Whilewe attempt to use state-of-art nucleation mechanisms andconstrain the primary particle emissions with as many ob-servations as possible, the present study is subject to uncer-tainties and further research are clearly needed to assess themodel performance and reduce uncertainty. Additionally, thesize-resolved microphysics for BC, POC, and dust are nottreated in the present model. In our future study, we willfurther improve the GEOS-Chem-APM model and carry outa more comprehensive evaluation of the model performanceby comparing simulated results with various relevant mea-sures (including size distribution and composition data andtheir seasonal variations, CCN measurements, etc.). We willalso assess how the uncertainties in the parameterizations ofprimary particle emissions and nucleation rate calculationsmay affect conclusions about the relative contribution of sec-ondary and primary particles to global CCN abundance indifferent parts of the troposphere.
Acknowledgements.This study is supported by NASA under grantNNX08AK48G, NSF under grant 0618124, and the NOAA/DOCunder grant NA05OAR4310103. The GEOS-Chem model ismanaged by the Atmospheric Chemistry Modeling Group atHarvard University with support from the NASA AtmosphericChemistry Modeling and Analysis Program.
Edited by: K. Lehtinen
References
Adams, P. J. and Seinfeld, J. H.: Disproportionate im-pact of particulate emissions on global cloud condensa-tion nuclei concentrations, Geophys. Res. Lett., 30, 1239,doi:10.1029/2002GL016303, 2003.
Adams, P. J. and Seinfeld, J. H.: Predicting global aerosol size dis-tributions in general circulation models, J. Geophys. Res., 107,4370, doi:10.1029/2001JD001010, 2002.
Albrecht, B. A.: Aerosols, cloud microphysics and fractionalcloudiness, Sciences, 245, 1227–1230, 1989.
www.atmos-chem-phys.net/9/7691/2009/ Atmos. Chem. Phys., 9, 7691–7710, 2009
7708 F. Yu and G. Luo: Simulation of particle size distribution with a global aerosol model
Alexander, B., Park, R. J., Jacob, D. J., Li, Q. B., Yantosca, R.M., Savarino, J., Lee, C. C. W., and Thiemens, M. H.: Sulfateformation in sea salt aerosols: Constraints from oxygen isotopes,J. Geophys. Res., 110, D10307, doi:10.1029/2004JD005659,2005.
Anderson, B., Grant W., Gregory, G., et al.: Aerosols from biomassburning over the South Atlantic region: Distributions and Im-pacts, J. Geophys. Res., 101, 24 117–24 138, 1996.
Andreae, M. O.: Correlation between cloud condensation nucleiconcentration and aerosol optical thickness in remote and pol-luted regions, Atmos. Chem. Phys., 9, 543–556, 2009,http://www.atmos-chem-phys.net/9/543/2009/.
Binkowski, F. S. and Shankar, U.: The regional particulate mattermodel, 1, Model description and preliminary results, J. Geophys.Res., 100, 26 191–26 209, 1995.
Bond, T. C., Streets, D. G., Yarber, K. F., Nelson, S. M., Woo, J.-H., and Klimont, Z.: A technology-based global inventory ofblack and organic carbon emissions from combustion, J. Geo-phys. Res., 109, D14203, doi:10.1029/2003JD003697, 2004.
Charlson, R. J., Schwartz, S. E., Hales, J. M., Cess, R. D., Coakley,J. A. J., Hansen, J. E., and Hofmann, D. J.: Climate forcing byanthropogenic aerosols, Science, 255, 423-430, 1992.
Chin, M., Kahn, R. A., and Schwart, S. E. (Eds.): AtmosphericAerosol Properties and Climate Impacts, A Report by the U.S.Climate Change Science Program and the Subcommittee onGlobal Change Research, National Aeronautics and Space Ad-ministration, Washington, D.C., USA, 2009.
Chung, S. H., and Seinfeld, J. H.: Global distribution and climateforcing of carbonaceous aerosols, J. Geophys. Res., 107, 4407,doi:10.1029/2001JD001397, 2002.
Clarke, A. D., Owens, S. R., and Zhou, J. C.: An ultrafine sea saltflux from breaking waves: Implications for cloud condensationnuclei in the remote marine atmosphere, J. Geophys. Res., 111,D06202, doi:10.1029/2005JD006565, 2006.
Cooke, W. F., Liousse, C., Cachier, H., and Feichter, J.: Con-struction of a 1◦×1◦ fossil fuel emission data set for carbona-ceous aerosol and implementation and radiative impact in theECHAM4 model, J. Geophys. Res., 104, 22 137–22 162, 1999.
Dal Maso, M., Hyvarinen, A., Komppula, M., et al.: Annual andinterannual variation in boreal forest aerosol particle number andvolume concentration and their connection to particle formation,Tellus B, 60B, 495–508, 2008.
Dentener, F., Kinne, S., Bond, T., et al.: Emissions of primaryaerosol and precursor gases in the years 2000 and 1750 pre-scribed data-sets for AeroCom, Atmos. Chem. Phys., 6, 4321-4344, 2006,http://www.atmos-chem-phys.net/6/4321/2006/.
Eastwood, P.: Particulate Emissions from Vehicles, SBN0470724552, John Wiley and Sons, 2008
Evans, M. J., and Jacob, D. J.: Impact of new laboratory studiesof N2O5 hydrolysis on global model budgets of tropospheric ni-trogen oxides, ozone, and OH, Geophys. Res. Lett., 32, L09813,doi:10.1029/2005GL022469, 2005.
Fairlie, D. T., Jacob, D. J., and Park, R. J.: The impact of transpa-cific transport of mineral dust in the United States, Atmos. Envi-ron., 41, 1251-1266, 2007.
Gagne, S., Laakso, L., Petaja, T., Kerminen, V.-m., and Kulmala,M.: Analysis of one year of Ion-DMPS data from the SMEAR IIstation, Finland, Tellus B, 60(3), 318–329, 2008.
Gerber, H. E.: Relative-humidity parameterization of the Navyaerosol model (NAM), NRL Report 8956, National ResearchLaboratory, Washington, D.C., USA, 1985.
Ginoux, P., Prospero, J. M., Torres, O., and Chin, M.: Long-termsimulation of global dust distribution with the GOCART model:Correlation with North Atlantic Oscillation, Environ. Modell.Softw., 19(2), 113–128, 2004.
Gong, S. L., Barrie, L. A., and Blanchet, J. P.: Modeling sea saltaerosols in the atmosphere: 1. Model development, J. Geophys.Res., 102, 3805–3818, 1997.
Hamill, P., Turco, R. P., Kiang, C. S., Toon, O. B., and Whitten,R. C.: An analysis of various nucleation mechanisms for sulfateparticles in the stratosphere, J. Aerosol Sci., 13, 561–585, 1982.
Henzing, J. S., Olivie, D. J. L., and van Velthoven, P. F. J.: A param-eterization of size resolved below cloud scavenging of aerosolsby rain, Atmos. Chem. Phys., 6, 3363–3375, 2006,http://www.atmos-chem-phys.net/6/3363/2006/.
Hirsikko, A., Bergman, T., Laakso, L., Dal Maso, M., Riipinen, I.,Horrak, U., and Kulmala, M.: Identification and classificationof the formation of intermediate ions measured in boreal forest,Atmos. Chem. Phys., 7, 201–210, 2007,http://www.atmos-chem-phys.net/7/201/2007/.
IPCC: Climate Change 2007: The Physical Scientific Basis, editedby: Solomon, S., Qin, D., Manning, M., et al., Cambridge Univ.Press, New York, USA, 2007.
Jacobson, M. Z. and Turco, R. P.: Simulating condensationalgrowth, evaporation and coagulation of aerosols using a com-bined moving and stationary size grid, Aerosol Sci. Tech., 22,73–92, 1995.
Jacobson, M., Turco, R., Jensen, E. and Toon O.: Modeling coagu-lation among particles of different composition and size, Atmos.Environ., 28, 1327–1338, 1994.
Karcher, B. and Yu, F.: The role of aircraft soot emis-sions in contrail formation, Geophy. Res. Lett., 36, L01804,doi:10.1029/2008GL036649, 2009.
Kittelson, D., Johnson, J., Watts, W., et al.: Diesel aerosol samplingin the atmosphere, SAE Paper No. 2000-01-2212, 2000.
Kittelson, D. B., Watts, W. F., and Johnson, J. P.: On-road and lab-oratory evaluation of combustion aerosols – Part1: Summary ofdiesel engine results, J. Aerosol Sci., 37, 913–930, 2006.
Kuang, C., McMurry, P. H., McCormick, A. V., and Eisele, F. L.:Dependence of nucleation rates on sulfuric acid vapor concen-tration in diverse atmospheric locations, J. Geophys. Res., 113,D10209, doi:10.1029/2007JD009253, 2008.
Laakso, L., Gagne, S., Petaja, T., Hirsikko, A., Aalto, P. P., Kulmala,M., and Kerminen, V.-M.: Detecting charging state of ultra-fineparticles: instrumental development and ambient measurements,Atmos. Chem. Phys., 7, 1333–1345, 2007,http://www.atmos-chem-phys.net/7/1333/2007/.
Laakso, L., Laakso, H., Aalto, P. P., et al.: Basic characteristics ofatmospheric particles, trace gases and meteorology in a relativelyclean Southern African Savannah environment, Atmos. Chem.Phys., 8, 4823–4839, 2008,http://www.atmos-chem-phys.net/8/4823/2008/.
Li, J., Wong, J. G. D., Dobbie, J. S., and Chylek, P.: Parameteri-zation of the optical properties and growth of sulfate aerosols, J.Atmos. Sci., 58, 193–209, 2001.
Li, Q., Jiang, J. H., Wu, D. L., et al.: Convective outflow ofSouth Asian pollution: a global CTM simulation compared
Atmos. Chem. Phys., 9, 7691–7710, 2009 www.atmos-chem-phys.net/9/7691/2009/

F. Yu and G. Luo: Simulation of particle size distribution with a global aerosol model 7709
with EOS MLS observations, Geophys. Res. Lett., 32, L14826,doi:10.1029/2005GL022762, 2005.
Liao H., Henze, D. K., Seinfeld, J. H., Wu, S., and Mickley, L.J.: Biogenic secondary organic aerosol over the United States:Comparison of climatological simulations with observations, J.Geophys. Res., 112, D06201, doi:10.1029/2006JD007813, 2007.
Liu, H., Jacob, D. J., Bey, I., and Yantosca, R. M.: Constraints from210Pb and 7Be on wet deposition and transport in a global three-dimensional chemical tracer model driven by assimilated mete-orological fields, J. Geophys. Res.-Atmos., 106, 12 109–12 128,2001.
Makkonen, R., Asmi, A., Korhonen, H., et al.: Sensitivity ofaerosol concentrations and cloud properties to nucleation andsecondary organic distribution in ECHAM5-HAM global circu-lation model, Atmos. Chem. Phys., 9, 1747–1766, 2009,http://www.atmos-chem-phys.net/9/1747/2009/.
Mark, G., Kuhns, H., Pitchford, M., Dietz, R., Ashbaugh, L., andWatson, T.: Application of the Tracer-Aerosol Gradient Interpre-tive Technique (TAGIT) to sulfur attribution for the Big BendRegional Aerosol and Visibility Observational (BRAVO) Study,JAPCA J. Air Waste Ma., 53, 586–595, 2003.
Martin, R. V., Jacob, D. J., Yantosca, R. M., Chin, M., and Ginoux,P.: Global and regional decreases in tropospheric oxidants fromphotochemical effects of aerosols, J. Geophys. Res., 108, 4097,doi:10.1029/2002JD002622, 2003.
Nenes, A., Pandis, S. N., and Pilinis, C.: ISORROPIA: A new ther-modynamic equilibrium model for multiphase multicomponentinorganic aerosols, Aquat. Geochem., 4, 123–152, 1998.
NRC: Radiative Forcing of Climate Change: Expanding the Con-cept and Addressing Uncertainties, National Academies Press,2005.
O’Dowd, C. D., Smith, M. H., Consterdine, I. E., and Lowe, J. A.:Marine aerosol, sea salt, and the marine sulpher cycle: A shortreview, Atmos. Environ., 31, 73–80, 1997.
Olivier, J. G. J., Berdowski, J. J. M., Peters, J. A. H. W., Bakker,J., Visschedijk, A. J. H., and Bloos, J.-P. J.: Applicationsof EDGAR. Including a description of EDGAR 3.0: refer-ence database with trend data for 1970-1995. RIVM, Bilthoven.RIVM report no. 773301 001/ NOP report no. 410200 051, 2001.
Pan, W., Tatang, M. A., McRae, G. J., and Prinn, R. G.: Uncer-tainty analysis of indirect radiative forcing by anthropogenic sul-fate aerosols, J. Geophys. Res., 103(D4), 3815–3823, 1998.
Park, R. J., Jacob, D. J., Field, B. D., Yantosca, R. M.,and Chin, M.: Natural and transboundary pollution influ-ences on sulfate-nitrate-ammonium aerosols in the UnitedStates: Implications for policy, J. Geophys. Res., 109, D15204,doi:10.1029/2003JD004473, 2004.
Park, R. J., Jacob, D. J., Chin, M., and Martin, R. V.: Sourcesof carbonaceous aerosols over the United States and impli-cations for natural visibility, J. Geophys. Res., 108, 4355,doi:10.1029/2002JD003190, 2003.
Park, R. J., Jacob, D. J., Kumar, N., and Yantosca, R. M.: Regionalvisibility statistics in the United States: Natural and transbound-ary pollution influences, and implications for the Regional HazeRule, Atmos. Environ., 40, 5405–5423, 2006.
Park, R. J., Jacob, D. J., Palmer, P. I., et al.: Export efficiency ofblack carbon aerosol in continental outflow: global implications,J. Geophys. Res., 110, D11205, doi:10.1029/2004JD005432,2005.
Pierce, J. R. and Adams, P. J.: Global evaluation of ccn formationby direct emission of sea salt and growth of ultrafine sea salt, J.Geophys. Res., 111, D06203, doi:10.1029/2005JD006186, 2006.
Pierce, J. R., Chen, K., and Adams, P. J.: Contribution of primarycarbonaceous aerosol to cloud condensation nuclei: Processesand uncertainties evaluated with a global aerosol microphysicsmodel, Atmos. Chem. Phys., 7, 5447–5466, 2007,http://www.atmos-chem-phys.net/7/5447/2007/.
Pierce, J. R. and Adams, P. J.: Uncertainty in global CCN concen-trations from uncertain aerosol nucleation and primary emissionrates, Atmos. Chem. Phys., 9, 1339–1356, 2009,http://www.atmos-chem-phys.net/9/1339/2009/.
Riipinen, I., Sihto, S.-L., Kulmala, M., et al.: Connections betweenatmospheric sulphuric acid and new particle formation duringQUEST III–IV campaigns in Heidelberg and Hyytiala, Atmos.Chem. Phys., 7, 1899–1914, 2007,http://www.atmos-chem-phys.net/7/1899/2007/.
Spracklen, D. V., Carslaw, K. S., Kulmala, M., eta l.: Contributionof particle formation to global cloud condensation nuclei con-centrations, Geophys. Res. Lett., 35, L06808, 2008.
Spracklen, D. V., Pringle, K. J., Carslaw, K. S., Chipperfield, M.P., and Mann, G. W.: A global off-line model of size-resolvedaerosol microphysics: I. Model development and prediction ofaerosol properties, Atmos. Chem. Phys., 5, 2227–2252, 2005a,http://www.atmos-chem-phys.net/5/2227/2005/.
Spracklen, D. V., Pringle, K. J., Carslaw, K. S., Chipperfield, M.P., and Mann, G. W.: A global off-line model of size-resolvedaerosol microphysics: Ii. Identification of key uncertainties, At-mos. Chem. Phys., 5, 3233–3250, 2005b,http://www.atmos-chem-phys.net/5/3233/2005/.
Spracklen, D. V., Carslaw, K. S., Kulmala, M., Kerminen, V.-M.,Mann, G. W., and Sihto, S.-L.: The contribution of boundarylayer nucleation events to total particle concentrations on re-gional and global scales, Atmos. Chem. Phys., 6, 5631–5648,2006,http://www.atmos-chem-phys.net/6/5631/2006/.
Streets, D. G., Bond, T. C., Carmichael, G. R., et al.: An inventoryof gaseous and primary aerosol emissions in Asia in the year2000, J. Geophys. Res., 108, 8809, doi:10.1029/2002JD003093,2003.
Suni, T., Kulmala, M., Hirsikko, A., et al.: Formation and character-istics of ions and charged aerosol particles in a native AustralianEucalypt forest, Atmos. Chem. Phys., 8, 129–139, 2008,http://www.atmos-chem-phys.net/8/129/2008/.
Toon, O. B., Turco, R. P., Westphal, D., Malone, R., and Liu, M. S.:A multidimensional model for aerosols: Description of compu-tational analogs, J. Atmos. Sci., 45, 2123–2143, 1988.
Trivitayanurak, W., Adams, P. J., Spracklen, D. V., and Carslaw, K.S.: Tropospheric aerosol microphysics simulation with assimi-lated meteorology: model description and intermodel compari-son, Atmos. Chem. Phys., 8, 3149–3168, 2008,http://www.atmos-chem-phys.net/8/3149/2008/.
Turco, R. P., Hamill, P., Toon, O. B., Whitten, R. C., and Kiang,C. S.: A one-dimensional model describing aerosol formationand evolution in the stratosphere, Part I, Physical processes andmathematical analogs, J. Atmos. Sci., 36, 699–717, 1979.
Twomey, S.: The influence of pollution on the shortwave albedo ofclouds, J. Atmos. Sci., 34, 1149–1152, 1977.
www.atmos-chem-phys.net/9/7691/2009/ Atmos. Chem. Phys., 9, 7691–7710, 2009

7710 F. Yu and G. Luo: Simulation of particle size distribution with a global aerosol model
Varutbangkul, V., Brechtel, F. J., Bahreini, R., et al.: Hygro-scopicity of secondary organic aerosols formed by oxidation ofcycloalkenes, monoterpenes, sesquiterpenes, and related com-pounds, Atmos. Chem. Phys., 6, 2367–2388, 2006,http://www.atmos-chem-phys.net/6/2367/2006/.
Venzac, H., Sellegri, K., Laj, P., et al.: High frequency new par-ticle formation in the Himalayas, P. Natl. Acad. Sci. USA, 105,15 666–15 671, 2008.
Vestreng, V., Myhre, G., Fagerli, H., Reis, S., and Tarrason, L.:Twenty-five years of continuous sulphur dioxide emission reduc-tion in Europe, Atmos. Chem. Phys., 7, 3663–3681, 2007,http://www.atmos-chem-phys.net/7/3663/2007/.
Wang, M. and Penner, J. E.: Aerosol indirect forcing in a globalmodel with particle nucleation, Atmos. Chem. Phys., 9, 239–260,2009,http://www.atmos-chem-phys.net/9/239/2009/.
Weimer, S., Mohr, C., Richter, R., et al.: Mobile measurements ofaerosol number and volume size distributions in an Alpine valley:Influence of traffic versus wood burning, Atmos. Environ., 43,624–630, 2009.
Wesely, M. L.: Parameterization of Surface Resistances to GaseousDry Deposition in Regional-Scale Numerical-Models, Atmos.Environ., 23, 1293–1304, 1989.
Whitby, K. T., Cantrell, B. K., and Kittelson, D. B.: Nuclei forma-tion rates in a coal-fired power plant plume, Atmos. Environ., 12,313–321, 1978.
Whitby, K.: The physical characteristics of sulfur aerosols, Atmos.Environ., 12, 135–159, 1978.
Yevich, R. and Logan, J. A.: An assessment of biofuel use and burn-ing of agricultural waste in the developing world, Global Bio-geochem. Cy., 17(4), 1095, doi:10.1029/2002GB001952, 2003.
Yu, F. and Turco, R. P.: Case studies of particle formation eventsobserved in boreal forests: Implications for nucleation mecha-nisms, Atmos. Chem. Phys., 8, 6085–6102, 2008,http://www.atmos-chem-phys.net/8/6085/2008/.
Yu, F. and Turco, R. P.: The role of ions in the formation and evo-lution of particles in aircraft plumes, Geophys. Res. Lett., 24,1927–1930, 1997.
Yu, F., Wang, Z., Luo, G., and Turco, R. P.: Ion-mediated nucleationas an important source of tropospheric aerosols, Atmos. Chem.Phys., 8, 2537–2554, 2008,http://www.atmos-chem-phys.net/8/2537/2008/.
Yu, F.: A Study of the Formation and Evolution of Aerosols andContrails in Aircraft Wakes: Development, Validation and Ap-plication of an Advanced Particle Microphysics (APM) Model,Doctoral Dissertation, UCLA, 1998.
Yu, F.: From molecular clusters to nanoparticles: Second-generation ion-mediated nucleation model, Atmos. Chem. Phys.,6, 5193–5211, 2006,http://www.atmos-chem-phys.net/6/5193/2006/.
Yu, F.: Ion-mediated nucleation in the atmosphere: Key control-ling parameters, implications, and look-up table, J. Geophy. Res.,114, doi:10.1029/2009JD012630, in press, 2009.
Zhang, L. M., Gong, S. L., Padro, J., and Barrie, L.: A size segre-gated particle dry deposition scheme for an atmospheric aerosolmodule, Atmos. Environ., 35, 549–560, 2001.
Ziemba, L. D., Griffin, R. J., and Talbot, R. W.: Observa-tions of elevated particle number concentration events at a ru-ral site in New England, J. Geophys. Res., 111, D23S34,doi:10.1029/2006JD007607, 2006.
Atmos. Chem. Phys., 9, 7691–7710, 2009 www.atmos-chem-phys.net/9/7691/2009/