Simulation of nitrate, sulfate, and ammonium aerosols
29
ACPD 12, 19499–19527, 2012 Simulation of nitrate, sulfate, and ammonium aerosols J. M. Walker et al. Title Page Abstract Introduction Conclusions References Tables Figures Back Close Full Screen / Esc Printer-friendly Version Interactive Discussion Discussion Paper | Discussion Paper | Discussion Paper | Discussion Paper | Atmos. Chem. Phys. Discuss., 12, 19499–19527, 2012 www.atmos-chem-phys-discuss.net/12/19499/2012/ doi:10.5194/acpd-12-19499-2012 © Author(s) 2012. CC Attribution 3.0 License. Atmospheric Chemistry and Physics Discussions This discussion paper is/has been under review for the journal Atmospheric Chemistry and Physics (ACP). Please refer to the corresponding final paper in ACP if available. Simulation of nitrate, sulfate, and ammonium aerosols over the United States J. M. Walker 1 , J. H. Seinfeld 1,2 , L. Clarisse 3 , P.-F. Coheur 3 , C. Clerbaux 3,4 , and M. Van Damme 3 1 Department of Environmental Science and Engineering, California Institute of Technology, Pasadena, California, USA 2 Department of Chemical Engineering, California Institute of Technology, Pasadena, California, USA 3 Spectroscopie de l’Atmosph ` ere, Service de Chimie Quantique et Photophysique, Universit´ e Libre de Bruxelles, Brussels, Belgium 4 Universit ´ e Paris 06, Universit´ e Versailles St.-Quentin, CNRS, INSU, LATMOS-IPSL, Paris, France Received: 19 July 2012 – Accepted: 24 July 2012 – Published: 6 August 2012 Correspondence to: J. H. Seinfeld ([email protected]) Published by Copernicus Publications on behalf of the European Geosciences Union. 19499
Transcript of Simulation of nitrate, sulfate, and ammonium aerosols
ACPD12, 19499–19527, 2012
Simulation of nitrate,sulfate, and
ammonium aerosols
J. M. Walker et al.
Title Page
Abstract Introduction
Conclusions References
Tables Figures
J I
J I
Back Close
Full Screen / Esc
Printer-friendly Version
Interactive Discussion
Discussion
Paper
|D
iscussionP
aper|
Discussion
Paper
|D
iscussionP
aper|
Atmos. Chem. Phys. Discuss., 12, 19499–19527, 2012www.atmos-chem-phys-discuss.net/12/19499/2012/doi:10.5194/acpd-12-19499-2012© Author(s) 2012. CC Attribution 3.0 License.
AtmosphericChemistry
and PhysicsDiscussions
This discussion paper is/has been under review for the journal Atmospheric Chemistryand Physics (ACP). Please refer to the corresponding final paper in ACP if available.
Simulation of nitrate, sulfate, andammonium aerosols over the UnitedStatesJ. M. Walker1, J. H. Seinfeld1,2, L. Clarisse3, P.-F. Coheur3, C. Clerbaux3,4, andM. Van Damme3
1Department of Environmental Science and Engineering, California Institute of Technology,Pasadena, California, USA2Department of Chemical Engineering, California Institute of Technology, Pasadena,California, USA3Spectroscopie de l’Atmosphere, Service de Chimie Quantique et Photophysique, UniversiteLibre de Bruxelles, Brussels, Belgium4Universite Paris 06, Universite Versailles St.-Quentin, CNRS, INSU, LATMOS-IPSL, Paris,France
Received: 19 July 2012 – Accepted: 24 July 2012 – Published: 6 August 2012
Correspondence to: J. H. Seinfeld ([email protected])
Published by Copernicus Publications on behalf of the European Geosciences Union.
19499
ACPD12, 19499–19527, 2012
Simulation of nitrate,sulfate, and
ammonium aerosols
J. M. Walker et al.
Title Page
Abstract Introduction
Conclusions References
Tables Figures
J I
J I
Back Close
Full Screen / Esc
Printer-friendly Version
Interactive Discussion
Discussion
Paper
|D
iscussionP
aper|
Discussion
Paper
|D
iscussionP
aper|
Abstract
Atmospheric concentrations of inorganic gases and aerosols (nitrate, sulfate, and am-monium) are simulated for 2009 over the United States using the chemical transportmodel GEOS-Chem. This work is motivated, in part, by the inability of previous mod-eling studies to reproduce observed high nitrate aerosol concentrations in California.5
Nitrate aerosol concentrations over most of the US are over-predicted relative to Inter-agency Monitoring of Protected Visual Environments (IMPROVE) and Clean Air Statusand Trends Network (CASTNET) data. In California, on the other hand, nitrate and am-monium are under-predicted as compared to California Air Resources Board (CARB)measurements. Over-prediction of nitrate in the East and Midwest is consistent with10
results of recent studies, which have suggested that nighttime nitric acid formation byheterogeneous hydrolysis of N2O5 is over-predicted with current values of the N2O5uptake coefficient, γ, onto aerosols. Accordingly, the value of γ is reduced here bya factor of 10. Despite this, predicted nitrate levels in the US Midwest remain higherthan those measured and over-prediction of nitrate in this region remains to be ex-15
plained. Data from the Infrared Atmospheric Sounding Interferometer (IASI) onboardthe MetOp-A satellite indicate the presence of a strong ammonia maximum in centraland southern California that is not present in the simulations, which are based on theEPA National Emissions Inventory (NEI) NH3 emission inventory. In order to predictammonia columns similar to the satellite measurements in the San Joaquin Valley, CA20
and Riverside, CA, the current ammonia emission inventory in California would needto be increased substantially. Based on the sensitivity of ammonium nitrate formationto the availability of ammonia, the present results suggest that under-prediction of am-monia emissions is likely the main cause for the under-prediction of nitrate aerosol inCalifornia.25
19500
ACPD12, 19499–19527, 2012
Simulation of nitrate,sulfate, and
ammonium aerosols
J. M. Walker et al.
Title Page
Abstract Introduction
Conclusions References
Tables Figures
J I
J I
Back Close
Full Screen / Esc
Printer-friendly Version
Interactive Discussion
Discussion
Paper
|D
iscussionP
aper|
Discussion
Paper
|D
iscussionP
aper|
1 Introduction
Nitrate (NO−3 ), sulfate (SO2−
4 ) and ammonium (NH+4 ) are major constituents of atmo-
spheric aerosols. These species are formed primarily from chemical reactions in theatmosphere involving the gas-phase precursors, nitrogen oxides (NOx), sulfur dioxide(SO2) and ammonia (NH3). In this work, we use the global chemical transport model5
GEOS-Chem to simulate nitrate, sulfate and ammonium aerosols over the UnitedStates and we compare model predictions with measurement data to assess modelperformance. This work is motivated, in part, by previous studies (Pye et al., 2009;Bauer et al., 2007; Myhre et al., 2006) that indicated that observed high nitrate levels inCalifornia have not been simulated adequately by global chemical transport models. In10
a recent GEOS-Chem simulation over the US, Zhang et al. (2012) found that althoughpredictions of the gas-phase precursor NOx agreed well with satellite measurements,predicted HNO3 and nitrate aerosol had strong positive biases throughout most of thecountry.
We note the study of Heald et al. (2012), completed at the same time as this work,15
which addresses some of the same issues and reports similar results as those pre-sented here. That two independent pieces of work arrive at essentially the same con-clusions gives added weight to the results of both studies.
2 GEOS-Chem model
Atmospheric concentrations of aerosols and gas-phase species are simulated us-20
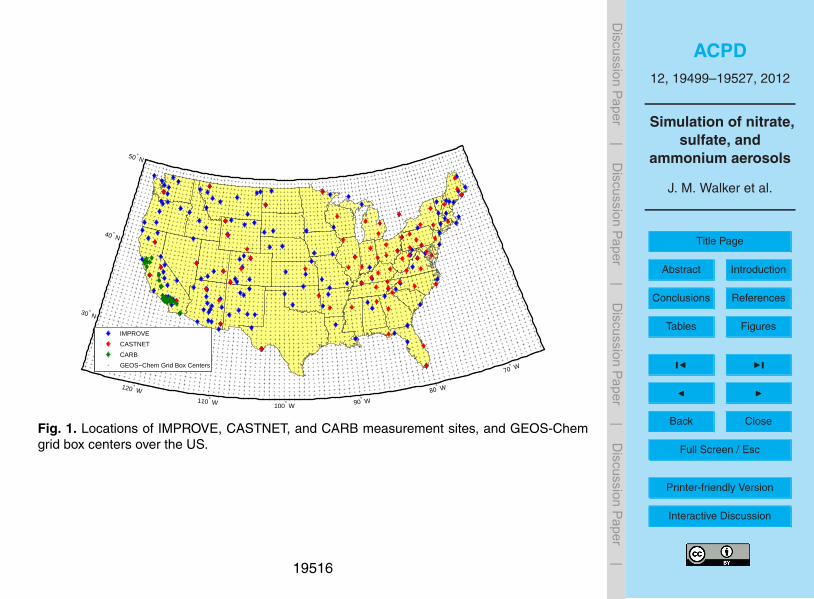
ing the chemical transport model GEOS-Chem, version 9-01-02 (http://acmg.seas.harvard.edu/geos/). A nested version of the model (Chen et al., 2009) is used, ona 1/2◦ (longitude) by 2/3◦ (latitude) horizontal grid over North America (Fig. 1), with 47vertical levels, nested within a global parent grid at 2◦ ×2.5◦ horizontal resolution. Thecalendar year 2009 is simulated, with a spin-up period of one year. The model is driven25
by Goddard Earth Observing System (GEOS-5) assimilated meteorological fields from
19501
ACPD12, 19499–19527, 2012
Simulation of nitrate,sulfate, and
ammonium aerosols
J. M. Walker et al.
Title Page
Abstract Introduction
Conclusions References
Tables Figures
J I
J I
Back Close
Full Screen / Esc
Printer-friendly Version
Interactive Discussion
Discussion
Paper
|D
iscussionP
aper|
Discussion
Paper
|D
iscussionP
aper|
NASA’s Global Modeling and Assimilation Office (GMAO). Meteorological data includewinds, temperature, humidity, cloud fraction, precipitation and other fields at a 6-h tem-poral resolution, as well as mixed layer depth and surface properties at a 3-h temporalresolution.
Data from the EPA National Emissions Inventory (NEI) 2005 on emissions of NOx,5
SO2, NH3, CO and volatile organic compounds (VOCs) were scaled to the simulationperiod according to trends in the EPA Acid Rain Program (http://camddataandmaps.epa.gov/gdm/) and the NEI Air Pollutant Emissions Trends Data (http://www.epa.gov/ttn/chief/trends/). Additional NOx and SO2 emission sources include aircraft, biofuel,and biomass burning, as well as emissions of NOx from lightning, soil and fertilizer,10
and sulfur emissions from ships, volcanoes and oceans (Park et al., 2004). Naturalemission sources of ammonia include soil, vegetation and oceans, as described byBouwman et al. (1997).
The model includes a detailed ozone-NOx-VOC gas-phase chemical mechanism in-volving approximately 80 species and 300 chemical reactions (Bey et al., 2001). Sulfate15
formation pathways include gas-phase oxidation of SO2 by OH and aqueous-phaseoxidation of SO2 by ozone and hydrogen peroxide. Gas-phase sulfur chemistry alsoincludes oxidation of dimethyl sulfide (DMS) by OH to form SO2 and methanesulfonicacid, and oxidation of DMS by NO3 to form SO2 (Park et al., 2004). The partitioningbetween gas-phase and aerosol-phase nitrate, sulfate and ammonium is computed20
using ISORROPIA II (Fountoukis and Nenes, 2007), a thermodynamic equilibriummodel for the K+–Ca2+–Mg2+–NH+
4 –Na+–SO2−4 –NO−
3 –Cl−–H2O aerosol system, im-plemented within GEOS-Chem.
Removal of nitrate, sulfate, ammonium and related gas-phase species through wetdeposition and dry deposition is simulated. The wet deposition scheme includes scav-25
enging of aerosols and soluble gases in wet convective updrafts, in-cloud scavengingby cloud droplets or ice crysals, and below-cloud scavenging by precipitation (Liu et al.,2001). Dry deposition is simulated with a resistance in series scheme (Weseley, 1989),
19502
ACPD12, 19499–19527, 2012
Simulation of nitrate,sulfate, and
ammonium aerosols
J. M. Walker et al.
Title Page
Abstract Introduction
Conclusions References
Tables Figures
J I
J I
Back Close
Full Screen / Esc
Printer-friendly Version
Interactive Discussion
Discussion
Paper
|D
iscussionP
aper|
Discussion
Paper
|D
iscussionP
aper|
with surface resistances for sulfate, nitrate and ammonium aerosols as described byZhang et al. (2001).
Zhang et al. (2012) suggest that nitrate concentrations may be over-predicted owingto an overestimate of nighttime nitric acid formation through heterogeneous N2O5 hy-drolysis, N2O5+H2O → 2HNO3, as N2O5 concentrations build up due to the gas phase5
reaction of NO2 with NO3. The rate of HNO3 production by this reaction is expressedas 2k[N2O5], where k = γvN2O5
AAerosol/4 and vN2O5is the mean molecular speed of
N2O5, AAerosol is the aerosol surface area per unit volume, and γ is the uptake coef-ficient, which describes the probability that an N2O5 molecule impacting an aerosolparticle will undergo the irreversible heterogeneous hydrolysis reaction (Seinfeld and10
Pandis, 2006).Macintyre and Evans (2010) list the range of published values for γ as 10−4 to >0.1.
They note that recent laboratory studies indicate lower values than previously consid-ered, and suggest that the tropospheric value is likely in the range of 0.001 to 0.02. Ina sensitivity analysis with GEOS-Chem, they find that within this range of values, the15
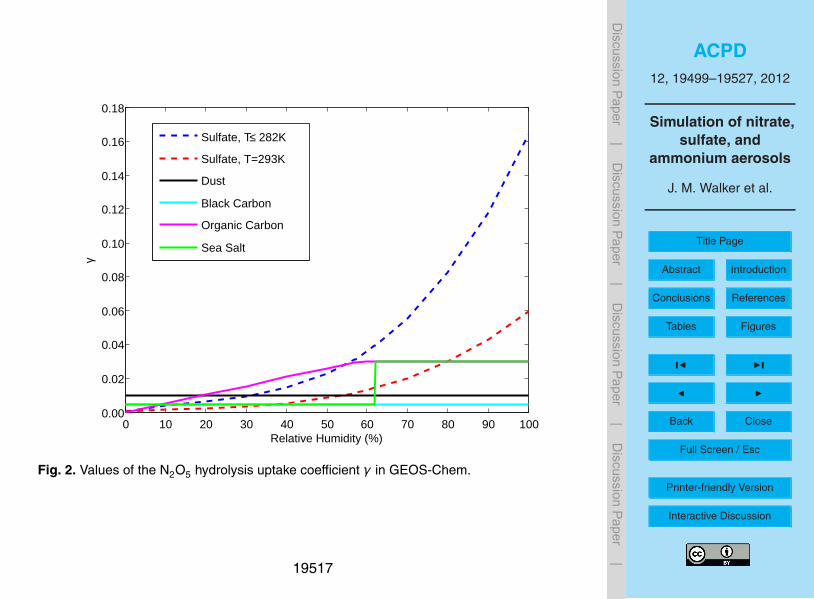
production of HNO3 in the model is highly sensitive to the selected value of γ.Figure 2 shows the values of γ used in the standard version of GEOS-Chem, for
the various types of aerosols on which heterogeneous N2O5 hydrolysis is simulated.The uptake coefficient on sulfate aerosol is determined in GEOS-Chem as a functionof temperature and relative humidity. For temperatures of 282 K and below, γ at a given20
RH is assumed to be independent of temperature; for temperatures above 282 K, γ at agiven RH decreases with increasing temperature. It is evident in Fig. 2 that the value ofγ is above 0.02 for organic carbon and sea salt aerosol, and well above 0.02 for sulfateaerosol at higher humidities, exceeding 0.1 at lower temperatures and high RH. Basedon the recommendations of Macintyre and Evans (2010), the values of γ in GEOS-25
Chem likely lead to an overestimate of nighttime HNO3 formation, with a correspond-ing overestimate of nitrate aerosol production. Following the approach of Zhang et al.(2012), we have reduced γ by a factor of 10 in the present GEOS-Chem simulations,
19503
ACPD12, 19499–19527, 2012
Simulation of nitrate,sulfate, and
ammonium aerosols
J. M. Walker et al.
Title Page
Abstract Introduction
Conclusions References
Tables Figures
J I
J I
Back Close
Full Screen / Esc
Printer-friendly Version
Interactive Discussion
Discussion
Paper
|D
iscussionP
aper|
Discussion
Paper
|D
iscussionP
aper|
in order to simulate nighttime nitric acid formation using an uptake coefficient moreconsistent with Macintyre and Evans (2010).
3 Surface-level atmospheric data
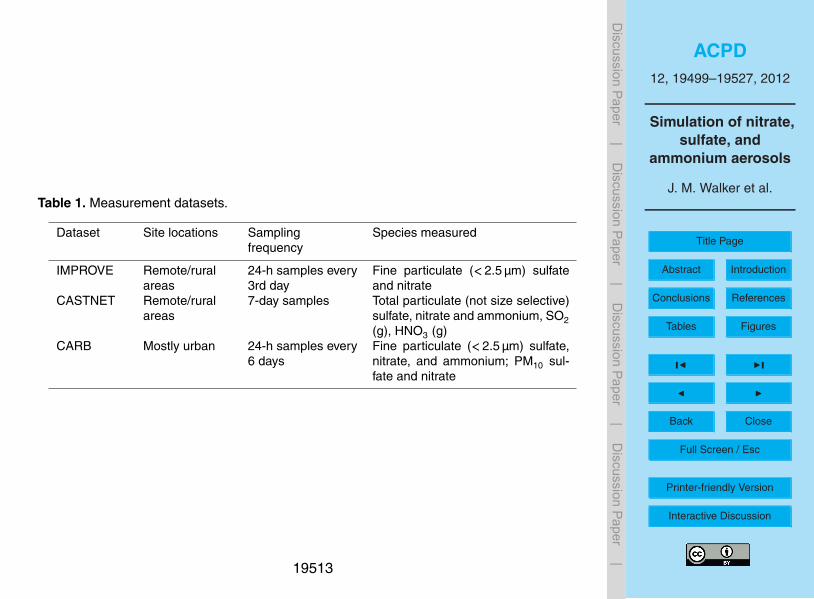
GEOS-Chem simulations are compared to measured aerosol concentrations for 2009from three data sources: the Interagency Monitoring of Protected Visual Environments5
(IMPROVE, http://views.cira.colostate.edu/web/DataWizard/), the Clean Air Status andTrends Network (CASTNET, http://views.cira.colostate.edu/web/DataWizard/) and theCalifornia Air Resources Board (CARB, http://www.arb.ca.gov/aqmis2/aqmis2.php).Table 1 summarizes the sampling frequency and measured species in each dataset.Locations of the measurement sites are shown in Fig. 1.10
The CARB dataset includes sulfate and nitrate concentrations measured by bothPM10 and PM2.5 samplers. Since the GEOS-Chem aerosol predictions are not size re-solved (total particulate matter, TPM), the larger particulate size fraction is preferredfor comparison with model predictions. However, the CARB PM10 nitrate measure-ments are affected by a negative sampling artifact due to volatilization of nitrate from15
the Teflon filters used in the PM10 samplers, whereas the CARB PM2.5 samplers areequipped with reactive substrates to collect species volatilized from the inert filters,thereby minimizing volatilization losses. Since reported PM2.5 nitrate concentrationsfrequently exceed the PM10 concentrations in the CARB measurements, PM2.5 nitratewas selected as the most representative CARB dataset for comparison with model pre-20
dictions. Sulfate PM10 measurements are not affected by volatilization losses; thus, theCARB PM10 sulfate was used for comparison with predicted sulfate.
4 Results
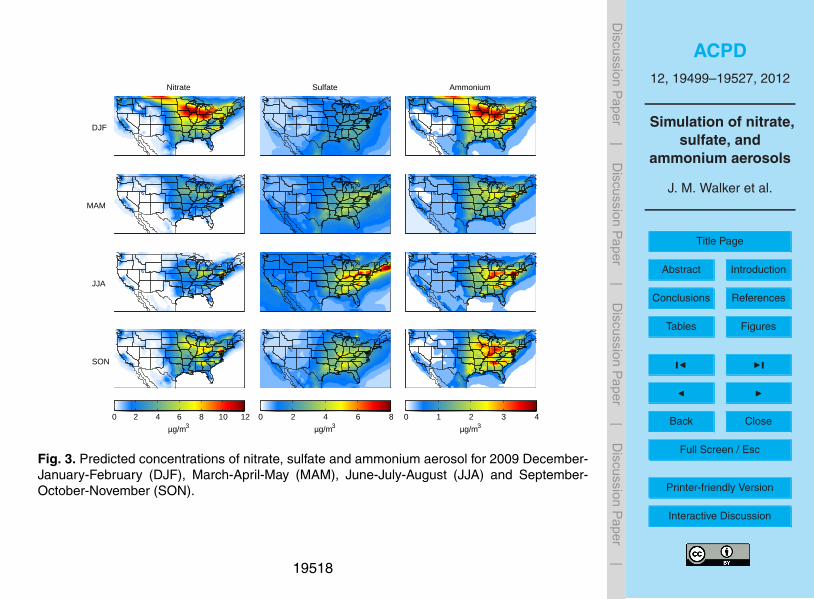
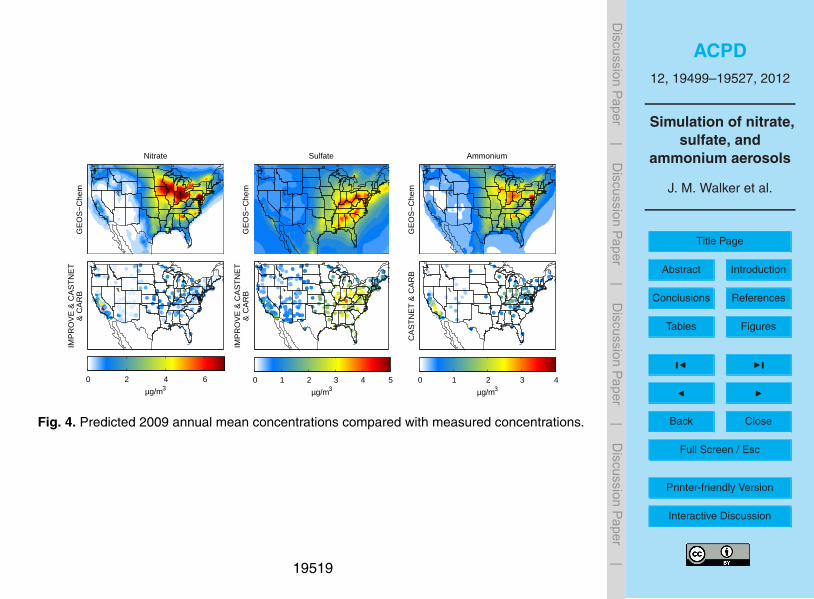
Figure 3 shows the predicted seasonal average concentrations of nitrate, sulfate andammonium aerosol at the surface level. Predicted annual concentrations are compared25
19504
ACPD12, 19499–19527, 2012
Simulation of nitrate,sulfate, and
ammonium aerosols
J. M. Walker et al.
Title Page
Abstract Introduction
Conclusions References
Tables Figures
J I
J I
Back Close
Full Screen / Esc
Printer-friendly Version
Interactive Discussion
Discussion
Paper
|D
iscussionP
aper|
Discussion
Paper
|D
iscussionP
aper|
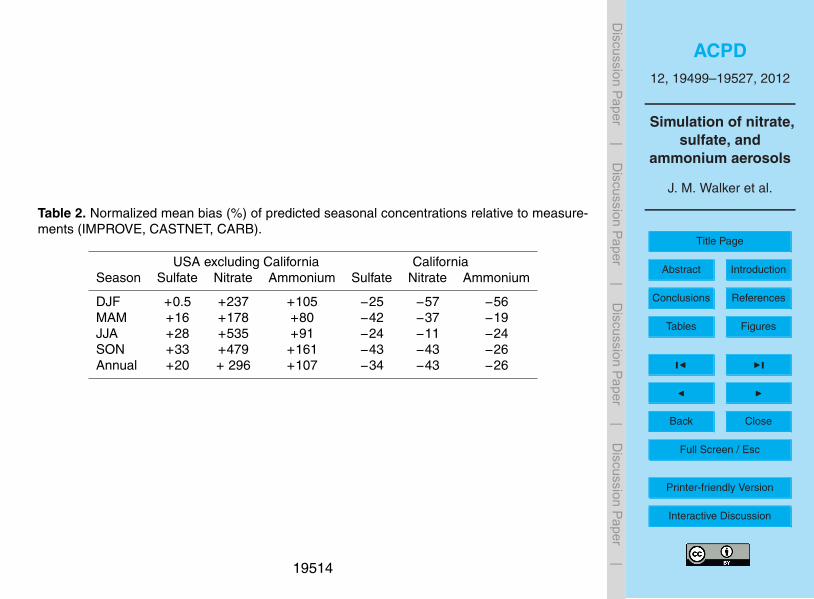
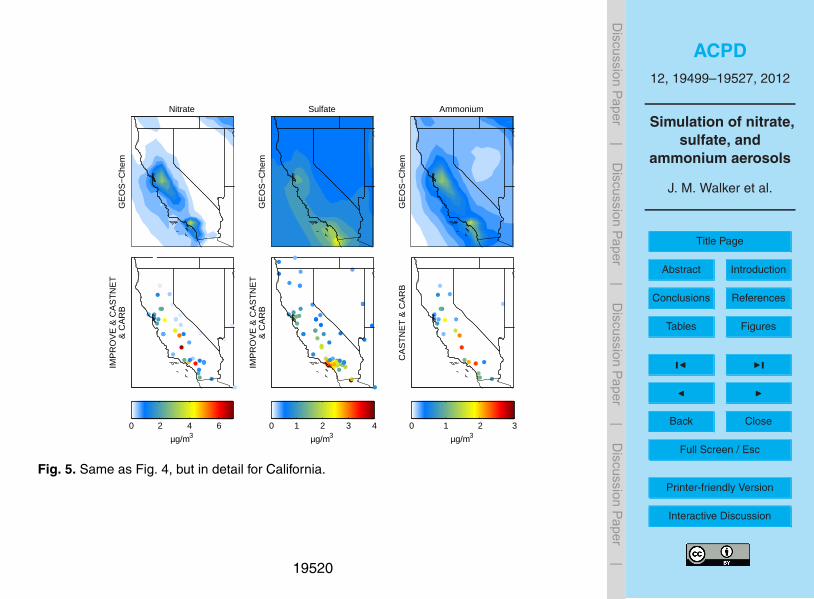
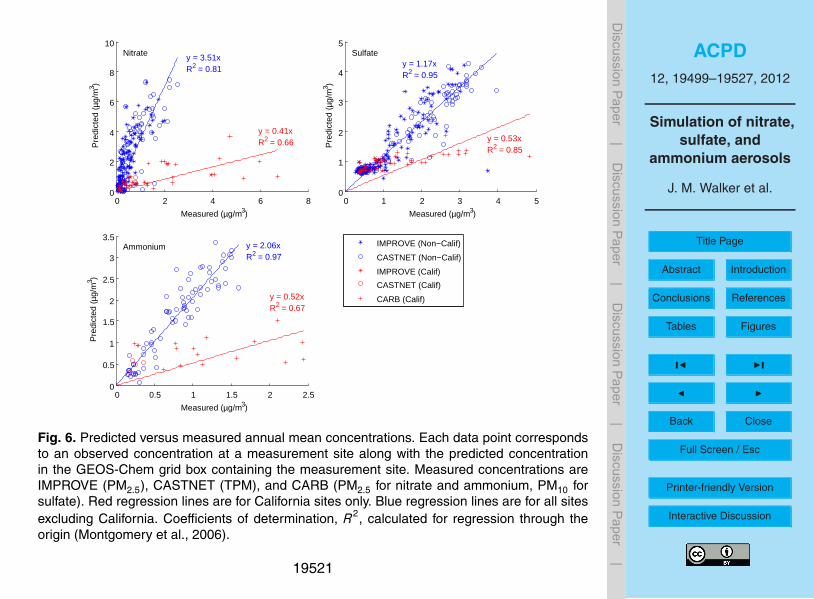
with measurements over the entire US in Fig. 4 and over California in Fig. 5. Scatterplots of predicted versus measured annual concentrations are shown in Fig. 6. Thenormalized mean biases (NMB) of predicted seasonal and annual concentrations aresummarized in Table 2, where NMB = (Σ(Pi−Oi )/ΣOi )×100 %, where Pi is the predictedand Oi the observed seasonal average concentration, and the summation is over all5
measurement sites.Predicted sulfate concentrations are in reasonable agreement with IMPROVE and
CASTNET measurements (Fig. 6). Compared with the California CARB measure-ments, sulfate concentrations are under-predicted; however this is over a rather narrowrange of measured concentrations. There is substantial over-prediction, by factors of10
approximately 3.5 and 2, respectively, in the predicted nitrate and ammonium aerosolconcentrations relative to the IMPROVE and CASTNET measured values (Fig. 6). Thebias in nitrate predictions in the eastern and midwestern states has a significant sea-sonal variation, with the highest overprediction in the summer (Table 2). On the otherhand, in California, there is a substantial under-prediction of nitrate and ammonium15
concentrations.Over-prediction of nitrate in the eastern and midwestern states in this study is con-
sistent with results found by Zhang et al. (2012), who suggest that GEOS-Chem mayover-predict nitrate concentrations owing to an overestimate of nighttime nitric acid for-mation through heterogeneous N2O5 hydrolysis. However, the reduction of the N2O520
uptake coefficient, γ, by a factor of 10 in the current simulation did not reduce substan-tially the nitrate bias compared with another identical simulation (results not shown)using the standard GEOS-Chem values for γ: the NMB in predicted annual nitrate is+296 % (Table 2) when γ is reduced by a factor of 10, compared with an NMB of+321 % when the standard γ values are used. These results suggest that an overesti-25
mate of heterogeneous N2O5 hydrolysis does not fully account for the nitrate bias andover-prediction of nitrate in the US Midwest remains to be explained.
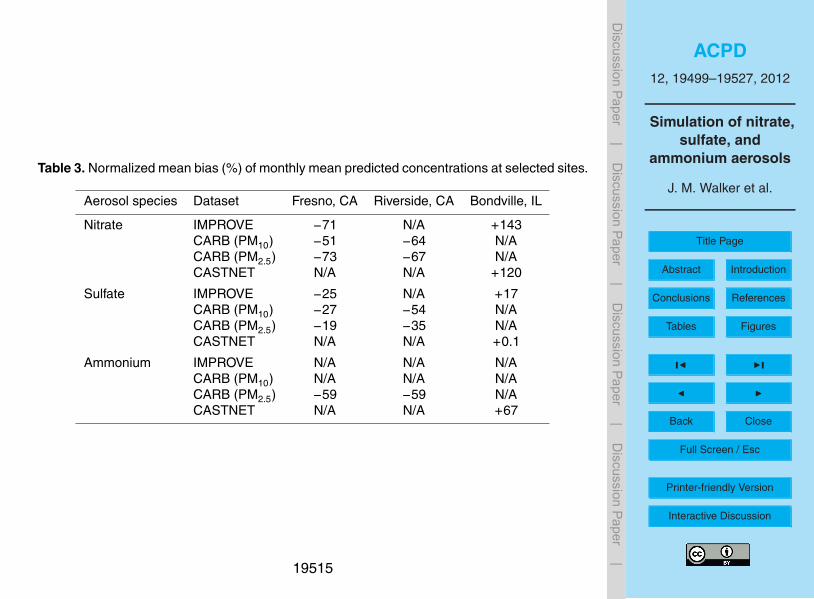
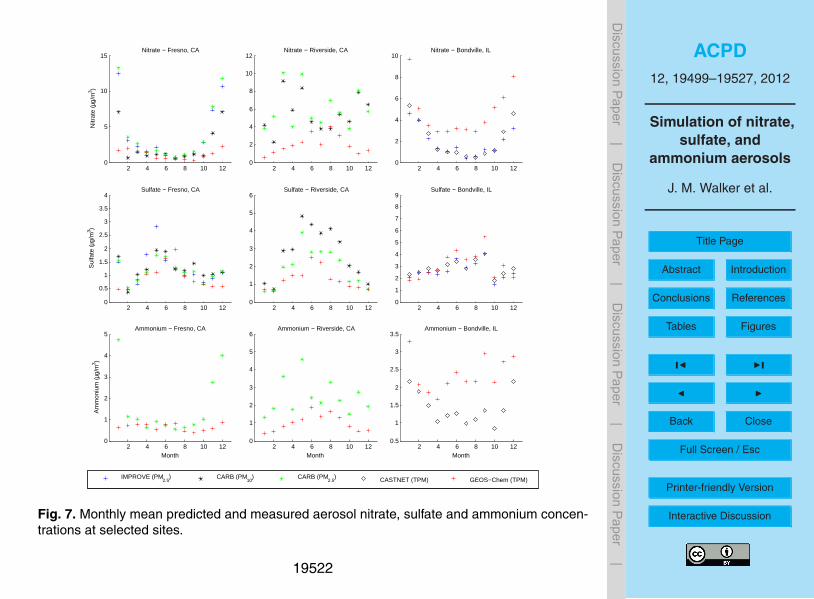
Figure 7 shows predicted and measured inorganic aerosol concentrations atBondville, IL, in the region of highest predicted nitrate concentrations in the Midwest,
19505
ACPD12, 19499–19527, 2012
Simulation of nitrate,sulfate, and
ammonium aerosols
J. M. Walker et al.
Title Page
Abstract Introduction
Conclusions References
Tables Figures
J I
J I
Back Close
Full Screen / Esc
Printer-friendly Version
Interactive Discussion
Discussion
Paper
|D
iscussionP
aper|
Discussion
Paper
|D
iscussionP
aper|
and at Fresno, CA and Riverside, CA. Table 3 summarizes the normalized mean biasesof the predicted monthly concentrations at these three sites, relative to each avail-able measurement dataset. At the California sites, predicted nitrate concentrations arebelow measured concentrations throughout most of the year, with substantial under-prediction particularly in the winter, whereas the predicted nitrate concentrations at5
Bondville exceed the measured concentrations throughout the year. At all three sites,predicted sulfate concentrations agree reasonably well with measured concentrationsin magnitude and in the pattern of seasonal variation over the course of the year. AtFresno, predicted ammonium concentrations agree well with measurements except inthe winter when predictions are very low compared to measured concentrations. Pre-10
dicted ammonium concentrations are well below measured concentrations at Riversidethroughout the year, and are above measured concentrations at Bondville throughoutthe year.
4.1 Nitrate under-prediction in California
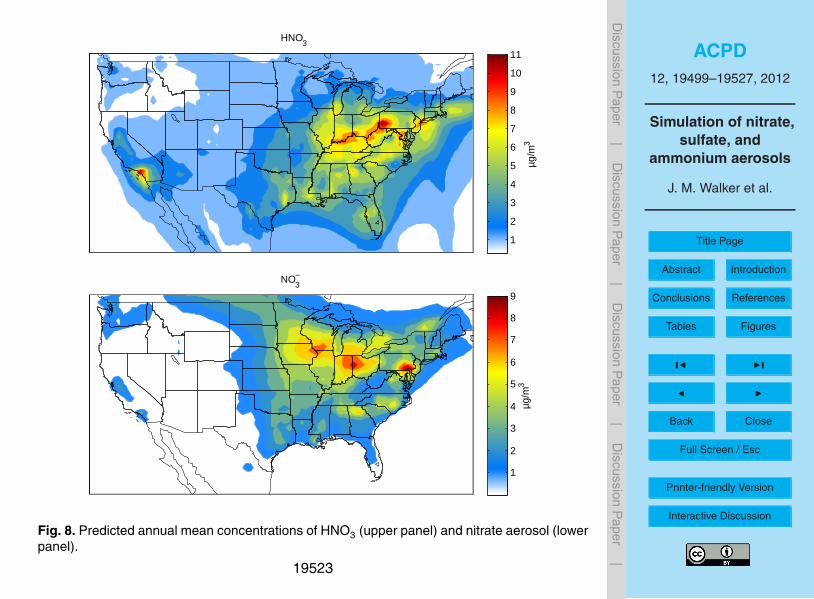
Given the findings discussed in the previous section, it is unlikely that the under-15
prediction of nitrate in California is the result of an underestimate of HNO3 produc-tion. Indeed, predicted HNO3 concentrations in California are among the highest in thecountry (Fig. 8).
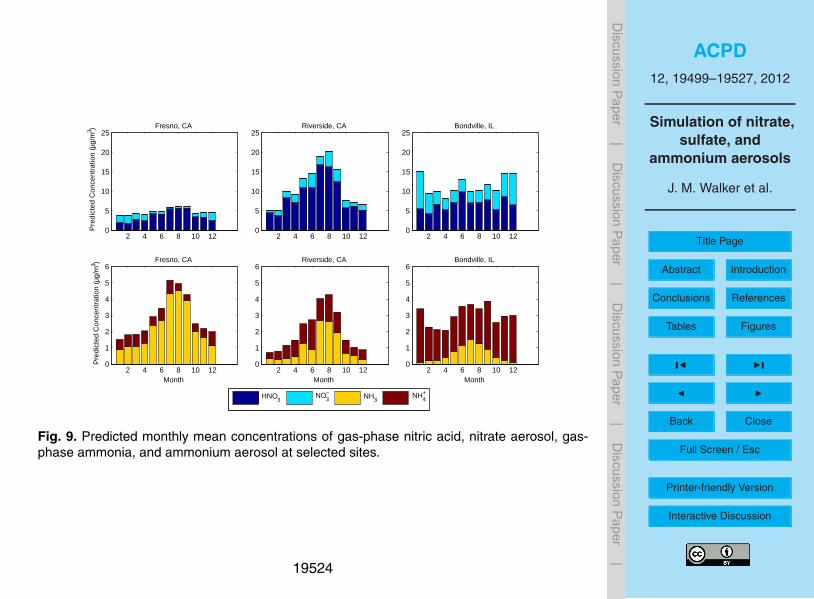
Figure 9 shows the partitioning between aerosol and gas-phase nitrate and ammo-nium predicted concentrations at the Bondville, Fresno, and Riverside sites. At both20
California sites, a large fraction of the predicted total inorganic nitrate is in the form ofgas-phase nitric acid. Thus, availability of total inorganic nitrate does not appear to bethe limiting factor in the production of nitrate aerosol in California; either the thermody-namic partitioning between the gas and aerosol phases or the removal of atmosphericHNO3 is the limiting factor.25
The formation of nitrate aerosol is dependent on the thermodynamic equilibrium be-tween gas-phase ammonia and nitric acid with solid or aqueous ammonium nitrate.As noted previously, there is a substantial under-prediction of ammonium aerosol in
19506
ACPD12, 19499–19527, 2012
Simulation of nitrate,sulfate, and
ammonium aerosols
J. M. Walker et al.
Title Page
Abstract Introduction
Conclusions References
Tables Figures
J I
J I
Back Close
Full Screen / Esc
Printer-friendly Version
Interactive Discussion
Discussion
Paper
|D
iscussionP
aper|
Discussion
Paper
|D
iscussionP
aper|
California, indicating that availability of ammonia may be a factor in the low nitrate pre-dictions.
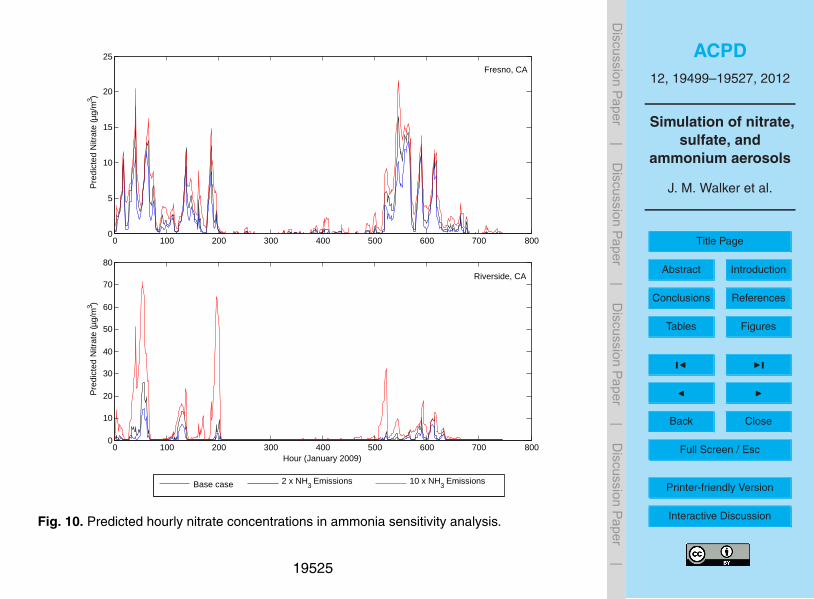
We conducted a sensitivity analysis with GEOS-Chem, simulating the month of Jan-uary 2009 with anthropogenic emissions of ammonia increased by a factor of two andby a factor of ten. Analysis of predicted hourly nitrate concentrations at Fresno and5
Riverside indicates significant sensitivity to ammonia availability, particularly at River-side (Fig. 10). In the simulation with ammonia emissions doubled, the January 2009monthly mean predicted nitrate concentrations are 1.33 and 2.04 times the standardmodel predictions at Fresno and Riverside, respectively. In the simulation with am-monia emissions increased tenfold, the January 2009 monthly mean predicted nitrate10
concentrations are 1.88 and 7.61 times the standard model predictions at Fresno andRiverside, respectively.
The large uncertainties in the ammonia emissions inventory and seasonal scalingfactors used in GEOS-Chem could potentially result in a substantial underestimate ofammonia emissions and concentrations, along with a corresponding underestimate of15
nitrate aerosol if the conditions are ammonia-limited. In their study of aircraft data fromthe CalNex 2010 experiment, Nowak et al. (2012) found that ammonia emissions fromdairy facilities in Southern California have a significant effect on nitrate aerosol forma-tion, shifting the NH4NO3 equilibrium towards the particle phase and resulting in highernitrate aerosol concentrations downwind of the dairy facilities. They also compared the20
CalNex aircraft data to NEI 2005 and CARB-ARCTAS 08 (Huang et al., 2010) emis-sions inventories of ammonia in the South Coast Air Basin and found that both emis-sions inventories underestimate ammonia emissions relative to emissions estimatesderived from the aircraft data. In the NEI 2005 inventory, ammonia emissions fromautomobiles and dairy facilities in this region are 38 and 1 metric tonnes per day, re-25
spectively, compared to 56 and 11 tonnes per day, respectively, in the CARB-ARCTAS08 inventory. Both these estimates are much lower than the emissions estimates de-rived by Nowak et al. (2012) from CalNex, of 38 to 86 tonnes per day from automobilesand 33 to 176 tonnes per day from dairy facilities.
19507
ACPD12, 19499–19527, 2012
Simulation of nitrate,sulfate, and
ammonium aerosols
J. M. Walker et al.
Title Page
Abstract Introduction
Conclusions References
Tables Figures
J I
J I
Back Close
Full Screen / Esc
Printer-friendly Version
Interactive Discussion
Discussion
Paper
|D
iscussionP
aper|
Discussion
Paper
|D
iscussionP
aper|
4.2 Satellite measurements of ammonia
To investigate the extent to which ammonia emissions in GEOS-Chem might be under-estimated, predictions are compared to satellite measurements of ammonia from theInfrared Atmospheric Sounding Interferometer (IASI) (Clerbaux et al., 2009). IASI isa Fourier transform spectrometer onboard the MetOp-A satellite, which provides global5
coverage twice a day, with overpass times of 9:30 and 21:30 mean local solar time.The spectrometer measures infrared radiation, and NH3 concentrations are retrievedusing inverse methods (Clarisse et al., 2009, 2010). Vertical columns of ammonia overthe US are available for the morning overpasses for the period 1 April to 30 November2009, which overlaps with the GEOS-Chem simulation period. Ammonia columns are10
not available in the winter months due to insufficient ammonia sensitivity in the satellitemeasurements during these months.
To compare GEOS-Chem predictions with IASI satellite measurements, the GEOS-Chem predicted ammonia concentrations are integrated vertically over the model pres-sure levels to obtain vertical column concentrations. In this integration, all vertical levels15
in the model are weighted equally, because reliable satellite averaging kernels were notavailable, so the comparison with the satellite columns is approximate. However, a qual-itative comparison of the columns is useful to investigate the predictions in Californiacompared to the rest of the US. And in California in particular, where we perform amore detailed comparison, the satellite averaging kernels do not vary greatly and have20
fairly uniform sensitivity between 0 and 2 km (Clarisse et al., 2010), where the majorityof the atmospheric ammonia is located; thus the error associated with an equal verticalweighting is not expected to be important.
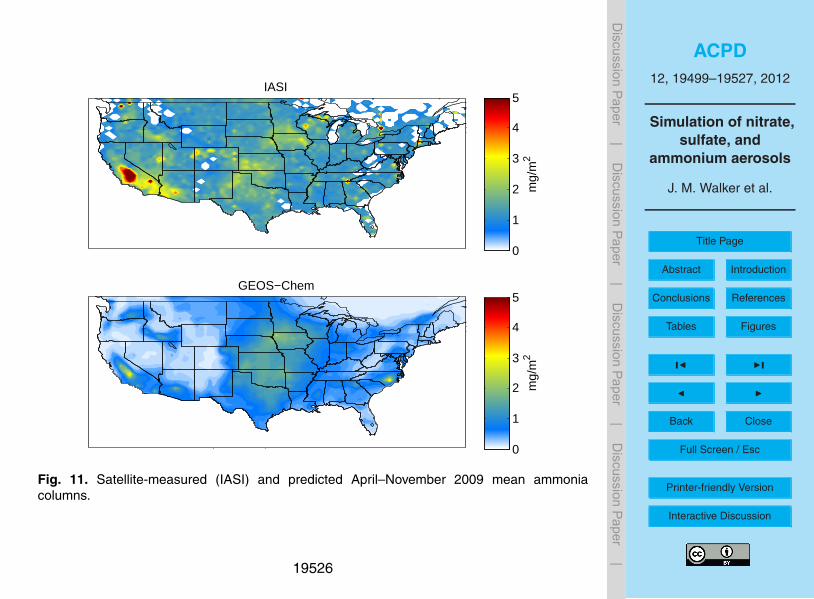
Figure 11 shows predicted April–November average ammonia columns from GEOS-Chem and the April–November averages of the 9:30 a.m. measured concentrations25
from IASI. For this comparison, the satellite data were gridded onto the GEOS-Chemgrid by averaging all the satellite measurements within a grid box each month to obtainmonthly averages on the GEOS-Chem grid, and then averaging these monthly gridded
19508
ACPD12, 19499–19527, 2012
Simulation of nitrate,sulfate, and
ammonium aerosols
J. M. Walker et al.
Title Page
Abstract Introduction
Conclusions References
Tables Figures
J I
J I
Back Close
Full Screen / Esc
Printer-friendly Version
Interactive Discussion
Discussion
Paper
|D
iscussionP
aper|
Discussion
Paper
|D
iscussionP
aper|
measurements to obtain an April–November average. A large maximum in ammoniais evident in Central and Southern California in the satellite measurements, with con-centrations exceeding those for the rest of the US. This strong NH3 maximum is notpresent in the GEOS-Chem predictions: the predicted maximum in Central Califor-nia is not significantly higher in magnitude, for example, than that in the Midwest. The5
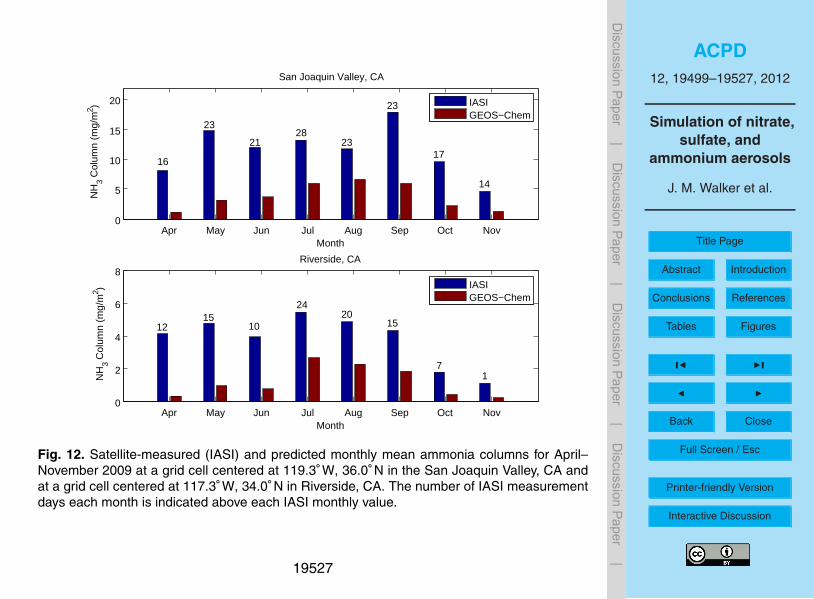
satellite-model comparison indicates a large underestimate of ammonia concentrationsin California. Figure 12 compares the monthly averages of the predicted 9:00–10:00a.m. ammonia columns from GEOS-Chem with the monthly averages of the 9:30 a.m.ammonia columns measured by IASI in the San Joaquin Valley (SJV), between Fresnoand Bakersfield, and at Riverside. Both sites show a large underprediction of ammonia10
columns throughout the year, as compared to the satellite measurements. Comparisonof monthly columns at other sites in the SJV, such as Fresno and Sacramento, yieldssimilar results. In order to obtain ammonia columns similar to the satellite measure-ments at SJV and Riverside, the ammonia emissions in GEOS-Chem would need tobe increased by approximately 300 % and 320 %, respectively.15
Based on the sensitivity of ammonium nitrate formation to the availability of ammonia,the present results, which are consistent with those of Nowak et al. (2012) and Healdet al. (2012), suggest that under-prediction of ammonia emissions is likely the maincause for the under-prediction of nitrate aerosol in California.
5 Conclusions20
Atmospheric chemical transport models (ACTMs) provide a powerful means to evalu-ate the extent to which predicted atmospheric gas and particle concentrations basedon an assumed emission inventory agree with those actually observed. Prediction ofaerosol levels over the US is a subject of intense interest, owing to efforts to achievecompliance with air quality standards and to assess the extent to which air quality is25
affected by long-range transport beyond the US border. Previous ACTM simulations ofaerosol levels have exhibited mixed success in terms of agreement between predicted
19509
ACPD12, 19499–19527, 2012
Simulation of nitrate,sulfate, and
ammonium aerosols
J. M. Walker et al.
Title Page
Abstract Introduction
Conclusions References
Tables Figures
J I
J I
Back Close
Full Screen / Esc
Printer-friendly Version
Interactive Discussion
Discussion
Paper
|D
iscussionP
aper|
Discussion
Paper
|D
iscussionP
aper|
and observed concentrations. When predictions and observations do not agree, as-sessing the cause of the discrepancy may not be entirely straightforward, as both theemission inventory and representation of atmospheric processes may be implicated.The present study addresses the prediction of aerosol nitrate, sulfate, and ammoniumlevels over the US for 2009. Lack of agreement between observed and predicted levels5
can be traced to both emission inventory inaccuracies as well as model representa-tion of nighttime nitric acid formation. The GEOS-Chem model employed here is themost widely used ACTM worldwide. The present study, and others like it, is valuable inpinpointing sources of model-measurement discrepancy and thereby lead to improve-ments in treatment of atmospheric processes and emission estimates.10
Acknowledgements. The authors acknowledge the Clean Air Status and Trends Network(CASTNET), the Interagency Monitoring of Protected Visual Environments (IMPROVE), andthe California Air Resources Board (CARB) for providing measurement data. Discussions withJoseph Ensberg, Paul Wennberg, Debra Wunch, and Havala Pye are greatly appreciated.
References15
Bauer, S. E., Koch, D., Unger, N., Metzger, S. M., Shindell, D. T., and Streets, D. G.: Nitrateaerosols today and in 2030: a global simulation including aerosols and tropospheric ozone,Atmos. Chem. Phys., 7, 5043–5059, doi:10.5194/acp-7-5043-2007, 2007. 19501
Bey, I., Jacob, D. J., Yantosca, R. M., Logan, J. A., Field, B. D., Fiore, A. M., Li, Q. B., Liu,H. G. Y., Mickley, L. J., and Schultz, M. G.: Global modeling of tropospheric chemistry with20
assimilated meteorology: model description and evaluation, J. Geophys. Res.-Atmos., 106,23073–23095, doi:10.1029/2001JD000807, 2001. 19502
Bouwman, A. F., Lee, D. S., Asman, W. A. H., Dentener, F. J., VanderHoek, K. W., and Olivier,J. G. J.: A global high-resolution emission inventory for ammonia, Global Biogeochem. Cy-cles, 11, 561–587, doi:10.1029/97GB02266, 1997. 1950225
Chen, D., Wang, Y., McElroy, M. B., He, K., Yantosca, R. M., and Le Sager, P.: Regional CO pol-lution and export in China simulated by the high-resolution nested-grid GEOS-Chem model,Atmos. Chem. Phys., 9, 3825–3839, doi:10.5194/acp-9-3825-2009, 2009. 19501
19510
ACPD12, 19499–19527, 2012
Simulation of nitrate,sulfate, and
ammonium aerosols
J. M. Walker et al.
Title Page
Abstract Introduction
Conclusions References
Tables Figures
J I
J I
Back Close
Full Screen / Esc
Printer-friendly Version
Interactive Discussion
Discussion
Paper
|D
iscussionP
aper|
Discussion
Paper
|D
iscussionP
aper|
Clarisse, L., Clerbaux, C., Dentener, F., Hurtmans, D., and Coheur, P.-F.: Global ammo-nia distribution derived from infrared satellite observations, Nat. Geosci., 2, 479–483,doi:10.1038/ngeo551, 2009. 19508
Clarisse, L., Shephard, M. W., Dentener, F., Hurtmans, D., Cady-Pereira, K., Karagulian, F., VanDamme, M., Clerbaux, C., and Coheur, P.-F.: Satellite monitoring of ammonia: a case study of5
the San Joaquin Valley, J. Geophys. Res.-Atmos., 115, D13302, doi:10.1029/2009JD013291,2010. 19508
Clerbaux, C., Boynard, A., Clarisse, L., George, M., Hadji-Lazaro, J., Herbin, H., Hurtmans, D.,Pommier, M., Razavi, A., Turquety, S., Wespes, C., and Coheur, P.-F.: Monitoring of atmo-spheric composition using the thermal infrared IASI/MetOp sounder, Atmos. Chem. Phys., 9,10
6041–6054, doi:10.5194/acp-9-6041-2009, 2009. 19508Fountoukis, C. and Nenes, A.: ISORROPIA II: a computationally efficient thermodynamic equi-
librium model for K+–Ca2+–Mg2+–NH+4 –Na+–SO2−
4 –NO−3 –Cl−–H2O aerosols, Atmos. Chem.
Phys., 7, 4639–4659, doi:10.5194/acp-7-4639-2007, 2007. 19502Heald, C. L., Collett Jr., J. L., Lee, T., Benedict, K. B., Schwandner, F. M., Li, Y., Clarisse, L.,15
Hurtmans, D. R., Van Damme, M., Clerbaux, C., Coheur, P.-F., and Pye, H. O. T.: Atmosphericammonia and particulate inorganic nitrogen over the United States, Atmos. Chem. Phys.Discuss., 12, 19455–19498, doi:10.5194/acpd-12-19455-2012, 2012. 19501, 19509
Huang, M., Carmichael, G. R., Adhikary, B., Spak, S. N., Kulkarni, S., Cheng, Y. F., Wei, C.,Tang, Y., Parrish, D. D., Oltmans, S. J., D’Allura, A., Kaduwela, A., Cai, C., Weinheimer, A. J.,20
Wong, M., Pierce, R. B., Al-Saadi, J. A., Streets, D. G., and Zhang, Q.: Impacts of transportedbackground ozone on California air quality during the ARCTAS-CARB period – a multi-scalemodeling study, Atmos. Chem. Phys., 10, 6947–6968, doi:10.5194/acp-10-6947-2010, 2010.19507
Liu, H., Jacob, D. J., Bey, I., and Yantosca, R. M.: Constraints from 210Pb and 7Be25
on wet deposition and transport in a global three-dimensional chemical tracer modeldriven by assimilated meteorological fields, J. Geophys. Res.-Atmos., 106, 12109–12128,doi:10.1029/2000JD900839, 2001. 19502
Macintyre, H. L. and Evans, M. J.: Sensitivity of a global model to the uptake of N2O5 bytropospheric aerosol, Atmos. Chem. Phys., 10, 7409–7414, doi:10.5194/acp-10-7409-2010,30
2010. 19503, 19504Montgomery, D. C., Peck, E. A., and Vining, G. G.: Introduction to Linear Regression Analysis,
4th edn., John Wiley & Sons Inc., Hoboken, New Jersey, 2006. 19521
19511
ACPD12, 19499–19527, 2012
Simulation of nitrate,sulfate, and
ammonium aerosols
J. M. Walker et al.
Title Page
Abstract Introduction
Conclusions References
Tables Figures
J I
J I
Back Close
Full Screen / Esc
Printer-friendly Version
Interactive Discussion
Discussion
Paper
|D
iscussionP
aper|
Discussion
Paper
|D
iscussionP
aper|
Myhre, G., Grini, A., and Metzger, S.: Modelling of nitrate and ammonium-containing aerosolsin presence of sea salt, Atmos. Chem. Phys., 6, 4809–4821, doi:10.5194/acp-6-4809-2006,2006. 19501
Nowak, J. B., Neuman, J., Bahreini, R., Middlebrook, A. M., Holloway, J., McKeen, S., Par-rish, D., Ryerson, T., and Trainer, M.: Ammonia sources in the California South Coast Air5
Basin and their impact on ammonium nitrate formation, Geophys. Res. Lett., 39, L07804,doi:10.1029/2012GL051197, 2012. 19507, 19509
Park, R. J., Jacob, D. J., Field, B. D., Yantosca, R. M., and Chin, M.: Natural and transboundarypollution influences on sulfate-nitrate-ammonium aerosols in the United States: implicationsfor policy, J. Geophys. Res., 109, D15204, doi:10.1029/2003JD004473, 2004. 1950210
Pye, H. O. T., Liao, H., Wu, S., Mickley, L. J., Jacob, D. J., Henze, D. K., and Seinfeld, J.: Effectof changes in climate and emissions on future sulfate-nitrate-ammonium aerosol levels in theUnited States, J. Geophys. Res., 114, D01205, doi:10.1029/2008JD010701, 2009. 19501
Seinfeld, J. H. and Pandis, S.: Atmospheric Chemistry and Physics – From Air Pollution toClimate Change, 2nd edn., John Wiley & Sons Inc., Hoboken, New Jersey, 2006. 1950315
Weseley, M. L.: Parameterization of surface resistances to gaseous dry deposition inregional-scale numerical models, Atmos. Environ., 23, 1293–1304, doi:10.1016/0004-6981(89)90153-4, 1989. 19502
Zhang, L., Jacob, D. J., Knipping, E. M., Kumar, N., Munger, J. W., Carouge, C. C., van Donke-laar, A., Wang, Y. X., and Chen, D.: Nitrogen deposition to the United States: distribution,20
sources, and processes, Atmos. Chem. Phys., 12, 4539–4554, doi:10.5194/acp-12-4539-2012, 2012. 19501, 19503, 19505
Zhang, L. M., Gong, S. I., Padro, J., and Barrie, L.: A size-segregated particle dry de-position scheme for an atmospheric aerosol module, Atmos. Environ., 35, 549–560,doi:10.1016/S1352-2310(00)00326-5, 2001. 1950325
19512
ACPD12, 19499–19527, 2012
Simulation of nitrate,sulfate, and
ammonium aerosols
J. M. Walker et al.
Title Page
Abstract Introduction
Conclusions References
Tables Figures
J I
J I
Back Close
Full Screen / Esc
Printer-friendly Version
Interactive Discussion
Discussion
Paper
|D
iscussionP
aper|
Discussion
Paper
|D
iscussionP
aper|
Table 1. Measurement datasets.
Dataset Site locations Sampling Species measuredfrequency
IMPROVE Remote/ruralareas
24-h samples every3rd day
Fine particulate (<2.5 µm) sulfateand nitrate
CASTNET Remote/ruralareas
7-day samples Total particulate (not size selective)sulfate, nitrate and ammonium, SO2(g), HNO3 (g)
CARB Mostly urban 24-h samples every6 days
Fine particulate (<2.5 µm) sulfate,nitrate, and ammonium; PM10 sul-fate and nitrate
19513
ACPD12, 19499–19527, 2012
Simulation of nitrate,sulfate, and
ammonium aerosols
J. M. Walker et al.
Title Page
Abstract Introduction
Conclusions References
Tables Figures
J I
J I
Back Close
Full Screen / Esc
Printer-friendly Version
Interactive Discussion
Discussion
Paper
|D
iscussionP
aper|
Discussion
Paper
|D
iscussionP
aper|
Table 2. Normalized mean bias (%) of predicted seasonal concentrations relative to measure-ments (IMPROVE, CASTNET, CARB).
USA excluding California CaliforniaSeason Sulfate Nitrate Ammonium Sulfate Nitrate Ammonium
DJF +0.5 +237 +105 −25 −57 −56MAM +16 +178 +80 −42 −37 −19JJA +28 +535 +91 −24 −11 −24SON +33 +479 +161 −43 −43 −26Annual +20 + 296 +107 −34 −43 −26
19514
ACPD12, 19499–19527, 2012
Simulation of nitrate,sulfate, and
ammonium aerosols
J. M. Walker et al.
Title Page
Abstract Introduction
Conclusions References
Tables Figures
J I
J I
Back Close
Full Screen / Esc
Printer-friendly Version
Interactive Discussion
Discussion
Paper
|D
iscussionP
aper|
Discussion
Paper
|D
iscussionP
aper|
Table 3. Normalized mean bias (%) of monthly mean predicted concentrations at selected sites.
Aerosol species Dataset Fresno, CA Riverside, CA Bondville, IL
Nitrate IMPROVE −71 N/A +143CARB (PM10) −51 −64 N/ACARB (PM2.5) −73 −67 N/ACASTNET N/A N/A +120
Sulfate IMPROVE −25 N/A +17CARB (PM10) −27 −54 N/ACARB (PM2.5) −19 −35 N/ACASTNET N/A N/A +0.1
Ammonium IMPROVE N/A N/A N/ACARB (PM10) N/A N/A N/ACARB (PM2.5) −59 −59 N/ACASTNET N/A N/A +67
19515
ACPD12, 19499–19527, 2012
Simulation of nitrate,sulfate, and
ammonium aerosols
J. M. Walker et al.
Title Page
Abstract Introduction
Conclusions References
Tables Figures
J I
J I
Back Close
Full Screen / Esc
Printer-friendly Version
Interactive Discussion
Discussion
Paper
|D
iscussionP
aper|
Discussion
Paper
|D
iscussionP
aper|
120 ° W 110° W 100° W 90° W
80° W
70° W
30 ° N
40 ° N
50 ° N
IMPROVE
CASTNET
CARB
GEOS−Chem Grid Box Centers
Fig. 1. Locations of IMPROVE, CASTNET, and CARB measurement sites, and GEOS-Chemgrid box centers over the US.
19516
ACPD12, 19499–19527, 2012
Simulation of nitrate,sulfate, and
ammonium aerosols
J. M. Walker et al.
Title Page
Abstract Introduction
Conclusions References
Tables Figures
J I
J I
Back Close
Full Screen / Esc
Printer-friendly Version
Interactive Discussion
Discussion
Paper
|D
iscussionP
aper|
Discussion
Paper
|D
iscussionP
aper|
0 10 20 30 40 50 60 70 80 90 1000.00
0.02
0.04
0.06
0.08
0.10
0.12
0.14
0.16
0.18
Relative Humidity (%)
γ
Sulfate, T≤ 282K
Sulfate, T=293K
Dust
Black Carbon
Organic Carbon
Sea Salt
Fig. 2. Values of the N2O5 hydrolysis uptake coefficient γ in GEOS-Chem.
19517
ACPD12, 19499–19527, 2012
Simulation of nitrate,sulfate, and
ammonium aerosols
J. M. Walker et al.
Title Page
Abstract Introduction
Conclusions References
Tables Figures
J I
J I
Back Close
Full Screen / Esc
Printer-friendly Version
Interactive Discussion
Discussion
Paper
|D
iscussionP
aper|
Discussion
Paper
|D
iscussionP
aper|
Nitrate
µg/m30 2 4 6 8 10 12
Sulfate
µg/m30 2 4 6 8
Ammonium
µg/m30 1 2 3 4
DJF
MAM
JJA
SON
Fig. 3. Predicted concentrations of nitrate, sulfate and ammonium aerosol for 2009 December-January-February (DJF), March-April-May (MAM), June-July-August (JJA) and September-October-November (SON).
19518
ACPD12, 19499–19527, 2012
Simulation of nitrate,sulfate, and
ammonium aerosols
J. M. Walker et al.
Title Page
Abstract Introduction
Conclusions References
Tables Figures
J I
J I
Back Close
Full Screen / Esc
Printer-friendly Version
Interactive Discussion
Discussion
Paper
|D
iscussionP
aper|
Discussion
Paper
|D
iscussionP
aper|
Nitrate
GE
OS
−C
hem
IMP
RO
VE
& C
AS
TN
ET
& C
AR
B
µg/m30 2 4 6
Sulfate
GE
OS
−C
hem
IMP
RO
VE
& C
AS
TN
ET
& C
AR
B
µg/m30 1 2 3 4 5
Ammonium
GE
OS
−C
hem
CA
ST
NE
T &
CA
RB
µg/m30 1 2 3 4
Fig. 4. Predicted 2009 annual mean concentrations compared with measured concentrations.
19519
ACPD12, 19499–19527, 2012
Simulation of nitrate,sulfate, and
ammonium aerosols
J. M. Walker et al.
Title Page
Abstract Introduction
Conclusions References
Tables Figures
J I
J I
Back Close
Full Screen / Esc
Printer-friendly Version
Interactive Discussion
Discussion
Paper
|D
iscussionP
aper|
Discussion
Paper
|D
iscussionP
aper|
NitrateG
EO
S−
Che
mIM
PR
OV
E &
CA
ST
NE
T&
CA
RB
µg/m30 2 4 6
Sulfate
GE
OS
−C
hem
IMP
RO
VE
& C
AS
TN
ET
& C
AR
B
µg/m30 1 2 3 4
Ammonium
GE
OS
−C
hem
CA
ST
NE
T &
CA
RB
µg/m30 1 2 3
Fig. 5. Same as Fig. 4, but in detail for California.
19520
ACPD12, 19499–19527, 2012
Simulation of nitrate,sulfate, and
ammonium aerosols
J. M. Walker et al.
Title Page
Abstract Introduction
Conclusions References
Tables Figures
J I
J I
Back Close
Full Screen / Esc
Printer-friendly Version
Interactive Discussion
Discussion
Paper
|D
iscussionP
aper|
Discussion
Paper
|D
iscussionP
aper|
0 2 4 6 80
2
4
6
8
10
Measured (µg/m3)
Pre
dict
ed (µ
g/m
3 )
Nitrate
IMPROVE (Non−Calif)
CASTNET (Non−Calif)
IMPROVE (Calif)
CASTNET (Calif)
CARB (Calif)
0 1 2 3 4 50
1
2
3
4
5
Measured (µg/m3)
Pre
dict
ed (µ
g/m
3 )
Sulfate
0 0.5 1 1.5 2 2.50
0.5
1
1.5
2
2.5
3
3.5
Measured (µg/m3)
Pre
dict
ed (µ
g/m
3 )
Ammonium
y = 3.51xR2 = 0.81
y = 0.41xR2 = 0.66 y = 0.53x
R2 = 0.85
y = 1.17xR2 = 0.95
y = 0.52xR2 = 0.67
y = 2.06xR2 = 0.97
Fig. 6. Predicted versus measured annual mean concentrations. Each data point correspondsto an observed concentration at a measurement site along with the predicted concentrationin the GEOS-Chem grid box containing the measurement site. Measured concentrations areIMPROVE (PM2.5), CASTNET (TPM), and CARB (PM2.5 for nitrate and ammonium, PM10 forsulfate). Red regression lines are for California sites only. Blue regression lines are for all sitesexcluding California. Coefficients of determination, R2, calculated for regression through theorigin (Montgomery et al., 2006).
19521
ACPD12, 19499–19527, 2012
Simulation of nitrate,sulfate, and
ammonium aerosols
J. M. Walker et al.
Title Page
Abstract Introduction
Conclusions References
Tables Figures
J I
J I
Back Close
Full Screen / Esc
Printer-friendly Version
Interactive Discussion
Discussion
Paper
|D
iscussionP
aper|
Discussion
Paper
|D
iscussionP
aper|
2 4 6 8 10 120
5
10
15
Nitr
ate
(µg/
m3 )
Nitrate − Fresno, CA
IMPROVE (PM2.5
) CARB (PM10
) CARB (PM2.5
) CASTNET (TPM) GEOS−Chem (TPM)
2 4 6 8 10 120
2
4
6
8
10
12Nitrate − Riverside, CA
2 4 6 8 10 120
2
4
6
8
10Nitrate − Bondville, IL
2 4 6 8 10 120
0.5
1
1.5
2
2.5
3
3.5
4
Sul
fate
(µg/
m3 )
Sulfate − Fresno, CA
2 4 6 8 10 120
1
2
3
4
5
6Sulfate − Riverside, CA
2 4 6 8 10 120
1
2
3
4
5
6
7
8
9Sulfate − Bondville, IL
2 4 6 8 10 120
1
2
3
4
5
Month
Am
mon
ium
(µg/
m3 )
Ammonium − Fresno, CA
2 4 6 8 10 120
1
2
3
4
5
6
Month
Ammonium − Riverside, CA
2 4 6 8 10 120.5
1
1.5
2
2.5
3
3.5
Month
Ammonium − Bondville, IL
Fig. 7. Monthly mean predicted and measured aerosol nitrate, sulfate and ammonium concen-trations at selected sites.
19522
ACPD12, 19499–19527, 2012
Simulation of nitrate,sulfate, and
ammonium aerosols
J. M. Walker et al.
Title Page
Abstract Introduction
Conclusions References
Tables Figures
J I
J I
Back Close
Full Screen / Esc
Printer-friendly Version
Interactive Discussion
Discussion
Paper
|D
iscussionP
aper|
Discussion
Paper
|D
iscussionP
aper|
Discu
ssionPaper
|Discu
ssionPap
er|
Discu
ssionPap
er|
Discu
ssionPap
er|
HNO3
µg/m
3
1
2
3
4
5
6
7
8
9
10
11
NO3−
µg/m
3
1
2
3
4
5
6
7
8
9
Fig. 8. Predicted annual mean concentrations of HNO3 (upper panel) and nitrate aerosol (lower panel).
23
Fig. 8. Predicted annual mean concentrations of HNO3 (upper panel) and nitrate aerosol (lowerpanel).
19523
ACPD12, 19499–19527, 2012
Simulation of nitrate,sulfate, and
ammonium aerosols
J. M. Walker et al.
Title Page
Abstract Introduction
Conclusions References
Tables Figures
J I
J I
Back Close
Full Screen / Esc
Printer-friendly Version
Interactive Discussion
Discussion
Paper
|D
iscussionP
aper|
Discussion
Paper
|D
iscussionP
aper|
2 4 6 8 10 120
5
10
15
20
25
Pre
dict
ed C
once
ntra
tion
(µg/
m3 ) Fresno, CA
HNO3NO3
− NH3NH4
+
2 4 6 8 10 120
1
2
3
4
5
6
Month
Pre
dict
ed C
once
ntra
tion
(µg/
m3 ) Fresno, CA
2 4 6 8 10 120
5
10
15
20
25Riverside, CA
2 4 6 8 10 120
1
2
3
4
5
6
Month
Riverside, CA
2 4 6 8 10 120
5
10
15
20
25Bondville, IL
2 4 6 8 10 120
1
2
3
4
5
6
Month
Bondville, IL
Fig. 9. Predicted monthly mean concentrations of gas-phase nitric acid, nitrate aerosol, gas-phase ammonia, and ammonium aerosol at selected sites.
19524
ACPD12, 19499–19527, 2012
Simulation of nitrate,sulfate, and
ammonium aerosols
J. M. Walker et al.
Title Page
Abstract Introduction
Conclusions References
Tables Figures
J I
J I
Back Close
Full Screen / Esc
Printer-friendly Version
Interactive Discussion
Discussion
Paper
|D
iscussionP
aper|
Discussion
Paper
|D
iscussionP
aper|
0 100 200 300 400 500 600 700 8000
5
10
15
20
25
Pre
dict
ed N
itrat
e (µ
g/m
3 )
Fresno, CA
Base case 2 x NH3 Emissions 10 x NH
3 Emissions
0 100 200 300 400 500 600 700 8000
10
20
30
40
50
60
70
80
Hour (January 2009)
Pre
dict
ed N
itrat
e (µ
g/m
3 )
Riverside, CA
Fig. 10. Predicted hourly nitrate concentrations in ammonia sensitivity analysis.
19525
ACPD12, 19499–19527, 2012
Simulation of nitrate,sulfate, and
ammonium aerosols
J. M. Walker et al.
Title Page
Abstract Introduction
Conclusions References
Tables Figures
J I
J I
Back Close
Full Screen / Esc
Printer-friendly Version
Interactive Discussion
Discussion
Paper
|D
iscussionP
aper|
Discussion
Paper
|D
iscussionP
aper|
IASI
mg/
m2
0
1
2
3
4
5
GEOS−Chem
mg/
m2
0
1
2
3
4
5
Fig. 11. Satellite-measured (IASI) and predicted April–November 2009 mean ammoniacolumns.
19526
ACPD12, 19499–19527, 2012
Simulation of nitrate,sulfate, and
ammonium aerosols
J. M. Walker et al.
Title Page
Abstract Introduction
Conclusions References
Tables Figures
J I
J I
Back Close
Full Screen / Esc
Printer-friendly Version
Interactive Discussion
Discussion
Paper
|D
iscussionP
aper|
Discussion
Paper
|D
iscussionP
aper|
Apr May Jun Jul Aug Sep Oct Nov0
5
10
15
20
Month
NH
3 Col
umn
(mg/
m2 )
San Joaquin Valley, CA
IASIGEOS−Chem
Apr May Jun Jul Aug Sep Oct Nov0
2
4
6
8
Month
NH
3 Col
umn
(mg/
m2 )
Riverside, CA
IASIGEOS−Chem
17
14
21
16
1215
1020
23
7
24
2328
15
1
23
Fig. 12. Satellite-measured (IASI) and predicted monthly mean ammonia columns for April–November 2009 at a grid cell centered at 119.3◦ W, 36.0◦ N in the San Joaquin Valley, CA andat a grid cell centered at 117.3◦ W, 34.0◦ N in Riverside, CA. The number of IASI measurementdays each month is indicated above each IASI monthly value.
19527