
Jan Simon Hutta - Geographies of Geborgenheit - Beyond Feelings of Safety and the Fear of Crime
Upload
claude-mcbrideCategory
view
223download
0
simulation of gel permeation (size exclusion) chromatography
Jetse Reijenga1, Wieb Kingma1, Dušan Berek2, Milan Hutta3
1Eindhoven University of Technology2Slovak Academy of Science, Bratislava
3Comenius University Bratislava
ISSS-2006 Lipica 27-29 september 2006

Demonstrate and visualize the influence of following parameters on chromatographic results and interpretation:• Choice sample: polymer, molar mass, distribution• Choice of column parameters• Choice of instrument parameters
target audience
• Polymer scientists• Chromatographers• Teachers of separation science• Students
purpose of the simulator

• flow rate (0.1-10 ml/min, default 1 ml/min)• injection volume (1-1000 l, default 10 l)• temperature (25-220 ºC, default 40 ºC)• column length (50-1200 mm, default 300 mm)• column ID (2-20 mm, default 7.5 mm)• connection (dead) volume (0-1000 µl)• detector type (Refractive Index, Viscosity, Density, Lightscatter• detector volume (1-1000 µl)• detector path length (1-25 mm)• detector time constant (0.01-5 s)
instrument parameters that can be manipulated and trained
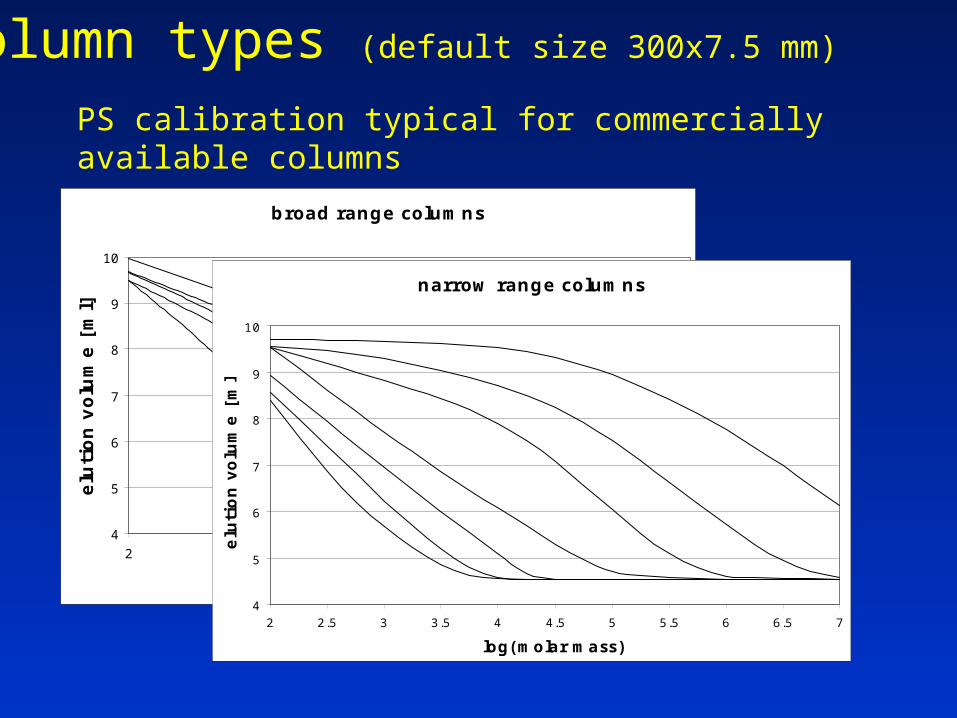
PS calibration typical for commercially available columns
broad range columns
4
5
6
7
8
9
10
2 3 4 5 6 7
log(molar mass)
elu
tion
volu
me [
ml]
narrow range columns
4
5
6
7
8
9
10
2 2.5 3 3.5 4 4.5 5 5.5 6 6.5 7
log(molar mass)
elu
tion v
olu
me [
ml]
column types (default size 300x7.5 mm)

• type of polymer• molar mass (1,000 - 10,000,000 g/mol)• sample: either single polymer of variable distribution or mix of
infinitely narrow distributions of several different polymers• distribution function (Poisson, Lognormal or Flory)• sample concentration (0-1000 mg/ml)
PS (as calibration reference), PMMA, PEMA, PBMA, PiBMA, P2EHMA, PC10MA, PMA, PEA, PBA, P2EHA, PiBoMA, PVA, PCL, PC etc
sample parameters

• calibration through PS as a reference using polynomal fit to the
calibration curves from the manufacturer:
Ve = A + B.LogM + C.LogM2 + D.LogM3 + E.LogM4 + F.LogM5
• other polymers i modeled using K and a coefficients:
log(MPS) = (1/(aPS + 1))log(Ki/KPS) + ((ai + 1)/(aPS + 1))log(Mi)
• K and a coefficients (THF, 25ºC) were taken from literature
• detailed modeling of chromatographic peak broadening
• simulation of influence of extra-column broadening (injection,
connections, detection)
modeling retention & dispersion

universal calibration

choose column….

choose detector

bandbroadening details

conclusions
Using one can:
• Visualize all retention and dispersion effects• Validate experimental setup• Check sensitivity of results for many operating parameters• Extrapolate current instrument specifications• Perform hypothetical experiments
http://chem.tue.nl/ce

Thank you
Thank you


![New Booksgvhealth.intersearch.com.au/uploads/June_2019.pdf · 2019-06-24 · Obstetrics / Gynaecology Berek & Novak's gynecology Edited by] Jonathan S. Berek. 16th ed. Wolters Kluwer,](https://static.fdocuments.us/doc/165x107/5e82cfe937ae1c1f7e7ec64f/new-2019-06-24-obstetrics-gynaecology-berek-novaks-gynecology-edited.jpg)

![Leica M-Lenses - Omnifoto · [4] Leica M Lenses The Soul of Leica The soul of Leica M lenses Ever since Professor Max Berek de-signed his first lens for the Leica, the 50 mm f/3.5](https://static.fdocuments.us/doc/165x107/603ae5c86dba652c27200dd1/leica-m-lenses-omnifoto-4-leica-m-lenses-the-soul-of-leica-the-soul-of-leica.jpg)

