Simulation modelling of cost overruns in building...
14
Simulation modelling of cost overruns in building projects Shanmugam, M, Amaratunga, RDG and Zainudeen, N Title Simulation modelling of cost overruns in building projects Authors Shanmugam, M, Amaratunga, RDG and Zainudeen, N Type Conference or Workshop Item URL This version is available at: http://usir.salford.ac.uk/9884/ Published Date 2006 USIR is a digital collection of the research output of the University of Salford. Where copyright permits, full text material held in the repository is made freely available online and can be read, downloaded and copied for non-commercial private study or research purposes. Please check the manuscript for any further copyright restrictions. For more information, including our policy and submission procedure, please contact the Repository Team at: [email protected] .
-
Upload
truongkien -
Category
Documents
-
view
219 -
download
0
Transcript of Simulation modelling of cost overruns in building...
Simulation modelling of cost overruns in building projects
Shanmugam, M, Amaratunga, RDG and Zainudeen, N
Title Simulation modelling of cost overruns in building projects
Authors Shanmugam, M, Amaratunga, RDG and Zainudeen, N
Type Conference or Workshop Item
URL This version is available at: http://usir.salford.ac.uk/9884/
Published Date 2006
USIR is a digital collection of the research output of the University of Salford. Where copyright permits, full text material held in the repository is made freely available online and can be read, downloaded and copied for noncommercial private study or research purposes. Please check the manuscript for any further copyright restrictions.
For more information, including our policy and submission procedure, pleasecontact the Repository Team at: [email protected].
103
SIMULATION MODELLING OF COST OVERRUNS IN BUILDING PROJECTS
Menaha Shanmugam1, M.N.Zainudeen2, & R.D.G.Amaratunga1
1Research Institute for the Built and Human Environment, University of Salford, Salford M5 4WT
E-mail: [email protected] 2Department of Building Economics, University of Moratuwa, Sri Lanka.
ABSTRACT: In the domain of construction, cost overruns from tender Bill of Quantities (BOQ) to final account are common in almost every project. The aim of the study based upon which this paper is produced is to identify and analyse the building construction cost overruns in Sri Lankan construction industry. The factors affecting the building construction cost overruns were identified and quantified. A preliminary questionnaire survey was conducted to identify the building projects and detailed case studies were carried out on thirty building projects in order to quantify the factors such as variation, extra work, increase or decrease of value of BOQ item, price fluctuation, day works and others that are affecting building cost overruns and to establish the distribution curve for such factors. Accordingly, a probability distribution was established for each factor identified and subsequently a simulation model was developed to quantify the cost overruns.
Keywords – Building Projects, Construction, Cost Overruns, Simulation, Sri Lanka
1 BACKGROUND It is very important in a building contract, that its objectives are met to the satisfaction of the parties involved. The major targets of the building contracts such as cost, time and quality play an important role in achieving objectives/goals expected. These three factors are interrelated and interdependent. Therefore it is essential to maintain a proper balance between the three so that the product can be constructed in time, within the budget and at the required quality. However, it is an admitted fact that in Sri Lanka, the majority of contracts suffer undue time extensions and /or additional cost to the client and /or inadequate quality of work.
Cost overruns and time overruns can be either avoidable or unavoidable. Overruns due to design plan or project management problems are avoidable because they could have reasonably been foreseen and prevented. However, there are some unavoidable costs such as those due to unanticipated events which cannot reasonably be prevented. Cost overruns may add value to projects when extra work is done with the intention of producing a better output. Overruns may also add value when they involve work that was omitted from design plans but clearly needed to be done. However, some overruns may not add value and represent wasted money if they do not result in a better product.
Cost overrun of a project refers to the actual ‘cost increase’ to the client during construction of a building project (Janaka, 1992). It is merely the difference between the value originally envisaged for the project and the value reflected in the final certificate. Cost overruns occur from overspending the allowances, making changes and encountering unforeseen problems. Proper planning can greatly reduce cost overruns.
The causes for cost overruns differ from country to country. According to a study done in Kuwait by Koushki et al (2005) the three main causes of cost overruns were identified as contractor-related problems, material-related problems and, owners’ financial constraints. Another study from Indonesia revealed the three most frequently occurring causes of cost overruns are materials cost increases due to inflation, inaccuracy of quantity take-off and cost
104
increase due to environmental restrictions (Kaming et al, 1997). But in general it is found that the variation was a main source of cost overrun and the design team believes that the client predominantly creates variations which lead to many problems in building contracts. However, the design team must examine their activities critically and ensure that they do not mislead the client in an attempt to cover their own inadequacies. Hence, one of the objectives of this study is identifying the factors influencing the cost overruns in Sri Lankan construction industry. 2 AIM AND OBJECTIVES
The aim of the study reported in this paper is to identify and analyze the building construction cost overruns in Sri Lankan construction industry. To achieve this aim the following objectives are set. They are;
• to identify the factors influencing the building construction cost overruns. • to identify the current view of cost overruns in Sri Lankan construction industry • to quantify the percentage of building construction cost overruns factors. • to establish probability distribution for identified factors • to develop the simulation model
3 SCOPE AND LIMITATIONS
Due to time constraints, this research is limited for the building projects with the value of more than five millions and projects built in the western province. The data were collected from the building projects undertaken by contractors who posses The Institute for Construction Training and Development (ICTAD) grades M1, M2 and M3 in Sri Lanka. ICTAD, which is the regulatory authority of construction in Sri Lanka, categorises the contractors into grades based on the value of the project they undertake and their performance. In this regard the M1, M2 and M3 grade contractors are eligible for construction of buildings over Rs.300, between Rs.150 and Rs 300 and between Re 50 and Rs 150 million in value respectively. 4 DATA COLLECTION This research mainly focuses on the factors influencing the cost overruns of building construction. A preliminary questionnaire was carried out among the M1, M2 and M3 grade contractors in order to identify the building projects with the value of more than 5 million within the Western province. In total 50 questionnaires were distributed to collect the project details where only 30 were responded.
A case study approach was used to identify the factors affecting the building cost overruns and to quantify the identified factors in monitory terms. Comprehensive case studies were carried out on thirty building projects that had been selected through the preliminary questionnaire survey. In general, the case studies are the preferred research strategy when the focus is on a contemporary phenomenon within real-life context. Case study is an empirical inquiry that investigates a contemporary phenomenon within its real-life context, when the boundaries between phenomenon and context are not clearly evident; and in which multiple sources of evidence are used (Yin, 1994). A multiple case studies approach was designed in order to study and quantify the factors affecting cost overruns. Data collection has been done

105
33%
31%
12%
10%
7%7% Variation
Extra works
BOQ item increase or decrease
Day work
Price fluctuation
Others
both by interviewing professionals associated with the selected projects and by reviewing documents. Table 1 shows the composition of building types chosen for the study. The types of buildings include residential, commercial such as office buildings, shopping complex, administrative buildings etc. and other types such as educational, medical etc. The type of contract of 25 projects out of 30 is measure and pay. This is because the measure and pay system has the highest share among all the other types of procurement systems in Sri Lanka (Rameezdeen and De Silva, 2002). Please refer Appendix 1 for the details of projects that have been taken into analysis.
Table 1: Composition of Building Types
Type of building No of projects Percentage
Commercial building 17 57%
Residential buildings 06 20%
Other buildings 07 23%
Total Buildings 30 100%
5 FACTORS INFLUENCING BUILDING COST OVERRUNS The factors affecting the cost overruns of building projects are identified through the case studies. They are; Variations, Extra work, Increase or decrease the value of the BOQ items, Price fluctuations, Currency fluctuations, Day works and other (Arbitration awards, Claims, Termination of the contract, and Compensations)
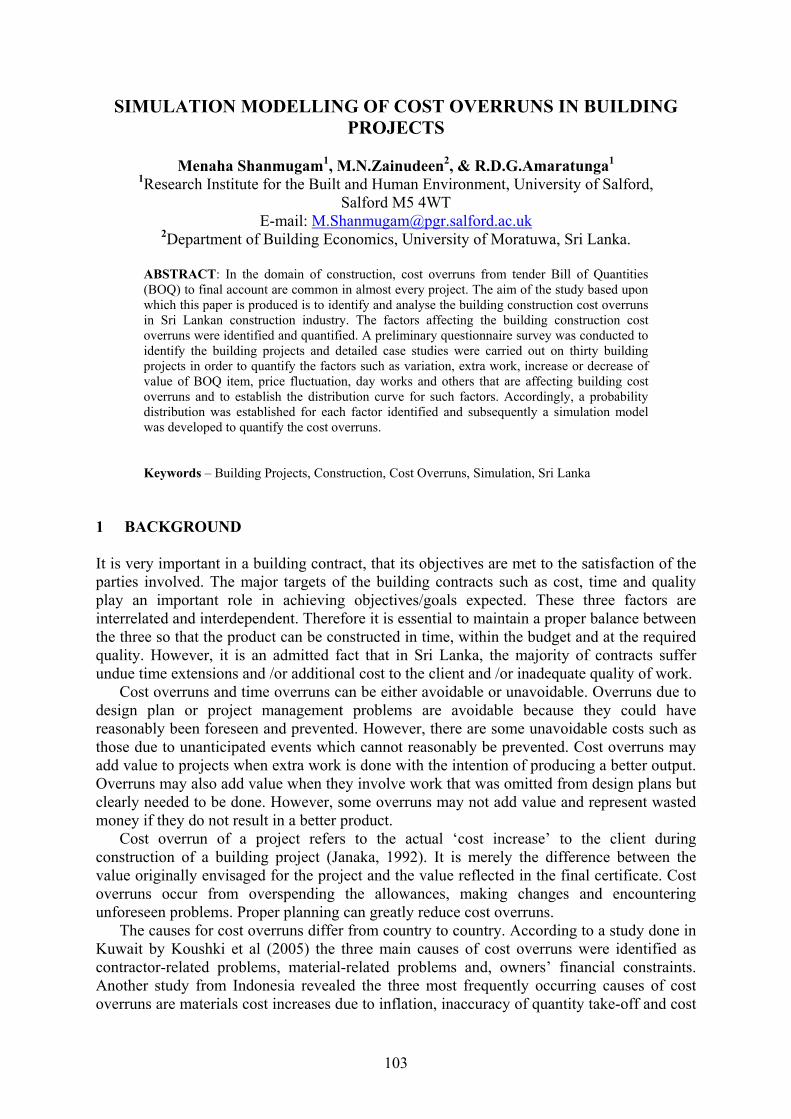
Average cost overruns identified in each factor were computed as a percentage of total cost overruns. Figure 1 shows the break down of the total cost overruns where average value of each factor can be seen.
Fig 1: Breakdowns of Cost Overrun
It is clearly seen from the above analysis that the significant cost overruns are mainly due to Variation and Extra work. Thus, the average cost overruns identified in variation and extra
106
work were of 33% and 31% respectively of the total cost overrun. 12% of the total cost overrun is due to the increase or decrease in the value of BOQ items. The day works account for 10%. All the other causes are below 10% of the total cost overrun.
The sources of variations and extra work can be classified into client initiated variations, consultant initiated variations and unforeseeable variations. The main reasons behind the higher percentages in variation and extra work are identified as design changes during the construction stage, improper management, ineffective communication and incorrect assessment of brief. Lack of information about the actual design during the tendering stage and inaccurate quantities of tender BOQ also ultimately lead to variation and extra work. There are instance where the actual quantities of work included in the bills of quantities, may change probably due to bill errors and / or changes in the provisional sum and prime cost sums. The provisional sum inserted in the bill of quantities will only be confirmed when the work is carried out actually. Similarly a prime cost sum which is a sum provided for work or services to be executed by a nominated sub contractor, a statuary authority will be known only at the time of the execution of work. Therefore the amount allocated in the bill will not always be equal to the final value thus will lead to cost overruns. The cost overruns can occur even due to fluctuations which includes both price and currency fluctuations. Day works occur when a need arises to carry out a work that cannot be quantified. In such an instance a daily or an hourly basis rate will be agreed. Other factors which cause cost overruns include claims, termination of contract, compensation etc.
From each case the average cost overrun was calculated against each factor and the mean and standard deviation of each factor were computed. The results are listed in Table 2.
Table 2: Mean and Standard Deviation of Factors
Factors of Cost Overruns Mean SD Variation 5.34 6.62 Extra Works 4.86 2.20 BOQ Item increase or Decrease 1.83 9.74 Day Works 1.56 0.81 Price Fluctuation 1.18 0.93 Others 1.13 2.12
6 SIMULATION COST MODELS A model is a logical description of how a system performs. A simulation model seeks to duplicate the behaviour of the system under investigation by studying the interactions among its components. It is a powerful tool for analyzing, designing and operating complex systems.
Simulations involve designing a model of a system and carrying out experiments on it as it progresses along time. However a simulation experiment differs from a regular laboratory experiment in that it can be conducted almost totally on the computer. The relationships in the data are able to be gathered in very much the same way as if the real system was being observed. The nature of the simulation, however, allows us much greater flexibility in representing complex systems that are normally difficult to analyse by standard mathematical models. Simulation can, however, be time-consuming particularly where we try to optimize the model (Ashworth, 1999). But one major benefits of a model is that you can begin with a simple approximation of a process and gradually refine the model as your understanding of the process improves. This “step-wise refinement” enables you to achieve good
107
approximations of very complex problems surprisingly quickly. As you add refinements, the model becomes more and more accurate.
The term simulation describes a wealth of varied and useful techniques, all connected with the mimicking of the rules of a model of some kind. Simulation techniques are used extensively in industry. For instance, flight simulators, which are used to train pilots, can introduce all type of hazards to the pilots by simulating the live situation. In construction, the use of simulation has many possible applications such as construction planning, construction estimating, life-cycle costing etc. (Ashworth, 1999) Forecasting of construction cost is a difficult task for estimators as most of the factors involved in pricing are uncertain. Price prediction is not a precise scientific exercise, but an art which involves both intuition and expert judgment. Despite the undoubted desirability of an unbiased price prediction, there exists no objectives test of the probability that a particular forecast will be achieved. Since a price prediction is the sum of many parts, any such objective evaluation of its precision is possible only by the use of statistical techniques. An estimator can use Monte Carlo simulation to solve this problem. The Monte Carlo technique is a commonly used method and is based upon the general idea of using sampling to estimate the desired result. The sampling process requires describing the problem under study by an appropriate probability distribution from which the samples are drawn. The distributions in a simulation exercise are at the centre of the technique, since it is from these that sampling will take place. These distributions can only be determined from data which have been carefully collected over a period of time (Ashworth, 1999)
In this regard this study has used the Monte Carlo technique which identifies the probability distribution of various factors affecting the cost overruns of the building projects. Monte Carlo analysis is from of stochastic simulation. Stochastic or realistic means that the technique concerned is with controlling factors that cannot be estimated with certainty. It is called Monte Carlo because it makes use of random numbers to select outcomes.
7 A STEP BY STEP APPROACH TO MONTE CARLO SIMULATION The Monte Carlo procedure is now described in more detail. Monte Carlo analysis proceeds by generating a series of simulations of a proposed project, each simulation giving a price prediction for the cost overruns of the project. The predictions are plotted, first as cumulative frequency curve and secondly as a histogram. Visual Basic and MS Excel are used to construct the model. The steps of this analysis are elaborated in detail below: 7.1 Step 1: Developing Probability Distribution for Selected Variables Firstly the problem should be described under an appropriate probability distribution from which the samples are to be drawn. This is the crucial and most difficult part of the analysis. As the determination of the distribution is very vital the historical data on cost overruns factors have been collected very carefully. The next crucial step is to choose the appropriate probability distribution for the data set collected. The historical data of cost overruns give us measures of centrality (the mean) and dispersion (the variance) which the probability distribution must also exhibit. It is desirable, in addition, if the statistical distribution which was used includes the following two characteristics: the distribution is easily identifiable from a limited set of data, and the distribution is easily updated as additional historical data are introduced to the analysis.

108
There are various distributions which can be used for this purpose. The more simplistic approaches to Monte Carlo simulation use the uniform distribution, the triangular distribution, or the normal distribution. However, the one set of probability distributions which adequately displays all of these characteristics is known as the beta distribution. The beta distribution has the following equation
1 (x-a)p-1 (b-x)q-1
P(x) = --------- ----------------- B (p, q) (b-a) p+q-1
Where; P(x) = frequency density function
a = minimum cost overruns
b = maximum cost overruns
p,q = parameters of the distribution; p,q >0
B (p, q) = beta function
Here B (p, q) = ∫ x p-1. (1-x) q-1 dx where 0 ≤ x ≤1, (a ≤ x ≤b), and p,q >0
The first point to note is that the appropriate beta distribution is determined completely by the parameters ‘p’, ‘q’, ‘a’ and ‘b’, which themselves are generated easily from the actual data to which the distribution refers. Being ‘a’ and ‘b’ are the lowest and highest values respectively in the data set the values for ‘p’ and ‘q’ are then calculated from the following equations:
p = ((µ1-a)2/(b-a)) x (1-((µ1-a)/(b-a))) x (µ2/(b-a)2)-1-((µ1-a)/(b-a))
q = ((µ1-a)/(b-a)) x (1-((µ1-a)/(b-a)))2 x (µ2/(b-a)2)-1-(1-(µ1-a)/(b-a))
Where; µ1 = mean
µ2 = variance
Table 3 shows the actual values of the parameters for each variable that is used to determine the beta distribution.
Table 3: Values of the parameters for cost overrun variables
Variables of Cost Overruns Mean(µ1) Variance(µ2) a b p q
Variation 5.34 43.28 0.54 17.39 0.096 0.241
Extra Works 4.86 28.46 0.20 21.00 0.368 1.275 BOQ Item increase or Decrease 1.83 91.76 0.00 29.57 0.028 0.419
Day Works 1.56 0.64 0.00 3.54 1.686 2.140
Price Fluctuation 1.18 0.84 0.00 4.40 0.945 2.578
Others 1.13 4.51 0.00 6.89 0.073 0.371
As per Table 3 there are six variables that influence the cost overruns in building projects. The values of the parameters ‘a’, ‘b’, ‘p’ and ‘q’ of each variable were applied in the
109
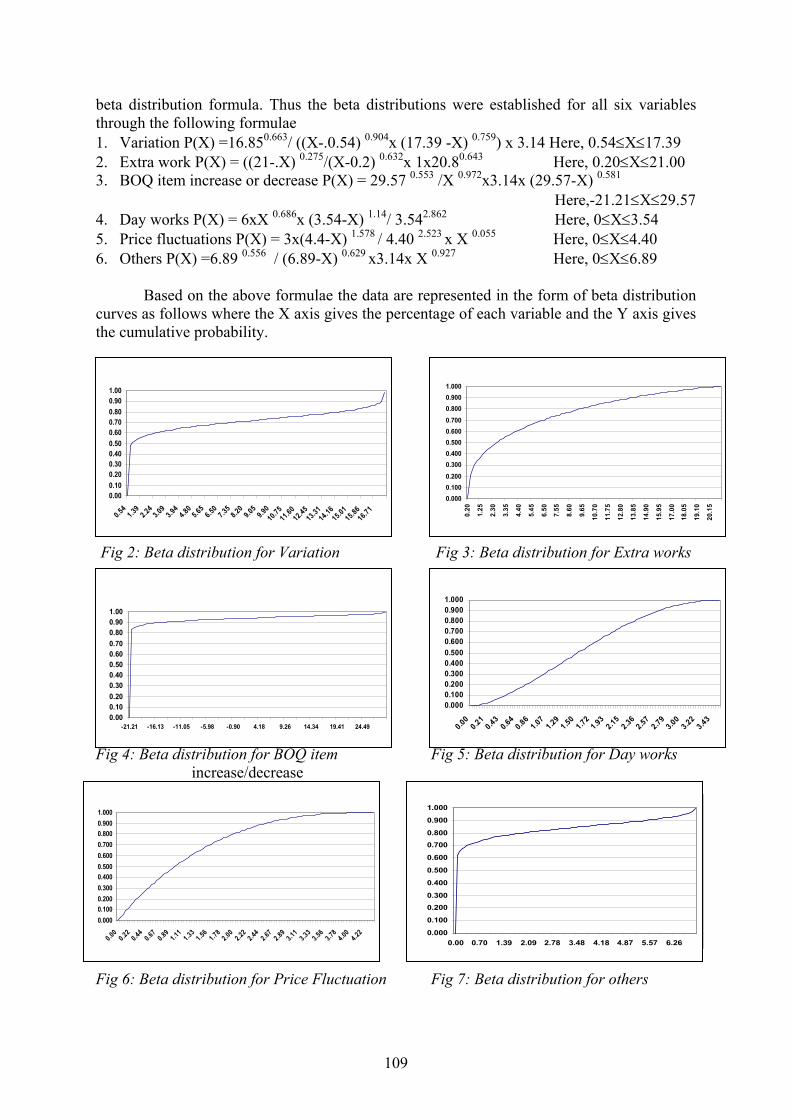
beta distribution formula. Thus the beta distributions were established for all six variables through the following formulae 1. Variation P(X) =16.850.663/ ((X-.0.54) 0.904x (17.39 -X) 0.759) x 3.14 Here, 0.54≤X≤17.39 2. Extra work P(X) = ((21-.X) 0.275/(X-0.2) 0.632x 1x20.80.643 Here, 0.20≤X≤21.00 3. BOQ item increase or decrease P(X) = 29.57 0.553 /X 0.972x3.14x (29.57-X) 0.581
Here,-21.21≤X≤29.57 4. Day works P(X) = 6xX 0.686x (3.54-X) 1.14/ 3.542.862 Here, 0≤X≤3.54 5. Price fluctuations P(X) = 3x(4.4-X) 1.578 / 4.40 2.523 x X 0.055 Here, 0≤X≤4.40 6. Others P(X) =6.89 0.556 / (6.89-X) 0.629 x3.14x X 0.927 Here, 0≤X≤6.89
Based on the above formulae the data are represented in the form of beta distribution curves as follows where the X axis gives the percentage of each variable and the Y axis gives the cumulative probability.
Fig 2: Beta distribution for Variation Fig 3: Beta distribution for Extra works
Fig 4: Beta distribution for BOQ item Fig 5: Beta distribution for Day works increase/decrease
Fig 6: Beta distribution for Price Fluctuation Fig 7: Beta distribution for others
0.000.100.200.300.400.500.600.700.800.901.00
0.54
1.39
2.24
3.09
3.94
4.80
5.65
6.50
7.35
8.20
9.05
9.9010
.7511
.6012
.4513
.3114
.1615
.0115
.8616
.710.0000.1000.2000.3000.4000.5000.6000.7000.8000.9001.000
0.20
1.25
2.30
3.35
4.40
5.45
6.50
7.55
8.60
9.65
10.7
0
11.7
5
12.8
0
13.8
5
14.9
0
15.9
5
17.0
0
18.0
5
19.1
0
20.1
5
0.000
0.100
0.200
0.300
0.400
0.500
0.600
0.700
0.800
0.900
1.000
0.00 0.70 1.39 2.09 2.78 3.48 4.18 4.87 5.57 6.26
0.0000.1000.2000.3000.4000.5000.6000.7000.8000.9001.000
0.00 0.220.44
0.67
0.89
1.11
1.33 1.56 1.782.00
2.22
2.44
2.67
2.89 3.113.33
3.56
3.78
4.00
4.22
0.0000.1000.2000.3000.4000.5000.6000.7000.8000.9001.000
0.000.21
0.430.64
0.861.07
1.291.50
1.721.93
2.152.36
2.572.79
3.003.22
3.430.000.100.200.300.400.500.600.700.800.901.00
-21.21 -16.13 -11.05 -5.98 -0.90 4.18 9.26 14.34 19.41 24.49
110
Variation
Extra Work
BOQ Item increase or decrease
Day Works
Price Fluctuation
Others
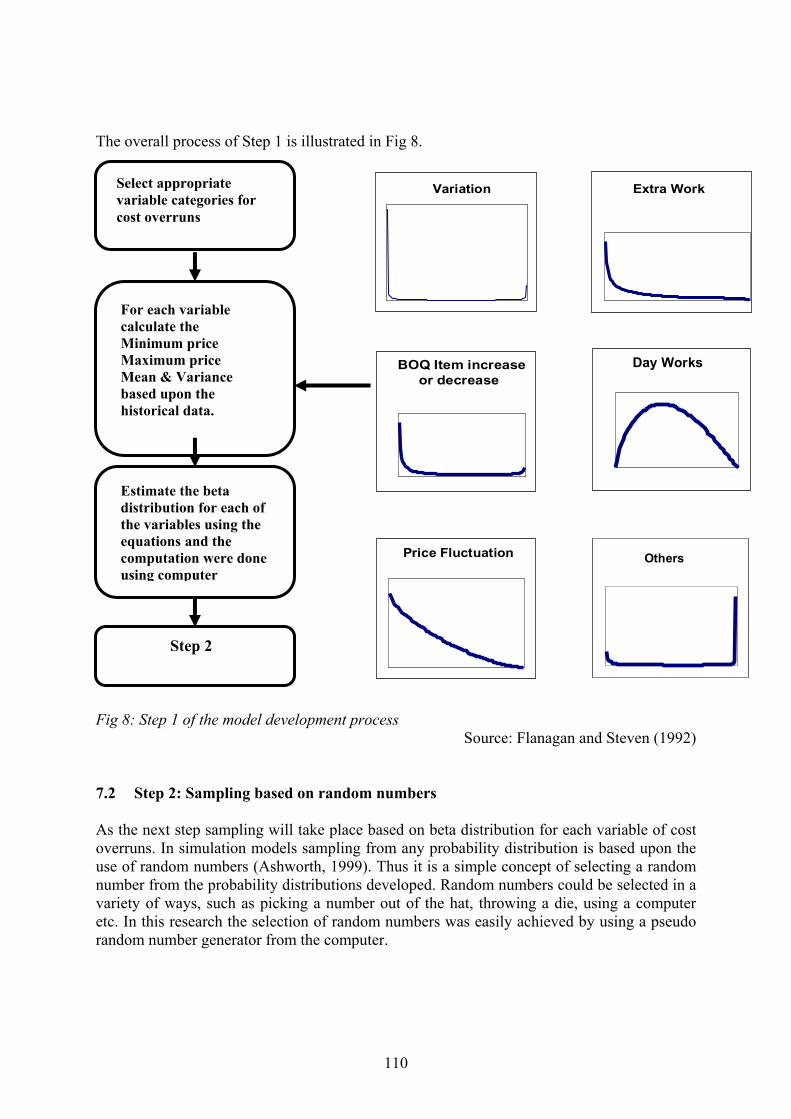
The overall process of Step 1 is illustrated in Fig 8.
Fig 8: Step 1 of the model development process
Source: Flanagan and Steven (1992) 7.2 Step 2: Sampling based on random numbers As the next step sampling will take place based on beta distribution for each variable of cost overruns. In simulation models sampling from any probability distribution is based upon the use of random numbers (Ashworth, 1999). Thus it is a simple concept of selecting a random number from the probability distributions developed. Random numbers could be selected in a variety of ways, such as picking a number out of the hat, throwing a die, using a computer etc. In this research the selection of random numbers was easily achieved by using a pseudo random number generator from the computer.
Select appropriate variable categories for cost overruns
For each variable calculate the Minimum price Maximum price Mean & Variance based upon the historical data.
Estimate the beta distribution for each of the variables using the equations and the computation were done using computer
Step 2
111
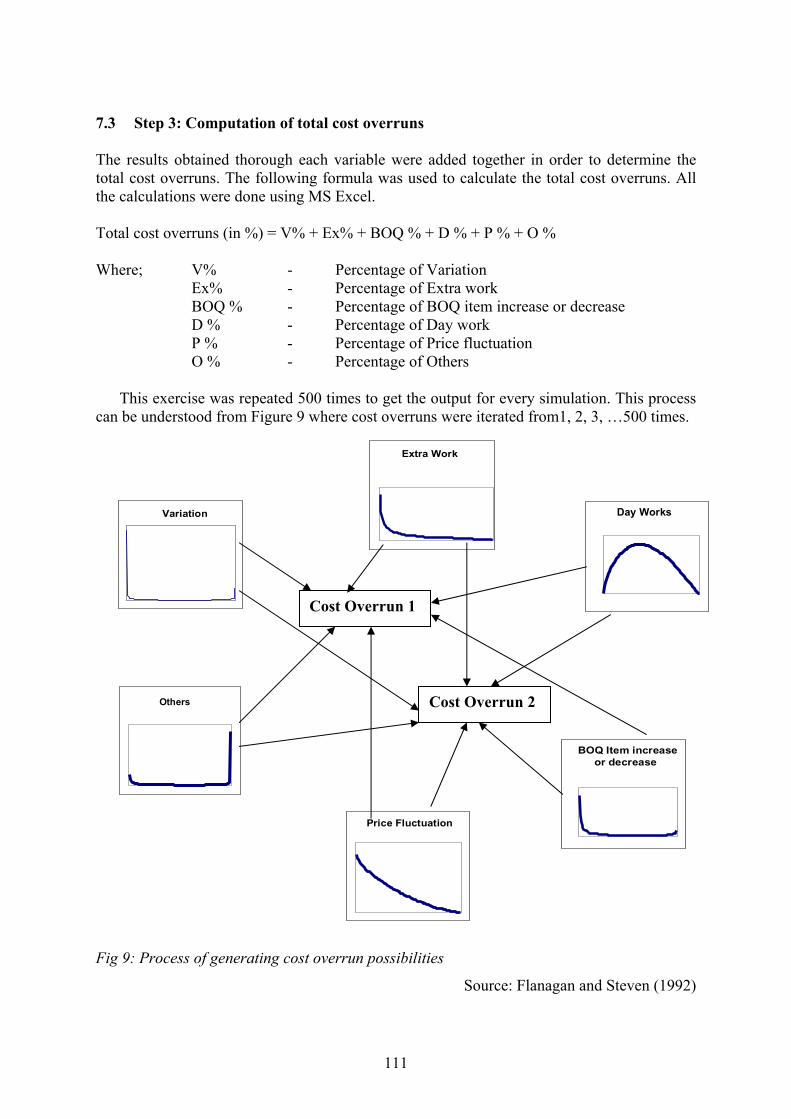
7.3 Step 3: Computation of total cost overruns The results obtained thorough each variable were added together in order to determine the total cost overruns. The following formula was used to calculate the total cost overruns. All the calculations were done using MS Excel. Total cost overruns (in %) = V% + Ex% + BOQ % + D % + P % + O % Where; V% - Percentage of Variation
Ex% - Percentage of Extra work BOQ % - Percentage of BOQ item increase or decrease D % - Percentage of Day work P % - Percentage of Price fluctuation O % - Percentage of Others
This exercise was repeated 500 times to get the output for every simulation. This process
can be understood from Figure 9 where cost overruns were iterated from1, 2, 3, …500 times.
Fig 9: Process of generating cost overrun possibilities
Source: Flanagan and Steven (1992)
Variation
Extra Work
BOQ Item increase or decrease
Day Works
Price Fluctuation
Others
Cost Overrun 1
Cost Overrun 2

112
7.4 Step 4: Construction of model Finally the 500 values (i.e estimates) obtained through Step 3 were plotted as a cumulative frequency curve and as a histogram. Here the determination of n (in this research n = 500) is very important in deriving the shape of the probability distribution. A lager value of ‘n’ is preferable as it would result in a smoother cumulative frequency curve and histogram.. The data were then transferred to a cumulative probability distribution that demonstrates the probable cost overruns as shown in Figure 10.
Fig 10: Simulation model for cost overruns in building projects The histogram in Fig 11 is used to supplement the cumulative frequency curve, since it
indicates the most likely cost overrun range for the building projects. From the Histogram it can be seen that the cost overruns for sixty-five building projects out of 500 are expected to be 27.49% of the contract sum. Most of the projects are concentrated in the middle range of the distribution.
Fig 11 : Histogram for total Cost Overruns
Percentage of Cost Overruns
Cumulative Distribution for Total Cost Overruns
0
0.1
0.2
0.3
0.4
0.5
0.6
-22.49 -12.49 -2.49 7.49 17.49 27.49 37.49 47.49 57.49 67.49 77.49
Cum
ulat
ive
Prob
abili
ty
0
10
20
30
40
50
60
70
-22.49
-12.49 -2.49 7.49
17.49 27.49
37.49 47.49 57.4967.49
77.49
Freq
uenc
y
Percentage of cost overruns

113
7.5 Limitations of the Model The probability distributions are derived from limited number of building projects and this is one of the main limitations associated with eh model. For the analysis of cost overruns, number of iteration is taken as five hundred, even though there is a possibility for unlimited iteration. 8 CONCLUSIONS In the domain of construction, cost overruns from tender Bill of Quantities (BOQ) to final account are common in Sri Lanka in almost every project. Main reason for this is tendering with very limited or inadequate information. In the requirement of design the scope and complexity of the project should be clearly defined, no matter how much changes are subsequently made in the design. However, it should be noted that change is not always a threat, but can be an opportunity to save cost and make the client’s money more valuable when it is managed effectively. The aim of this study is to identify and analyse cost overruns in building projects in the Sri Lankan construction industry. The factors affecting the cost overruns were identified and quantified. Probability distribution was established for each factor identified. The simulation model was developed to quantify the cost overruns.
It was found from the study that significant cost overruns are mainly due to variation and extra work. Thus, the average cost overruns identified in variation and extra work were of 33% and 31% respectively of the total cost overrun. The reasons for these results could be mainly attributed to the design changes during construction stage, improper management and ineffective communication. Lack of information about the actual design during the tendering stage and inaccurate quantities of tender BOQ also ultimately lead to cost overruns. 12% of the total cost overrun is due to increase or decrease in the value of BOQ items. The day works account for 10%. All the other causes are below 10% of the total cost overrun.
This research has developed a computer based simulation model to carry out construction cost overruns in building projects. The simulation model has been developed in visual basic on the Monte Carlo analysis. The calculations of the model are adhered to the cost overruns factors identified in the research. The model simulates possibilities of cost overruns represented in terms of probability distribution where the probability distribution was objectively derived from the past records collected through detail survey. Figure 2 shows the cumulative probability of cost overruns.
Figure 12 Simulation model for cost overruns
0
0.2
0.4
0.6
0.8
1
-22.49 -12.49 -2.49 7.49 17.49 27.49 37.49 47.49 57.49 67.49 77.49
Cum
ulat
ive
Prob
abili
ty
Percentage of Cost overruns
114
According to this model the cost overrun is less than 42.49% of the contract sum in 90% of the building projects. Only a very few projects are above 67.49%. This model provides the client with a range of possible cost overruns and their probability occurrences. Based on the outcome of this model an effective decision making can be done by the contractor using the information appropriately. This simulation model not only assists contractor in decision making but also provides contractor with an appropriate frame work for managing of and responding to cost overruns.
9 REFERENCES Ashworth, A. (1999) Cost studies of buildings, 3rd ed., Wesley Longman Ltd., London Dynamic simulation [Online] Available at http://www.goldsim.com [Accessed 04 June
2004] Flanagan, R and Steven, S (1992), Risk analysis, In: Brandon, P.S (Ed.), QS Techniques -
New directions, Blackwell Scientific Publication, Oxford Janaka, Y.R.A (1992) A Study of Cost and Time Overruns in Sri Lankan Building Contract,.
Unpublished B.Sc. in Quantity Surveying Dissertation, University of Moratuwa, Sri Lanka
Kaming, P.F., Olomolaiye, P.O., Holt, G.D. and Harris, F.C (1997), Factors influencing
construction time and cost overruns on high-rise projects in Indonesia, Construction Management and Economics, 15 (1), Pp 83 - 94
Koushki, P.A., Al-Rashid, K. and Kartam, N (2005) Delays and cost increases in the
construction of private residential projects in Kuwait, Construction Management and Economics, 23 (3), Pp 285–294.
Rameezdeen, R and De Silva (2002) Trends of Construction Procurement Systems in Sri
Lanka, Built Environment Sri Lanka, 2(1), Pp 2-9 Yin, R.K. (1994) Case Study Research Design and Methods, Sage publications, London

115
Appendix 1: Details of the Projects that were taken into analysis
Project Name
ICTAD Grade
Type of Contract
Type of building
Contract sum (Rs Million)
Final A/C Sum
(Rs Million)
Total Cost Overruns (%)
P1 M1 MP R 21.28 24.35 14.47P2 M3 MP C 12.47 18.71 50.20P3 M3 MP R 5.63 7.94 41.04P4 M2 MP C 19.19 24.41 51.69P5 M3 MP C 15.38 17.12 11.18P6 M1 MP C 108.3 114.62 6.44P7 M1 MP O 52.27 60.33 14.16P8 M1 MP C 148.78 205.34 38.00P9 M1 DB C 15.80 19.67 24.30
P10 M1 MP C 23.45 25.75 9.77P11 M1 DB O 19.06 19.83 3.99P12 M1 MP C 15.00 14.57 1.87P13 M2 MP C 9.76 10.88 11.99P14 M1 MP C 19.05 19.43 1.94P15 M2 MP O 8.41 12.83 52.44P16 M2 MP C 10.09 11.84 17.15P17 M2 MP R 12.73 11.73 -7.93P18 M1 MP C 63.60 58.39 -8.19P19 M2 MP R 5.96 6.80 13.93P20 M2 MP C 8.21 10.39 26.55P21 M1 MP C 51.62 61.83 19.84P22 M2 MP O 300.54 310.54 3.47P23 M1 LS O 119.58 126.05 7.92P24 M1 MP R 11.30 12.00 6.11P25 M1 DB C 20.00 22.00 24.75P26 M1 LS O 28.50 37.50 31.58P27 M1 MP C 9.60 10.19 6.15P28 M2 MP C 32.17 33.51 4.13P29 M3 MP C 13.15 13.72 4.41P30 M1 MP O 36.90 34.42 -6.72