Simulation Introduction. Why Simulate? Risk Free. Innovate and explore alternative strategies and...
22
Simulation Introduction
-
date post
20-Dec-2015 -
Category
Documents
-
view
216 -
download
2
Transcript of Simulation Introduction. Why Simulate? Risk Free. Innovate and explore alternative strategies and...
Simulation IntroductionSimulation Introduction
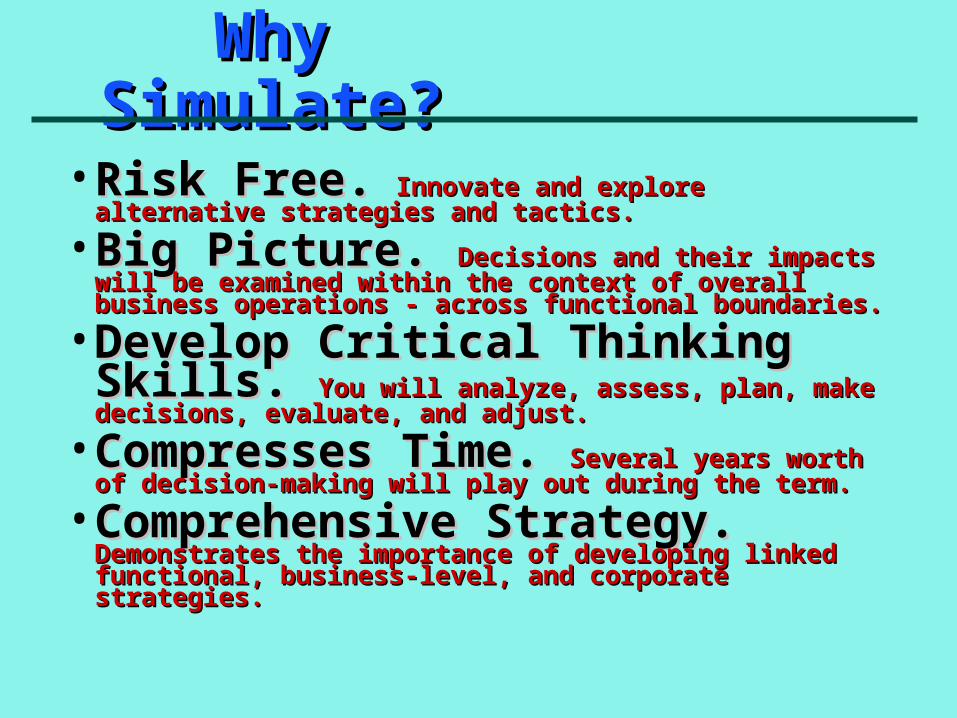
Why Simulate?Why Simulate?
• Risk Free.Risk Free. Innovate and explore alternative strategies Innovate and explore alternative strategies and tactics.and tactics.
• Big Picture. Big Picture. Decisions and their impacts will be Decisions and their impacts will be examined within the context of overall business operations - examined within the context of overall business operations - across functional boundaries.across functional boundaries.
• Develop Critical Thinking Skills. Develop Critical Thinking Skills. You will analyze, assess, plan, make decisions, evaluate, and You will analyze, assess, plan, make decisions, evaluate, and adjust.adjust.
• Compresses Time. Compresses Time. Several years worth of Several years worth of decision-making will play out during the term.decision-making will play out during the term.
• Comprehensive Strategy. Comprehensive Strategy. Demonstrates Demonstrates the importance of developing linked functional, business-the importance of developing linked functional, business-level, and corporate strategies.level, and corporate strategies.
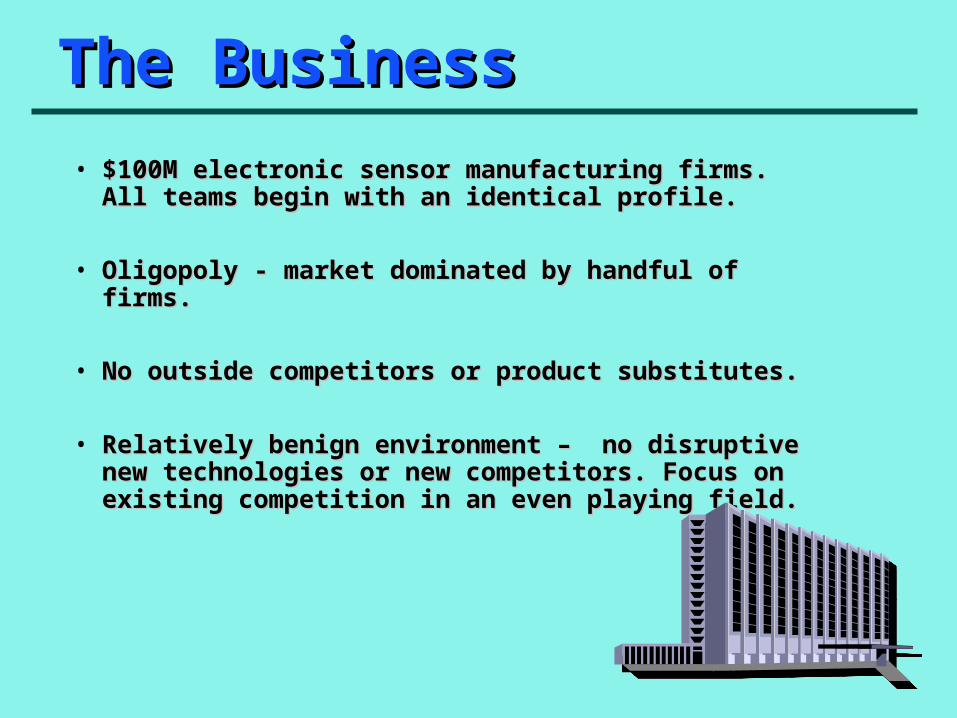
• $100M electronic sensor manufacturing firms. All $100M electronic sensor manufacturing firms. All teams begin with an identical profile.teams begin with an identical profile.
• Oligopoly - market dominated by handful of firms.Oligopoly - market dominated by handful of firms.
• No outside competitors or product substitutes.No outside competitors or product substitutes.
• Relatively benign environment – no disruptive new Relatively benign environment – no disruptive new technologies or new competitors. Focus on existing technologies or new competitors. Focus on existing competition in an even playing field.competition in an even playing field.
The BusinessThe Business
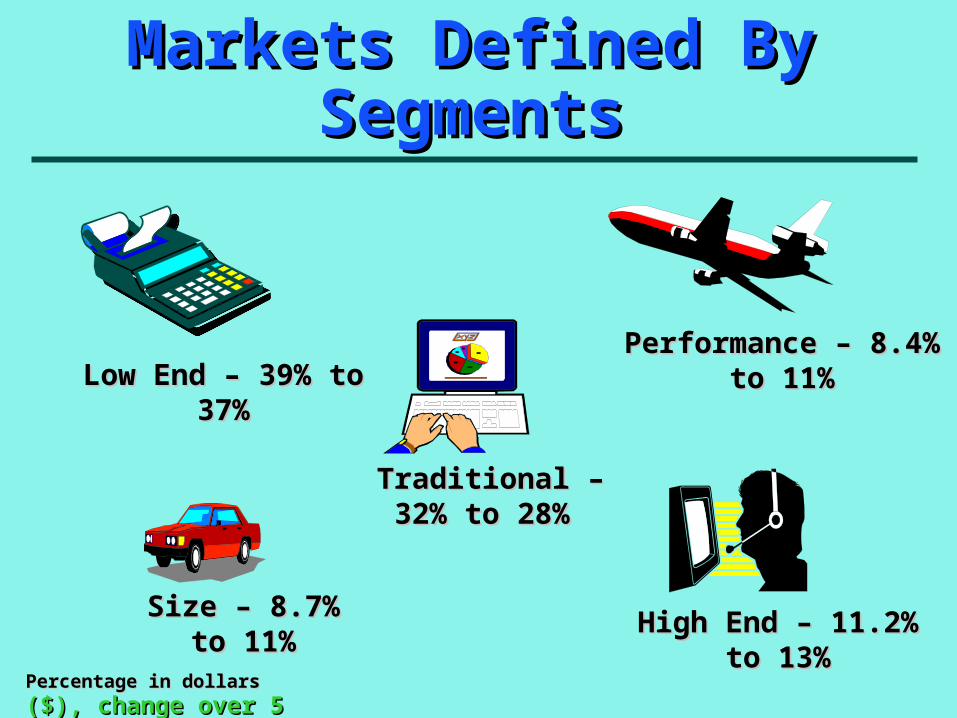
Markets Defined By Markets Defined By SegmentsSegments
Performance – 8.4% to Performance – 8.4% to 11%11%Low End – 39% to Low End – 39% to
37%37%
Traditional – 32% to Traditional – 32% to 28% 28%
Size – 8.7% to Size – 8.7% to 11%11%
High End – 11.2% to High End – 11.2% to 13%13%
Percentage in dollarsPercentage in dollars ($), ($), change over 5 yearschange over 5 years
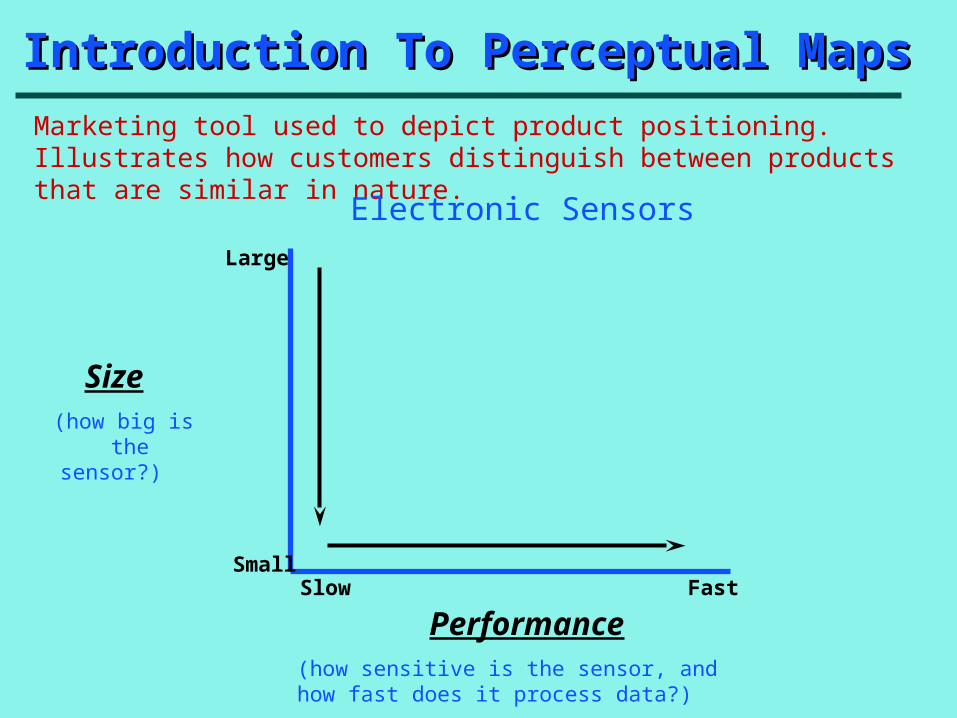
Introduction To Perceptual MapsIntroduction To Perceptual Maps
Size (how big is
the sensor?)
Performance(how sensitive is the sensor, and how fast does it process data?)
Large
Small Slow Fast
Marketing tool used to depict product positioning. Illustrates how customers distinguish between products that are similar in nature.
Electronic Sensors
Perceptual MapPerceptual Map
LargeLarge
SmallSmall
SlowSlow FastFast
SizeSize
PerformancePerformance
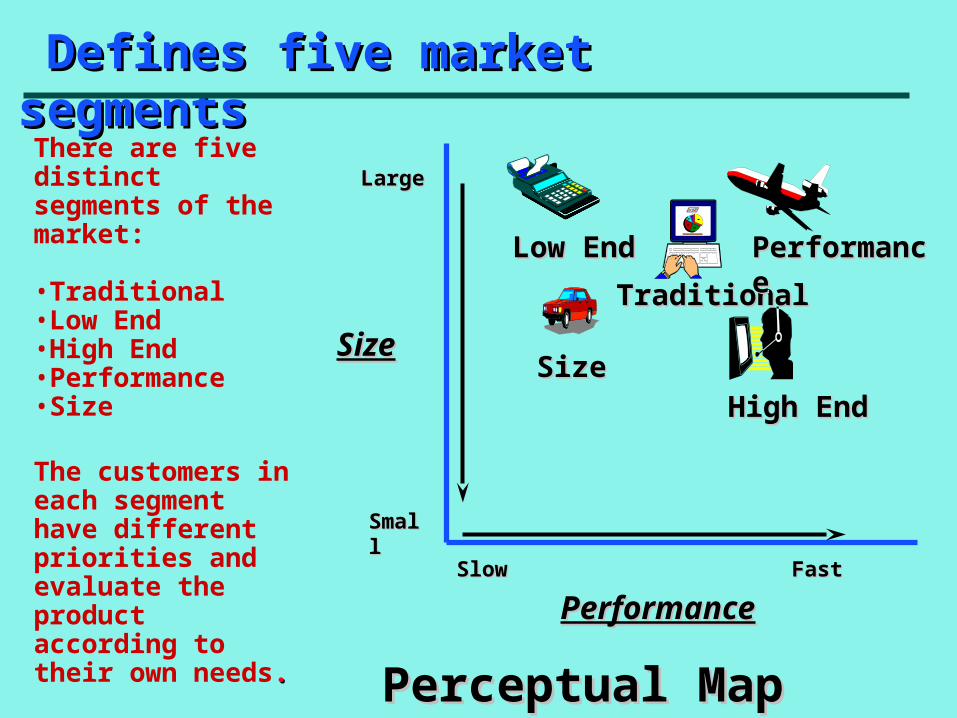
Defines five market segmentsDefines five market segments
Low End Low End
Traditional Traditional
Size Size
High End High End
Performance Performance
There are five distinct segments of the market:
•Traditional•Low End•High End•Performance•Size
The customers in each segment have different priorities and evaluate the product according to their own needs..

Perceptual MapPerceptual Map
LargeLarge
SmallSmall
SlowSlow FastFast
SizeSize
PerformancePerformance
Segments Differentiated By NameSegments Differentiated By Name
LowLow
TradTrad
SizeSize HighHigh
PfmnPfmn For example, Low End Segment customers look for large, slow sensors, representing nearly obsolete technology. Their primary concern is price.
While High End Segment customers want the latest & greatest technology. They’re willing to pay more to get very small, high performance sensors.
Perceptual MapPerceptual Map
LargeLarge
SmallSmall
SlowSlow FastFast
SizeSize
PerformancePerformance
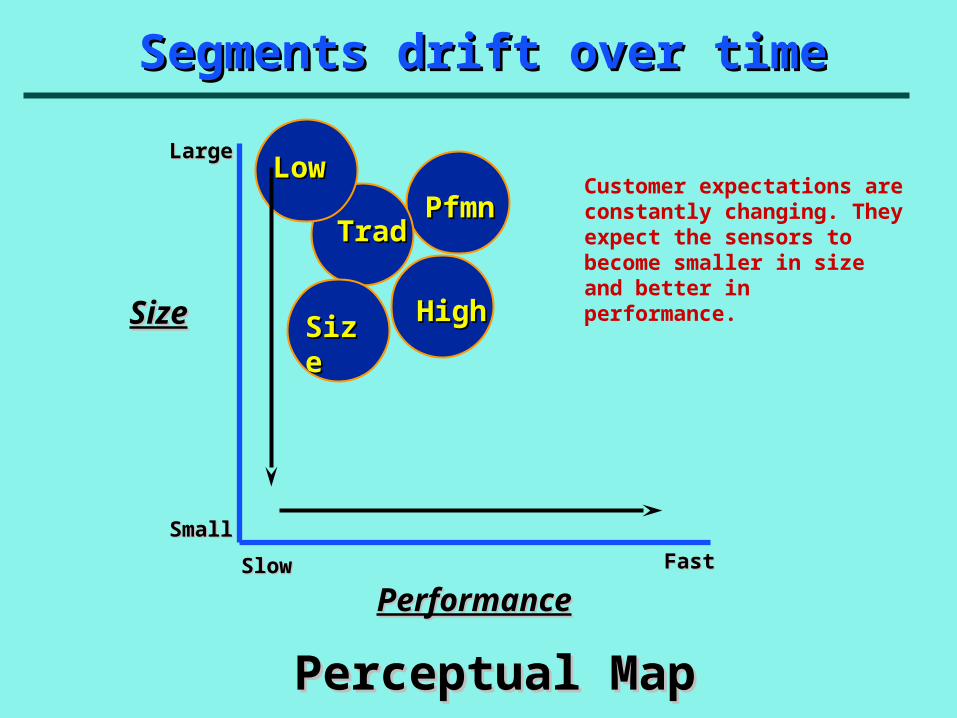
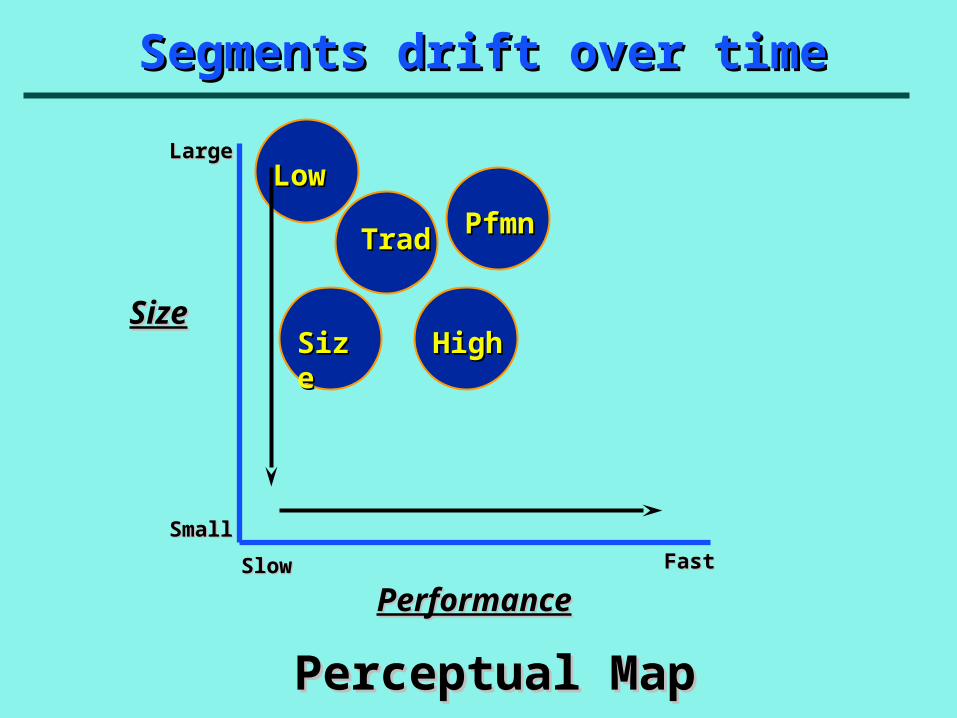
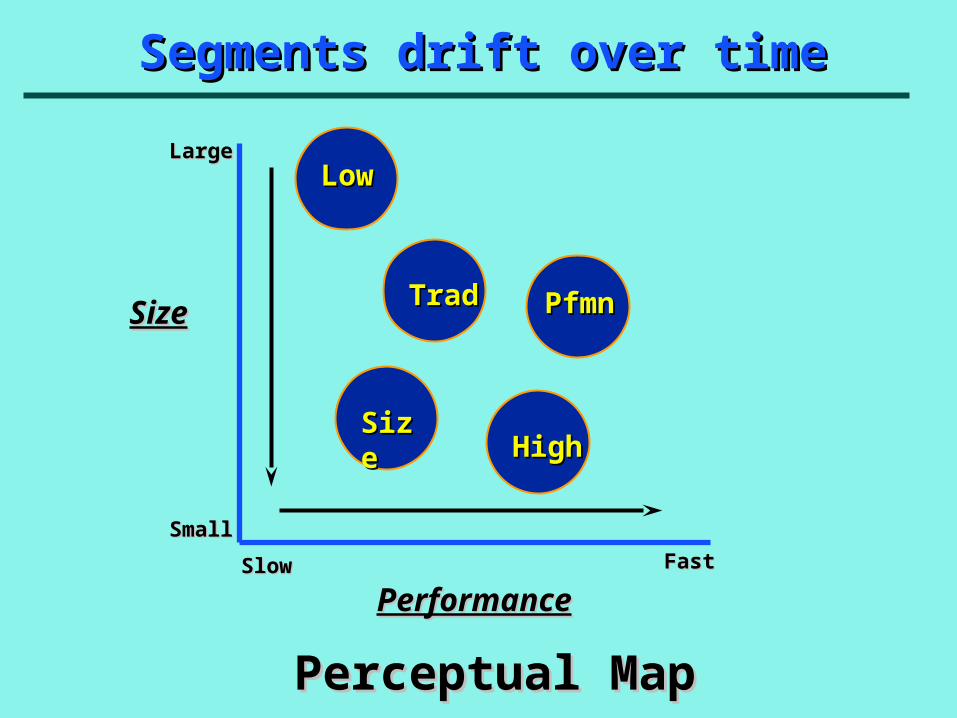
Segments drift over timeSegments drift over time
Low Low
TradTrad
Size Size High High
PfmnPfmnCustomer expectations are constantly changing. They expect the sensors to become smaller in size and better in performance.
Perceptual MapPerceptual Map
LargeLarge
SmallSmall
SlowSlow FastFast
SizeSize
PerformancePerformance
Low Low
TradTrad
Size Size High High
PfmnPfmn
Segments drift over timeSegments drift over time
Perceptual MapPerceptual Map
LargeLarge
SmallSmall
SlowSlow FastFast
SizeSize
PerformancePerformance
Low Low
TradTrad
Size Size High High
PfmnPfmn
Segments drift over timeSegments drift over time
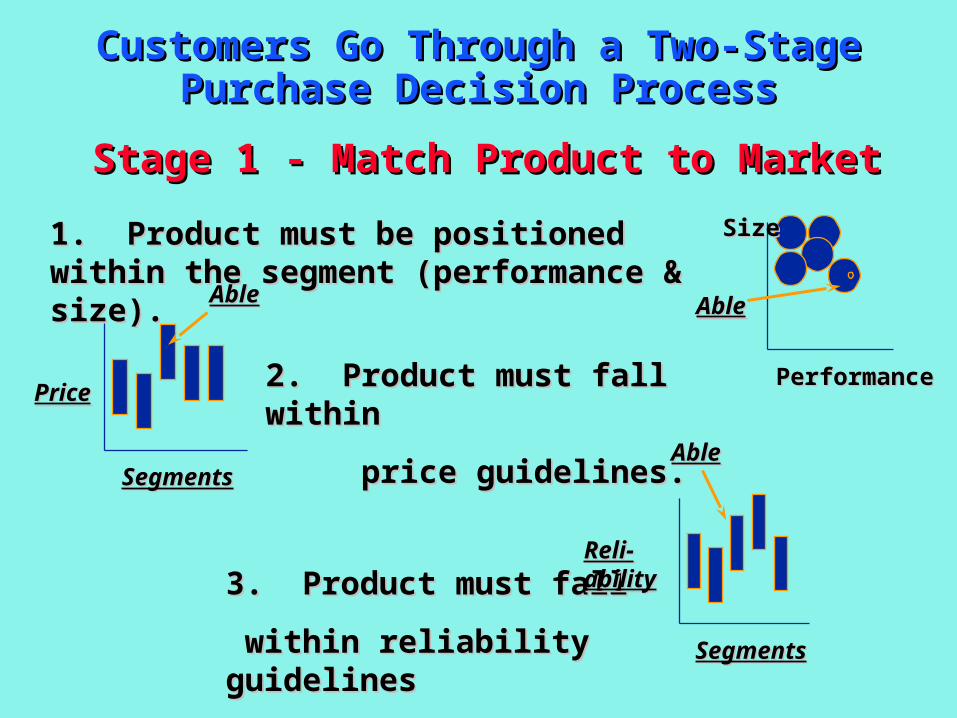
Customers Go Through a Two-Stage Purchase Customers Go Through a Two-Stage Purchase Decision ProcessDecision Process
Stage 1 - Match Product to MarketStage 1 - Match Product to Market
1. Product must be positioned within the 1. Product must be positioned within the segment (performance & size).segment (performance & size).
AbleAble
SizeSize
PerformancePerformance2. Product must fall within 2. Product must fall within
price guidelines.price guidelines.
AbleAble
PricePrice
SegmentsSegments
3. Product must fall3. Product must fall
within reliability guidelineswithin reliability guidelines
AbleAble
Reli-Reli-abilityability
SegmentsSegments
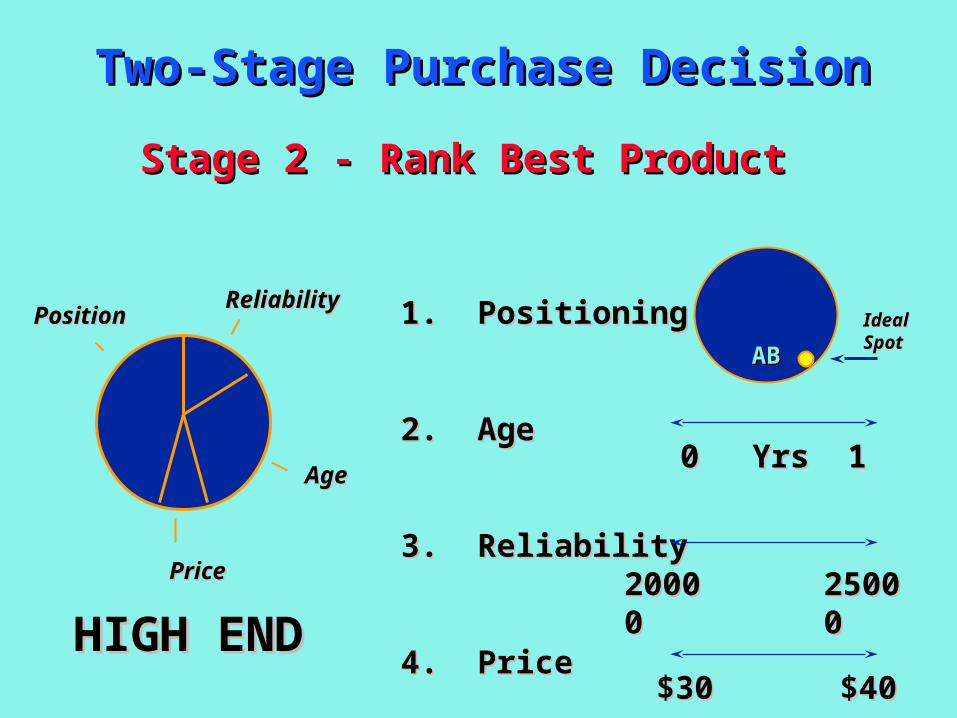
Two-Stage Purchase DecisionTwo-Stage Purchase Decision
Stage 2 - Rank Best Product Stage 2 - Rank Best Product
PositionPosition
AgeAge
ReliabilityReliability
PricePrice
1. Positioning1. Positioning
2. Age2. Age
3. Reliability3. Reliability
4. Price4. Price
Ideal Ideal SpotSpot
ABAB
00 11YrsYrs
2000020000 2500025000
$30$30 $40$40
HIGH ENDHIGH END
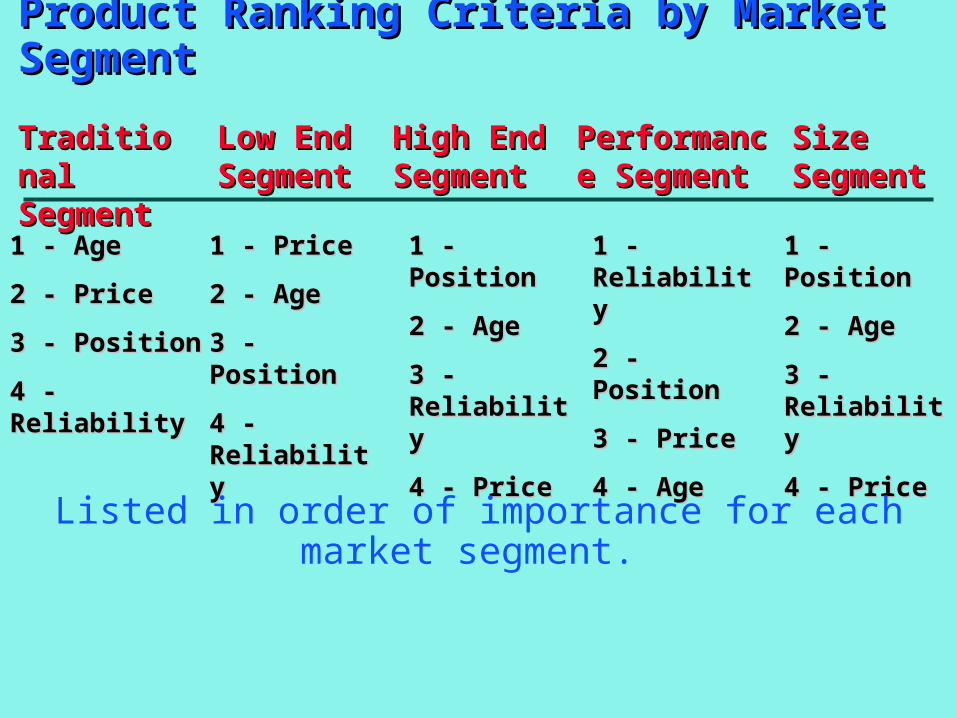
Product Ranking Criteria by Market SegmentProduct Ranking Criteria by Market Segment
TraditionalTraditionalSegmentSegment
Size Size SegmentSegment
Performance Performance SegmentSegment
High End High End SegmentSegment
Low EndLow EndSegmentSegment
1 - Age1 - Age
2 - Price2 - Price
3 - Position3 - Position
4 -Reliability4 -Reliability
1 - Price1 - Price
2 - Age2 - Age
3 - Position3 - Position
4 - Reliability4 - Reliability
1 - Position1 - Position
2 - Age2 - Age
3 - Reliability3 - Reliability
4 - Price4 - Price
1 - Reliability1 - Reliability
2 - Position2 - Position
3 - Price3 - Price
4 - Age4 - Age
1 - Position1 - Position
2 - Age2 - Age
3 - Reliability3 - Reliability
4 - Price4 - Price
Listed in order of importance for each market segment.
Decision Screens Info in Team Member GuidesDecision Screens Info in Team Member Guides
R&D R&D – Pg. 10-11– Pg. 10-11R&D R&D – Pg. 10-11– Pg. 10-11
Marketing Marketing – Pg. 11-13– Pg. 11-13Marketing Marketing – Pg. 11-13– Pg. 11-13
Production Production – Pg. 13-14– Pg. 13-14Production Production – Pg. 13-14– Pg. 13-14
Finance – Finance – Pg. 15-17Pg. 15-17Finance – Finance – Pg. 15-17Pg. 15-17
Research & DevelopmentResearch & Development
• Establish the specification of the products to meet customer demand – Plan ahead for product position in future years!
• R&D can take anywhere from 3 months to 3 years. They cost $100,000 per month.
• Build the quality and reliability (MTBF) into the products
• Sometimes a long project needs to be two shorter projects.
• Ensure the perceived age of the product meets customer demands
• Create new products to meet the changing marketplace
““Our productsOur productsare not wellare not well
positioned inpositioned inthe marketplace.”the marketplace.”
Marketing Marketing • Set the price of our products in the
marketplace
• Build customer awareness through promotion – Do they know about the product? (Promotion & Sales Budgets, pgs. 12-13)
• Establish a sales force and distribution channels – Is the product accessible?
• Set Credit Policies AR/AP
• Set the sales forecast for our products
• SALES FORCASTING IS A KEY ELEMENT TO COMPANY SUCCESS! (See pgs. 13 & 22)
• Set the price of our products in the marketplace
• Build customer awareness through promotion – Do they know about the product? (Promotion & Sales Budgets, pgs. 12-13)
• Establish a sales force and distribution channels – Is the product accessible?
• Set Credit Policies AR/AP
• Set the sales forecast for our products
• SALES FORCASTING IS A KEY ELEMENT TO COMPANY SUCCESS! (See pgs. 13 & 22)
““Our productsOur productsare not pricedare not priced
optimally.optimally.
And many of ourAnd many of ourcustomers don’tcustomers don’teven know oureven know our
product exists.”product exists.”

• Think about the long-term, and consider market growth early on.
• AUTOMATION: Purchase machinery to automate our facilities
• CAPACITY: Buy or sell capacity of product lines
• Think about products stuck in R&D - They are not being produced
• Maximize your fixed assets
• Consider TQM Initiatives
• Think about the long-term, and consider market growth early on.
• AUTOMATION: Purchase machinery to automate our facilities
• CAPACITY: Buy or sell capacity of product lines
• Think about products stuck in R&D - They are not being produced
• Maximize your fixed assets
• Consider TQM Initiatives
ProductionProduction
““We are payingWe are payingtoo much fortoo much forlabor costs.labor costs.
Very soon weVery soon wewill run outwill run out
of capacity toof capacity tomeet demand.”meet demand.”
• Acquire capital to fund capital expansions– Short Term Debt – A/P, inventory expansion,
more lax A/R policy– Issue Stock – Use for funding long-term
investments (capacity, automation)– Issue Long Term Bonds – Use for funding long-
term investments (capacity, automation)
• Issue dividend to our shareholders (They do not respond to dividends greater than EPS)
• Balance our debt portfolio - debt & equity
• Manage our proformas – Financial information measures your success, always track ratios (Also used for success measures, understand these are optimistic estimates)
• AVOID EMERGENCY LOANS AT ALL COST! THEY USUALLY OCCUR DUE TO BAD SALES FORECASTING
FinanceFinance
““We have poorWe have poorcash flow andcash flow andsubstandardsubstandard
financial ratios.financial ratios.
We have noWe have nofinancial policyfinancial policy
statement.”statement.”

Other ModulesOther Modules
Labor NegotiationsLabor Negotiations
TQMTQM
Human ResourcesHuman Resources
Decision MakingDecision Making•Each firm begins with identical profile.
•Decisions are made January 1st each year.
•Tactical plan should align with chosen success measurements (Profit, Stock Price, ROE, ROS, ROA, Asset Turnover, Market Share, Market Capitalization).
•Responsibilities may be divided up by Product Manager, Functional Manager, or Market Segment Manager roles/also Intelligence Officer & Record Keeper.
•Every member of the firm is able to create and upload decisions - communication and teamwork is vital!
Simulation Vs. Real World DifferencesSimulation Vs. Real World Differences•Finite time span to re-coop investments.
•Segment growth rate & demand given for each year.
•Demand grows for most years of the simulation.
•Domestic market only.
•Price ceilings given as part of simulation structure, no sales once the ceiling is passed.
•Customer preferences are homogeneous and given within all segments.

RecommendationsRecommendations•Build a spreadsheet to calculate industry demand for each year & sweet spot location over the course of the simulation.
•Build & offer a new product in Practice Round 1, it serves as good practice.
•Divide responsibilities among your group members, but meet as a group to enter & make final decisions.
•Don’t wait until the last minute to make decisions.
•Develop a consistent strategy and stick with it.
•Focus on both internal strategies and behaviors of competitors, avoid tunnel vision.