SimulatingSurface RunoffVolume SouthernLouisianawith...
18
Pertanika J. Sci. & Techno!. 2(1): 15-32 (1994) ISSN: 0128-7680 © Universiti Pertanian Malaysia Press Simulating Surface Runoff Volume in Southern Louisiana with DRAINMOD 1 Abdul Razak Saleh School of Information Technology Universiti Utam Malaysia Sintok, 06010Jitm, Kedah Darulaman, Malaysia. Received 19January 1993 ABSTRAK Model simulasi pengurusan air, DRAINMOD, telah digunakan untuk membuat simulasi air lari dari petak yang mempunyai saliran bawah tanah dan petak yang tidak mempunyai saliran bawah tanah. Data yang telah dikumpulkan selama tujuh tahun (1981-87) digunakan dalam kajian ini. Anggaran jumlah air lari yang dicadangkan oleh model adalah melebihi sebanyak 7.7% bagi petak yang mempunyai saliran bawah tanah dan 25.1 % bagi petak yang tidak mempunyai saliran bawah tanah berbanding dengan jumlah air lari sebenaryang direkodkan. Secara umumnya, model berupaya untuk menganggar jumlah air lari di selatan Louisiana. ABSTRACT The water management simulation model, DRAINMOD, was used to simulate surface runoff volume from a subsurface-drained plot and a non-subsurface- drained plot in southern Louisiana. Seven years (1981-87) of recorded data were used in this study. The model overestimated the total surface runoff volume by 7.7% and 25.1 % from the subsurface-drained plot and the non-subsurface- drained plot, respectively. In general, the performance of the model in simulating surface runoff volume in southern Louisiana is satisfactory. Keywords: DRAINMOD model, watershed simulation, surface runoff simulation INTRODUCTION The purpose of this paper is to evaluate the applicability of the water manage- ment model, DRAINMOD, for flat agricultural field in southern Louisiana. DRAINMOD was developed at North Carolina State University, USA, for shallow water-table soils (Skaggs 1978). The model was developed for design and evaluation of multi-component water management systems which could include facilities for surface drainage, subsurface drainage, subirrigation and sprinkler irrigation (Skaggs 1978). The model is a computer simulation program which predicts, on an hour-by-hour, day-by-day basis, the water-table position, soil-water content, evapotranspiration, drainage, and surface runoff for given climatological data, soil and crop properties, and water managemen t 1 The experimental work was carried out at Louisiana State University, USA.
Transcript of SimulatingSurface RunoffVolume SouthernLouisianawith...

Pertanika J. Sci. & Techno!. 2(1): 15-32 (1994)ISSN: 0128-7680
© Universiti Pertanian Malaysia Press
Simulating Surface Runoff Volume inSouthern Louisiana with DRAINMOD1
Abdul Razak SalehSchool ofInformation Technology
Universiti Utam Malaysia
Sintok, 06010Jitm, Kedah Darulaman, Malaysia.
Received 19January 1993
ABSTRAK
Model simulasi pengurusan air, DRAINMOD, telah digunakan untuk membuatsimulasi air lari dari petak yang mempunyai saliran bawah tanah dan petakyang tidak mempunyai saliran bawah tanah. Data yang telah dikumpulkan selamatujuh tahun (1981-87) digunakan dalam kajian ini. Anggaran jumlah air lariyang dicadangkan oleh model adalah melebihi sebanyak 7.7% bagi petak yangmempunyai saliran bawah tanah dan 25.1 % bagi petak yang tidak mempunyaisaliran bawah tanah berbanding denganjumlah air lari sebenaryang direkodkan.Secara umumnya, model berupaya untuk menganggar jumlah air lari di selatanLouisiana.
ABSTRACT
The water management simulation model, DRAINMOD, was used to simulatesurface runoff volume from a subsurface-drained plot and a non-subsurfacedrained plot in southern Louisiana. Seven years (1981-87) of recorded datawere used in this study. The model overestimated the total surface runoffvolumeby 7.7% and 25.1 % from the subsurface-drained plot and the non-subsurfacedrained plot, respectively. In general, the performance of the model in simulatingsurface runoff volume in southern Louisiana is satisfactory.
Keywords: DRAINMOD model, watershed simulation, surface runoff simulation
INTRODUCTION
The purpose of this paper is to evaluate the applicability of the water management model, DRAINMOD, for flat agricultural field in southern Louisiana.DRAINMOD was developed at North Carolina State University, USA, forshallow water-table soils (Skaggs 1978). The model was developed for designand evaluation of multi-component water management systems which couldinclude facilities for surface drainage, subsurface drainage, subirrigation andsprinkler irrigation (Skaggs 1978). The model is a computer simulationprogram which predicts, on an hour-by-hour, day-by-day basis, the water-tableposition, soil-water content, evapotranspiration, drainage, and surface runofffor given climatological data, soil and crop properties, and water management
1 The experimental work was carried out at Louisiana State University, USA.

Abdul Razak Saleh
system design parameters. The model is well documented by Skaggs (1978,1980a and 1980b). Also, several reports of validation studies for the modelusing field data from different regions of USA have been reported by Skaggs(1977, 1980b and 1982), Skaggs et al. (1981), Gayle et al. (1985 and 1987), andRogers et al. (1985).
MODEL DESCRIPTIONThe model is based on a water balance for a thin section ofsoil ofunit surfacearea which extends from the impermeable layer to the surface and is locatedmidway between adjacent drains (Fig. 1). The water balance for a timeincrement of i1t may be expressed as
wherei1VaDDSETF
i1Va = D + ET + DS - F
the change in air volume (cm) in the section,drainage (em) from the section,deep seepage (em),evapotranspiration (em), andinfiltration (em) entering the section.
Rainfall (ET)
llllllllllill IIIII11I1Il:?epressi~nstorage (S) =:> Runoff (RO)
(1 )
Soil surface
b
Fig. 1. Schematic drawing of the water management system for subsurface drains thatmay be used for drainage or subirrigation (After Skaggs 1980)
The amount of runoff and storage on the surface is computed froma water balance at the soil surface for each time increment which maybe written as
16
P = F + i1S + RO
Pertanika J. Sci. & Techno\. Yo\. 2. o. I, 1994
(2)

wherePFSRO=
Simulating Surface Runoff Volume in Southern Louisiana with DRAINMOD
precipitation (em),infiltration (em),change in volume ofwater stored on the surface (em), andrunoff (em).
The model is composed of a number of separate components whichevaluate the various mechanisms of soil water movement and storage. Themajor components used in the model are: precipitation, infiltration, surfacedrainage, subsurface drainage, subirrigation, evapotranspiration, soil waterdistribution, and rooting depth. This paper provides a brief descriptionof each of these components; however, for details one needs to refers tothe DRAINMOD reference manual (Skaggs 1980a).
PrecipitationPrecipitation records are one of the major inputs to the DRAINMOD model.Hourly rainfall records are used in the model to increase accuracy of predictions for infiltration, runoff, and surface storage.
InfiltrationInfiltration is described as the movement of water through the soil surfaceinto the soil profile under the influence of gravity and capillarity. It isaffected by soil factors such as hydraulic conductivity, initial water content,surface compaction, depth of profile, water table depth, plant factors suchas extent of cover and depth of root zone, and rainfall factors such asintensity, duration, and time distribution. The model uses the Green andAmpt equation to characterize infiltration as
in whichAB
K * M * S ands d av
Ks
f=A/F + B (3)
wherefFKM:S
av
infiltration rate (em/h),accumulative infiltration (em),hydraulic conductivity (em/h),the difference between final and initial volumetric water contents(cm3/cm3), andeffective suction at the wetting fron t (em).
Surface DrainageSurface drainage is characterized by the average depth of depression storagethat must be filled before runoff can begin. When the surface storage depth
Pertanika J. Sci. & Techno!. Va!. 2. No. I, 1994l7

Abdul Razak Saleh
as determined by equation 2 exceeds this value the additional excess isallotted to surface runoff.
Subsurface DrainageThe rate of subsurface water movement into drain tubes or ditches dependson the hydraulic conductivity of the soil, drain spacing and depth, effectivedrain radius, profile depth and water table elevation. The DRAINMOD modeluses either Hooghoudt's or Kirkham's equation in calculating the flux,depending on whether the water table is at the surface and whether water isponding or not. When the water table is below the surface, DRAINMOD usesHooghoudt's steady state equation,
q = (8*K*de*m + 4*K*m2)/U (4)
whereq flux in cm/h,m midpoint of water table height above the drain (em),K the equivalent lateral hydraulic conductivity (em/h),de the equivalent depth from the drains to the impermeable layer
(em), andL the distance between drains (em).
When the water table completely inundates the surface with ponded waterthe Hooghoudt equation for predicting drainage flux is inadequate as itassumes a curved (elliptical) water table completely below the soil surfaceexcept at the midpointwhere itmaybe coincidentwith the surface. Therefore,at inundation the drainage flux is calculated using an equation derived byKirkham (1957),
ftan (n(2b-r)/4h~ 2~G =2 In + .LJ
tan (nr/4h) m=l fcosh (nm L/2h) + cos (nr/2h)
Incosh (nm L/2h) - cos (nr/2h)
cosh (nm L/2h) - cos (n(2d - r)/2h)]
cosh (nm L/2h) + cos (n(2d - r)/2h)(5)
whereK
e
ht
dr
18
equivalent lateral hydraulic conductivity (em/h),actual depth of the profile (em),depth of the water on the surface (em),the actual depth from the drain to the impermeable layer (em),radius of drainage tube,
Pertanika J. Sci. & Techno!. Vo!. 2. N0. I, 1994
Simulating Surface Runoff Volume in Southern Louisiana with DRAINMOD
b the depth from the surface to the drain (cm), andL the drain spacing (cm).
EvapotranspirationThe term evapotranspiration is used to describe the total process of watertransfer into the atmosphere from vegetated land surfaces. Potentialevapotranspiration is the evaporation from the extended surface of a shortgreen crop which fully shades the ground, exerts little or negligible resistanceto the flow of water, and is always well supplied with water (Rosenberg et al.1983).
Potential evapotranspiration depends on climatological factors whichinclude net radiation, temperature, humidity and wind velocity.Evapotranspiration can be estimated by using several methods such asThornthwaite, Blaney-Criddle, Jensen-Haise, Penman, and Van Bavel. Themethod selected for use in the model was the method developed byThornthwaite (1948),
PET = 1.6 (10T/I)a (6)
wherePET=T1
a
total monthly potential evapotranspiration (cm),the mean temperature of the month of measurement (DC),heat index derived from the sum of 12 monthly index value, i(T/5) 1.514, and6.75 X 1O-7P - 7.71 X 10-512 + 1.79 X 10⁻²¹ + 0.49
PREVIOUS RESEARCH ON DRAINMOD
Skaggs et al. (1981) evaluated the DRAINMOD model for North Central Ohioconditions by comparing predicted with measured drainage volumes for fieldplots with surface drainage alone, subsurface drainage alone and for combination plots with both surface and subsurface drainage. They found that predicted surface runoff and subsurface drainage volumes were in good agreement with measured values for all three drainage treatments.
Skaggs (1982) tested the performance of the DRAINMOD model forpredicting water table elevations in North Carolina. He found that predictedand measured water table elevations were in satisfactory agreement withstandard errors of estimate of the daily water table depths ranging from7.5 to 19.6 cm. Based on the results of the study he concluded that theDRAINMOD model can be used to predict the effect of drainage systemdesign on water table elevations.
Fouss et al. (1987) used the DRAINMOD model to simulate the subsurfacedrainage on a 4.4 ha watershed in the Lower Mississippi Valley. Predictedrunoff, subsurface drain flow, and water table depth fluctuation comparedclosely with field observed values during a year when frequent rainfall events
Pertanika J. Sci. & Techno!. Vol. 2. No.1, 1994 19

Abdul Razak Saleh
caused the water table to rise into the root zone (within 30 cm of the soilsurface).
Rogers et al. (1985) evaluated the DRAINMOD model for the sandy soilconditions of South Central Florida by comparing predicted with measureddrain outflows and water table elevations for 1oyears ofrecords. The model wasmodified to improve drain outflow. With the improved drain outflow prediction, annual and monthly evapotranspiration values were satisfactorily predicted.
Sanoja et al. (1990) used four years offield data to test the performance ofthe DRAINMOD model to predict the daily tile flows and water table elevationsfor Nicollet silt loam and Kenyon loam soils oflowa. Theyfound that predictedwater-table depths and tile flow rates were in agreement with the measuredvalues for all four years. The average deviation and standard error for thecomparison of predicted and measured water-table depths rangedfrom 8.40 to 18.61 cm and 10.14 to 21.65 cm, respectively.
MATERIALS AND METHODS
Experimental Site DescriptionThe Ben Hur research farm is located 5.5 kIn south of Louisiana StateUniversity, Baton Rouge, Louisiana. The farm is operated jointly by theLouisiana State University Agricultural Center and the United StatesDepartment ofAgriculture. The soil, a Commerce clay loam, fine silty, mixed,non-acid, thermic aeric fluvaqent, has a saturated hydraulic conductivityof approximately 1 mm/h just below the plough depth and increases onlyslightly to a depth of about 0.6 m. Between 0.6 and 1.3 m depth thereis a layer of approximately 0.3 m thickness with a saturated hydraulicconductivity of up to 80 mm/h (Rogers et al. 1985). More informationabout this soil may be obtained in Camp (1976) and Dance et al. (1968).
The field was installed in 1977 and partitioned into 4 plots (Fig. 2). Twoplots (Plot E and Plot G) were 200 m long and 60 m wide. Plot E was surfacedrained and contained subsurface drainage tubing (104 mm diameter) 1mdeep, spaced 20 m apart, and installed on a grade of 0.1 %. Plot Gwas surfacedrained only. Earth dikes at least 0.3 m high were constructed around the plotsto define the plot boundaries and to ensure that runoff passed through an Hflume where it could be measured and sampled (Bengtson et al. 1985). Theplots were not replicated. Rainfall was measured with a weighing-type recording rain gauge. Surface runoffwas measured with an H-flume and FW-l waterstage recorder.
Silage com was grown using conventional tillage, a sequence of discand harrow, and planting up and down the slope in April. The plots werefertilized with 217, 38, and 76 kg/ha/year of nitrogen, phosphorus andpotassium, respectively. Nitrogen was applied at 109 kg/ha at planting (discedin) and 108 kg/ha (side-dressed) 3 to 4 weeks after emergence. The comwas cultivated once each year in May for weed control, and was harvestedfor silage in July. The field was fallow the remainder of the year.
20 Pertanika J. Sci. & Techno!. Vo!. 2. No.1, 1994

Simulating Surface Runoff Volume in Southern Louisiana with DRAINMOD
Drainage Ditch
200mr 30m r Drainag_e Ditch
Plot D t (Subsurface-drained)
t t60 m
IPlot E (Subsurface-drained)
IPlot F (Surface-drained)
t 30m J60m Plot G (Surface-drained)
I IJ
Fig. 2. Plan of Ben HUT -research farm plots
Experimental ProceduresThe DRAINMOD model was used to simulate the surface runoff volumefrom the subsurface-drained plot and the non-subsurface-drained plot. Sevenyears (from 1981 to 1987) of observed data were used to evaluate theperformance of the model.
The model was evaluated by three methods. First, linear regression analysiswas used to determine the closeness of observed and simulated values. Thedata were fitted to a simple linear regression model with the simulateddata as the dependent variable and the observed data as the independentvariable. The correlation coefficient, slope, and interceptwere used to evaluatethe capability of the model.
Secondly, a t-test was done on the intercept and slope of the relationshipobtained from regression analysis between the observed and simulated data.The closer the slope of the regression line to unity, the better the modelpredicted the observed data. All statistical tests were carried out for a significance level of 0.05.
Thirdly, standard deviation of differences (STDD), absolute averagedifference (ADIF) and percentage error (PE) were computed comparingobserved and predicted data. The following equations were used:
STDDL (obs - pred)2
n
(7)
ADIFL lobs - pred I
n(8)
PE ( pred - obs ) x 100obs
(9)
Pertanika J. Sci. & Techno!. Vo!. 2. No. I. 1994 21

whereobspredn
Abdul Razak Saleh
observed value,simulated value, andnumber of observations.
The standard deviation ofdifferences is a measure of the dispersion of thesimulated data from the observed data and is expressed in the units of theobserved data (Chang et al. 1983). The absolute difference is simply theabsolute difference between the obseIVed and the simulated data averagedover the number of observations. The percentage error is a measure of thedifference between the observed and simulated data relative to the observeddata, and is expressed as a percentage.
MODEL INPUT PARAMETERS
This section will provide a briefdescription of the various sections ofthe inputdata. Measured data were made available by Dr. Richard Bengtson of theAgricultural Engineering Department and Dr. James Fouss of the USDA-ARS,Louisiana State University, USA.
InputtotheDRAlNMODmodelcan be divided into two groups, input dataand input parameters. The input data are of two types, climatological and cropdata. The input parameters can be divided into soil properties and drainagesystem parameters.
Climatological DataPrecipitation and daily maximum and mInImUm air temperature wererecorded at the experimental site. Precipitation was recorded in a breakpointformat. However, the model requires that the precipitation is entered inhourly values. Rainfall was recorded in hundredths of inches which theprogram converts to centimetres before using. The monthly and annualrainfall data values are shown in Table 1. The 28-year average annual rainfallfor the Ben Hur research farm is 146 ± 29 cm (Fouss et al. 1987). Dailymaximum and minimum air temperatures are used by the model to estimatepotential evapotranspiration by the Thornthwaite method.
Crop DataThe crop data required by the model include the effective root depth asa function of time and the growing season. It is used in the model todefine the zone from which water can be removed as necessary to supplyevapotranspiration demands. The rooting depth function is read as a tableof effective rooting depth versus Julian date. The rooting depth for daysother than those listed in the table is obtained by interpolation. The rootingdepth used in this study is shown in Table 2.
22 Pertanika J. Sci. & Techno!. Va!. 2. No. 1,1994

Simulating Surface Runoff Volume in Southern Louisiana with DRAINMOD
TABLE 1Monthly and annual rainfall, Ben Hur research farm, Louisiana
Monthly rainfall (em) for yearsMonth 1981 1982 1983 1984 1985 1986 1987
Jan 2.51 8.89 11.07 8.28 12.09 4.29 20.07Feb 20.65 14.07 13.39 16.29 11.66 13.69 19.84Mar 5.72 7.14 11.30 3.99 11.91 6.32 13.00Apr 2.82 12.34 21.69 3.56 11.94 5.97 2.49May 11.18 4.29 17.91 11.10 6.63 7.57 17.07
Jun 22.00 9.75 24.43 9.53 8.23 14.33 31.75
Jul 15.72 3.58 8.28 5.61 7.02 12.78 12.27Aug 5.87 17.93 28.09 12.73 14.81 10.36 27.36Sep 8.15 8.20 15.21 9.04 21.54 4.04 3.61Oct 4.22 10.24 2.69 21.95 22.23 10.06 2.36Nov 4.34 9.78 11.81 5.56 3.02 31.01 11.18Dec 13.77 36.25 15.11 8.43 11.33 15.04 6.27G.S.* 57.59 47.89 100.40 42.53 48.63 51.01 90.94
Total 116.94 142.47 181.00 116.05 142.40 135.46 167.26
*C.S. = growing season from April 1 to August 31 (for corn silage erop)
Note: 28-year average: C.S. 68 ± 17 emannual 146 ±29 em
TABLE 2Effective rooting depth (em) as a function of time for corn
(after Skaggs et al. 1981)
Month Day Rootdepth
1 1 3.03 31 3.04 18 10.05 1 15.05 5 25.06 4 30.07 2 30.09 11 30.09 21 10.0
10 19 3.012 31 3.0
Soil PropertiesThe soil properties consist of: soil water characteristics, drained volume as thefunction ofwater-table depth, upward flux, hydraulic conductivity, and infiltration. The soil water characteristics are shown in Table 3. Both the drainedvolume versus water table depth and also the steady upward flux versus water
Pertanika J. Sci. & Techno!. Vol. 2. No.1, 1994 23

Abdul Razak: Saleh
table depth are given in Table 4. The saturated hydraulic conductivity andparameters for the Green-Arnpt infiltration equation are shown in Table 5 andTable 6, respectively.
TABLE 3Soil-water characteristics (Commerce clay loam soil)
Pressure head(em)
-0-10-20-30-40-50-60-70-80
-100-120-160-200-500
Water content(cm3/cm3)
0.4580.4520.4400.4310.4220.4120.4020.3970.3920.3810.3740.3590.3520.324
24
TABLE 4Drained volume and steady-state upward flux vs. water table depth
(Commerce clay loam soil)
Water table Drained Steady-statedepth volume upward flux(em) (em) (em/h)
0 0.00 1.00010 0.10 0.26420 0.39 0.07230 0.65 0.03040 0.90 0.01950 1.10 0.01260 1.40 0.00870 1.80 0.00680 2.20 0.004
100 3.00 0.000120 4.50 0.000160 8.00 0.000200 12.20 0.000500 50.00 0.000
Pertanika J. Sci. & Techno!. Vo!. 2. No.1, 1994

Simulating Surface Runoff Volume in Southern Louisiana with DRAINMOD
TABLE 5Saturated hydraulic conductivity vs. soil depth
(Commerce clay loam soil)
Depth in soil(em)
0.0 to 50.050.0 to 120.0120.0 to 141.5
Sat. hydro condo (K)(em/h)
1.24.00.1
TABLE 6Parameters for the Green-Ampt infiltration equation for
various water table depths at the start of rainfall(Commerce clay loam soil)
Initial depth A Bof water table (A=K,MSa) (B=K,)
(em) (cm2/h) (em/h)
0 0.0 0.430 0.4 0.460 0.8 0.4
120 1.12 0.4150 1.76 0.4500 1.76 0.4500 1.76 0.4
Drainage System ParametersInput data required to describe the design of the drainage system are summarized in Table 7. These data are used in combination with soil property data tocompute surface runoff, drainage flow, evapotranspiration, water table depth,etc., in the drainage system simulation process.
For details on inputdata, one needs to refer to chapter4oftheDRAINMODreference manual (Skaggs 1978).
SIMULATION RESULTS AND DISCUSSION
Subsurface-drained PlotThe annual values of observed and simulated surface runoff volume areshown in Table 8. The model simulated accurately the total surface runofffor the years 1981 and 1987, overestimated the total surface runoff forthe years 1982, 1983, 1986, and underestimated for the years 1984 and1985.
Pertanika J. Sci. & Techno\. Vo\. 2. No. I, 1994 25

Abdul Razak: Saleh
TABLE 7Summary of drainage system input parameters,
Ben Hur research farm, Louisiana
Parameter Variable name Value
Drain spacingDrain depthEquivalent depth to impermeable layerEquivalent profile depthMaximum depth of surface storageDrain radiusEffective drain radius
SDRAINDDRAINHDRAINDEPTHSTMAX
****
2000,9144 cm *lOOcm41,48 cm *141,148 cm*0.25 cmlOcm0.5cm
* for subsurface-drained plot and non-subsurface-drained plot, respectively.** these variables are not inputs to DRAINMOD but are used to calculate HDRAIN.
TABLE 8Observed and simulated annual surface runoff of
subsurface-<irained plot
Year
1981198219831984198519861987
Total
Observed(cm)
19.1724.7046.6314.9833.7028.8942.26
210.33
Simulated(cm)
19.3734.8753.0813.2232.3930.2643.34
226.53
%Error
1.041.213.8
-11.8-3.94.72.5
7.7
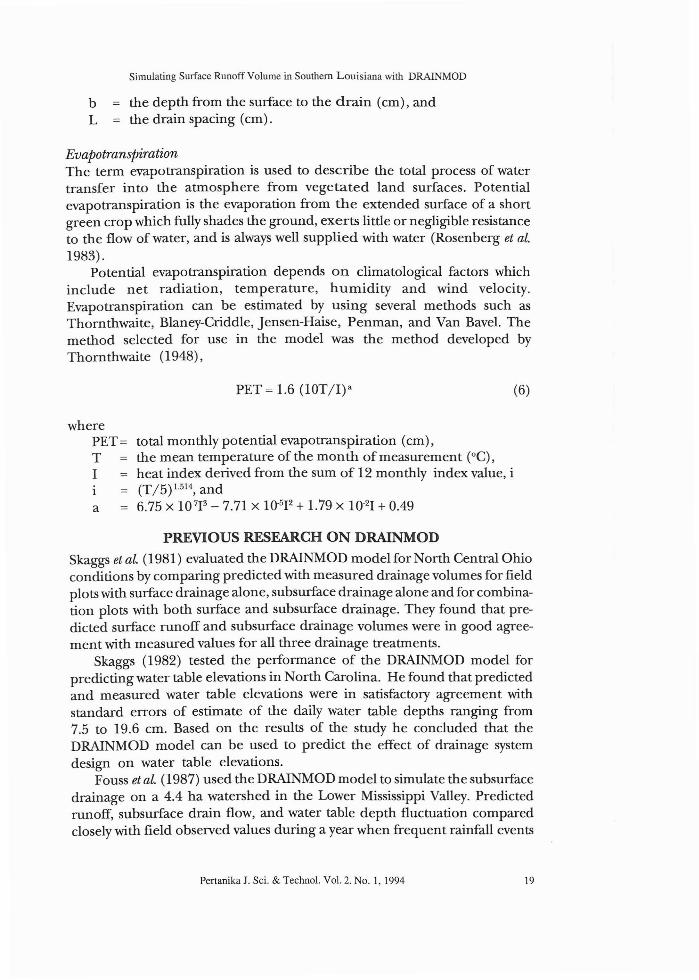
The obsenred and simulated surface runoff volumes accumulated bymonths for the 7-year period are shown in Fig. 3. Over the first 23 monthsof the study the accumulated simulated values were very close to the obsenredvalues (Fig. 3). The overestimation of the surface runoff prediction wasdue to several reasons. The growing season in 1982 was drier than normal.The model overpredicted the surface runoff volume due to underpredictingthe evapotranspiration. During this period the crop usually has a longerroot system to search for water at deeper depths. It was also reported thatin 1982 Johnson grass was predominant after the corn silage was hanrested.In December 1982 the model overestimated the surface runoff volume by33.2%. The amount of the rainfall recorded for this plot in that monthwas 36.25 cm, 139% higher than the average December rainfall of 15.17em. It was the highest recorded monthly rainfall for the 7-year period.
26 Pertanika J. Sci. & Techno!. Va!. 2. No. I, 1994
Simulating Surface Runoff Volume in Southern Louisiana with DRAIN MOD
- Observed monthly surtace n..moH (em)• - - - Simulated monthlysurtace runoff (em)
200
1150
~
j
*~ 100
il«
50
a "-------'-_~___L_--'-_''___'__~__'_....J
o 10 20 30 40 50 60 70 80Months over 1981-87 period
Fig. 3. Observed and simulated surface runoff volume accumulated by
months ofsubsurface-drained plot
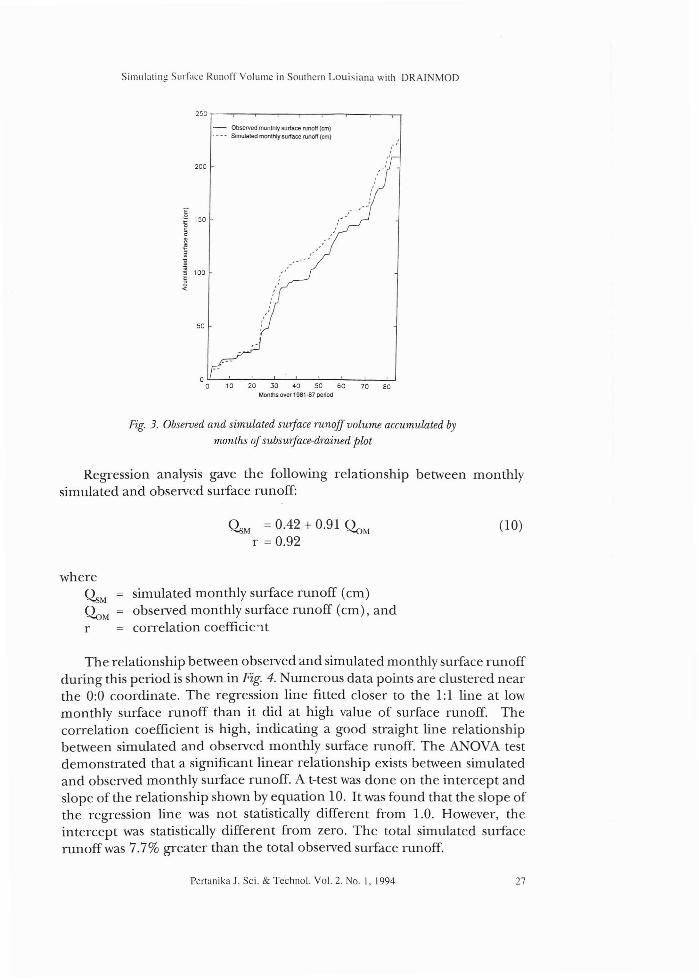
Regression analysis gave the following relationship between monthlysimulated and observed surface runoff:
~M = 0.42 + 0.91 <2oMr = 0.92
where~M simulated monthly surface runoff (em)<2oM observed monthly surface runoff (em), andr correlation coefficie'1t
(10)
The relationship between observed and simulated monthly surface runoffduring this period is shown in Fig. 4. Numerous data points are clustered nearthe 0:0 coordinate. The regression line fitted closer to the 1:1 line at lowmonthly surface runoff than it did at high value of surface runoff. Thecorrelation coefficient is high, indicating a good straight line relationshipbetween simulated and observed monthly surface runoff. The ANOVA testdemonstrated that a significant linear relationship exists between simulatedand observed monthly surface runoff. A t-test was done on the intercept andslope of the relationship shown by equation 10. It was found that the slope ofthe regression line was not statistically different from 1.0. However, theintercept was statistically different from zero. The total simulated surfacerunoff was 7.7% greater than the total observed surface runoff.
Pertanika J. Sci. & Techno!' Vo!. 2. No. I, 1994 27

Abdul Ruzak Saleh
25 r---.-----.-----,-----.--~
- QSl.l =O.42+0.9~ Q our =0.92
20- QS/ll =QO&ol
o
a
00
00 0
a>00 0
000o ,
000
,"000
o
255 10 15 20Observed monthlv surface runoff (eml
oi!P=----'-----'----------'------'----.1o
Fig. 4. Relationship between simulated and observed monthly sU1facerunoff ojsubsU1face-dmined plot
Non-subsurjace-drained PlotThe annual values ofobserved and simulated surface runoffvolume are shownin Table 9. The model overestimated the total surface runofffor all years. Theobserved and simulated surface runoff volume accumulated by months isshown in Fig. 5. As in subsurface-drained plot, the model seriously overestimated the surface runoff in December, 1982.
TABLE 9Observed and simulated annual surface runoff of
non-subsurface-drained plot
Year Observed Simulated %Error(cm) (cm)
1981 25.79 34.74 34.71982 36.82 55.55 50.91983 77.80 90.72 16.61984 20.81 35.96 72.81985 45.72 55.42 21.21986 46.96 49.93 6.31987 67.46 79.82 18.3
Total 321.36 402.14 25.1
2H Pertunika J. Sci. & Techno\. Va\. 2. No. I. 1994

Silllulating Surface Runoff Volullle in Southern Louisiana with DRAIN MOD
450
400
350
~300
g2 250
i~
1il 200
"~§'" leo
100
50
a0
Observed surface runoffSimulated surtace runotl
20 40 60 80Months over 1981-87 period
Fig. 5. Observed and simulated surface runoff volume accumulated bymonths ofnon-subsurjace-drained plot
Regression analysis gave the following relationship between monthlysimulated and observed surface runoff:
r0.31 + 1.07 ~M0.67
(11)
The relationship between observed and simulated annual surface runoffis shown in Fig. 6. The ANOVA test demonstrated that a significant linearrelationship existed between simulated and observed monthly surface runoff.The slope of the regression line was not statistically different from 1.0.However, the intercept was statistically different from zero. The total simulated surface runoffwas 25.1 % greater than the total observed surface runoff.
The standard deviation ofdifferences (STDD), which measure the dispersion of the predicted data from the observed data, and the absolute averagedifferences (ADIF) between the observed and simulated data were computedfor the model simulations of both plots and are presented in Table 10. Thevalues for the subsurface-drained plotare smaller then those obtained from thenon-subsurface-drained plot.
Pertanika J. Sci. & Techno!. Vo!. 2. No.1, 1994 29

Abdul Razak Saleh
_ NSIo' =0.31 + 1.07 N""r =0.67
JO
25
- N$toI =Nc:.I
'<>o 0o
10 15 20 25 30 J5
Observed monthly surface runoff (em)
Fig. 6. Relationship between simulated and observed monthly surfacerunoffofnon-subsurface-drained plot.
TABLE 10Error statistics computed to evaluate DRAINMOD-CREAMS
model predictions on surface runoff
Statistics Surface Runoff (cm)
Subsurface Non-Subsurface
1.540.96
2.561.73
1 Standard deviation of differences.2 Absolute average difference between the observed and the simulated data.
CONCLUSIONThe DRAlNMOD model overestimated the surface runoff volume by 7.7%and 25.1 % from the subsurface-drained plot and the non-subsurface-drainedplot, respectively. The standard deviation of differences and average absolutedifference comparing the observed and simulated values are smaller in thesubsurface-drained plot. The DRAl MOD model predicted the surface runoffmore accurately in the subsurface-drained plot than the non-subsurfacedrained plot. Both predictions were subject to potential errors in predictingevapotranspiration. In general, the performance of the DRAlNMOD modelin simulating the surface runoff in southern Louisiana is satisfactory.
30 Pertanika J. Sci. & Techno\. Yo\. 2. No. I. 1994

Simulating Surface Runoff Volume in Southern Louisiana with DRAINMOD
Recommendations for Future ResearchThe DRAINMOD model should be modified to accept several sets of rootingdepths depending on the amount of rainfall during the growing season.This model modification could improve the prediction of the smface runoffvolume during dry seasons, because removal of water from the soil profilewould be increased by simulated evaporation of the deeper-rooted plants.
ACKNOWLEDGEMENTSThe authorappreciates the assistance ofProfessorDr. Richard L. Bengtson andAdjunct Professor Dr.James L. Fouss ofAgricultural EngineeringDepartment,USA for their help and advice, and thanks Louisiana State University forprovidingfacilities and services throughout the course ofthis study. Thanks arealso due to Universiti Utara Malaysia for granting study leave and for providingfamily support.
REFERENCESBENGTSON, R.L. and C.E. CARTER. 1985. Simulating soil erosion in the lower Mississippi
valley with the CREAMS model. ASAE Paper No. 85-2040.
BINGNER, RL., C.E. MuRPHYand C.K. MUTCHLER. 1989. Comparison ofsedimentyield modelson watersheds in Mississippi. Trans. ASAE 32(2): 529-534.
CAMP, C.R. 1976. Determination of hydraulic conductivity for a Louisiana alluvial soil.Proceedings of the Third National Drainage Symposium, ASAE, St. Joseph, MI.pp. 104-108.
CHANG, A.C., RW. SKAGGS, L.F. HERMSMEIER and W.R JOHNSTON. 1983. Evaluation of a watermanagement model for irrigated agriculture. Trans. ASAE 26(2): 412-418.
DANCE, R.E., BJ. GRIFFIS, B.B. Nurr, A.G. WHITE, SA LITLE andJ.E. SEAHOLM. 1968. Soil surveyof East Baton Rouge Parish, LA. USDA-8CS.
FOSTER, G.R., L.D. MEYER and CA. ONSTAD. 1977. A runoff erosivity factor and variable slopelength exponents for soil loss estimates. Trans. ASAE 20(4): 683-687.
Fouss,].L., R.L. BENGTSON and C.E. CARTER. 1987. Simulating subsurface drainage in theLower Mississippi Valley with DRAlNMOD. Trans. ASAE 30(6): 1679-1688.
GAYLE, GA., RW. SKAGGS and C.E. CARTER. 1985. Evaluation ofa water management modelfor a Louisiana sugarcane field. Amer. Soc. Sugar Cane Tech. 4: 18-28.
GAYLE, GA., RW. SKAGGS and C.E. CARTER. 1987. Effects of excessive soil-water conditionson sugarcane yields. Trans. ASAE 30(4): 993--997.
KIRKHAM, D. 1957. Theory ofland drainage. In Drainage ofAgricultural Lands, AgronomyMonograph No.7. Wisconsin: American Society ofAgronomy.
PARSON,].E. andRW. SKAGGS. 1988. Waterquality modelingwith DRAlNMOD and CREAMS.ASAE paper no. 88-2569, St. Joseph, MI: American Society ofAgricultural Engineers.
Pertanika J. Sci. & TechnoL VoL 2. No.1, 1994 31

Abdul Razak Saleh
ROGERS,j.S., V. McDANIEL and C.£. CARTER. 1985. Determination of saturated hydraulicconductivity ofa Commerce silt loam soiL Trans. ASAE 28(4): 1141-1144.
ROSENBERG, NJ., B.L. BLAD andS.B. VERMA. 1983. Microclimate, theBiologicalEnvironment. NewYork: Wiley.
SANOJA,j., RS. KANwARand S.W. MELVIN. 1990. Comparison ofsimulated (DRAINMOD) andmeasured tile outflow and water table elevations from two field sites in Iowa. Trans.ASAE 33(3): 827-833.
SKAGGS, R.W. 1977. Evaluation of drainage-water table control systems using a watermanagement model. In Third National Drainage Symposium Proceedings, ASAE Pub. 1-77,pp.61-68.
SKAGGS, RW. 1978. A water management model for shallow water table soils. ReportNo. 134,Water Resources Research Institute of the University of North Carolina,Raleigh.
SKAGGS, RW. 1980a. DRAINMOD-reference report; Methods for design and evaluation ofdrainage-water management systems for soils with high water tables. Fort Worth, Tx.:USDA-SCS, South National Technical Center.
SKAGGS, R.W. 1980b. A water management model for artificially drained soils. Tech. Bull.267, Water Resources Research Institute of the University ofNorth Carolina, Raleigh.
SKAGGS, RW. 1982. Field evaluation of a water management model. Trans. ASAE 25(3):666-674.
SKAGGS, RW., N.R FAUSEY and B.B. NOLTE. 1981. Water management model evaluation forNorth Central Ohio. Trans. ASAE 24(4): 922-928.
THORNTHWAITE, C.W. 1948. An approach toward a rational classification ofclimate. Geog. Rev.38: 55-94.
32 Pertanika J. Sci. & Techno!. Vo!. 2. No.1, 1994