Simulating Tax Reform in MEXICO PREM 2011 Knowledge and Learning Forum April 25, 2011.
40
Simulating Tax Reform in MEXICO PREM 2011 Knowledge and Learning Forum April 25, 2011
-
date post
22-Dec-2015 -
Category
Documents
-
view
214 -
download
0
Transcript of Simulating Tax Reform in MEXICO PREM 2011 Knowledge and Learning Forum April 25, 2011.

Simulating Tax Reform in MEXICO
PREM 2011Knowledge and Learning Forum
April 25, 2011
Program
1. Background
2. The 2010 fiscal reform in MEXICO
3. Challenges of micro-simulating distributional impacts in MEXICO
4. Main results
5. Further activities
Background 2010 Reform Tax model Results NextBackground
In December 2009, the World Bank approved a US$ 1,504 million DPL to MEXICO
The DPL aimed at supporting Economic Policies in Response to the Global Crisis
The policy matrix had four policy areas: Fiscal policy, Financial access, Labor markets and Trade integration.
The fiscal policy area addressed the 2010 budget proposal from the Secretaría de Hacienda y Crédito Público (SHCP).
Particularly, the DPL objective was to support the implementation of fiscal policies during 2009 while adopting measures to enhance medium-term fiscal sustainability for 2010 and beyond.

Background 2010 Reform Tax model Results NextBackground
After approval, the board requested a PSIA of the fiscal area, given the importance of the reform that the SHCP was proposing and its potentially important distributional consequences.
This request meant an opportunity for addressing current challenges in the study of distributional impact of fiscal policies in developing countries in general and in Mexico in particular.
In this regard, this PSIA report may serve several purposes:- study the distributional impact of the Mexican fiscal reform;- address some of the technical challenges for this type of studies in developing countries;- promote institutional building in Mexico - promote further analysis on the distributive impact of fiscal policies in developing countries

Background 2010 Reform Tax model Results NextBackground
Given the multi-purpose of the task, several units engage in the project in order to address different parts of the project.
LCSPP & PRMPR units
PSIA Trust Fund
LCSPE, PRMPR
MEXICAN NGOs
CIEP
Academic center
Institute for Fiscal Studies
MEXICAN GOV:
SHCP, CONEVAL
World Bank
funding
Design and coordination
Local knowledge
and dissemination
Implementation, Counterpart
Review
Research and Development

Background 2010 Reform Tax model Results Next
People involved in the project:
Samuel Freije-Rodríguez (senior economist, LCSPP)
José Antonio Cuesta (senior economist, PRMPR)
Joost Draaizma (senior country economist, LCSPE)
Héctor Villareal (Centro de Investigación Económica y Presupuestaria, Mexico City)
David Phillips (researcher, Institute for Fiscal Studies, London) Laura Abramovsky (researcher, Institute for Fiscal Studies, London)
Orazio Attanasio (senior researcher, Institute for Fiscal Studies, London)
Background

Background 2010 Reform Tax model Results Next
In 2009 the Mexican government debt to gross domestic product (GDP) ratio stood at 35.6%, while the government deficit was 2.32% of GDP.
Although these figures are low relative to the position of most developed countries, they hide a substantial imbalance: government revenues from general taxation account for only 9.5% of GDP, while expenditure stands at 26.1% of GDP
The difference between these figures is mainly covered by oil revenues, which therefore play an important role in guaranteeing the long-term solvency of the Mexican government.
However, given the volatility of oil prices and the fact that proven reserves of Mexican oil are expected to last less than 10 years, there is an urgent need to consolidate government finances, both in terms of expenditure and in terms of revenue
In 2009, in response to the short-run reduction in fiscal revenues, the Mexican government approved a modest fiscal tightening starting in 2010 (from now on referred to as the 2010 tax reforms).
The reform approved by Mexican Congress differs in several aspects from the reform proposal submitted by the Executive.
2010 tax reform

Background 2010 Reform Tax model Results Next
Item Status-quo 2010 tax reform proposed by the Executive power
2010 tax reform approved by the Congress and
implemented1. Income tax: both personal and corporate (Impuesto sobre la Renta – ISR).
Top three marginal rates are 19.94%, 21.95% and 28%.
-Top three marginal rates increase to 21.36%, 23.52% and 30% in 2010, 2011, 2012, with a phased reduction to 28% in 2014. -Individuals earning up to 4 minimum wages are not affected. -The annual upper threshold of income band 3 (lower threshold of income band 4) decreases from 88,793.04 $ (mex) to 79,964.16.
-Top three marginal rates increase to 21.36%, 23.52% and 30% in 2010, 2011, 2012, with a phased reduction to 28% in 2014. -Individuals earning up to 6 minimum wages are not affected.
2. VAT (Impuesto al Valor Agregado - IVA)
General rate of 15%, and 10% in border areas
-- General rate of 16%, and 11% in border areas
3. Excise duties (Impuesto especial sobre la producción y servicios – IEPS)
3.a. Tobacco 160% rate Additional flat-rate of 0.04 for each cigarette or 0.75 grams of snuff; to be increased to 0.10 by 2014.
Additional flat-rate of 0.04 for each cigarette or 0.75 grams of snuff; to be increased to 0.10 by 2014.
3.b. Beer 25% rate 28% rate 26.5% rate (temporary)
3.c. Lottery 20% rate 30% rate 30% rate
3.d. Drinks with alcohol content greater than 20% by volume
50% rate Additional minimum charge per litre of 3 pesos 53% rate
3.e. Telecommunications None 4% rate 3% rate, except for Internet connexions
4. New expenditure tax (Contribucion para el Combate a la Pobreza)
-- Introduction of a 2% expenditure tax on all goods and services (with the exception of the purchase of government licenses and donations to charity)
Rejected
5. Tax on cash deposits 2% rate of balance 3% rate of balance 3% rate of balance
2010 tax reform

Background 2010 Reform Tax model Results Next2010 tax reform
The objective of the study is to answer the following questions:
1. What is the distributive impact of the fiscal reform approved by the Mexican Government?
2. What is the distributive impact of the fiscal reform approved by the Mexican Congress in comparison with the original proposal submitted by the Executive?
Other objectives of the task are:
3. Address some methodological challenges in the micro-simulation of distributive impact of fiscal policies in developing countries
4. Promote and enhance the discussion of distributive aspects of fiscal policies within the Mexican society
Background 2010 Reform Tax model Results NextTax model
In these micro-simulations of tax policy for MEXICO we address the following analytical challenges:
1. Datasets from surveys are severely constrained by misreporting of income sources while administrative data from tax collection agencies are not currently available
2. Behavioural responses to taxes on 1. Tax incidence (Pass-through)2. Labor supply (extensive and intensive margins)3. Consumption demand
Each of this topics is addressed through MEXTAX
Background 2010 Reform Tax model Results Next
The MEXTAX simulator is a flexible simulator, which has been designed by IFS researchers to be a public tool for analyses of future tax reforms. The MEXTAX simulator:
• Builds on previous efforts to assess the distributional impact of these reforms by CEFP (2009) and Absalón and Urzúa (2009) that have used the same data source.
• Uses the 2008 ENIGH as the source of micro-data.
• Is written in STATA code and is designed so that users do not need to edit the main simulation code but can instead make changes to an interface module (which defines input and output files and whether to run behavioral response modules) and system parameters modules (which define the basic structure and rates of the baseline and reform tax systems).
Tax model
Background 2010 Reform Tax model Results Next
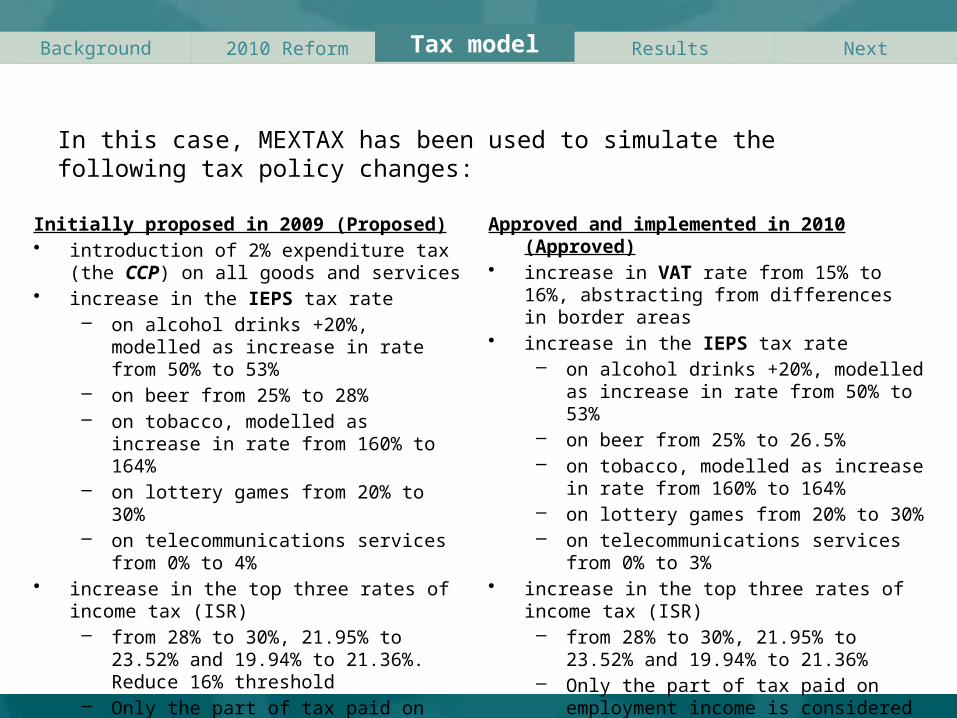
Initially proposed in 2009 (Proposed)• introduction of 2% expenditure tax (the CCP)
on all goods and services • increase in the IEPS tax rate
– on alcohol drinks +20%, modelled as increase in rate from 50% to 53%
– on beer from 25% to 28%– on tobacco, modelled as increase in rate
from 160% to 164% – on lottery games from 20% to 30%– on telecommunications services from 0%
to 4%• increase in the top three rates of income tax
(ISR) – from 28% to 30%, 21.95% to 23.52% and
19.94% to 21.36%. Reduce 16% threshold
– Only the part of tax paid on employment income is considered
Approved and implemented in 2010 (Approved)• increase in VAT rate from 15% to 16%,
abstracting from differences in border areas• increase in the IEPS tax rate
– on alcohol drinks +20%, modelled as increase in rate from 50% to 53%
– on beer from 25% to 26.5%– on tobacco, modelled as increase in rate
from 160% to 164% – on lottery games from 20% to 30%– on telecommunications services from 0%
to 3%• increase in the top three rates of income tax
(ISR) – from 28% to 30%, 21.95% to 23.52% and
19.94% to 21.36%– Only the part of tax paid on employment
income is considered
Tax model
In this case, MEXTAX has been used to simulate the following tax policy changes:

Background 2010 Reform Tax model Results Next
•By deciles of income distribution vs deciles of expenditure distribution
Baseline
•9 simulations based on different assumptions about under-reported and omitted incomes
Misreported incomes /
expenditures
•3 simulations based on different assumptions about pass-through, labor supply elasticities and system of demand equations
Behavioral response
We classify the main results of this exercise as follows:
Results

Background 2010 Reform Tax model Results Next
Poorest 2 3 4 5 6 7 8 9
Richest
-2.00%
-1.50%
-1.00%
-0.50%
0.00%
Income Tax IVA (uniform CCP) IEPS
Income decile group
Ga
in/lo
ss
(%
of
ne
t to
tal i
nc
om
e)
BASELINE: Relative incidence due to proposed reforms across the income distribution; by type of tax
Results

Background 2010 Reform Tax model Results Next
BASELINE: Relative incidence due to proposed reforms across the income distribution; TOTAL
Results

Background 2010 Reform Tax model Results Next
Poorest 2 3 4 5 6 7 8 9
Richest
-2.00%
-1.50%
-1.00%
-0.50%
0.00%
0.50%
Income Tax IVA IEPS
Income decile group
Ga
in/lo
ss
(%
of
ne
t to
tal i
nc
om
e)
BASELINE: Relative incidence due to approved reforms across the income distribution; by type of tax
Results

Background 2010 Reform Tax model Results Next
BASELINE: Relative incidence due to approved reforms across the income distribution; TOTAL
Results

Background 2010 Reform Tax model Results Next
Poorest 2 3 4 5 6 7 8 9
Richest
-2.00%
-1.50%
-1.00%
-0.50%
0.00%
0.50%
1.00%
1.50%
2.00%
Proposed Approved (Approved)-(Proposed)
Income decile group
Ga
in/lo
ss
(%
of
ne
t to
tal i
nc
om
e)
BASELINE: Comparison of Relative incidence between proposed and approved reforms across the income distribution; totals
Results

Background 2010 Reform Tax model Results Next
Poorest 2 3 4 5 6 7 8 9
Richest
-2.00%
-1.50%
-1.00%
-0.50%
0.00%
0.50%
Income Tax IVA IEPS
Expenditure decile group
Ga
in/lo
ss
(%
of
tota
l ex
pe
nd
itu
re)
BASELINE: Relative incidence due to proposed reforms across the expenditure distribution; by type of tax
Results

Background 2010 Reform Tax model Results NextResults
BASELINE: Relative incidence due to proposed reforms across the expenditure distribution; total

Background 2010 Reform Tax model Results NextResults
BASELINE: Relative incidence due to approved reforms across the expenditure distribution; by type of tax

Background 2010 Reform Tax model Results Next
Poorest 2 3 4 5 6 7 8 9
Richest
-2.00%
-1.50%
-1.00%
-0.50%
0.00%
0.50%
1.00%
1.50%
Proposed Approved (Approved)-(Proposed)
Expenditure decile group
Ga
in/lo
ss
(%
of
tota
l ex
pe
nd
itu
re)
Results
BASELINE: Comparison of Relative incidence between proposed and approved reforms across the expenditure distribution; totals

Background 2010 Reform Tax model Results Next
Reform MEXTAX Estimate CEFP Estimate (based on National Accounts)
Proposed
ISR 8,470 72,990
IVA 38,000 74,520
IEPS 4,210 18,930
Total 50,680 166,440
Approved
ISR 5,990 62,780
IVA 10,800 33,550
IEPS 3,190 13,810
Total 19,980 110,140
Estimated revenue changes from reforms Annual Revenue ($ millions Mex)
Results
Background 2010 Reform Tax model Results Next
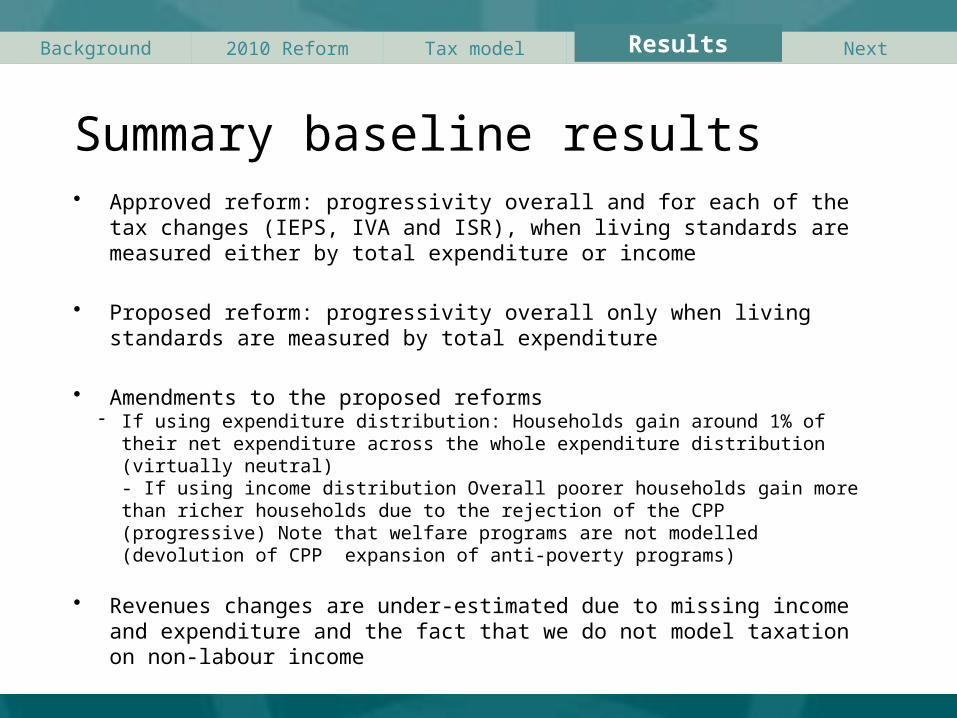
• Approved reform: progressivity overall and for each of the tax changes (IEPS, IVA and ISR), when living standards are measured either by total expenditure or income
• Proposed reform: progressivity overall only when living standards are measured by total expenditure
• Amendments to the proposed reforms- If using expenditure distribution: Households gain around 1% of their net expenditure
across the whole expenditure distribution (virtually neutral)- If using income distribution Overall poorer households gain more than richer households due to the rejection of the CPP (progressive) Note that welfare programs are not modelled (devolution of CPP expansion of anti-poverty programs)
• Revenues changes are under-estimated due to missing income and expenditure and the fact that we do not model taxation on non-labour income
Summary baseline results
Results

Background 2010 Reform Tax model Results Next
The results from estimated revenues highlight the seriousness of income misreporting in the Mexican income/expenditure survey.
Nine different sensitivity analysis are included in the study to address this problem:
• Expansion factors a la Altimir by source of income and by type of expenditure• Scaling expansion factors by income level• Regression based techniques to identify and allocate omitted incomes
Results from simulations vary according to assumptions:• More or less regressive depending on how serious misreporting is assumed to be
at the top of the distribution• Simulated tax collections gets closer to actual collections

Background 2010 Reform Tax model Results Next

Background 2010 Reform Tax model Results Next
Most micro-simulations stop short at including behavior which may be misleading, specially in countries with large informal sectors (like Mexico).
To ascertain the importance of this factor, three types of sensitivity analysis are included to address this problem in the study :
• Different “pass-through” rates with absorption by either labor or capital
• Simulation of changes in labor supply through estimates of participation tax rate (PTR) and Marginal Effective Tax Rate (METR) as well as benchmarks of extensive and intensive margin elasticities (from developed countries literature)
• Estimation of QUAIDS system of demand equations
Results show that including behavior renders tax collection estimates between 7% and 22% lower than baseline

Background 2010 Reform Tax model Results Next
This project has several spin-offs :
• Dissemination seminars to discuss findings, methods and future research
• Further engagement with Mexican counterparts
• Interest in additional projects and technical assistance for new counterparts
Next

Background 2010 Reform Tax model Results NextNext
Two disseminations seminars are already scheduled:
• Dissemination seminar in Mexico City (May 19th, 2011) with audience from Academic, Non-governmental and Governmental institutions
(A half-day seminar with presentations from IFS scholars and Mexican academics on micro-simulation of fiscal policies in Mexico)
• Dissemination seminar in Washington, D.C. (June 10)(Orazio Attanasio and David Phillips will be presenting the details of MEXTAX
and the agenda of further research on distributional aspects of fiscal policies in developing countries)

Background 2010 Reform Tax model Results Next
Further engagement with Mexican counterparts:
After a presentation of preliminary findings of this study to representatives of the Secretaría de Hacienda y Crédito Público, Mexican counterparts have expressed interest in:
• A training seminar for SHCP staff
• Further developments of the tool with improvements in top-earners data.
Next
Background 2010 Reform Tax model Results Next
This project sparks new interest on distributional impact of fiscal policies in several areas:
• There are requests for building similar models in other countries (e.g., Central American countries, the Philippines)
• Better micro-modeling in developing countries requires further research efforts in two critical areas: data collection and labor market modeling.
Next

Background 2010 Reform Tax model Results NextNext
Regarding better data...
This study has tested the sensitivity of results to different assumptions about missing income and expenditure. The lesson we draw is the need for better micro-data:
• Improving coverage of high income households• Sampling weights adjusted by comparing with administrative data
• Link survey data to administrative data• Publish tabular data (e.g. number of taxpayers by income band) as a
minimum
• Otherwise microsimulation models of only limited value• Particularly for revenues• Altimir factors not appealing for non-proportional taxes

Background 2010 Reform Tax model Results NextNext
Regarding labor markets...
We highlight several areas of research in the field of labor supply that we think should be priorities and suggest ways in which this research may be pursued:
• Developing the taxable income elasticity approach• Non-separabilities between leisure and consumption• Given elasticity of supply, more inelastic demand
means consumers bear more of the tax• How is the part not borne by consumers distributed
across workers and firm-owners?