Simulating for Better Performance of Cosira Manufacturing
76
Simulating for Better Performance of Cosira Manufacturing PJ van Ginkel – 22106503 FINAL REPORT Simulating for Better Performance of Cosira Manufacturing Using Simulation Modelling to Improve Manufacturing System and Flow PJ van Ginkel - 22106503 9/5/2012
Transcript of Simulating for Better Performance of Cosira Manufacturing

Simulating for Better Performance of Cosira Manufacturing
PJ van Ginkel – 22106503
FINAL REPORT
Simulating for Better Performance of Cosira
Manufacturing Using Simulation Modelling to Improve
Manufacturing System and Flow
PJ van Ginkel - 22106503
9/5/2012

Simulating for Better Performance of Cosira Manufacturing
PJ van Ginkel - 22106503
Page | i
ACKNOWLEDGEMENTS
This project would not have realised without the support and advice of a few key people.
Special thanks must go out to the following people for their part played in this report:
Prof Paul Kruger, for his role as project leader
Mr Mandla Matshiane (Lab Assistant), for assisting with the Arena Simulation
Licence
Mr Paul da Silva (COO of Cosira), for allowing me full access to Cosira and its
information
Mr Nico Beukes (Planning Manager at Cosira), for assisting in the collection of
information
Nadine van Ginkel (Author’s Wife), for always understanding and supporting.

Simulating for Better Performance of Cosira Manufacturing
PJ van Ginkel - 22106503
Page | ii
ABSTRACT
Since the economic downturn in 2009 Cosira International found that the order winning
criteria came down to supply price. The order qualifying criteria became reliable delivery and
quick response times.
This project will look at the Cosira Vulcan manufacturing plant and its operation. This
workshop will be optimised though computer simulation in order to streamline the
manufacturing process and thus increasing the potential profitability of the manufacturing
division.

Simulating for Better Performance of Cosira Manufacturing
PJ van Ginkel – 22106503
TABLE OF CONTENTS
Acknowledgements .................................................................................................................................. i
Abstract ................................................................................................................................................... ii
Introduction.............................................................................................................................................. 1
Background of Cosira International ..................................................................................................... 1
Project Aim .............................................................................................................................................. 3
Problem Statement .............................................................................................................................. 3
Project Goal ......................................................................................................................................... 4
Project Objectives ................................................................................................................................ 5
Project Approach ................................................................................................................................. 5
Literature Review .................................................................................................................................... 6
Introduction to Literature Review ......................................................................................................... 6
Project Environment: Job Shop ........................................................................................................... 6
Definition of a Job Shop ................................................................................................................... 6
Characteristics of a Job Shop .......................................................................................................... 7
Project Environment: Fabrication Shop ............................................................................................... 8
Definition of a Fabrication Shop ....................................................................................................... 8
Available Industrial Engineering Methods, Tools and Techniques...................................................... 8
Lean Manufacturing ......................................................................................................................... 8
Just-In-Time Manufacturing ............................................................................................................. 9
Line/Resource Balancing ................................................................................................................. 9
Theory of Constraints..................................................................................................................... 10
Simulation Modelling ...................................................................................................................... 12
Selection of Appropriate Industrial Engineering Methods, Tools and Techniques ............................ 12
Line/Resource Balancing ............................................................................................................... 12
Theory of Constraints..................................................................................................................... 12
Simulation Modeling ....................................................................................................................... 13
Development of Supplementary Methods, Tools and Techniques ....................................................... 13
Data and Information Gathering and Analysis ...................................................................................... 13
Material Flow ..................................................................................................................................... 13

Simulating for Better Performance of Cosira Manufacturing
PJ van Ginkel - 22106503
Page | 1
Decisions and Assumptions .............................................................................................................. 13
Decision 1 - Arena: Student or Full Version................................................................................... 13
Counter Decision - Arena: Student or Full Version ........................................................................ 14
Decision 2 – Simulating Overhead Cranes .................................................................................... 14
Decision 3 – Job Size / Complexity ............................................................................................... 14
Decision 4 – Workshop Areas to Simulate .................................................................................... 15
Decision 5 – Animating the Simulation .......................................................................................... 16
Assumption 1 – Material Supply is Perfect .................................................................................... 16
Assumption 2 – Material Handling is Effective .............................................................................. 16
Assumption 3 – Machine Breakdowns are Negligible ................................................................... 16
Assumption 4 – Absenteeism is Negligible .................................................................................... 17
Data Gathering .................................................................................................................................. 17
Production Tracking Sheets ........................................................................................................... 17
CNC Performance .......................................................................................................................... 19
Fabrication Performance ............................................................................................................... 19
Data Analysis ..................................................................................................................................... 20
CNC Machines ............................................................................................................................... 20
Fabrication ..................................................................................................................................... 23
Quality Control ............................................................................................................................... 24
Design and problem Solving ................................................................................................................. 24
Base Model ........................................................................................................................................ 24
Suprising Results ........................................................................................................................... 25
Productivity Analysis ...................................................................................................................... 25
Could it be Better ........................................................................................................................... 26
Improved Model – Line Balancing ..................................................................................................... 26
Line Balancing Model 1.................................................................................................................. 27
Line Balancing – Model 2 .............................................................................................................. 28
Improved Model – TOC ..................................................................................................................... 29
TOC – Model 1 ............................................................................................................................... 29
TOC – Model 2 ............................................................................................................................... 30

Simulating for Better Performance of Cosira Manufacturing
PJ van Ginkel - 22106503
Page | 2
Final Model – a Holistic Improvement ............................................................................................... 31
Design and Solution Evaluation ............................................................................................................ 32
Project Implemenation and Benefits ..................................................................................................... 32
Implementation .............................................................................................................................. 32
Improvement Expectation .............................................................................................................. 33
Conclusion............................................................................................................................................. 33
Bibliography .......................................................................................................................................... 34
Appendices ........................................................................................................................................... 35
Appendix 1 – Material Flow Diagram ................................................................................................ 35
Appendix 2 – CNC Update Files ....................................................................................................... 36
Appendix 3 – Cosira Vulcan Workshop Layout ................................................................................. 38
Appendix 4 – Throughput Time Reports from Simulations ............................................................... 39
Appendix 4A – Base Model Simulation .......................................................................................... 39
Appendix 4B – Line Balancing Model 1 Simulation ....................................................................... 41
Appendix 4C – Line Balancing Model 2 Simulation ....................................................................... 43
Appendix 4D – TOC Model 1 Simulation ....................................................................................... 45
Appendix 4E – TOC Model 2 Simulation ....................................................................................... 47
Appendix 4F – Final Model Simulation .......................................................................................... 49
Appendix 5 – Queues Overview Reports for Simulations ................................................................. 51
Appendix 5A – Base Model Simulation .......................................................................................... 51
Appendix 5B - Line Balancing Model 1 Simulation ........................................................................ 54
Appendix 5C - Line Balancing Model 2 Simulation ........................................................................ 57
Appendix 5D – TOC Model 1 Simulation ....................................................................................... 60
Appendix 5E – TOC Model 2 Simulation ....................................................................................... 63
Appendix 5F – Final Model Simulation .......................................................................................... 66
Simulating for Better Performance of Cosira Manufacturing
PJ van Ginkel – 22106503
TABLE OF FIGURES
Figure 1 - How the Mighty Fall (5 steps) ................................................................................................. 4
Figure 2 - Project Purpose ...................................................................................................................... 5
Figure 3 - Project Approach and Implementation ................................................................................... 6
Figure 4 - Principles of Lean ................................................................................................................... 9
Figure 5 - Unbalanced Line ................................................................................................................... 10
Figure 6 - Balanced Line ....................................................................................................................... 10
Figure 7 - Process of On-going Improvement (TOC) ............................................................................ 11
Figure 8 - Drum - Buffer - Rope System ............................................................................................... 12
Figure 9 - Material Flow of Cosira Manufacturing (See Appendix A for Larger Image) ........................ 13
Figure 10 - Cosira Work Types ............................................................................................................. 14
Figure 11 - Cosira Vulcan Workshop Layout ........................................................................................ 16
Figure 12 - Production Tracking/Planning Sheet .................................................................................. 18
Figure 13 - Time Studies Sheet ............................................................................................................ 19
Figure 14 - Individual Saw Performance Curves .................................................................................. 20
Figure 15 - CNC Plasma Machine Performance Graphs ...................................................................... 22
Figure 16 - Angle Machine Performance Graphs ................................................................................. 23
Figure 17 - VA Time for Workshop Processes ...................................................................................... 25
Figure 18 - Part of Arena Generated Report 01.................................................................................... 26
Figure 19 - Part of Arena Generated Report 02.................................................................................... 27
Figure 20 - Part of Arena Generated Report 03.................................................................................... 28
Figure 21 - Part of Arena Generated Report 04.................................................................................... 28
Figure 22 - VA Time for Workshop Processes 02................................................................................. 29
Figure 23 - VA Time for Workshop Processes 03................................................................................. 31
TABLE OF TABLES
Table 1 - Manufacturing Environment Comparison ................................................................................ 7
Table 2 - Cosira Work Type Mix ........................................................................................................... 15
Table 3 – Plate work VA Matrix ............................................................................................................. 19
Table 4 - Structural VA Matrix ............................................................................................................... 19
Table 5 - Work type fabrication times ................................................................................................... 24

Simulating for Better Performance of Cosira Manufacturing
PJ van Ginkel - 22106503
Page | 1
Table 6 - Preparation Times per Operation .......................................................................................... 30

Simulating for Better Performance of Cosira Manufacturing
PJ van Ginkel – 22106503
Page | 1
INTRODUCTION
BACKGROUND OF COSIRA INTERNATIONAL
1988: John da Silva Senior has the vision to start
a small, entrepreneurial, family-owned
business in Heriotdale, Johannesburg,
occupying just one portion of what later
became known as Cosira Shop 1. The
business starts off with only three staff
members, as a second tier supplier to larger
fabricators. Through John da Silva Senior's inspired leadership and his recognition
of the need for personalised, flexible, reliable service, the business quickly becomes
known as a reputable supplier to the steel industry in South Africa. Built on the
strong cornerstones of quality, timely delivery and correct pricing, the Cosira Group
starts to grow.
1999: This was a significant growth point for the group as it became a first tier supplier for
the Anglo Platinum Waterval 400 KTPM concentrator. This led to the award of other
key projects including Maandagshoek concentrator and the Pietersburg smelter; all
of which bear testimony to Cosira's ability to not only operate successfully at a new
level, but indeed to set the industry benchmark for project execution.
2000: Cosira enters the new millennium as an industry-leading first tier supplier to the
South African steel industry, and doubles its turnover year-on-year from 2000 to
2006.
2001: Cosira decides to change its vision from that of only being a steel fabricator to a
construction company, otherwise known as 'the construction solutions group'. This
precipitates the establishment of Cosira Developments, the retail and industrial
property construction and development project arm which later became a separate
group within the Silva Group Holdings group of companies called Moreland
Investments.
2002: Cosira sees the need to develop a fully integrated approach to structural steel
detailing and fabrication. Despite the prevailing economic slump in the industry at
the time, Cosira strikes out and invests substantially in a draughting facility with

Simulating for Better Performance of Cosira Manufacturing
PJ van Ginkel - 22106503
Page | 2
CAD/CAM technology, making it possible to own the process at all stages of the
manufacturing cycle.
Cosira handles all aspects of project management, planning, detailing, fabrication,
corrosion protection and finishing, site erection, commissioning and construction
management, thereby offering turnkey solutions at optimum efficiency.
Cosira also invests in its first CNC (Computer Numerically Controlled) equipment.
Furthermore, in 2002, Cosira acknowledges that, for the company to continue on its
successful growth path, it must offer the industry the full range of services, from
detailing and fabrication, right through to commissioning of projects. Cosira employs
key leaders and skills in site construction and thereby establishes a site
construction SMPP arm to the business.
2003: Cosira sees the need to operate as a fully South African company, and to this end
initiates negotiations with the TIH Group.
2004: In January 2004, following the conclusion of a black empowerment deal with the
TIH Group, the company became the first major black empowered structural steel
fabrication, mechanical, platework and piping construction company in South Africa.
Now officially, the 'Cosira Group', it is initially accredited by the South African Mining
Preferential Procurement Forum (SAMPPF).
The Group has one structural steel shop in operation. Over the next two years, a
further three steel shops are opened and become operational, further testimony to
Cosira's successful growth trajectory over this time period.
2005: In 2005, the Cosira Group initiates further diversification into related industries with
the establishment of Cosira IMS (Industrial and Mining Solutions), which provides
solutions and equipment for the industrial and mining sector.
In the same year, Cosira Towers is established as a transmission line and cellular
tower business, targeting the tremendous opportunities taking place on the African
continent in the cellular and electricity transmission and distribution markets.
2006: The Group wins the Export Category Steel Award for the Dangote Cement
Conveyer Project exported to Nigeria.
2007: In response to the significant personnel and skills shortages in South Africa, the
Cosira Group concludes a strategic supply partnership with Paradigm HR Solutions
in order to secure reliable source of quality, skilled resources.
Simulating for Better Performance of Cosira Manufacturing
PJ van Ginkel - 22106503
Page | 3
The Group wins the Export Category Steel Award for the Snap Lake Diamond
Recovery project exported to Canada.
2008: Cosira proudly makes a ground breaking investment and starts construction of
state-of-the-art facilities, such as the new Vulcania premises – 'Cosira Vulcan'.
Cosira is one of the winners of the overall Steel Award for 2008, for their structural
steelwork on Soweto's ground breaking Maponya Mall.
Communications tower supplier, Cosira Towers, grows to the stage where it
becomes an independent subsidiary of the Cosira Group, known as Cosira Towers.
A new subsidiary is founded - Cosira Electrical and Instrumentation Projects – to
broaden the comprehensive turnkey offering of the Cosira Group.
2009: The Cosira Group celebrates its 21st anniversary, with the launch in October 2009
of Cosira Vulcan, the Group's flagship fabrication investment, a world-class, state-
of-the-art facility, which is one of the most technologically-advanced, efficient
structural steel fabrication facilities today.
The Group also wins the largest single contract to date, and the first in the all-
important South African power generation sector – the Turbine Hall Contract for the
Medupi Power Station project by Eskom, managed by Alstom.
Cosira is also awarded ISO9001:2008 accreditation and Level 6 Empowerdex
BBBEE certification.
2011: Cosira Manufacturing hit a milestone by producing more than 2500 tonnes in the
month of October from its Cosira Vulcan plant and almost 3000 tonnes from all
plants and sub-contractors combined.
(Cosira International, 2012)
PROJECT AIM
PROBLEM STATEMENT
Early in 2012 the shareholders and top management of the Cosira Group informed all staff
members of the acquisition of Cosira Group by First Tech Group. This handover will be
gradual over the following 18 months. The reason for the transaction is not clear at all,
however from the inside there is some evidence that Cosira was on the verge of going
under. When looking at the five steps of a great company’s “death” according to Jim Collins’
How the Mighty Fall (Collins, 2009)

Simulating for Better Performance of Cosira Manufacturing
PJ van Ginkel - 22106503
Page | 4
:
Step 1: Hubris born of success – As is evident from Cosira’s background; it is no
surprise that Cosira will have a positive attitude about their performance.
Step 2: Undisciplined pursuit of more – Recent expansions to the workshop were
done and brand new equipment was installed to the value of R50’000’000 without
considering the current market trends.
Step 3: Denial of risk and peril – For the past two years Cosira was unsuccessful in
being awarded any significant new contracts. However the contracts running at the
moment is still enough to keep the company going for a few years and thus the
company appears to be doing well.
Step 4: Grasping for salvation – In 2011 Cosira started the process of looking for a
willing buyer with large enough infrastructure and reach to bring in new work to the
company.
Step 5: Capitulation to irrelevance or death – This step is not reached yet by Cosira
and according to Jim Collins a company can still survive and prosper when it has not
yet reached this step.
Figure 1 - How the Mighty Fall (5 steps)
The reason why Cosira has not been successful in being awarded contracts is purely
financially rooted. Cosira is not able to tender for the same price as the competitors; it is
even more cost effective to tender using the fabrication facilities of sub-contractors.
Cosira’s manufacturing division is bulky, non-reactive and ineffective. With the initial analysis
showing that the resources are not properly balanced and that there are unwanted
bottlenecks in the workshop which may be a result of the layout of the workshop.
PROJECT GOAL

Simulating for Better Performance of Cosira Manufacturing
PJ van Ginkel - 22106503
Page | 5
The main goal of this project is improving the profitability of the manufacturing division of
Cosira International.
PROJECT OBJECTIVES
The following objectives will contribute to achieving the main goal of the project:
Determine the real current capacity of the workshop based on the actual operation of
the workshop.
Streamlining the resource balance of the manufacturing division.
Improving the throughput time of work in the workshop.
Increasing the potential capacity of the workshop.
Figure 2 - Project Purpose
PROJECT APPROACH
The first part of the project was to observe and evaluate the manufacturing department of
Cosira. Based on this evaluation possible problems were then identified.
The next step was to research, describe and compile a literature review of the problems that
were identified. This is followed by the collection and initial analysis of any relevant data that
will be used later to confirm the assumptions of the current problems.
Part of the data analysis process is to determine the nature of the processes in terms of
process times, material handling speed, time and discipline, resource usage and
movements, etc. This information will be used in the next step; which is the development of
an Arena Simulation Model that resembles the current status of the Cosira Manufacturing
workshop. This model will be used to confirm whether the data collected is accurate, and if
the problems identified in the initial stages of the project were correct.
Improve Profitability
Determine Capacity
Balance Resources
Improve Throughput
Time

Simulating for Better Performance of Cosira Manufacturing
PJ van Ginkel - 22106503
Page | 6
In an attempt to improve the performance of the workshop, and to eliminate to a large extent
the problems within the workshop, the simulation model will be adjusted a few time focussing
on a specific problem at a time.
These models will then be scrutinised and a single model will then be designed based on the
sum of best sections of each of the previous models. This model will then be used to compile
a possible performance improvement report, as well as the implementation plan to
accomplish the improvements in a sustainable method.
Figure 3 - Project Approach and Implementation
LITERATURE REVIEW
INTRODUCTION TO LITERATURE REVIEW
The literature review will firstly attempt to define the environment of the problem, as well as
various technical aspects related to the specific environment. This will be followed by the
industrial engineering techniques that are available for addressing issues in the specific
environment, as well as the selection of the appropriate techniques for this project.
PROJECT ENVIRONMENT: JOB SHOP
DEFINITION OF A JOB SHOP
The following definition of a job shop is given in (Aquilano, Chase, & Jacobs, 2006):
“Production of small batches of a large number of different products, most of which require a
different set or sequence of processing steps.”
The figure below shows the positioning of the job shop relative to other manufacturing
environments: (NetMBA.com)
Problem Analysis
Research and
Literature Review
Data Collection
and Analysis
Simulate Current
Situation
Confirm Results of Simulation
Adjust Models
and Rerun the
Simulation
Create Best Case Model and
Run Simulation
Prepare Improve-
ment Report
Prepare Implemen-tation Plan

Simulating for Better Performance of Cosira Manufacturing
PJ van Ginkel - 22106503
Page | 7
Project Job Shop Batch Process
Assembly Line
Continuous Flow
Flow None Continuous Flexibility High Low No of Products High Low Capital Investment Low High Variable Cost High Low Labour Content High Low Labour Skill High Low Volume Low High
Table 1 - Manufacturing Environment Comparison
Cosira Manufacturing is the perfect example of a job shop with an average of 2’000 tonnes
of structural steel assemblies being dispatched every month from the 30’000m2 workshop.
This equates to between 4’500 and 9’000 assemblies (based on work mix for the month) of
which 95% are different from any other assembly worked on. Each assembly is made up of a
number of parts that need to be produced in the same workshop, this means that the
workshop needs to produce up to 40’000 parts, in addition to assembling them, of which
more than 80% are different from the rest.
CHARACTERISTICS OF A JOB SHOP
LAYOUT AND ROUTING
In a job shop layout, similar machines and operations are usually grouped together. This
means that a part will have to be routed from one area to another according to the processes
needed to be performed on the specific part. This might result in a part having to visit a
certain area of the workshop more than once. The layout of the workshop needs to be
designed to minimise material handling costs and inventory build-up. (Aquilano, Chase, &
Jacobs, 2006), (Answers.com)
EMPLOYEES
The employees in a job shop are usually highly skilled employees with the correct training to
operate the machines in the workshop. (Answers.com) Job shops also employ more
employees than most other manufacturing environments due to the “random” nature of the
work being performed.
INFORMATION

Simulating for Better Performance of Cosira Manufacturing
PJ van Ginkel - 22106503
Page | 8
Information is the most curtail part of a job shop business. Information is required to do
everything in the business; from quoting/tendering, generating works orders, routing,
scheduling the project, etc.
Information is gathered using job sheets and time cards in order to perform labour and
production cost calculations. The records with this information should be kept up to date to
assist with quoting of future jobs. (Answers.com)
SCHEDULING
In a job shop a job is characterised by its route / processing requirements and its priority. In
a job shop the job mix determines the routing of the jobs, this means that the jobs will not
necessarily be completed in the same order they arrived, but in such an order as to minimise
machine set-ups and change-overs. (Answers.com)
PROJECT ENVIRONMENT: FABRICATION SHOP
DEFINITION OF A FABRICATION SHOP
A fabrication shop (like Cosira’s manufacturing workshop) is in a sense a specialised job
shop.
Fabrication is an industrial term that refers to the building of metal structures by preparing
parts (cutting, drilling, punching, shearing, and sawing) and building metal assemblies from
these parts (Wikipedia.org). The building of the assemblies always requires a high level of
skill with initial assembly being performed by a trained artisan (like a boiler maker).
AVAILABLE INDUSTRIAL ENGINEERING METHODS, TOOLS AND
TECHNIQUES
Many industrial engineering techniques and tools are available to investigate and improve
the output of fabrication facilities. The following techniques were considered for this project:
LEAN MANUFACTURING
Lean is a production control technique for eliminating waste from the organisation. (Lean
Manufacturing Japan.com)
The implementation of lean manufacturing are guided by the following five steps: (Lean.org)

Simulating for Better Performance of Cosira Manufacturing
PJ van Ginkel - 22106503
Page | 9
Figure 4 - Principles of Lean
1. Specify the value of the output relative to the end user’s perception of value
2. Identify that value stream of production, and try to eliminate those steps that do not
add value, and are not necessary for production
3. Tighten the sequence of occurrence of these steps in order to create smooth flow
4. Allow customers to “pull value” from the upstream activities (this is the value
refinement stage)
5. In this step the refined value definition is introduced into the value stream and the
process repeats itself into infinity
JUST-IN-TIME MANUFACTURING
Just-In-Time (JIT) manufacturing is one method of achieving lean manufacturing. The aim of
JIT manufacturing is to reduce waste. According to (Tompkins, White, Boser, & Tanchoco,
2003) the seven types of waste are:
Waste arising from overproduction
Waste arising from time on hand (waiting)
Waste arising from transporting
Waste arising from processing itself
Waste arising from unnecessary stock on hand
Waste arising from unnecessary motion
Waste arising from producing defective goods
The reduction of waste is achieved by providing the right amount of the right material, in the
right condition (quality), at the right place (routing), at the right time (scheduling), in the right
position, in the right sequence (job sheet), and for the right costs (budget), by using the right
method. (Tompkins, White, Boser, & Tanchoco, 2003)
LINE/RESOURCE BALANCING
2. Map the Value Stream
3. Create Flow
4. Establish
Pull
5. Seek Perfection
1. Identify Value

Simulating for Better Performance of Cosira Manufacturing
PJ van Ginkel - 22106503
Page | 10
Line balancing is an operations research method of assigning operations to workstations in
an assembly line, in such a way that the assignment be optimal in some way (Falkenauer).
Line balancing aims at reducing bottlenecks as well as excess capacity (Six Sigma Material).
Figure 5 - Unbalanced Line
Figure 5 above shows the processing time of a general 5 process assembly line that has not
been balanced. The result of this unbalanced line will cause some form of wastes mentioned
in the previous section. Looking at the graph in figure 5, process 2 will wait for material from
process 1. If process 2 receives material as and when required it will over supply to process
3, which will in turn create large WIP build-up and another form of waste. Process 3 and 5
are almost in balance and should not cause too much wastage. But process 4 is again taking
too long. The idea is to redesign the processes and divide tasks between the processes (or
add resources to processes) that will cause the processes to have close to the same
duration.
Figure 6 - Balanced Line
Figure 6 above shows the processing time for a newly defined four process assembly line
with balanced activity durations.
THEORY OF CONSTRAINTS
Simulating for Better Performance of Cosira Manufacturing
PJ van Ginkel - 22106503
Page | 11
“A chain is only as strong as its weakest link.”
The theory of constraints (TOC) applied this idiom to processes, divisions and businesses
(Wikipedia.org). The TOC are explained very well by Eliyahu M. Goldratt in his book “The
Goal”. The Goal demonstrates the TOC in an everyday situation in a language that everyone
will understand. The following key points are highlighted in this book (Goldratt, 2004):
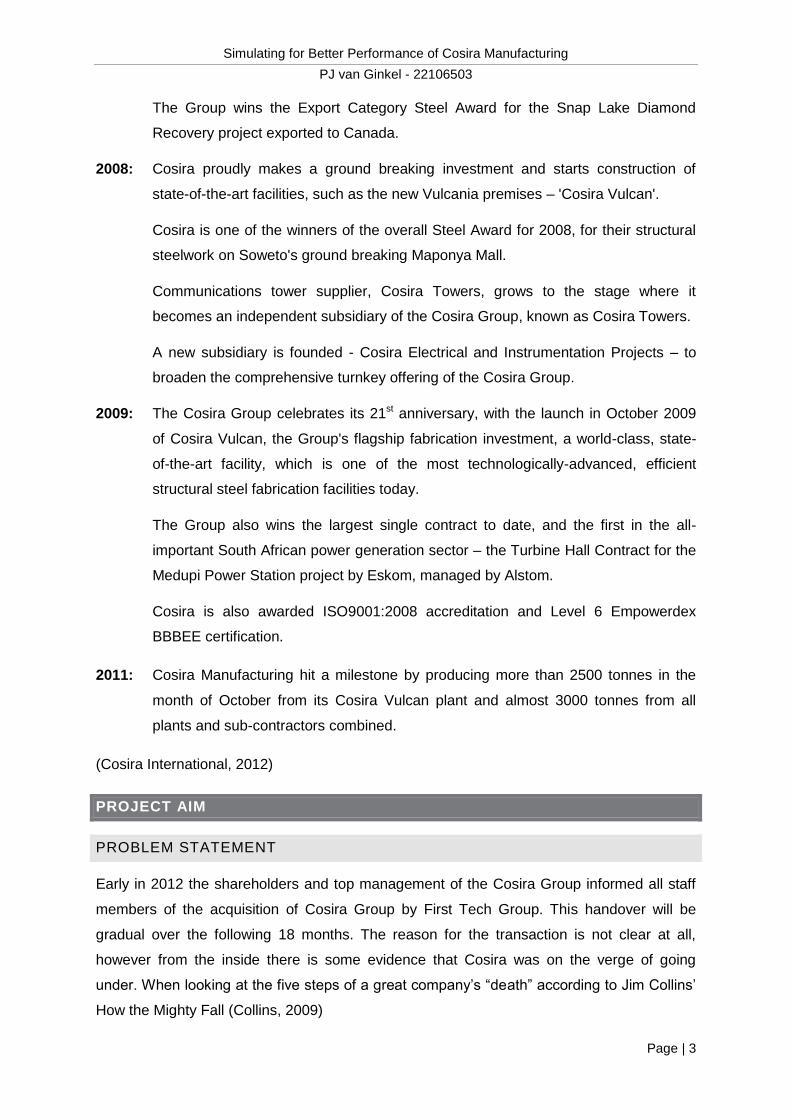
TOC is also a cycle of on-going improvement as is displayed below.
Figure 7 - Process of On-going Improvement (TOC)
1. A practical way to identify a constraint is to look for the largest pile of idle WIP, in
most cases the constraint will be the process immediately following the idle WIP.
2. There are various ways to exploit the constraint; the main objective is to have the
process constraining the system work as hard as possible with the available
resources.
3. The objective here is to find other processes (non-constraints) in the workshop that
can assist the constraining process to catch up the production requirements.
4. Here the constraining process should permanently be improved, again there are a
few ways to achieve this, some ways are buying new / more equipment that can do
the job, reengineer the process, change the layout of the workshop, etc.
5. To prevent inertia there needs to be a system regulating the speed of production.
This system is described as the “Drum-Buffer-Rope” system in the book.
a. The constraint is the drum. It keeps the beat for the rest of the production to
follow.
b. Buffer stock should be maintained just after the constraint in case of a system
failure.
c. The processes following the constraint are the rope, they will indicate when
the constraint is failing to produce as required.
2. Expliot the
Constraint
3. Subordinate
the Constraint
4. Elevate the
Constraint
5. Prevent Inertia
1. Identify the
Constraint

Simulating for Better Performance of Cosira Manufacturing
PJ van Ginkel - 22106503
Page | 12
Figure 8 - Drum - Buffer - Rope System
SIMULATION MODELLING
Simulation modelling is an important part of engineering design, used for training purposes,
to save time and money, to optimise a system, to predict performance, to enhance
understanding of system behaviour, and to examine worst case scenarios (Hewitt).
Simulation also refers to a wide collection of methods and tools to “copy” the behaviour of
real systems; simulation is usually done with computer based software (Kelton, Sadowski, &
Sturrock, 2004).
Simulation packages, such as Arena and Simio, are good tools to use in the simulation of
fabrication facilities, since the simulation model is based on basic flow chart procedures and
since most companies have their processes mapped out, it can be imported into the
simulation package.
SELECTION OF APPROPRIATE INDUSTRIAL ENGINEERING METHODS,
TOOLS AND TECHNIQUES
After evaluating the mentioned techniques, the following techniques were selected for the
project:
LINE/RESOURCE BALANCING
Initial investigations have shown that there are a resource balance issue within the assembly
department. Line balancing will resolve a lot of in-department throughput problems. Line
balancing however would probably not work for the whole workshop.
THEORY OF CONSTRAINTS
In investigating TOC, it became clear that this would be a very convenient production
improvement project for the whole manufacturing workshop. The main reason for this is that
Simulating for Better Performance of Cosira Manufacturing
PJ van Ginkel - 22106503
Page | 13
the constraint can be artificially selected and maintained in order to regulate the effective
flow of work through the workshop applying the Drum-Buffer-Rope principal.
SIMULATION MODELING
Since physical experiments in a production shop are very expensive and disruptive to
production, and it takes a long time to see results (not yet knowing if the results will be
positive or negative), computer based simulation will be the ideal tool to design and evaluate
the possible production improvement projects. This project will evaluate the current and
possible improvement models of the Cosira manufacturing workshop using Arena simulation
software.
DEVELOPMENT OF SUPPLEMENTARY METHODS, TOOLS AND TECHNIQUES
The techniques and tools discussed in the previous section are sufficient for this project, and
thus no supplementary methods will be required.
DATA AND INFORMATION GATHERING AND ANALYSIS
MATERIAL FLOW
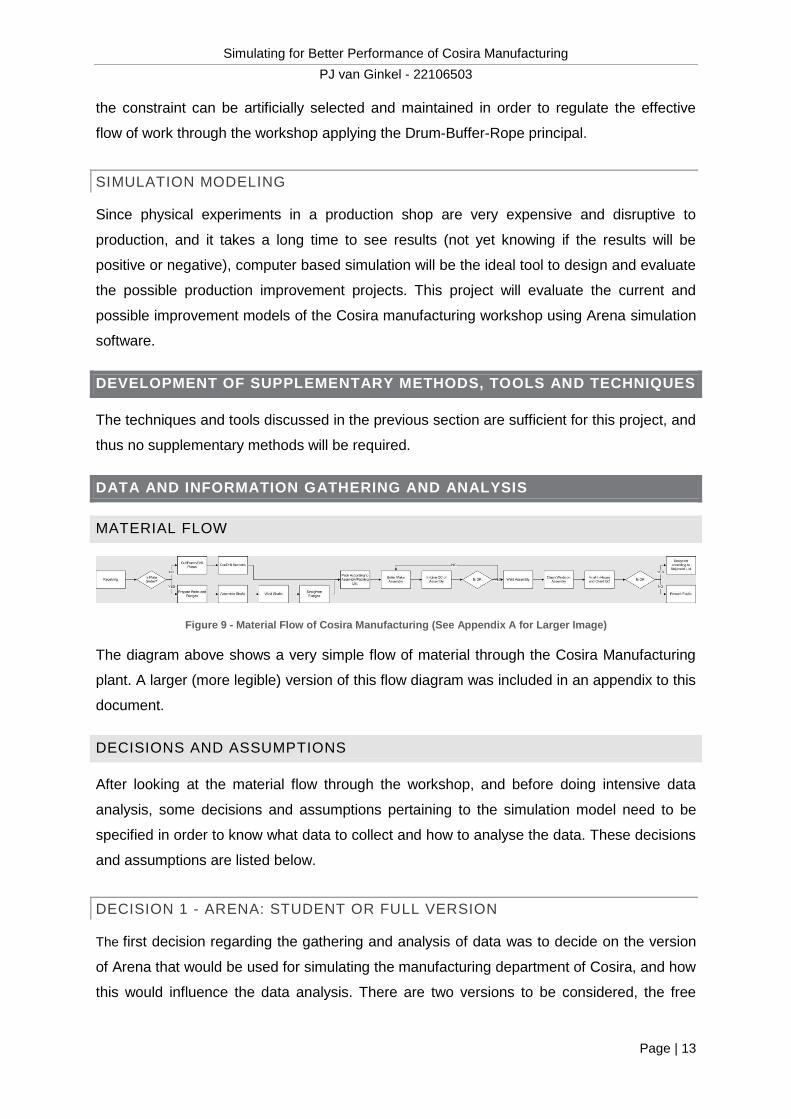
Figure 9 - Material Flow of Cosira Manufacturing (See Appendix A for Larger Image)
The diagram above shows a very simple flow of material through the Cosira Manufacturing
plant. A larger (more legible) version of this flow diagram was included in an appendix to this
document.
DECISIONS AND ASSUMPTIONS
After looking at the material flow through the workshop, and before doing intensive data
analysis, some decisions and assumptions pertaining to the simulation model need to be
specified in order to know what data to collect and how to analyse the data. These decisions
and assumptions are listed below.
DECISION 1 - ARENA: STUDENT OR FULL VERSION
The first decision regarding the gathering and analysis of data was to decide on the version
of Arena that would be used for simulating the manufacturing department of Cosira, and how
this would influence the data analysis. There are two versions to be considered, the free

Simulating for Better Performance of Cosira Manufacturing
PJ van Ginkel - 22106503
Page | 14
student version, and the full version which requires a license dongle to work. The main
difference between the versions is the number of entities running in the simulation. The
student version allows for 150 entities, and the full version for unlimited entities. After
considering the logistical issues in trying to use the full version of the software the decision
was taken to simulate using the limitations of the student version. The following step was to
determine how to simulate with the restrictions of the student version of Arena while still
representing accurate information.
COUNTER DECISION - ARENA: STUDENT OR FULL VERSION
As mentioned in Decision 1, the student version would be used to model. After several
attempts to make the simulation work failed the decision was reversed to using the full
version. A licence for the full version of the software was borrowed from the University of
Pretoria.
DECISION 2 – SIMULATING OVERHEAD CRANES
The standard version of Arena does not allow for the overhead crane as a type of
transporter, there are an after-market crane simulation module available from a company in
Argentina, this however is not a free version and will not be considered. Since cranage is not
considered to be a restraint in Cosira’s manufacturing plant, it does not have to be modelled
in great detail. Only simple routing will be used for material movement in the workshop.
DECISION 3 – JOB SIZE / COMPLEXITY
Although each contract / job that is processed by Cosira is unique, they can be categorized
into a couple of simple work types as the diagram below shows:
Figure 10 - Cosira Work Types
All Jobs
Plate Girder Jobs
Beams
Columns
Rafters
Structural Jobs
Normal Structural
Gantries / Frames
Plate Work Jobs
Simple Shapes
Complex Shapes
Simulating for Better Performance of Cosira Manufacturing
PJ van Ginkel - 22106503
Page | 15
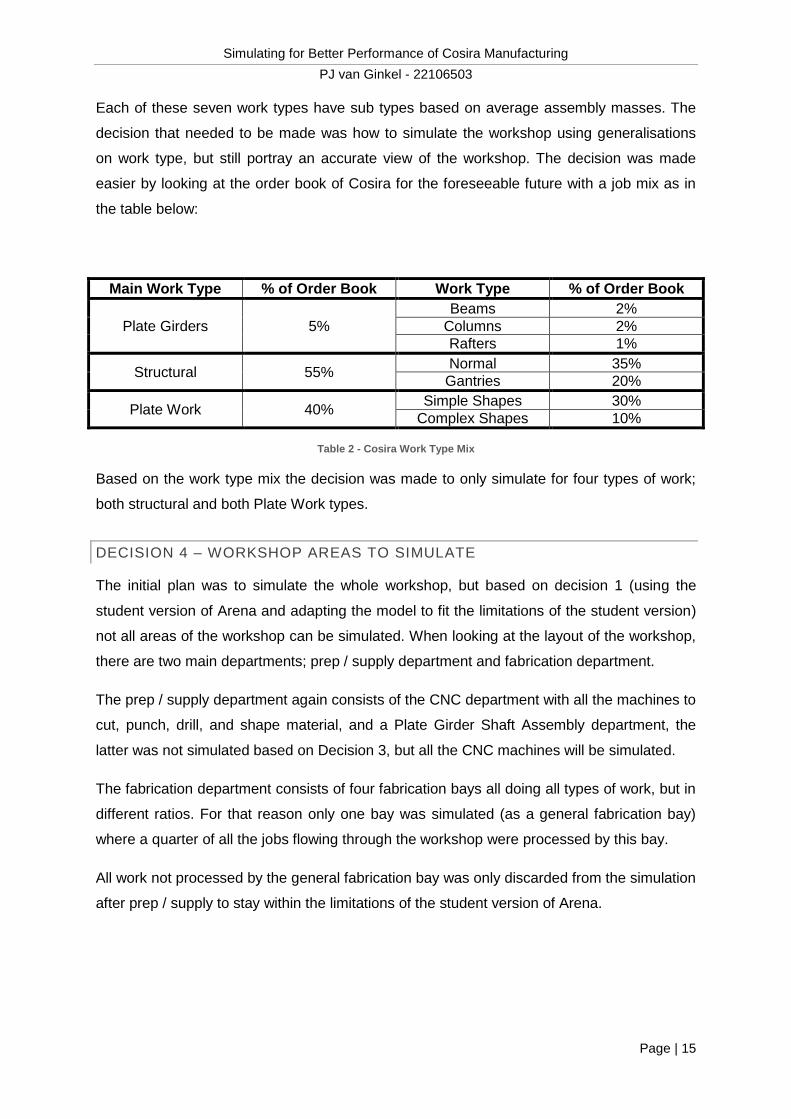
Each of these seven work types have sub types based on average assembly masses. The
decision that needed to be made was how to simulate the workshop using generalisations
on work type, but still portray an accurate view of the workshop. The decision was made
easier by looking at the order book of Cosira for the foreseeable future with a job mix as in
the table below:
Main Work Type % of Order Book Work Type % of Order Book
Plate Girders 5%
Beams 2%
Columns 2%
Rafters 1%
Structural 55% Normal 35%
Gantries 20%
Plate Work 40% Simple Shapes 30%
Complex Shapes 10%
Table 2 - Cosira Work Type Mix
Based on the work type mix the decision was made to only simulate for four types of work;
both structural and both Plate Work types.
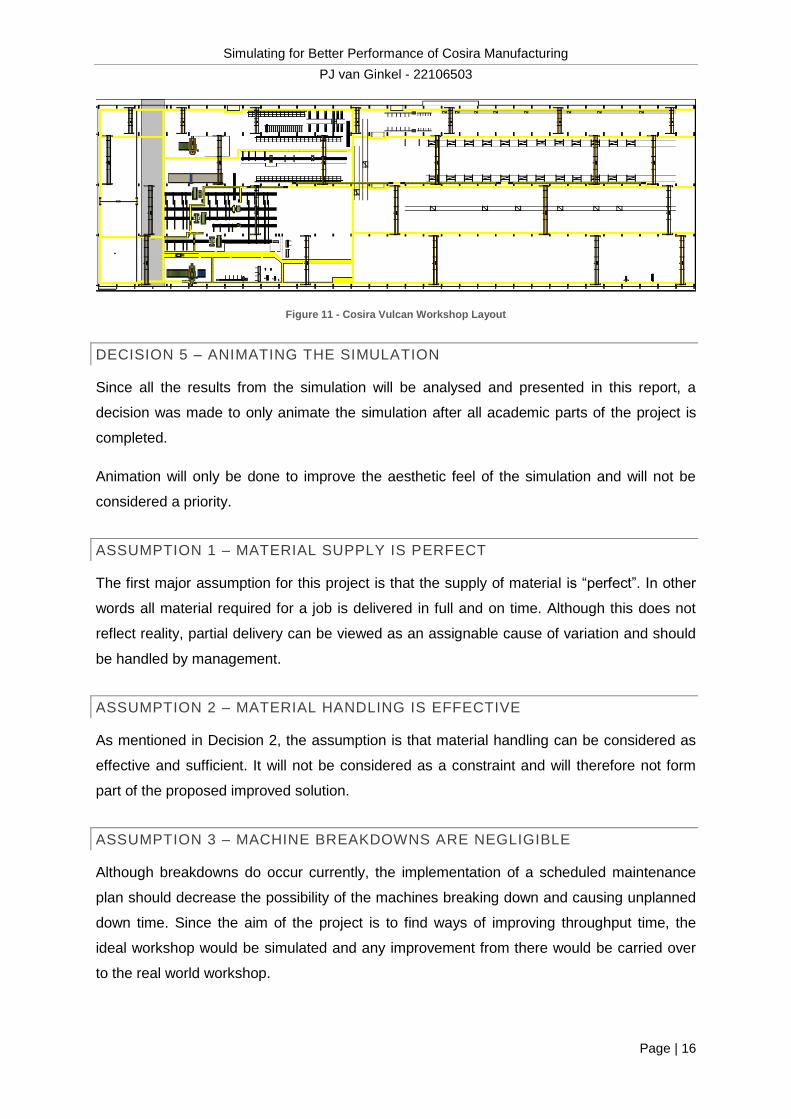
DECISION 4 – WORKSHOP AREAS TO SIMULATE
The initial plan was to simulate the whole workshop, but based on decision 1 (using the
student version of Arena and adapting the model to fit the limitations of the student version)
not all areas of the workshop can be simulated. When looking at the layout of the workshop,
there are two main departments; prep / supply department and fabrication department.
The prep / supply department again consists of the CNC department with all the machines to
cut, punch, drill, and shape material, and a Plate Girder Shaft Assembly department, the
latter was not simulated based on Decision 3, but all the CNC machines will be simulated.
The fabrication department consists of four fabrication bays all doing all types of work, but in
different ratios. For that reason only one bay was simulated (as a general fabrication bay)
where a quarter of all the jobs flowing through the workshop were processed by this bay.
All work not processed by the general fabrication bay was only discarded from the simulation
after prep / supply to stay within the limitations of the student version of Arena.
Simulating for Better Performance of Cosira Manufacturing
PJ van Ginkel - 22106503
Page | 16
Figure 11 - Cosira Vulcan Workshop Layout
DECISION 5 – ANIMATING THE SIMULATION
Since all the results from the simulation will be analysed and presented in this report, a
decision was made to only animate the simulation after all academic parts of the project is
completed.
Animation will only be done to improve the aesthetic feel of the simulation and will not be
considered a priority.
ASSUMPTION 1 – MATERIAL SUPPLY IS PERFECT
The first major assumption for this project is that the supply of material is “perfect”. In other
words all material required for a job is delivered in full and on time. Although this does not
reflect reality, partial delivery can be viewed as an assignable cause of variation and should
be handled by management.
ASSUMPTION 2 – MATERIAL HANDLING IS EFFECTIVE
As mentioned in Decision 2, the assumption is that material handling can be considered as
effective and sufficient. It will not be considered as a constraint and will therefore not form
part of the proposed improved solution.
ASSUMPTION 3 – MACHINE BREAKDOWNS ARE NEGLIGIBLE
Although breakdowns do occur currently, the implementation of a scheduled maintenance
plan should decrease the possibility of the machines breaking down and causing unplanned
down time. Since the aim of the project is to find ways of improving throughput time, the
ideal workshop would be simulated and any improvement from there would be carried over
to the real world workshop.
Simulating for Better Performance of Cosira Manufacturing
PJ van Ginkel - 22106503
Page | 17
ASSUMPTION 4 – ABSENTEEISM IS NEGLIGIBLE
Again as mentioned above, the idea is to simulate the ideal workshop and improve
throughput thereof. The assumption of absenteeism is aimed at making the simulation of
resources simpler.
DATA GATHERING
PRODUCTION TRACKING SHEETS
A vast amount of raw data has been collected from Cosira’s production tracking and MRP
systems. This data shows clearly the duration each part/assembly spends at any particular
are in the workshop. The images on the next page show a section from the production
tracking sheets for the parts up to the staging area, and the assemblies from the staging
area up the dispatch (each phase of each contract has a set of sheets like this).
The only problem with these sheets is that the idle time of the material could not be
identified, further investigation was needed to determine idle vs. value adding time.

Simulating for Better Performance of Cosira Manufacturing
PJ van Ginkel - 22106503
Page | 18
Figure 12 - Production Tracking/Planning Sheet
Jo
b N
oA
ssy N
oP
art
No
Pa
rt Q
tyM
ain
Me
mb
erS
ecti
on
Siz
eL
en
gth
Ma
ssG
rad
eO
pti
miz
er
Ph
ase
Pa
ck L
ist
PO
Nu
mb
er
Ex
pe
cte
dP
lan
ne
dA
ctu
al
Pla
nn
ed
Actu
al
517
13532.5
0737B
C183
183
1X
EA
150x150x12
240
6.5
6350W
A0
I1A
NG
04/0
737B
C-0
0002
22 N
ov
11
05 D
ec 1
123 N
ov
11
22 N
ov
11
Fic
ep 2
06
25 N
ov
11
28 N
ov
11
0737B
C204
204
1X
EA
70x70x6
200
1.2
8350W
A0
I2A
NG
0U
SE
OF
F C
UTS
03 F
eb 1
207 M
ar
12
07 F
eb 1
217 F
eb 1
2F
icep 1
16
10 F
eb 1
219 F
eb 1
2
0737B
C204
204
1X
EA
70x70x6
200
1.2
8350W
A0
I2A
NG
0U
SE
OF
F C
UTS
03 F
eb 1
207 M
ar
12
07 F
eb 1
217 F
eb 1
2F
icep 1
16
10 F
eb 1
219 F
eb 1
2
0737B
C204
204
1X
EA
70x70x6
200
1.2
8350W
A0
I2A
NG
0U
SE
OF
F C
UTS
03 F
eb 1
207 M
ar
12
07 F
eb 1
217 F
eb 1
2F
icep 1
16
10 F
eb 1
219 F
eb 1
2
0737B
C204
204
1X
EA
70x70x6
200
1.2
8350W
A0
I2A
NG
0U
SE
OF
F C
UTS
03 F
eb 1
207 M
ar
12
07 F
eb 1
217 F
eb 1
2F
icep 1
16
10 F
eb 1
219 F
eb 1
2
0737B
C208
208
1X
UB
406x140x46
4914
226.0
4350W
A15
I3H
RP
L1
4/0
737B
C-0
0011
03 F
eb 1
207 M
ar
12
07 F
eb 1
216 F
eb 1
2M
anual M
achin
es1
0 F
eb 1
203 D
ec 1
2
0737B
C209
209
1X
UB
254x146x37
5617
207.8
3350W
A0
I2H
R0
4/0
737B
C-0
0010
03 F
eb 1
207 M
ar
12
07 F
eb 1
217 F
eb 1
2S
aw
28
10 F
eb 1
215 F
eb 1
2
0737B
C210
210
1X
PLT
8m
m233
1.0
3350W
A0
I2C
NC
/PLT
0U
SE
OF
F C
UTS
03 F
eb 1
207 M
ar
12
07 F
eb 1
215 F
eb 1
2G
uill
otine
10 F
eb 1
216 F
eb 1
2
0737B
C210
210
1X
PLT
8m
m233
1.0
3350W
A0
I2C
NC
/PLT
0U
SE
OF
F C
UTS
03 F
eb 1
207 M
ar
12
07 F
eb 1
215 F
eb 1
2G
uill
otine
10 F
eb 1
216 F
eb 1
2
0737B
C212
212
1X
EA
90x90x8
150
1.6
4350W
A0
I2A
NG
0U
SE
OF
F C
UTS
03 F
eb 1
207 M
ar
12
07 F
eb 1
217 F
eb 1
2F
icep 1
16
10 F
eb 1
218 F
eb 1
2
0737B
C212
212
1X
EA
90x90x8
150
1.6
4350W
A0
I2A
NG
0U
SE
OF
F C
UTS
03 F
eb 1
207 M
ar
12
07 F
eb 1
217 F
eb 1
2F
icep 1
16
10 F
eb 1
218 F
eb 1
2
0737B
C212
212
1X
EA
90x90x8
150
1.6
4350W
A0
I2A
NG
0U
SE
OF
F C
UTS
03 F
eb 1
207 M
ar
12
07 F
eb 1
217 F
eb 1
2F
icep 1
16
10 F
eb 1
218 F
eb 1
2
0737B
C212
212
1X
EA
90x90x8
150
1.6
4350W
A0
I2A
NG
0U
SE
OF
F C
UTS
03 F
eb 1
207 M
ar
12
07 F
eb 1
217 F
eb 1
2F
icep 1
16
10 F
eb 1
218 F
eb 1
2
0737B
C31
31
1X
EA
60x60x10
1371
11.9
1350W
A0
I1A
NG
04/0
737B
C-0
0002
22 N
ov
11
05 D
ec 1
123 N
ov
11
22 N
ov
11
Fic
ep 2
06
25 N
ov
11
28 N
ov
11
0737B
C32
32
1X
EA
60x60x10
3186
27.6
9350W
A0
I1A
NG
04/0
737B
C-0
0002
22 N
ov
11
05 D
ec 1
123 N
ov
11
22 N
ov
11
Fic
ep 2
06
25 N
ov
11
28 N
ov
11
0737B
C33
33
1X
EA
60x60x10
2977
25.8
7350W
A0
I1A
NG
04/0
737B
C-0
0002
22 N
ov
11
05 D
ec 1
123 N
ov
11
22 N
ov
11
Fic
ep 2
06
25 N
ov
11
28 N
ov
11
0737B
C34
34
1X
EA
60x60x10
1825
15.8
6350W
A0
I1A
NG
04/0
737B
C-0
0002
22 N
ov
11
05 D
ec 1
123 N
ov
11
22 N
ov
11
Fic
ep 2
06
25 N
ov
11
28 N
ov
11
0737B
C35
35
1X
EA
60x60x10
1860
16.1
6350W
A0
I1A
NG
04/0
737B
C-0
0002
22 N
ov
11
05 D
ec 1
123 N
ov
11
22 N
ov
11
Fic
ep 2
06
25 N
ov
11
28 N
ov
11
0737B
C36
36
1X
EA
60x60x10
2088
18.1
4350W
A0
I1A
NG
04/0
737B
C-0
0002
22 N
ov
11
05 D
ec 1
123 N
ov
11
22 N
ov
11
Fic
ep 2
06
25 N
ov
11
28 N
ov
11
0737B
C37
37
1X
EA
60x60x10
2084
18.1
1350W
A0
I1A
NG
04/0
737B
C-0
0002
22 N
ov
11
05 D
ec 1
123 N
ov
11
22 N
ov
11
Fic
ep 2
06
25 N
ov
11
28 N
ov
11
0737B
C13.5
3 T
on
, 517 p
art
s.
Re
ce
ivin
g
Pre
pp
ing C
utt
ing
Ma
ch
ine
Sele
cti
on
13.5
3 T
on
, 517 p
art
s.
Dra
win
gs
Re
ce
ive
dO
TG
Da
te
10.5
BM
Ho
urs
No
of
BM
BM
Sh
ifts
We
ld H
ou
rsN
o o
f W
eld
ers
We
lde
r S
hif
ts
Ba
y
Jo
b N
oA
ssy N
oA
ssy Q
tyM
ass
Ass
y N
am
eW
ork
Typ
eT
ime
All
ow
ed
Ph
ase
Pa
ck L
ist
Pla
nn
ed
Actu
al
Pla
nn
ed
Actu
al
Pla
nn
ed
Actu
al
Pla
nn
ed
Actu
al
Pla
nn
ed
Actu
al
219
13532.0
8175.9
7
Bay 1
0737B
C1
127.9
3H
BH
ot
Rolle
d -
Mediu
m0.3
6I1
HR
PL1
22-N
ov-
11
26-N
ov-
11
29-N
ov-
11
01-D
ec-1
107-D
ec-1
103-D
ec-1
108-D
ec-1
104-D
ec-1
112-D
ec-1
105-D
ec-1
105-J
an-1
2
Bay 1
0737B
C10
1154.4
4B
eam
Hot
Rolle
d -
Mediu
m2.0
1I1
HR
PL2
22-N
ov-
11
26-N
ov-
11
03-D
ec-1
101-D
ec-1
103-D
ec-1
103-D
ec-1
108-D
ec-1
104-D
ec-1
105-D
ec-1
105-D
ec-1
108-D
ec-1
1
Bay 1
0737B
C11
1163.6
6B
eam
Hot
Rolle
d -
Mediu
m2.1
3I1
HR
PL2
22-N
ov-
11
26-N
ov-
11
03-D
ec-1
101-D
ec-1
103-D
ec-1
103-D
ec-1
108-D
ec-1
104-D
ec-1
105-D
ec-1
105-D
ec-1
108-D
ec-1
1
Bay 1
0737B
C12
11327.2
2B
eam
Hot
Rolle
d -
Mediu
m17.2
5I1
HR
PL3
22-N
ov-
11
26-N
ov-
11
29-N
ov-
11
01-D
ec-1
130-N
ov-
11
03-D
ec-1
108-D
ec-1
104-D
ec-1
108-D
ec-1
105-D
ec-1
108-D
ec-1
1
Bay 1
0737B
C13
185.1
5B
eam
Hot
Rolle
d -
Mediu
m1.1
1I1
HR
PL6
22-N
ov-
11
26-N
ov-
11
29-N
ov-
11
01-D
ec-1
130-N
ov-
11
03-D
ec-1
108-D
ec-1
104-D
ec-1
108-D
ec-1
105-D
ec-1
108-D
ec-1
1
Bay 1
0737B
C14
190.7
9B
eam
Hot
Rolle
d -
Mediu
m1.1
8I1
HR
PL6
22-N
ov-
11
26-N
ov-
11
29-N
ov-
11
01-D
ec-1
130-N
ov-
11
03-D
ec-1
108-D
ec-1
104-D
ec-1
108-D
ec-1
105-D
ec-1
108-D
ec-1
1
Bay 1
0737B
C15
179.1
5B
eam
Hot
Rolle
d -
Mediu
m1.0
3I1
HR
PL6
22-N
ov-
11
26-N
ov-
11
29-N
ov-
11
01-D
ec-1
130-N
ov-
11
03-D
ec-1
108-D
ec-1
104-D
ec-1
108-D
ec-1
105-D
ec-1
108-D
ec-1
1
Bay 1
0737B
C16
184.5
8B
eam
Hot
Rolle
d -
Mediu
m1.1
I1H
RP
L6
22-N
ov-
11
26-N
ov-
11
29-N
ov-
11
01-D
ec-1
130-N
ov-
11
03-D
ec-1
108-D
ec-1
104-D
ec-1
108-D
ec-1
105-D
ec-1
108-D
ec-1
1
Bay 1
0737B
C17
1108.6
9B
eam
Hot
Rolle
d -
Mediu
m1.4
1I1
HR
PL6
22-N
ov-
11
26-N
ov-
11
29-N
ov-
11
01-D
ec-1
101-D
ec-1
103-D
ec-1
108-D
ec-1
104-D
ec-1
130-N
ov-
11
05-D
ec-1
108-D
ec-1
1
Bay 1
0737B
C18
1108.5
7B
eam
Hot
Rolle
d -
Mediu
m1.4
1I1
HR
PL6
22-N
ov-
11
26-N
ov-
11
29-N
ov-
11
01-D
ec-1
130-N
ov-
11
03-D
ec-1
130-N
ov-
11
04-D
ec-1
130-N
ov-
11
05-D
ec-1
108-D
ec-1
1
CN
C0737B
C183
16.5
6C
leat
Hot
Rolle
d -
Mediu
m0.0
9I1
AN
GP
L10
22-N
ov-
11
26-N
ov-
11
28-N
ov-
11
01-D
ec-1
128-N
ov-
11
03-D
ec-1
108-D
ec-1
104-D
ec-1
108-D
ec-1
105-D
ec-1
108-J
an-1
2
Bay 1
0737B
C19
185.1
5B
eam
Hot
Rolle
d -
Mediu
m1.1
1I1
HR
PL6
22-N
ov-
11
26-N
ov-
11
29-N
ov-
11
01-D
ec-1
130-N
ov-
11
03-D
ec-1
130-N
ov-
11
04-D
ec-1
130-N
ov-
11
05-D
ec-1
108-D
ec-1
1
Bay 1
0737B
C2
1369.5
9C
olu
mn
Hot
Rolle
d -
Mediu
m4.8
I1H
RP
L2
22-N
ov-
11
26-N
ov-
11
03-D
ec-1
101-D
ec-1
103-D
ec-1
103-D
ec-1
108-D
ec-1
104-D
ec-1
105-D
ec-1
105-D
ec-1
108-D
ec-1
1
Bay 1
0737B
C20
179.1
5B
eam
Hot
Rolle
d -
Mediu
m1.0
3I1
HR
PL6
22-N
ov-
11
26-N
ov-
11
29-N
ov-
11
01-D
ec-1
130-N
ov-
11
03-D
ec-1
108-D
ec-1
104-D
ec-1
108-D
ec-1
105-D
ec-1
108-D
ec-1
1
Bay 1
0737B
C21
1103
Beam
Hot
Rolle
d -
Mediu
m1.3
4I1
HR
PL6
22-N
ov-
11
26-N
ov-
11
29-N
ov-
11
01-D
ec-1
130-N
ov-
11
03-D
ec-1
108-D
ec-1
104-D
ec-1
130-N
ov-
11
05-D
ec-1
108-D
ec-1
1
Bay 1
0737B
C22
135.7
3B
eam
Hot
Rolle
d -
Mediu
m0.4
6I1
HR
PL6
22-N
ov-
11
26-N
ov-
11
29-N
ov-
11
01-D
ec-1
130-N
ov-
11
03-D
ec-1
108-D
ec-1
104-D
ec-1
108-D
ec-1
105-D
ec-1
105-J
an-1
2
Bay 1
0737B
C23
1113.0
8B
eam
Hot
Rolle
d -
Mediu
m1.4
7I1
HR
PL6
22-N
ov-
11
26-N
ov-
11
29-N
ov-
11
01-D
ec-1
130-N
ov-
11
03-D
ec-1
130-N
ov-
11
04-D
ec-1
130-N
ov-
11
05-D
ec-1
108-D
ec-1
1
Bay 1
0737B
C23
1113.0
8B
eam
Hot
Rolle
d -
Mediu
m1.4
7I1
HR
PL6
22-N
ov-
11
26-N
ov-
11
29-N
ov-
11
01-D
ec-1
130-N
ov-
11
03-D
ec-1
130-N
ov-
11
04-D
ec-1
130-N
ov-
11
05-D
ec-1
108-D
ec-1
1
Bay 1
0737B
C24
118.4
3B
eam
Hot
Rolle
d -
Mediu
m0.2
4I1
HR
PL4
22-N
ov-
11
26-N
ov-
11
28-N
ov-
11
01-D
ec-1
129-N
ov-
11
03-D
ec-1
108-D
ec-1
104-D
ec-1
108-D
ec-1
105-D
ec-1
108-D
ec-1
1
Bay 1
0737B
C24
118.4
3B
eam
Hot
Rolle
d -
Mediu
m0.2
4I1
HR
PL4
22-N
ov-
11
26-N
ov-
11
28-N
ov-
11
01-D
ec-1
129-N
ov-
11
03-D
ec-1
108-D
ec-1
104-D
ec-1
108-D
ec-1
105-D
ec-1
108-D
ec-1
1
Bay 1
0737B
C25
120.0
4B
eam
Hot
Rolle
d -
Mediu
m0.2
6I1
HR
PL4
22-N
ov-
11
26-N
ov-
11
28-N
ov-
11
01-D
ec-1
129-N
ov-
11
03-D
ec-1
108-D
ec-1
104-D
ec-1
108-D
ec-1
105-D
ec-1
108-D
ec-1
1
2.3
47
Pa
cke
dF
ab
rica
tio
n C
om
ple
te
36
.95
13
.51
9
24
.64
1
2.3
47
We
ldin
g C
om
ple
te
36
.95
13
.51
9
1
De
spa
tch
Fe
ttli
ng
Co
mp
lete
Dra
win
gs
Re
ce
ive
d
24
.64
07
37
BC
Se
lec
tio
n
13
.53
To
n a
t 1
75.9
7 H
ou
rs f
or
Are
a.
13
.53
To
n a
t 1
75.9
7 H
ou
rs f
or
Se
lec
tio
n.

Simulating for Better Performance of Cosira Manufacturing
PJ van Ginkel - 22106503
Page | 19
CNC PERFORMANCE
The foreman of the CNC department captures each day’s performance of each machine in a
file that forms part of the monthly management report. From this file, the following CNC
machines were analysed to get the part processing time:
All CNC Saws
All CNC Plasma Machines (for plate preparation)
All Angle- and Flat Bar Machines
This file gives an accurate figure for daily output from each machine.
FABRICATION PERFORMANCE
As mentioned earlier, the production tracking sheets don’t indicate the actual value adding
time of each discipline vs. the idle time of the material in that section of the workshop. Since
batch processing is used in some areas of
the workshop, it is inevitable to have
material waiting to be processed.
Time studies along with interviews of the
artisans and their supervisors yielded the
following VA matrices for the boiler making
and welding in the fabrication department.
Table 3 – Plate work VA Matrix
Table 4 - Structural VA Matrix
UNDERPANS NORMAL COMPLEX
[Incl deckplates, etc] [Head shoots, etc.][Conical / rolled /
bevelled curves, tubular]
LIGHT P/W
[3mm - 5mm plate]
MEDIUM P/W
[6mm - 8mm plate]
HEAVY P/W
[10mm + plate]42.83 20.00 24.94
Platework Matrix (Hours/Ton) for Artisans
106.25 67.03 76.35
37.5033.3367.46
1 2 3 4 5
0 - 0.2 Ton/Assy 0.2 - 0.5 Ton/Assy 0.5 - 1.5 Ton/Assy 1.5 - 4 Ton/Assy 4 + Ton/Assy
W 1 Part/Assy 0.83 0.33 0.25 0.15 0.11
A 2 - 5 Parts/Assy 12.00 4.57 2.80 1.75 0.91
B 6 - 10 Parts/Assy 22.67 10.93 5.95 2.68 1.58
C 11 - 20 Parts/Assy 38.00 19.00 9.03 4.15 2.58
D 20 + Parts/Assy 140.00 48.57 18.50 8.00 5.14
Hot Rolled Hours / Ton for All Artisans
0
Figure 13 - Time Studies Sheet

Simulating for Better Performance of Cosira Manufacturing
PJ van Ginkel - 22106503
Page | 20
DATA ANALYSIS
The data analysis was a tedious task, extrapolating information from the planning/tracking
sheets, time studies and other production update sheets, and finding a logical work matrix
with acceptable duration distributions to use as the inputs and parameters of the model.
CNC MACHINES
The information from the CNC update files were analysed for a period of three months with
similar job mix than was decided to use for the simulation, and yielded the following results.
SAWS
Cosira Operates 3 CNC saws, as well as one manually operated saw that forms part of the
CNC configuration of saws, the data shows the following items per hour data; where the blue
curve shows a normal distribution using the mean and standard deviation obtained from the
captured data, and the purple curve shows the actual data gathered. Saw 28 has a much
flatter line, and deviates the furthest from the normal curve, the fact that this is the manually
operated saw might be the reason for this.
Figure 14 - Individual Saw Performance Curves
Since the data for the saws included cutting of plate girders, which takes a very long time,
the simulated jobs will be allocated with a complexity factor to accommodate for the size of
the sections being cut.
0
0.2
0.4
0.6
0.8
1
1.2
0
0.6
1.2
1.8
2.4 3
3.6
4.2
4.8
5.4 6
6.6
7.2
7.8
8.4 9
9.6
10
.2
10
.8
11
.4 12
12
.6
13
.2
13
.8
Saw 21 - Items per Hour
Norm Dist Actual Dist
0
0.2
0.4
0.6
0.8
1
1.2
0
0.6
1.2
1.8
2.4 3
3.6
4.2
4.8
5.4 6
6.6
7.2
7.8
8.4 9
9.6
10
.2
10
.8
11
.4 12
12
.6
13
.2
13
.8
Saw 28 - Items per Hour
Norm Dist Actual Dist
0
0.2
0.4
0.6
0.8
1
1.2
0
0.6
1.2
1.8
2.4 3
3.6
4.2
4.8
5.4 6
6.6
7.2
7.8
8.4 9
9.6
10
.2
10
.8
11
.4 12
12
.6
13
.2
13
.8
Saw 6 - Items per Hour
Norm Dist Actual Dist
0
0.2
0.4
0.6
0.8
1
1.2
0
0.6
1.2
1.8
2.4 3
3.6
4.2
4.8
5.4 6
6.6
7.2
7.8
8.4 9
9.6
10
.2
10
.8
11
.4 12
12
.6
13
.2
13
.8
Saw Old BDL - Items per Hour
Norm Dist Actual Dist
Simulating for Better Performance of Cosira Manufacturing
PJ van Ginkel - 22106503
Page | 21
The data that was used to create the graphs above was sufficient to allocate cutting times to
the machines being simulated using the following distributions for each saw:
Saw 21: Parts leave the machine in a Poisson distribution with a mean of 25.21
minutes per part.
Saw 6: Parts leave the machine in a Poisson distribution with a mean of 21.92
minutes per part.
Saw 28: Parts leave the machine in a Poisson distribution with a mean of 22.85
minutes per part.
Saw Old BDL: Parts leave the machine in a Poisson distribution with a mean of 19.98
minutes per part.
It is important to note that these times include setup times of the machines as well as
possible maintenance that were done during the time period, making assumption 3 possible
for the simulation.
Saw 28 will however not be used for simulation purposes as was only recently converted to
a CNC Saw, and used to be run as a manual saw to cut the odd small part or batch.
CNC PLASMA MACHINES
The following graphs are similar to the graphs for the saw, and were obtained using the data
from the same timeframe as for the saws. It is clear that the plasma machines are not as
predictable in terms of cutting a part as the saws.

Simulating for Better Performance of Cosira Manufacturing
PJ van Ginkel - 22106503
Page | 22
Figure 15 - CNC Plasma Machine Performance Graphs
For the sake of the simulation, the cutting times can be approximated as follows:
Old Peddinghaus Plasma: Parts leave the machine in a Poisson distribution with a
mean of 8.80 minutes per part.
New Peddinghaus Plasma: Parts leave the machine in a Poisson distribution with a
mean of 9.07 minutes per part.
Lind Plasma: Parts leave the machine in a Poisson distribution with a mean of 7.61
minutes per part.
0
0.2
0.4
0.6
0.8
1
1.2
0
1.5 3
4.5 6
7.5 9
10
.5 12
13
.5 15
16
.5 18
19
.5 21
22
.5 24
25
.5 27
28
.5 30
31
.5 33
34
.5
Old Peddinghaus - Items per Hour
Norm Dist Actual Dist
0
0.2
0.4
0.6
0.8
1
1.2
0
1.5 3
4.5 6
7.5 9
10
.5 12
13
.5 15
16
.5 18
19
.5 21
22
.5 24
25
.5 27
28
.5 30
31
.5 33
34
.5
New Peddinghaus - Items per Hour
Norm Dist Actual Dist
0
1
2
3
4
5
0 2 4 6 8
10
12
14
16
18
20
22
24
26
28
30
32
34
Parts/Hour
Frequency
0
1
2
3
4
5
6
0 2 4 6 8
10
12
14
16
18
20
22
24
26
28
30
32
34
Parts/Hour
Frequency
0
0.2
0.4
0.6
0.8
1
1.2
0 3 6 9 12 15 18 21 24 27 30 33 36 39 42 45 48 51 54 57 60 63 66 69
LIND - Items per Hour
Norm Dist Actual Dist
0
1
2
3
4
5
0 3 6 9 12 15 18 21 24 27 30 33 36 39 42 45 48 51 54 57 60 63 66 69
Parts/Hour
Frequency

Simulating for Better Performance of Cosira Manufacturing
PJ van Ginkel - 22106503
Page | 23
As with the saws, it is important to note that these times include setup times of the machines
as well as possible maintenance that were done during the time period, making assumption
3 possible for the simulation.
ANGLE MACHINES
The angle machines are exclusively used for gantry jobs, and the following graph shows the
output of the two machines. Data from the same timeframe was used to get these graphs.
Figure 16 - Angle Machine Performance Graphs
As with the plasma machines, the angle machines does not give the most predictable
performance figures, but was also be roughly extrapolated to give the following output
distributions that was used in the simulation:
FICEP 166: Parts leave the machine in a Poisson distribution with a mean of 5.42
minutes per part.
FICEP 206: Parts leave the machine in a Poisson distribution with a mean of 6.53
minutes per part.
As with the saws and plasma machines, it is important to note that these times include setup
times of the machines as well as possible maintenance that were done during the time
period, making assumption 3 possible for the simulation.
FABRICATION
0
0.2
0.4
0.6
0.8
1
1.2
0 3 6 9 12 15 18 21 24 27 30 33 36 39 42 45 48 51 54 57 60 63 66 69
FICEP 166 - Items per Hour
Norm Dist Actual Dist
0
0.2
0.4
0.6
0.8
1
1.2
0 3 6 9 12 15 18 21 24 27 30 33 36 39 42 45 48 51 54 57 60 63 66 69
FICEP 206 - Items per Hour
Norm Dist Actual Dist
0
0.5
1
1.5
2
2.5
3
0 3 6 9 12 15 18 21 24 27 30 33 36 39 42 45 48 51 54 57 60 63 66 69
Parts/Hour
Frequency
0
1
2
3
4
5
6
7
0 3 6 9 12 15 18 21 24 27 30 33 36 39 42 45 48 51 54 57 60 63 66 69
Parts/Hour
Frequency

Simulating for Better Performance of Cosira Manufacturing
PJ van Ginkel - 22106503
Page | 24
As mentioned in a previous section, certain performance matrices were defined for
fabrication based on time studies and interviews with artisans as well as their supervisors.
Since the decision was made to only simulate four work types, a fabrication time must have
been selected for these four work types that would work in the simulation. These times are
as follows (for a generic assembly that was simulated):
Work Type Boiler Maker Time Welder Time
Structural – Normal 1h45m (Normally Distributed) 2h30m (Normally Distributed) Structural – Gantries 5h00m (Normally Distributed) 9h00m (Normally Distributed) Plate Work – Normal 12h00m (Normally Distributed) 24h00m (Normally Distributed) Plate Work - Complex 28h00m (Normally Distributed) 50h00m (Normally Distributed)
Table 5 - Work type fabrication times
The fact that the times are fluctuating (normal distribution) allows for realistic conditions as
not all assemblies are the same, however, most assemblies of a certain job type are similar
to a degree.
QUALITY CONTROL
Cosira Manufacturing does 100% inspection at two stages of production, one is just after the
boiler maker completed the assembly, and the next is just before despatch, the latter might
include client inspection as the contract requires.
According to the data analysed, the first in-line inspection rejects an average of 5% of
assemblies. When a reject occurs the boiler maker needs to redo his work at 150% of the
original duration to complete the assembly.
It was calculated that about 1% of assemblies inspected at the final inspection stage are
rejected for welding mistakes. This work must be redone by the welder at the same duration
as he originally worked to complete the job.
DESIGN AND PROBLEM SOLVING
BASE MODEL
Using all the data collected and defined in the previous section of this report, the base model
was simulated. The results from this model were then used to determine where to improve
the “process” and to compare the results from the improved model to the base model.
After running ten replications of one month each the average throughput time for work
scheduled for bay 2, was 195.6 hours, as can be seen in Appendix 4A, from being loaded
onto the machines up to the point where the jobs were ready to be dispatched. This result

Simulating for Better Performance of Cosira Manufacturing
PJ van Ginkel - 22106503
Page | 25
made a lot of sense since this had been accomplished before. It is however not the current
norm in the workshop.
SUPRISING RESULTS
Although visual inspection of the workshop would suggest that the major problem was the
time it took the artisans to do their work, the model painted a different picture where not all
artisans could be kept busy all the time. The model showed that as soon as work was
packed into packing list for fabrication it flowed relatively smooth through the rest of the
workshop, with occasional delays between boiler making and welding, and between welding
and cleaning. The graph below was taken from the report generated by Arena and shows
the value-add times for the various processes over a period of one month. Please note that
the first eight bars indicate the eight boilermakers (each assigned to his own workstation).
Figure 17 - VA Time for Workshop Processes
The simulation assigned work to the first available resource looking sequentially at the
options, that is why they are not equally busy all the time.
The reason for this discrepancy is discussed in the next section.
PRODUCTIVITY ANALYSIS
In 2009 Mr Gavin Smith, an industrial engineer working for Cosira, conducted productivity
studies by randomly walking through the workshop, and noting how many people were
adding value (busy actually working), and how many people were not adding value.
The numbers that were generated by this study was shocking and revealed that on average
only about 40% of the artisans were busy adding value at any time of day. This experiment
was repeated in 2012 after the management of Cosira announced that the company had

Simulating for Better Performance of Cosira Manufacturing
PJ van Ginkel - 22106503
Page | 26
been sold. This experiment yielded even lower value-add time than before. More people
were having small informal “meetings” rather than working/adding value.
COULD IT BE BETTER
The results from the simulation were a true revelation as to the inherent potential that there
still is to improve the throughput time of the workshop, and ultimately improving the
profitability of the organisation.
The improved models are discussed in more detail in the next sections of this report.
IMPROVED MODEL – LINE BALANCING
The following picture shows part of the report that was generated by Arena for Queues (All
reports relating to queues are included as Appendices to this report) in front of processes,
and one place where there was a serious bottleneck or delay was in the laydown are
between welding and fettling, as seen in the report.
Figure 18 - Part of Arena Generated Report 01
This clearly stood out as an area that could benefit if the resources were more balanced.
This however was not the only problem, cranes operators are not trained to recognise what
movements are more critical than others. For example, material moved from a laydown are
to a production area is more important than material moving into a laydown area.
The reason why this investigation focussed on the queues in the laydown areas is because
this is where things go wrong very easily. Steel assemblies are big and heavy, which causes
these laydown areas to become piles of steel, where the new work gets stacked on the old
work, and thus results in the new work being lifted off first as well, leaving the old work

Simulating for Better Performance of Cosira Manufacturing
PJ van Ginkel - 22106503
Page | 27
sometimes for months without moving from the same laydown area. This fact was not
modelled, but would dramatically affect the throughput time of some of the jobs.
LINE BALANCING MODEL 1
The first change that was made towards balancing the line was to add one more fettling area
and one more fettler to the line, as this also is the cheapest resource in the workshop.
Another change was to change the priority of the movement by the crane as mentioned
above, achieving this only requires some training in operating procedures.
Appendix 4B shows the results of this change on throughput time. Again ten replications of
one month each was run. This simulation yielded a throughput time of 184.6 hours, an
improvement of about 6%. This also had a tremendous impact on the time work waited in the
laydown area before fettling as can be seen in the image taken from the simulation report.
Figure 19 - Part of Arena Generated Report 02
This change in the crane behaviour did have a negative effect on the time material had to
wait to be moved from the welding area to the fettling laydown area. But as can be seen by
the results, the overall result is an improvement of the throughput time of the workshop.
This change did not affect the boiler making in any sense, and the utilisation of the boiler
makers remained unchanged.
The next area of concern was the laydown area before the welders, looking as the image
below, it does only have an average waiting time of 20 hours, the maximum waiting time for
the simulation was over 100 hours, and material waiting that long only costs the company
money.

Simulating for Better Performance of Cosira Manufacturing
PJ van Ginkel - 22106503
Page | 28
Figure 20 - Part of Arena Generated Report 03
LINE BALANCING – MODEL 2
The numbers shown in Figure 20 above regarding the wait time for jobs to go to the welding
indicated yet another resource imbalance. This resulted in another improved line balancing
model, where one welder was added, and the rules for the crane movements as explained
for the first line balancing model was expanded for the crane moving steel between the
boiler makers and the welders. The changes that were made in the line balancing 1 model
remained the same for this model.
As can be seen in Appendix 4C, this change resulted in further improvement of the
throughput time from 195.6 for the base model, and 184.6 hours for the first line balancing
model to 164.3 hours, which translates to an improvement of about 16% in throughput time.
This also reduced waiting time in the laydown area for welding by a large degree, as can be
seen in the next image, as taken from the report for the simulation.
Figure 21 - Part of Arena Generated Report 04

Simulating for Better Performance of Cosira Manufacturing
PJ van Ginkel - 22106503
Page | 29
These changes still did not address the imbalance when it comes to the utilisation of the
boiler makers as can be seen in Figure 22, showing the VA times for the various processes
in the workshop, with the first eight columns representing the times for the boiler makers.
Form this it is almost justifiable to let go one or two boiler makers is exchange for the
additional labour introduced at welding and fettling, but it is also to be noted that the next
section will focus on improving the delivery of work to the boilermakers and might yet result
in much better utilisation of the boiler maker (the most expensive worker in the workshop).
Figure 22 - VA Time for Workshop Processes 02
IMPROVED MODEL – TOC
One clear constraint in the workshop is the packing since it is the area with the largest
amount of work waiting to be processed. This however is only half accurate, since the
packing department rely on different parts coming from different machines, they can only
pack what they have available to pack. It is clear from this statement that the synchronisation
between the machines (planning of the machines) is a problem. Line balancing will not be
feasible in this case as this would influence the number of machines (high capital items).
TOC seems to be a good method to apply here.
TOC – MODEL 1
Currently the general rule is to send one job to one machine (e.g. all the plates of the job to
New Plasma, all the angles to Ficep A166, and all the sections to Saw 6) which results in all
parts waiting in a line to be processed, this created long queues of raw steel as some
machines and much shorter queues at other machines. The first idea to be simulated was to
distribute the job between all the machines, thus reducing the time a job needs to wait for a
machine to be processed.

Simulating for Better Performance of Cosira Manufacturing
PJ van Ginkel - 22106503
Page | 30
Using the initial base model as the base for this model, and ignoring the changes that were
made when using line balancing, this simulation yielded the following results:
As per Appendix 4D, throughput time improved from 195.6 hours for the base model to 185
hours for the TOC 1 model, this translates to an improvement of about 5% on throughput
time. This however did not improve the situation in the packing area; it only resulted in a
shorter wait for the machines and more effective utilisation of the machines.
TOC – MODEL 2
The problem with TOC 1 model was that it did not address the real constraint in the part
preparation are, namely the synchronisation of the parts. To understand this better, one
needs to understand the rules of planning the current workshop processes; work is being set
out for specific machines in advance, and all processes in the preparation area are
performed in the same sequence. This means then some jobs are scheduled for a machine
that is busy processing a very time consuming job, and as a result the planned job needs to
wait a long time for the machine to finish its current job. It also means that some jobs plates
will be cut way in advance to the sections or angles (as an example).This next model looked
at the time each machine would take to prepare a job and based on this, each job’s
preparation operation sequence will be different, always starting the preparation of the job at
the process with the longest lead time. The following table shows the calculation for the
different jobs’ preparation lead times per operation:
Table 6 - Preparation Times per Operation
The table shows that the sequence for the preparation operations for the different job types
are as follows:
Structural: Saw Sections → Cut Plates
Gantries: Cut Plates → Cut Angles → Saw Sections
Plate Work (Both): Cut Angles → Cut Plates → Saw Sections
Job Type Structural Gantries Plate Work - Simple Plate Work - Complex
No of Plates 4 8 10 10
Parts per Plate 20 13 4 4
Time to Process Plate Part 00:08:30 00:08:30 00:08:30 00:08:30
Total Prep Time for all Plate Parts 11:20:00 14:44:00 05:40:00 05:40:00
No of Sections 15 8 5 5
Parts per Section 5 2 4 4
Time to Process Section Part 0:15:40 0:13:25 0:13:25 0:13:25
Total Prep Time for all Section Parts 19:35:00 3:34:40 4:28:20 4:28:20
No of Angles 0 16 10 10
Parts per Angle 0 4 8 8
Time to Process Angle Part 0:05:59 0:05:59 0:05:59 0:05:59
Total Prep time for all Angle Parts 0:00:00 6:22:56 7:58:40 7:58:40

Simulating for Better Performance of Cosira Manufacturing
PJ van Ginkel - 22106503
Page | 31
These sequences are based on the average job selection for the simulation, and in reality
each job’s sequence should be individually determined.
Another change to the planning rule would be that no job’s preparation would start before
the process with the longest lead time does not have a machine available to process this job.
This means that all the jobs (job cards) will be queued in front of its slowest process, and will
only be started as soon as there is space on a machine for that process. The job cards for
the subsequent processes will be added to the queues of that process as soon as the
slowest process has started. This ensures that work will be distributed equally between
machines and will suffer the shortest possible waiting time before being processed.
These rules were applied to the base model, again ignoring any previous changes to the
model and according to Appendix 4E yielded an improvement in throughput time from 195.6
hours for the base model to 184.1 hours for this improved model; which translates to an
improvement of 6% in throughput time.
Although some parts still waited a long time to be packed, it did decrease the amount of
material in the CNC area (waiting on the conveyors) and increased the control over material
being prepared.
Figure 23 - VA Time for Workshop Processes 03
Figure 23 above also shows some improvement in the utilisation of the boiler makers when
compared to Figure 22.
FINAL MODEL – A HOLISTIC IMPROVEMENT
For the final model, the TOC 2 model, which focussed on the synchronisation of preparation
functions were combined with the Line Balancing 2 Model, which focussed on reducing the
laydown/wait times after boiler making and welding.

Simulating for Better Performance of Cosira Manufacturing
PJ van Ginkel - 22106503
Page | 32
Appendix 4F shows the resulting average throughput time for the ten replications over a one
month period and yields an average throughput time for work scheduled for bay 2 of 154.4
hours. Which is a 21% improvement from the base model’s 195.6 hours.
DESIGN AND SOLUTION EVALUATION
The final model as discussed above included the following operational changes:
Operational Rule Changes:
o Crane operators to focus on moving work towards waiting processes, before
moving work from processes to laydown areas
o Preparation process sequence to be changed to start with sequence with
longest lead time, and end with process with shortest lead time, to be
calculated per job
o Job cards to be queued before each process and sent to the first available
machine for that process to ensure faster processing times and better
distribution of workload to machines
Operation Structure Changes:
o One additional welder and one additional fettler per workshop fabrication bay
Most of the changes are operating procedure changes and can be implemented through
some basic training.
PROJECT IMPLEMENATION AND BENEFITS
IMPLEMENTATION
The implementation of this proposal will be very simple and could include the following
activities:
Training of Crane Operators: This should not take more than 2 to 3 hours per crane operator
and can be done with a group of crane operators at once, depending on operational needs of
the manufacturing department.
Training of Preparation Programmer: This training is more involved as it would include the
calculations of lead times for each job, and then how to create and queue the job cards for the
new procedure. This would take about one week per programmer and should be done one-
on-one and not in a group
Employing of Extra Staff: This part of the improvement is the only part that will cost the
company money, the improvement gained from this would definitely be worth it. Since there
are many people looking for employment in the sector, finding the correct candidate should
not take long.

Simulating for Better Performance of Cosira Manufacturing
PJ van Ginkel - 22106503
Page | 33
IMPROVEMENT EXPECTATION
Like any new procedure, results will not be evident overnight, but if these changes are
implemented, the throughput time for jobs in the workshop could increase by as much as
21% creating the opportunity to introduce more work into the workshop, improving customer
satisfaction and improving possible profitability.
CONCLUSION
This report showed the results of simulation models of Cosira’s manufacturing facility and
the possible improvements that can be seen within the facility by implementing small yet
effective changes in the operation. It however remains to be said that these are not the only
ways Cosira could improve throughput and production figures and that these changes will
only result in improvements if it is supported by top management and effectively “enforced”
to the general worker level.

Simulating for Better Performance of Cosira Manufacturing
PJ van Ginkel – 22106503
Page | 34
BIBLIOGRAPHY
Answers.com. (n.d.). Job Shop: Definition from Answers.com. Retrieved May 7, 2012, from
Answers.com: http://www.answers.com/topic/job-shops#ixzz1uACTOIXc
Aquilano, Chase, & Jacobs. (2006). Operations Management of Competitve Advantage with Global
Cases. New York: McGraw-Hill Irwin.
Collins, J. (2009). How the Mighty Fall and Why Some Companies Never Give In. Random House
Business Books.
Cosira International. (2012). Milestones and Track Record. (virtuosa) Retrieved from Cosira Group:
www.cosiragroup.com/about-us/milestones-and-track-record/
Falkenauer, E. (n.d.). Line Blancing in the Real World. International Conference on Product Lifecycle
Management (p. 10). Brussels: Optimal Design.
Goldratt, E. M. (2004). The Goal: a Process of Ongoing Improvement. Gonldratt Group.
Hewitt, S. T. (n.d.). Interfaces to Enhance User-Directed Experimentation with Simulation Models of
Discrete-Event Systems. Maryland: University of Maryland.
Kelton, W. D., Sadowski, R. P., & Sturrock, D. T. (2004). Simulation with Arena. New York: McGraw-
Hill.
Lean Manufacturing Japan.com. (n.d.). Lean Manufacturing. Retrieved May 7, 2012, from Lean
Manufacturing: http://www.lean-manufacturing-japan.com/
Lean.org. (n.d.). What is Lean - Priciples. Retrieved May 7, 2012, from Lean Enterprise Institute:
http://www.lean.org/WhatsLean/Principles.cfm
NetMBA.com. (n.d.). Net MBA - Operations - Process Strcture. Retrieved May 7, 2012, from Net MBA
Business Knowledge Centre: http://www.netmba.com/operations/process/structure/
Six Sigma Material. (n.d.). Six Sigma Material - Line Balancing. Retrieved May 7, 2012, from Six
Sigma Material: http://www.six-sigma-material.com/Line-Balancing.html
Tompkins, J. A., White, J. A., Boser, Y. A., & Tanchoco, J. M. (2003). Facilities Planning. Hoboken:
John Wiley & Sons, Inc.
Wikipedia.org. (n.d.). Wikipedia - Theory of Constraints. Retrieved May 7, 2012, from Wikipedia, the
Free Encyclopedia: http://en.wikipedia.org/wiki/Theory_of_constraints
Wikipedia.org. (n.d.). Wikipedia.org - Fabrication (Steel). Retrieved May 7, 2012, from Wikipedia, the
Free Encyclopedia: http://en.wikipedia.org/wiki/Fabrication_(metal)

Simulating for Better Performance of Cosira Manufacturing
PJ van Ginkel – 22106503
Page | 35
APPENDICES
APPENDIX 1 – MATERIAL FLOW DIAGRAM

Simulating for Better Performance of Cosira Manufacturing
PJ van Ginkel - 22106503
Page | 36
APPENDIX 2 – CNC UPDATE FILES
TOTALS TOTALS
Mass Items Mass Items Mass Items Mass Items Mass Items Mass Items Mass Items Mass Items Mass Items Mass Items Mass Items Mass Items Mass Items Mass Items Mass Items Mass Items Mass Items Mass Items Mass Items Mass Items Mass Items Mass Items Mass Items Mass Items Mass Items Mass Items Mass Items Mass Items Mass Items Mass Items Mass Items Mass Items
Day Shift 0 0 9 332 4 7 811 1 3 800 20 5 052 9 6 071 40 3 476 73 2 788 70 8 656 36 6 526 5 758 24 0 0 6 887 90 5 444 53 5 865 32 12 754 44 0 0 0 0 0 0 0 0 0 0 0 0 0 0 0 0 0 0 0 0 0 0 0 0 85 220 501
Night Shift 0 0 16 650 9 14 397 7 0 0 8 971 50 10 400 23 5 845 51 10 480 44 1 327 55 15 899 32 19 763 13 13 735 46 18 664 26 9 257 40 12 758 66 13 583 30 0 0 0 0 0 0 0 0 0 0 0 0 0 0 0 0 0 0 0 0 0 0 19 819 3 171 729 492
Day Shift 0 0 0 0 0 0 0 0 0 0 0 0 0 0 0 0 0 0 0 0 0 0 0 0 0 0 0 0 0 0 0 0 1 585 23 4 862 75 576 38 0 0 3 387 101 611 24 1 898 23 176 6 5 546 14 702 22 2 273 36 2 804 49 21 616 362
Night Shift 0 0 0 0 0 0 0 0 0 0 0 0 0 0 0 0 0 0 0 0 0 0 0 0 0 0 0 0 0 0 4 091 35 6 614 66 2 127 78 1 555 16 6 956 69 4 932 112 4 970 78 1 758 50 3 624 56 5 121 68 3 353 64 4 333 96 1 461 39 49 434 788
Day Shift 0 0 0 0 0 0 0 0 0 0 0 0 0 0 0 0 0 0 297 43 892 202 0 0 198 51 260 126 184 64 0 0 432 844 544 1 087 532 641 616 323 594 130 734 115 354 151 0 0 152 73 173 86 275 676 558 98 6 237 4 612
Night Shift 0 0 0 0 0 0 0 0 0 0 0 0 0 0 0 0 0 0 0 0 0 0 0 0 0 0 0 0 0 0 0 0 0 0 0 0 0 0 0 0 0 0 0 0 0 0 0 0 0 0 0 0 0 0 0 0 0 0
Day Shift 0 0 0 0 0 0 0 0 1 906 8 1 006 19 2 779 16 6 433 27 2 961 21 4 625 19 1 210 13 7 077 64 7 243 43 5 040 53 4 974 50 3 324 4 2 517 6 3 276 21 6 668 18 5 974 14 3 146 113 5 742 121 6 876 44 2 768 25 3 592 20 3 134 16 4 020 34 6 759 41 96 291 769
Night Shift 0 0 0 0 0 0 0 0 6 657 31 13 664 34 7 430 42 7 858 37 4 392 25 6 731 85 5 102 60 0 0 10 569 51 6 722 42 5 414 57 8 460 17 9 235 18 7 960 9 11 884 36 12 649 51 4 073 148 12 083 38 9 317 33 15 032 12 10 986 30 9 153 29 15 934 37 5 380 64 201 305 922
Day Shift 0 0 0 0 0 0 638 48 1 906 8 1 453 129 974 19 1 205 146 8 171 63 0 0 0 0 0 0 0 0 0 0 0 0 0 0 5 024 4 5 130 3 4 197 4 8 272 7 1 242 4 0 0 0 0 0 0 0 0 0 0 589 7 4 344 71 38 801 442
Night Shift 0 0 0 0 0 0 0 0 0 0 5 264 73 9 552 28 8 023 49 0 0 21 633 27 0 0 0 0 0 0 0 0 0 0 0 0 18 156 11 14 836 10 15 454 4 18 769 36 6 461 37 0 0 0 0 0 0 0 0 0 0 9 284 73 8 182 119 127 432 348
Day Shift 1 200 102 698 38 740 41 1 256 31 960 72 1 256 33 1 891 90 1 767 165 960 469 536 40 937 31 1 567 69 500 95 1 081 126 1 768 31 1 170 133 464 22 1 032 20 408 57 751 178 0 0 1 274 105 1 854 125 2 529 105 890 43 1 294 45 1 393 97 1 361 166 1 828 46 31 537 2 529
Night Shift 0 0 0 0 0 0 0 0 0 0 1 857 115 1 162 369 398 84 872 63 2 324 79 354 119 1 452 92 2 285 82 0 0 2 332 126 1 231 66 1 742 106 1 470 213 905 318 0 0 1 136 168 1 961 50 1 000 55 382 26 1 326 41 1 438 190 1 323 197 919 32 26 950 2 559
Day Shift 0 0 1 316 13 680 5 1 216 25 0 0 1 035 13 840 11 0 0 0 0 697 38 1 467 73 230 100 614 342 786 235 652 120 930 132 649 24 652 306 1 554 70 1 657 206 2 789 134 1 489 348 682 92 448 170 714 340 517 562 570 115 2 280 404 22 184 3 474
Night Shift 0 0 0 0 0 0 0 0 0 0 2 511 351 958 298 0 0 977 590 880 48 1 794 88 544 340 403 208 1 294 144 678 234 1 337 119 1 200 44 700 262 3 076 234 1 688 312 2 672 270 9 015 152 1 286 708 2 059 88 1 366 437 1 386 155 2 352 423 1 689 302 38 176 5 505
Day Shift 590 34 1 240 71 261 27 0 0 0 0 0 0 424 239 0 0 696 54 231 46 0 0 0 0 2 452 46 0 0 234 66 1 687 95 0 0 0 0 0 0 1 253 53 664 44 1 917 155 3 233 154 394 10 628 124 589 208 0 0 1 644 468 16 493 1 426
Night Shift 0 0 0 0 0 0 0 0 0 0 237 130 1 400 19 605 19 1 246 59 1 000 41 0 0 0 0 0 0 0 0 1 466 48 1 468 41 0 0 605 37 0 0 0 0 576 47 2 204 84 608 275 713 164 0 0 0 0 300 250 1 193 152 0 0
Day Shift 0 0 0 0 0 0 0 0 0 0 1 128 10 149 600 201 1 275 5 260 124 1 015 30 998 124 708 120 2 518 325 2 088 371 3 489 261 1 225 544 1 621 132 1 205 194 988 88 2 702 192 680 66 4 024 156 5 108 40 5 010 112 3 105 72 2 501 23 2 341 367 1 083 126 48 064 5 226
Night Shift 0 0 0 0 0 0 0 0 0 0 0 0 0 0 0 0 0 0 0 0 0 0 0 0 0 0 0 0 0 0 0 0 0 0 0 0 0 0 0 0 0 0 0 0 0 0 0 0 0 0 0 0 0 0 0 0 0 0
Day Shift 0 0 571 104 676 15 0 0 0 0 2 557 132 2 000 38 1 189 102 2 529 46 2 529 45 2 278 34 750 66 1 290 154 5 520 325 1 554 61 1 160 208 660 108 1 071 30 4 251 177 841 191 799 243 1 853 273 3 943 159 0 0 5 442 121 5 442 113 4 178 189 6 187 253 53 083 2 934
Night Shift 0 0 0 0 0 0 0 0 0 0 0 0 0 0 0 0 0 0 0 0 0 0 0 0 0 0 0 0 0 0 0 0 0 0 0 0 0 0 0 0 0 0 0 0 0 0 0 0 0 0 0 0 0 0 0 0 0 0
TOTAL 0 0 0 0 1 200 102 1 288 72 29 849 242 25 081 86 6 614 165 25 748 139 49 074 1 159 38 756 1 968 40 140 2 322 37 623 1 176 65 324 569 36 183 819 24 996 923 54 204 1 544 38 179 1 420 40 770 1 318 51 714 1 357 50 467 1 406 44 846 2 382 52 391 1 822 61 377 1 454 34 425 1 722 48 457 1 719 38 592 1 889 31 496 712 39 272 1 385 29 781 1 565 49 133 2 666 66 130 2 267 1 034 552 32 889GRAND
TOTAL
Day Shift 0 0 0 0 1 200 102 698 38 11 959 162 10 423 52 6 614 165 10 120 58 15 141 433 11 985 922 12 776 2 089 28 113 330 16 626 211 9 170 539 9 265 445 19 831 1 131 20 906 1 194 17 888 721 19 857 954 13 520 1 161 17 148 1 773 19 517 1 214 20 062 933 13 911 896 16 307 1 162 21 390 614 9 292 356 19 845 685 13 862 919 15 607 1 590 25 843 1 088 403 033 20 849 Day Shift
Night Shift 0 0 0 0 0 0 0 0 16 650 9 14 397 7 0 0 15 628 81 33 696 596 24 947 788 26 759 214 7 568 733 47 467 271 27 013 280 15 731 478 31 921 367 17 273 226 21 182 483 28 702 267 36 947 245 27 093 572 32 874 608 40 062 468 19 274 735 28 029 318 13 361 846 21 097 182 18 799 576 15 330 438 33 226 826 37 450 559 615 026 10 614 Night Shift
Day Shift 1 898 140 Day Shift 79 018 3 881 Day Shift 121 799 4 571 Day Shift 120 322 8 093
Night Shift 0 0 Night Shift 132 077 1 695 Night Shift 168 155 2 838 Night Shift 212 981 3 213
Totals 1 898 140 Totals 211 095 5 576 Totals 289 954 7 409 Totals 333 303 11 306
New
Peddinghaus
CNC Machines - Tonnage Cut Per Day / Shift
Old Plasma
Lind
03-Jan02-Jan01-Jan
BDL 1250/9
10-Jan 11-Jan 12-Jan04-Jan 05-Jan 06-Jan 07-Jan
Friday Saturday
Ficep 116
Ficep 206
Sunday Monday Tuesday Wednesday
Saw 21
Saw 28
Tippo
BDL 1250/9
BDL 1000
08-Jan
Sunday Monday
09-Jan
Ficep 206
Ficep 166
Lind
Old Plasma
BDL 1000
New
Peddinghaus
Sunday Monday
Tippo
Saw 28
Saw 21
ThursdayTuesday Wednesday Thursday Friday Saturday
24-Jan 25-Jan23-Jan18-Jan
Thursday
19-Jan
Monday Tuesday Wednesday
20-Jan 21-Jan 22-Jan13-Jan 14-Jan 15-Jan 16-Jan 17-Jan
Tuesday Wednesday Friday Saturday Sunday
31-Jan
Thursday Sunday Monday TuesdaySaturday
28-Jan
Friday
29-Jan 30-Jan26-Jan 27-Jan
TOTALS TOTALS
Mass Items Mass Items Mass Items Mass Items Mass Items Mass Items Mass Items Mass Items Mass Items Mass Items Mass Items Mass Items Mass Items Mass Items Mass Items Mass Items Mass Items Mass Items Mass Items Mass Items Mass Items Mass Items Mass Items Mass Items Mass Items Mass Items Mass Items Mass Items Mass Items Mass Items
Day Shift 5 621 12 10 317 7 10 066 18 5 491 37 0 0 1 555 4 0 0 8 367 37 1 717 57 805 12 2 488 32 11 171 23 918 23 13 502 49 2 660 2 5 751 7 11 559 46 6 371 31 3 963 25 7 166 36 3 130 3 6 377 30 4 727 42 2 812 32 10 182 56 8 390 43 14 796 45 159 902 709
Night Shift 35 164 26 14 095 18 28 393 60 9 533 34 0 0 4 749 63 4 188 42 5 665 43 1 490 36 3 086 40 12 548 57 3 081 72 3 079 4 10 348 27 7 821 6 7 980 6 7 995 20 3 206 36 1 349 33 11 720 25 2 264 18 6 842 74 831 72 0 0 0 0 12 244 28 7 358 20 4 898 91 209 927 951
Day Shift 3 735 46 2 831 17 35 5 0 0 392 56 2 853 68 1 144 44 873 27 821 35 1 366 33 2 211 39 2 565 67 1 487 60 1 564 84 4 746 92 1 425 31 970 33 776 27 567 18 2 919 54 782 10 272 6 99 33 0 0 0 0 2 310 46 1 065 22 811 40 38 619 993
Night Shift 1 912 66 3 752 48 1 939 45 140 20 0 0 910 67 2 502 68 2 157 65 1 631 46 2 177 39 3 530 70 1 536 63 323 84 4 976 64 1 720 40 1 471 62 6 998 54 629 14 0 0 1 485 61 456 24 355 10 0 0 252 2 0 0 0 0 1 743 50 4 868 91 297 99 47 759 1 252
Day Shift 499 75 668 122 100 50 220 125 0 0 562 281 714 105 684 291 693 241 488 212 327 65 0 0 364 149 617 77 663 589 742 485 248 124 602 257 111 222 196 450 556 234 6 183 389 1 938 12 585 117 0 0 0 0 604 325 1 285 24 965 116 20 614 5 137
Night Shift 0 0 0 0 0 0 0 0 0 0 0 0 0 0 0 0 0 0 0 0 0 0 0 0 0 0 0 0 0 0 0 0 0 0 0 0 0 0 0 0 0 0 0 0 0 0 0 0 0 0 0 0 0 0 0 0 0 0 0 0
Day Shift 3 666 48 4 468 25 3 241 25 4 356 28 621 37 6 265 40 7 384 57 7 159 48 17 828 33 2 428 13 5 894 25 3 926 34 5 186 6 3 293 25 3 581 32 2 215 10 4 494 12 2 691 13 5 826 30 1 997 25 7 195 50 2 423 34 2 828 38 8 349 15 10 280 9 4 721 85 5 477 78 5 425 37 143 217 912
Night Shift 6 245 75 6 145 54 9 353 46 9 962 27 11 251 32 10 781 31 11 630 55 20 118 41 8 663 25 11 542 26 6 565 38 5 148 66 14 630 11 7 980 6 8 686 50 7 073 65 10 340 36 10 363 43 8 552 37 8 647 25 4 815 46 8 018 73 14 228 36 7 067 53 0 0 0 0 5 553 42 14 526 74 12 367 39 260 248 1 152
Day Shift 4 982 66 3 404 35 2 087 31 5 185 25 1 995 88 3 811 60 7 749 48 5 082 32 2 756 65 3 717 21 4 179 17 6 024 36 4 395 40 7 797 54 7 226 44 1 519 64 4 271 35 1 918 31 760 98 7 494 19 2 103 82 6 505 23 1 899 69 2 065 99 265 19 1 318 120 984 136 6 495 56 107 985 1 513
Night Shift 16 955 43 13 744 43 9 460 32 17 777 48 17 288 25 8 375 61 25 147 48 10 312 47 8 189 51 7 952 45 4 747 30 1 258 70 12 133 38 17 082 57 13 790 40 8 770 35 3 131 79 3 046 101 1 622 107 9 514 48 9 213 60 9 232 45 6 208 34 1 061 24 671 97 12 208 16 5 423 74 2 430 84 256 738 1 482
Day Shift 1 570 30 968 249 336 182 629 12 649 6 1 564 43 1 537 39 878 180 1 211 106 46 4 938 57 1 334 44 923 164 1 155 22 0 0 0 0 0 0 0 0 0 0 1 079 85 1 241 66 2 092 76 418 13 0 0 0 0 1 674 85 509 142 870 126 21 621 1 731
Night Shift 1 366 239 1 224 93 77 52 2 347 87 1 765 46 1 771 45 744 184 2 284 61 1 306 60 0 0 1 175 59 1 137 39 2 339 74 1 549 348 728 55 0 0 0 0 0 0 0 0 2 207 84 1 479 65 1 620 51 1 662 167 6 878 93 0 0 0 0 47 7 1 454 258 1 561 312 36 720 2 479
Day Shift 1 368 255 1 912 642 331 311 1 467 39 300 175 250 517 767 37 1 650 119 1 494 95 1 101 44 3 412 402 3 082 36 938 144 1 223 631 1 047 180 2 815 117 637 36 1 019 28 790 88 1 547 101 328 163 333 190 869 256 292 44 0 0 0 0 952 170 1 733 245 2 212 328 33 869 5 393
Night Shift 1 796 451 2 319 363 3 802 433 1 676 110 492 260 600 532 875 72 4 267 252 2 047 187 2 468 490 16 848 12 1 651 622 1 624 212 2 111 239 2 283 139 1 695 52 1 810 98 973 85 1 303 148 354 149 540 202 594 69 612 102 0 0 0 0 879 157 1 299 232 4 690 481 59 608 6 149
Day Shift 0 0 0 0 0 0 1 061 67 995 295 1 256 290 786 69 298 155 656 186 0 0 962 102 735 49 562 51 617 71 1 000 25 285 237 300 225 860 264 0 0 0 0 191 12 930 160 1 553 52 864 30 104 48 0 0 0 0 0 0 441 142 14 456 2 530
Night Shift 376 73 0 0 1 346 102 991 64 0 0 405 88 782 45 2 222 55 305 21 545 45 700 56 1 632 20 0 0 1 856 61 916 599 2 005 67 2 516 71 2 708 162 2 518 81 2 023 85 1 864 119 1 801 54 1 418 55 0 0 0 0 0 0 162 78 822 72 29 913 2 073
Day Shift 1 243 381 4 800 128 1 102 238 1 305 162 1 509 112 1 720 400 1 620 158 2 495 79 6 300 160 1 215 201 1 815 268 620 191 1 093 383 2 715 585 1 211 271 1 400 142 2 400 172 5 897 144 5 466 124 910 104 2 225 304 680 130 1 675 856 1 400 175 1 250 128 550 161 2 108 231 1 078 210 400 47 58 202 6 645
Night Shift 0 0 0 0 0 0 0 0 0 0 0 0 0 0 0 0 0 0 0 0 0 0 0 0 0 0 0 0 0 0 0 0 0 0 0 0 0 0 7 699 145 2 302 534 2 823 108 989 686 1 659 767 0 0 0 0 596 424 0 0 502 153 16 570 2 817
Day Shift 7 261 273 4 078 280 554 81 308 66 1 570 230 2 614 401 1 989 293 1 962 288 1 131 534 1 005 144 1 130 205 583 166 1 654 931 0 0 0 0 0 0 0 0 0 0 0 0 0 0 0 0 0 0 0 0 0 0 0 0 0 0 0 0 0 0 0 0 25 839 3 892
Night Shift 0 0 0 0 0 0 0 0 0 0 0 0 0 0 0 0 0 0 0 0 0 0 0 0 0 0 0 0 0 0 0 0 0 0 0 0 0 0 0 0 0 0 0 0 0 0 0 0 0 0 0 0 0 0 0 0 0 0 0 0
TOTAL 90 024 2 113 75 629 2 153 75 018 1 723 62 483 956 38 435 1 306 47 580 2 979 71 267 1 388 76 744 1 837 58 290 1 930 39 396 1 371 64 445 1 511 19 231 666 43 374 2 792 59 675 2 329 61 179 1 802 67 651 2 109 49 192 914 50 308 1 105 41 796 972 43 007 1 516 53 415 1 897 53 310 1 754 55 805 2 449 39 687 1 727 17 556 356 14 578 318 57 139 1 842 55 611 1 727 59 982 2 2681 541 807 47 810
GRAND
TOTAL
Day Shift 26 210 1 140 34 350 1 534 20 648 953 18 996 499 6 644 648 18 733 1 802 24 613 805 29 421 1 118 34 003 1 318 11 626 686 17 370 1 087 10 675 449 17 898 1 788 27 717 1 586 17 648 1 248 34 012 961 11 104 439 23 004 516 23 311 551 16 177 832 20 561 909 25 683 953 18 904 1 266 13 898 519 16 391 284 13 907 221 23 869 1 118 20 521 900 31 974 795 609 868 26 925 Day Shift
Night Shift 63 438 900 41 279 619 53 024 668 41 435 326 30 796 363 27 186 799 45 086 469 44 803 509 23 326 405 27 225 640 45 413 266 7 821 168 23 282 933 31 341 672 40 675 468 32 438 312 35 783 183 23 928 254 15 777 259 24 312 603 30 640 891 24 833 522 33 547 1 077 23 507 1 123 1 061 24 671 97 33 270 724 34 928 749 26 745 1 259 887 570 16 282 Night Shift
Day Shift 100 204 4 126 Day Shift 142 410 7 464 Day Shift 142 058 6 987 Day Shift 134 925 5 314
Night Shift 199 176 2 513 Night Shift 243 835 3 451 Night Shift 195 268 2 990 Night Shift 153 677 4 499
Totals 100 204 6 639 Totals 386 245 10 915 Totals 337 326 9 977 Totals 288 602 9 813
CNC Machines - Tonnage Cut Per Day / Shift
Old Plasma
Lind
03-Feb02-Feb01-Feb
BDL 1250/9
10-Feb 11-Feb 12-Feb04-Feb 05-Feb 06-Feb 07-Feb
Friday Saturday
Ficep 116
Ficep 206
Wednesday Thursday Friday Saturday
Saw 21
Saw 28
Tippo
BDL 1250/9
BDL 1000
08-Feb
Wednesday
New
Peddinghaus
Sunday Monday TuesdayWednesday Thursday
Tippo
Saw 28
Saw 21
09-Feb
Sunday Monday Tuesday
13-Feb 14-Feb
Ficep 206
Ficep 166
Lind
Old Plasma
BDL 1000
New
Peddinghaus
24-Feb 25-Feb23-Feb18-Feb
Sunday
19-Feb
Thursday Friday Saturday
20-Feb 21-Feb 22-Feb
Saturday Monday Tuesday Wednesday
15-Feb 16-Feb 17-Feb
FridayThursday Sunday
26-Feb 27-Feb
WednesdayTuesday
28-Feb
Monday
29-Feb
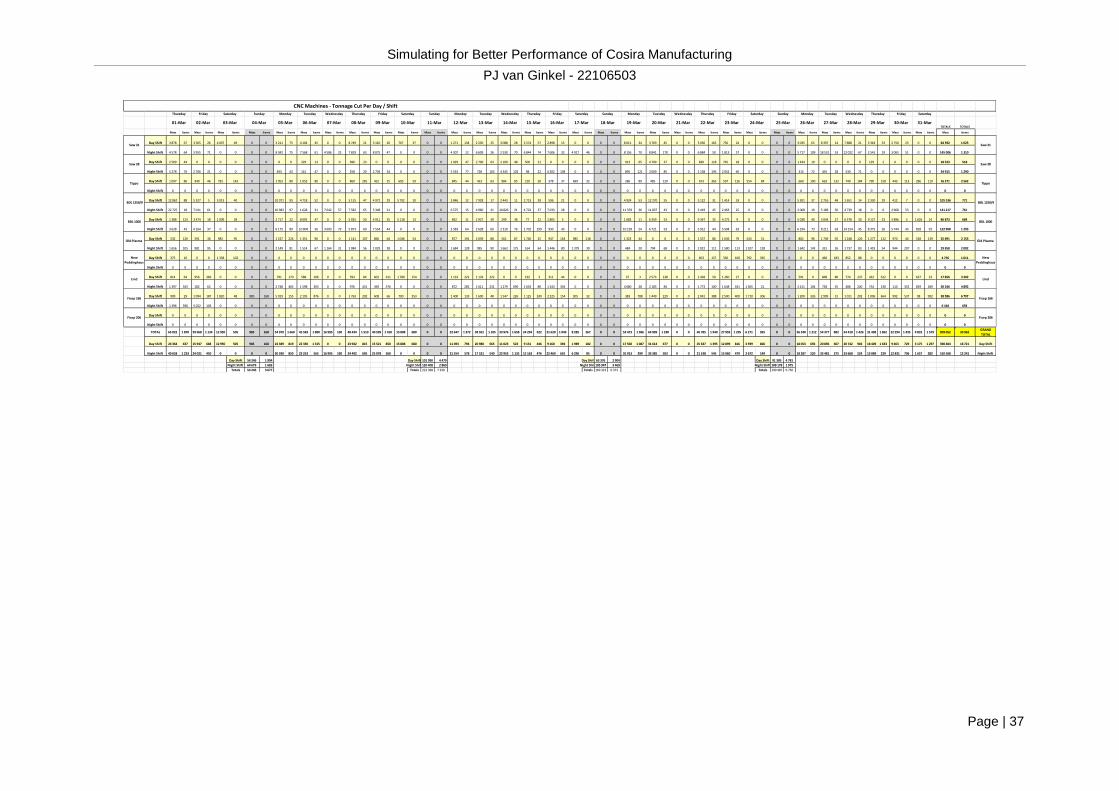
Simulating for Better Performance of Cosira Manufacturing
PJ van Ginkel - 22106503
Page | 37
TOTALS TOTALS
Mass Items Mass Items Mass Items Mass Items Mass Items Mass Items Mass Items Mass Items Mass Items Mass Items Mass Items Mass Items Mass Items Mass Items Mass Items Mass Items Mass Items Mass Items Mass Items Mass Items Mass Items Mass Items Mass Items Mass Items Mass Items Mass Items Mass Items Mass Items Mass Items Mass Items Mass Items Mass Items
Day Shift 3 878 67 3 565 26 4 007 49 0 0 3 211 75 4 104 45 0 0 8 749 21 3 110 20 767 37 0 0 1 271 134 2 230 25 3 088 28 2 574 57 2 898 15 0 0 0 0 8 011 34 3 769 45 0 0 3 036 165 736 24 0 0 0 0 3 035 65 8 397 14 7 888 21 3 318 33 2 750 23 0 0 84 392 1 023
Night Shift 4 578 64 3 955 71 0 0 0 0 8 042 75 7 568 61 4 586 23 7 819 63 8 075 47 0 0 0 0 4 307 12 6 609 26 2 530 70 6 844 74 7 606 32 4 917 46 0 0 8 156 70 8 841 170 0 0 6 884 50 1 813 57 0 0 0 0 5 717 109 18 531 53 12 022 67 2 541 19 3 065 51 0 0 145 006 1 310
Day Shift 2 509 44 0 0 0 0 0 0 0 0 229 13 0 0 696 23 0 0 0 0 0 0 1 029 47 2 700 63 2 100 48 500 21 0 0 0 0 0 0 913 65 4 709 37 0 0 830 118 745 18 0 0 0 0 1 434 19 0 0 0 0 129 2 0 0 0 0 18 523 518
Night Shift 5 278 70 2 706 21 0 0 0 0 493 43 141 47 0 0 258 20 2 703 34 0 0 0 0 5 533 77 728 103 4 345 103 98 22 4 202 138 0 0 0 0 895 121 3 009 85 0 0 1 138 195 2 052 40 0 0 0 0 315 72 491 28 530 71 0 0 0 0 0 0 34 915 1 290
Day Shift 1 097 86 940 46 781 143 0 0 1 053 80 1 053 80 0 0 860 281 452 25 605 59 0 0 845 44 423 63 984 85 210 30 378 37 699 32 0 0 286 89 485 120 0 0 673 365 597 126 554 84 0 0 660 100 663 132 740 184 790 158 443 113 286 119 16 271 2 562
Night Shift 0 0 0 0 0 0 0 0 0 0 0 0 0 0 0 0 0 0 0 0 0 0 0 0 0 0 0 0 0 0 0 0 0 0 0 0 0 0 0 0 0 0 0 0 0 0 0 0 0 0 0 0 0 0 0 0 0 0 0 0 0 0 0 0
Day Shift 12 862 88 5 327 5 3 013 40 0 0 10 071 93 4 718 52 0 0 5 115 47 4 972 29 5 792 10 0 0 3 846 12 7 928 17 2 443 11 2 713 39 596 21 0 0 0 0 4 924 53 12 270 55 0 0 5 122 31 1 414 33 0 0 0 0 5 301 37 2 716 48 1 651 14 2 330 29 412 7 0 0 105 536 771
Night Shift 22 725 18 7 011 61 0 0 0 0 10 983 97 1 628 31 7 642 57 7 582 65 5 348 21 0 0 0 0 6 575 15 4 960 21 10 826 21 4 722 37 7 033 28 0 0 0 0 11 559 36 11 837 43 0 0 3 419 45 2 463 25 0 0 0 0 2 008 19 5 189 50 4 739 18 0 0 2 968 53 0 0 141 217 761
Day Shift 1 388 123 3 474 18 1 009 28 0 0 2 717 22 8 092 47 0 0 5 025 50 4 911 35 5 118 13 0 0 692 11 2 927 39 299 38 77 22 1 805 5 0 0 0 0 1 683 11 6 359 53 0 0 9 347 35 4 275 9 0 0 0 0 5 030 40 3 044 27 6 578 30 9 127 23 3 896 5 1 626 14 86 873 684
Night Shift 3 628 43 4 164 37 0 0 0 0 6 175 89 10 804 56 3 603 79 5 873 60 7 554 44 0 0 0 0 2 583 64 2 628 69 2 310 76 1 702 199 930 43 0 0 0 0 10 139 24 6 721 53 0 0 5 912 44 5 504 63 0 0 0 0 6 194 73 8 211 63 14 154 45 8 375 26 5 744 43 818 93 122 908 1 293
Day Shift 532 120 591 36 982 95 0 0 1 527 224 1 351 96 0 0 1 141 107 866 64 1 046 54 0 0 877 191 2 039 88 562 87 1 740 25 947 118 985 118 0 0 1 323 44 0 0 0 0 1 557 86 1 036 79 543 51 0 0 802 96 1 749 92 1 248 126 1 277 112 970 44 528 139 25 691 2 153
Night Shift 1 656 105 981 95 0 0 0 0 2 149 81 1 514 67 1 164 31 1 984 56 1 029 38 0 0 0 0 1 684 128 985 90 1 663 175 164 64 1 446 80 1 379 39 0 0 484 20 794 68 0 0 2 022 111 1 580 113 1 107 128 0 0 1 642 143 331 26 1 737 83 1 419 54 944 207 0 0 29 858 2 002
Day Shift 375 16 0 0 1 338 102 0 0 0 0 0 0 0 0 0 0 0 0 0 0 0 0 0 0 0 0 0 0 0 0 0 0 0 0 0 0 0 0 0 0 0 0 603 157 336 100 792 365 0 0 0 0 460 183 852 88 0 0 0 0 0 0 4 756 1 011
Night Shift 0 0 0 0 0 0 0 0 0 0 0 0 0 0 0 0 0 0 0 0 0 0 0 0 0 0 0 0 0 0 0 0 0 0 0 0 0 0 0 0 0 0 0 0 0 0 0 0 0 0 0 0 0 0 0 0 0 0 0 0 0 0 0 0
Day Shift 814 64 956 366 0 0 0 0 791 170 588 106 0 0 593 84 602 611 1 780 154 0 0 1 133 222 1 133 222 0 0 192 3 311 44 0 0 0 0 37 3 2 573 138 0 0 2 428 50 1 260 27 0 0 0 0 591 9 868 80 774 237 432 612 0 0 637 33 17 856 3 202
Night Shift 1 397 343 182 62 0 0 0 0 2 748 465 1 598 303 0 0 976 431 369 376 0 0 0 0 872 282 1 611 231 1 279 690 1 633 80 1 243 334 0 0 0 0 4 680 28 2 183 84 0 0 1 773 100 1 648 181 1 565 21 0 0 2 411 104 728 55 486 240 754 130 110 352 839 189 30 246 4 892
Day Shift 909 29 1 094 187 1 820 48 985 168 5 019 155 2 195 876 0 0 1 763 202 608 66 700 353 0 0 1 400 133 1 600 48 1 547 226 1 125 249 2 225 154 305 32 0 0 383 788 1 449 229 0 0 2 041 388 2 500 400 1 710 306 0 0 1 200 326 2 999 31 1 011 202 1 006 664 992 537 98 992 38 586 6 797
Night Shift 1 396 590 5 022 103 0 0 0 0 0 0 0 0 0 0 0 0 0 0 0 0 0 0 0 0 0 0 0 0 0 0 0 0 0 0 0 0 0 0 0 0 0 0 0 0 0 0 0 0 0 0 0 0 0 0 0 0 0 0 0 0 0 0 6 418 693
Day Shift 0 0 0 0 0 0 0 0 0 0 0 0 0 0 0 0 0 0 0 0 0 0 0 0 0 0 0 0 0 0 0 0 0 0 0 0 0 0 0 0 0 0 0 0 0 0 0 0 0 0 0 0 0 0 0 0 0 0 0 0 0 0 0 0
Night Shift 0 0 0 0 0 0 0 0 0 0 0 0 0 0 0 0 0 0 0 0 0 0 0 0 0 0 0 0 0 0 0 0 0 0 0 0 0 0 0 0 0 0 0 0 0 0 0 0 0 0 0 0 0 0 0 0 0 0 0 0 0 0 0 0
TOTAL 65 022 1 870 39 968 1 134 12 950 505 985 168 54 979 1 669 45 583 1 880 16 995 190 48 434 1 510 40 599 1 410 15 808 680 0 0 32 647 1 372 38 501 1 105 33 976 1 658 24 294 922 31 620 1 049 8 285 267 0 0 53 473 1 386 64 999 1 180 0 0 46 785 1 940 27 959 1 295 6 271 955 0 0 36 340 1 212 54 377 882 54 410 1 426 31 498 1 862 22 294 1 435 4 832 1 579 909 052 30 962GRAND
TOTAL
Day Shift 24 364 637 15 947 684 12 950 505 985 168 24 389 819 22 330 1 315 0 0 23 942 815 15 521 850 15 808 680 0 0 11 093 794 20 980 565 11 023 523 9 131 446 9 160 394 1 989 182 0 0 17 560 1 087 31 614 677 0 0 25 637 1 395 12 899 816 3 599 806 0 0 18 053 692 20 896 607 20 742 902 18 409 1 633 9 463 729 3 175 1 297 398 484 18 721 Day Shift
Night Shift 40 658 1 233 24 021 450 0 0 0 0 30 590 850 23 253 565 16 995 190 24 492 695 25 078 560 0 0 0 0 21 554 578 17 521 540 22 953 1 135 15 163 476 22 460 655 6 296 85 0 0 35 913 299 33 385 503 0 0 21 148 545 15 060 479 2 672 149 0 0 18 287 520 33 481 275 33 668 524 13 089 229 12 831 706 1 657 282 510 568 12 241 Night Shift
Day Shift 54 246 1 994 Day Shift 101 990 4 479 Day Shift 63 376 2 904 Day Shift 91 309 4 781
Night Shift 64 679 1 683 Night Shift 120 408 2 860 Night Shift 105 947 3 469 Night Shift 108 178 1 975
Totals 54 246 3 677 Totals 222 398 7 339 Totals 169 323 6 373 Totals 199 487 6 756
CNC Machines - Tonnage Cut Per Day / Shift
New
Peddinghaus
Lind
03-Mar02-Mar01-Mar
BDL 1000
10-Mar 11-Mar 12-Mar04-Mar 05-Mar 06-Mar 07-Mar
Tuesday Wednesday
Ficep 166
Ficep 206
Thursday Friday Saturday Sunday
Saw 28
Tippo
BDL 1250/9
BDL 1000
Old Plasma
08-Mar
Saw 21
Thursday Friday
09-Mar
Ficep 206
Ficep 166
Lind
New
Peddinghaus
Old Plasma
Thursday Friday
BDL 1250/9
Tippo
Saw 28
Saw 21
MondaySaturday Sunday Monday Tuesday Wednesday
24-Mar 25-Mar23-Mar18-Mar
Monday
19-Mar
Friday Saturday Sunday
20-Mar 21-Mar 22-Mar13-Mar 14-Mar 15-Mar 16-Mar 17-Mar
Saturday Sunday Tuesday Wednesday Thursday
31-Mar
Monday Thursday Friday SaturdayWednesday
28-Mar
Tuesday
29-Mar 30-Mar26-Mar 27-Mar

Simulating for Better Performance of Cosira Manufacturing
PJ van Ginkel - 22106503
Page | 38
APPENDIX 3 – COSIRA VULCAN WORKSHOP LAYOUT

Simulating for Better Performance of Cosira Manufacturing
PJ van Ginkel – 22106503
Page | 39
APPENDIX 4 – THROUGHPUT TIME REPORTS FROM SIMULATIONS
APPENDIX 4A – BASE MODEL SIMULATION

Simulating for Better Performance of Cosira Manufacturing
PJ van Ginkel - 22106503
Page | 40

Simulating for Better Performance of Cosira Manufacturing
PJ van Ginkel - 22106503
Page | 41
APPENDIX 4B – LINE BALANCING MODEL 1 SIMULATION
ofModel Filename: C:\Users\PJvGinkel\My Studies\2012\Sem 2\BPJ 410 - 420\Simulation\Cosira
Model 002a
Page 1 2
Start Time: 120.00 Stop Time: 720.00 Time Units: Hours
TPTime 147.13 (Correlated) 62.7205 254.99
Replication 5
Tally
Expression Average Half Width Minimum Maximum
Start Time: 120.00 Stop Time: 720.00 Time Units: Hours
TPTime 237.77 (Correlated) 54.0300 432.63
Replication 4
Tally
Expression Average Half Width Minimum Maximum
Start Time: 120.00 Stop Time: 720.00 Time Units: Hours
TPTime 190.69 (Insufficient) 49.5147 407.74
Replication 3
Tally
Expression Average Half Width Minimum Maximum
Start Time: 120.00 Stop Time: 720.00 Time Units: Hours
TPTime 181.27 (Insufficient) 30.5454 473.29
Replication 2
Tally
Expression Average Half Width Minimum Maximum
Start Time: 120.00 Stop Time: 720.00 Time Units: Hours
TPTime 154.33 (Insufficient) 49.1500 302.26
Replication 10
Tally
Expression Average Half Width Minimum Maximum
Replication 1Start Time: 120.00 Stop Time: 720.00 Time Units: Hours
01:33:23 PM User SpecifiedOctober 12, 2012
COSIRA Model V2_1Replications: 10

Simulating for Better Performance of Cosira Manufacturing
PJ van Ginkel - 22106503
Page | 42
of
TPTime 190.68 (Correlated) 51.7632 533.91
Model Filename: C:\Users\PJvGinkel\My Studies\2012\Sem 2\BPJ 410 - 420\Simulation\Cosira
Model 002a
Page 2 2
Tally
Expression Average Half Width Minimum Maximum
Start Time: 120.00 Stop Time: 720.00 Time Units: Hours
TPTime 121.2405 (Insufficient) 43.0149 246.28
Replication 9
Tally
Expression Average Half Width Minimum Maximum
Start Time: 120.00 Stop Time: 720.00 Time Units: Hours
TPTime 301.33 (Insufficient) 80.6094 506.21
Replication 8
Tally
Expression Average Half Width Minimum Maximum
Start Time: 120.00 Stop Time: 720.00 Time Units: Hours
TPTime 197.75 (Insufficient) 34.6273 388.80
Replication 7
Tally
Expression Average Half Width Minimum Maximum
Start Time: 120.00 Stop Time: 720.00 Time Units: Hours
TPTime 128.30 (Insufficient) 47.7626 276.99
Replication 6
Hours
Tally
Expression Average Half Width Minimum Maximum
October 12, 2012
COSIRA Model V2_1Replications: 10
Replication 5Start Time: 120.00 Stop Time: 720.00 Time Units:
01:33:23 PM User Specified

Simulating for Better Performance of Cosira Manufacturing
PJ van Ginkel - 22106503
Page | 43
APPENDIX 4C – LINE BALANCING MODEL 2 SIMULATION

Simulating for Better Performance of Cosira Manufacturing
PJ van Ginkel - 22106503
Page | 44
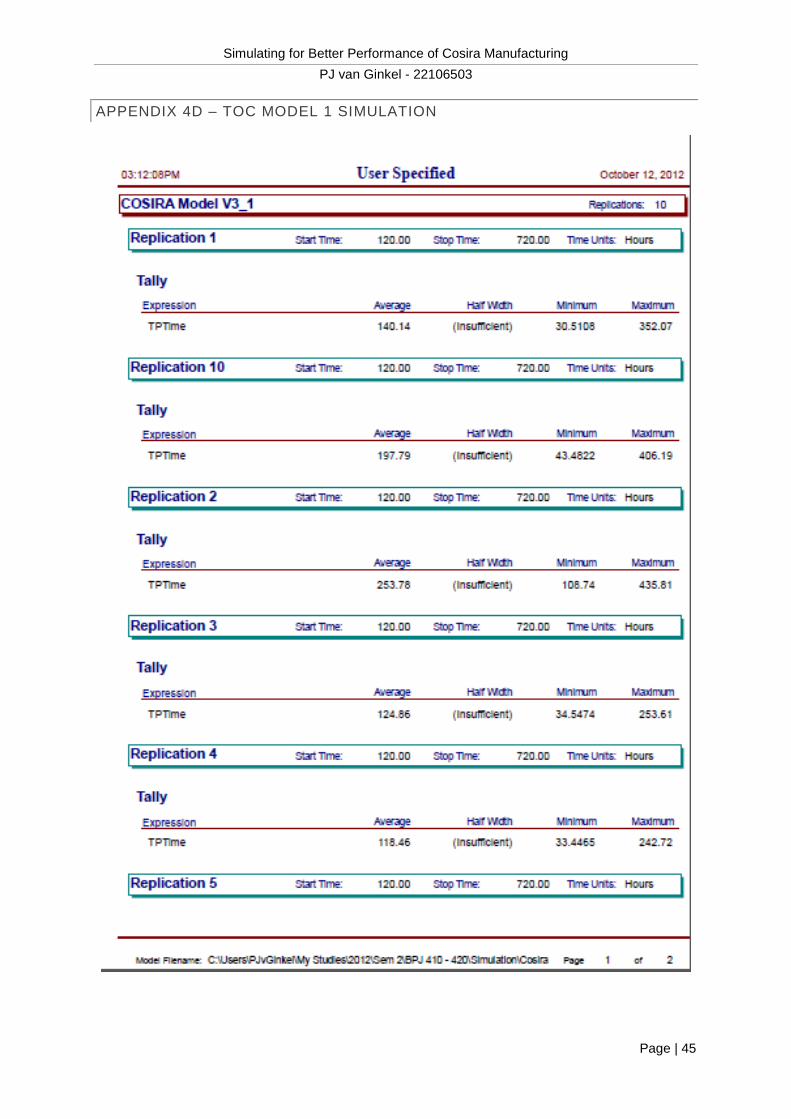
Simulating for Better Performance of Cosira Manufacturing
PJ van Ginkel - 22106503
Page | 45
APPENDIX 4D – TOC MODEL 1 SIMULATION

Simulating for Better Performance of Cosira Manufacturing
PJ van Ginkel - 22106503
Page | 46

Simulating for Better Performance of Cosira Manufacturing
PJ van Ginkel - 22106503
Page | 47
APPENDIX 4E – TOC MODEL 2 SIMULATION

Simulating for Better Performance of Cosira Manufacturing
PJ van Ginkel - 22106503
Page | 48

Simulating for Better Performance of Cosira Manufacturing
PJ van Ginkel - 22106503
Page | 49
APPENDIX 4F – FINAL MODEL SIMULATION
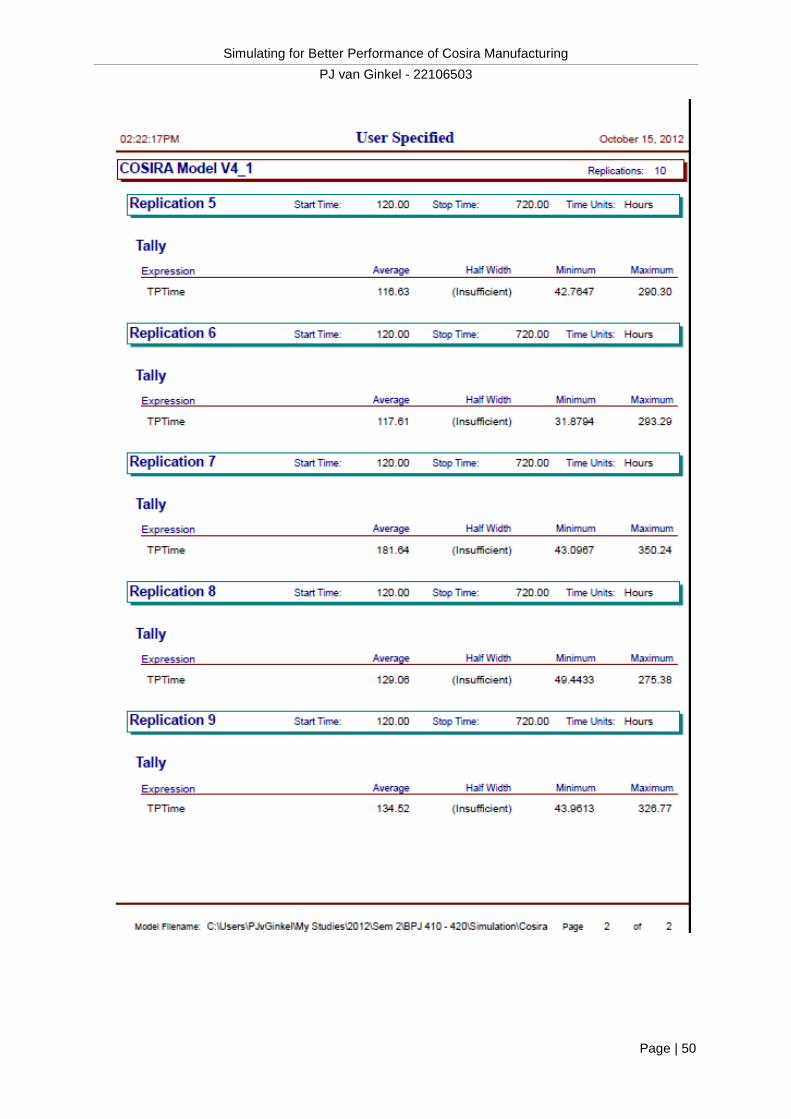
Simulating for Better Performance of Cosira Manufacturing
PJ van Ginkel - 22106503
Page | 50

Simulating for Better Performance of Cosira Manufacturing
PJ van Ginkel - 22106503
Page | 51
APPENDIX 5 – QUEUES OVERVIEW REPORTS FOR SIMULATIONS
APPENDIX 5A – BASE MODEL SIMULATION
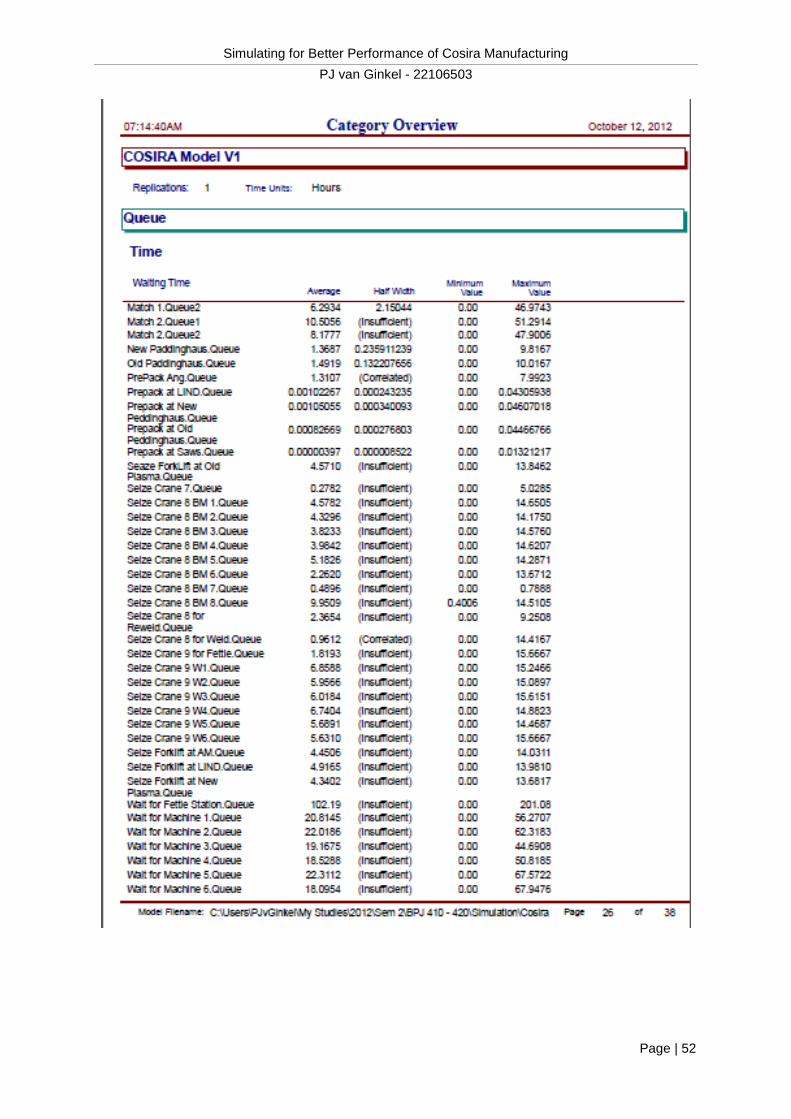
Simulating for Better Performance of Cosira Manufacturing
PJ van Ginkel - 22106503
Page | 52

Simulating for Better Performance of Cosira Manufacturing
PJ van Ginkel - 22106503
Page | 53

Simulating for Better Performance of Cosira Manufacturing
PJ van Ginkel - 22106503
Page | 54
APPENDIX 5B - LINE BALANCING MODEL 1 SIMULATION

Simulating for Better Performance of Cosira Manufacturing
PJ van Ginkel - 22106503
Page | 55

Simulating for Better Performance of Cosira Manufacturing
PJ van Ginkel - 22106503
Page | 56
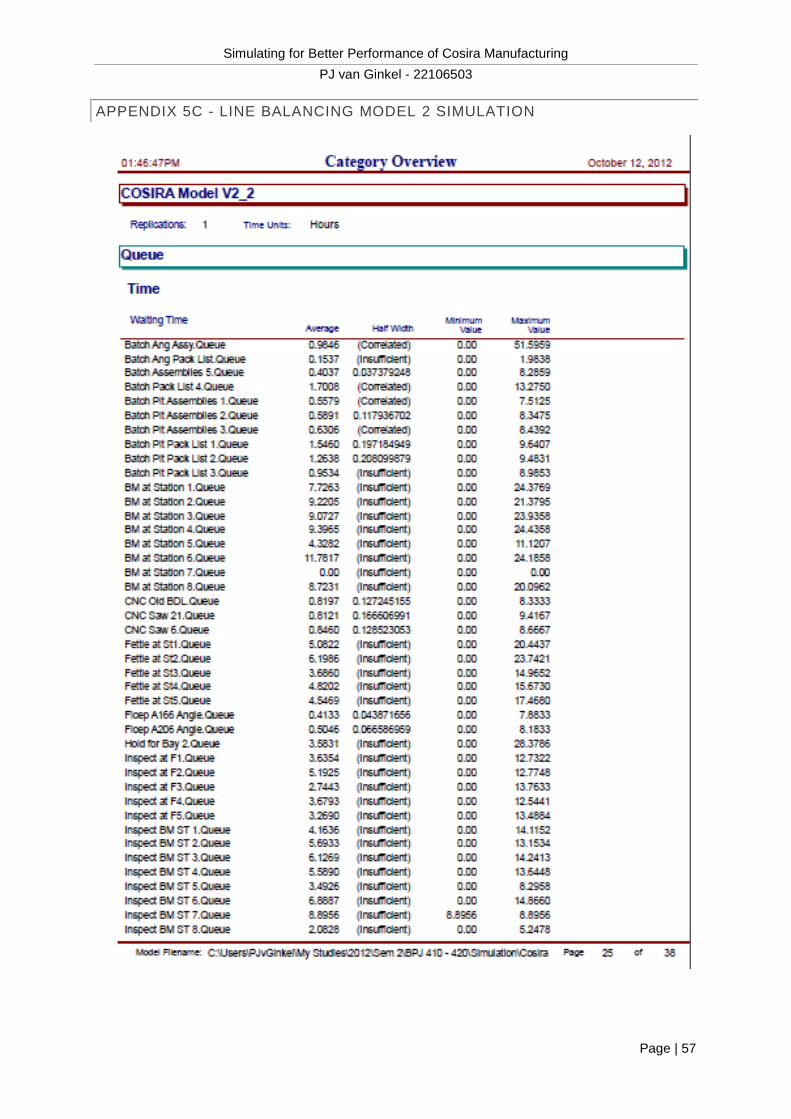
Simulating for Better Performance of Cosira Manufacturing
PJ van Ginkel - 22106503
Page | 57
APPENDIX 5C - LINE BALANCING MODEL 2 SIMULATION

Simulating for Better Performance of Cosira Manufacturing
PJ van Ginkel - 22106503
Page | 58

Simulating for Better Performance of Cosira Manufacturing
PJ van Ginkel - 22106503
Page | 59

Simulating for Better Performance of Cosira Manufacturing
PJ van Ginkel - 22106503
Page | 60
APPENDIX 5D – TOC MODEL 1 SIMULATION

Simulating for Better Performance of Cosira Manufacturing
PJ van Ginkel - 22106503
Page | 61

Simulating for Better Performance of Cosira Manufacturing
PJ van Ginkel - 22106503
Page | 62

Simulating for Better Performance of Cosira Manufacturing
PJ van Ginkel - 22106503
Page | 63
APPENDIX 5E – TOC MODEL 2 SIMULATION
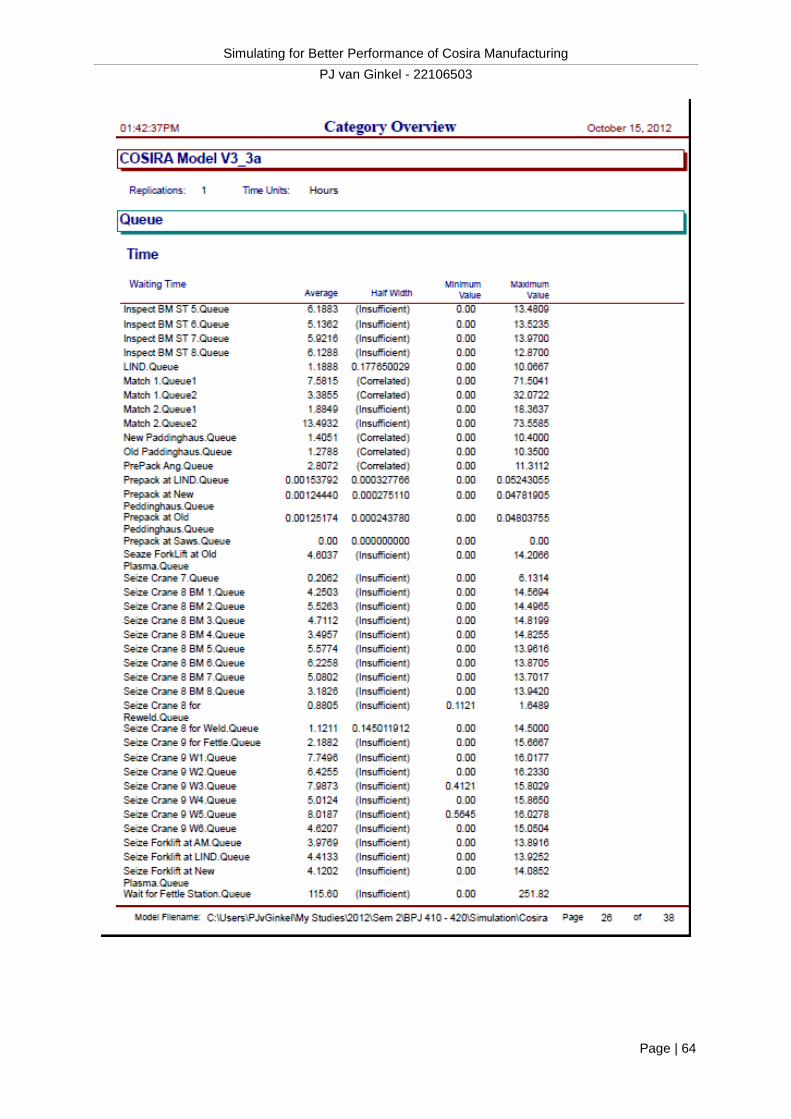
Simulating for Better Performance of Cosira Manufacturing
PJ van Ginkel - 22106503
Page | 64

Simulating for Better Performance of Cosira Manufacturing
PJ van Ginkel - 22106503
Page | 65

Simulating for Better Performance of Cosira Manufacturing
PJ van Ginkel - 22106503
Page | 66
APPENDIX 5F – FINAL MODEL SIMULATION

Simulating for Better Performance of Cosira Manufacturing
PJ van Ginkel - 22106503
Page | 67

Simulating for Better Performance of Cosira Manufacturing
PJ van Ginkel - 22106503
Page | 68