Simulating Erosion on Cultural Heritage Monuments Conference on Cultural Heritage and New...
21
Simulating Erosion on Cultural Heritage Monuments Panagiotis PERAKIS 1 | Christian SCHELLEWALD 1 | Kidane Fanta GEBREMARIAM 2 | Theoharis THEOHARIS 1 1 Department of Computer and Information Science | 2 Department of Chemistry, Norwegian University of Science and Technology (NTNU), Trondheim, Norway Abstract: The erosion process is a multi-parametric phenomenon which is hard to simulate algorithmically due to the large number of parameters involved as well as the lack of erosion benchmarking data. Erosion data acquisition is particularly challenging due to the large time-frame involved. Our approach toward building an erosion model for specific types of stone and specific environmental parameters is described as well as the acquisition of erosion data from specialized accelerated erosion chambers. The stone types addressed are marble and soapstone. We obtain data from the erosion chambers which simulate atmospheric pollutants, the effect of salt intrusion as well as the freeze-thaw effect. Once a cultural heritage monument is scanned in 3D, the erosion simulator can be used to perform sensitivity analysis on the effect of erosion based on the variation of the input parameter values. This analysis can show the degree of danger that the cultural heritage monument is in, according to the assumed parametric values. Erosion values are mapped onto the 3D scan of the cultural heritage monument and their visual nature is useful for the public dissemination of the involved danger. According to our records, this is the only detailed erosion simulator for stone. This work is supported by the European Unions Seventh Framework Programme (FP7/2007-2013) under grant agreement no 600533 PRESIOUS (www.presious.eu). Keywords: Cultural Heritage, Accelerated Erosion Chambers, Erosion Benchmarking, Erosion Simulation. Introduction The computer simulation of the naturally occurring stone degradation process is very attractive because it could enable us to predict the future state of important Cultural Heritage (CH) monuments based on different environment scenarios and thus allow us to take appropriate action in good time. The purpose of this study is to contribute to the simulation of the fundamental and most common degradation mechanisms that impact objects that are built out of stone. Our ultimate aim is to model and simulate the physico-chemical processes that lead to the degradation of the stone-material of CH objects over time. Towards this aim we are implementing a prototype software application that simulates surface mesh alterations of CH objects and allows therefore to imitate manifestations of stone degradation phenomena like surface recession and crust formation.
Transcript of Simulating Erosion on Cultural Heritage Monuments Conference on Cultural Heritage and New...
Simulating Erosion on Cultural Heritage Monuments
Panagiotis PERAKIS1 | Christian SCHELLEWALD1 | Kidane Fanta GEBREMARIAM2 | Theoharis
THEOHARIS1
1 Department of Computer and Information Science | 2 Department of Chemistry, Norwegian University of
Science and Technology (NTNU), Trondheim, Norway
Abstract: The erosion process is a multi-parametric phenomenon which is hard to simulate algorithmically
due to the large number of parameters involved as well as the lack of erosion benchmarking data. Erosion
data acquisition is particularly challenging due to the large time-frame involved. Our approach toward building
an erosion model for specific types of stone and specific environmental parameters is described as well as the
acquisition of erosion data from specialized accelerated erosion chambers. The stone types addressed are
marble and soapstone. We obtain data from the erosion chambers which simulate atmospheric pollutants, the
effect of salt intrusion as well as the freeze-thaw effect. Once a cultural heritage monument is scanned in 3D,
the erosion simulator can be used to perform sensitivity analysis on the effect of erosion based on the
variation of the input parameter values. This analysis can show the degree of danger that the cultural heritage
monument is in, according to the assumed parametric values. Erosion values are mapped onto the 3D scan of
the cultural heritage monument and their visual nature is useful for the public dissemination of the involved
danger. According to our records, this is the only detailed erosion simulator for stone. This work is supported
by the European Unions Seventh Framework Programme (FP7/2007-2013) under grant agreement no 600533
PRESIOUS (www.presious.eu).
Keywords: Cultural Heritage, Accelerated Erosion Chambers, Erosion Benchmarking, Erosion Simulation.
Introduction
The computer simulation of the naturally occurring stone degradation process is very attractive because it
could enable us to predict the future state of important Cultural Heritage (CH) monuments based on different
environment scenarios and thus allow us to take appropriate action in good time. The purpose of this study is
to contribute to the simulation of the fundamental and most common degradation mechanisms that impact
objects that are built out of stone. Our ultimate aim is to model and simulate the physico-chemical processes
that lead to the degradation of the stone-material of CH objects over time. Towards this aim we are
implementing a prototype software application that simulates surface mesh alterations of CH objects and
allows therefore to imitate manifestations of stone degradation phenomena like surface recession and crust
formation.
International Conference on Cultural Heritage and New Technologies | Vienna | 2015
2
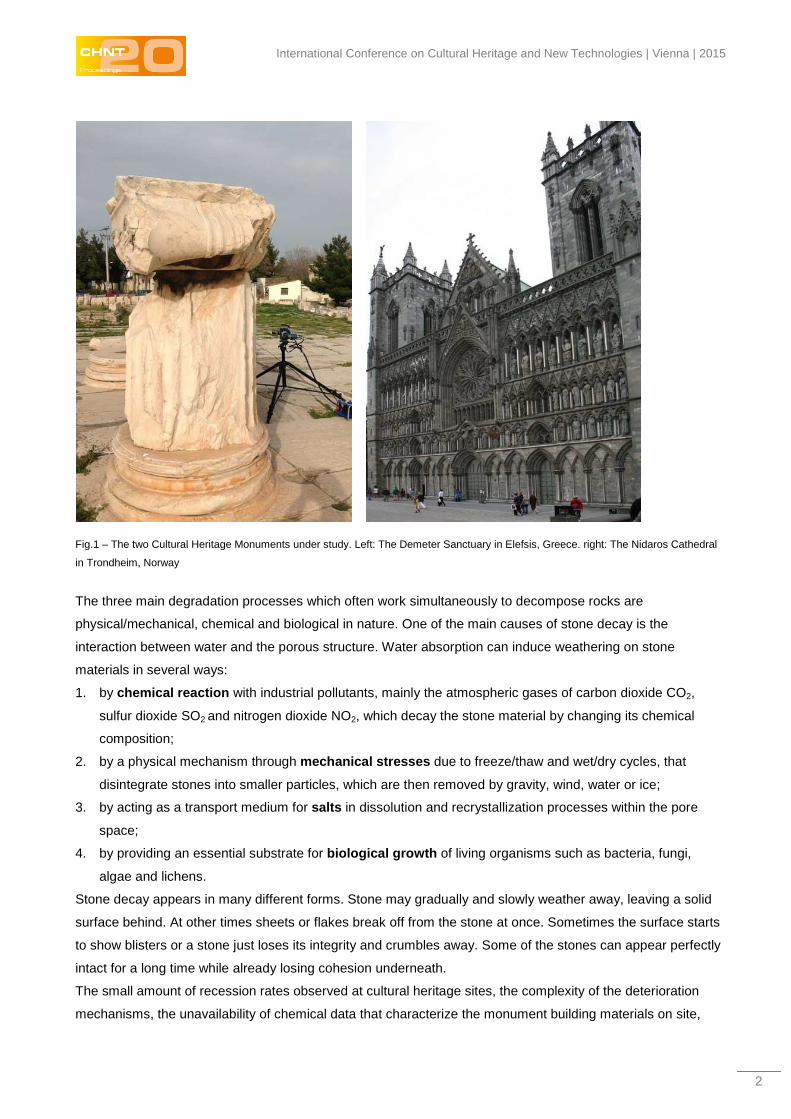
Fig.1 – The two Cultural Heritage Monuments under study. Left: The Demeter Sanctuary in Elefsis, Greece. right: The Nidaros Cathedral
in Trondheim, Norway
The three main degradation processes which often work simultaneously to decompose rocks are
physical/mechanical, chemical and biological in nature. One of the main causes of stone decay is the
interaction between water and the porous structure. Water absorption can induce weathering on stone
materials in several ways:
1. by chemical reaction with industrial pollutants, mainly the atmospheric gases of carbon dioxide CO2,
sulfur dioxide SO2 and nitrogen dioxide NO2, which decay the stone material by changing its chemical
composition;
2. by a physical mechanism through mechanical stresses due to freeze/thaw and wet/dry cycles, that
disintegrate stones into smaller particles, which are then removed by gravity, wind, water or ice;
3. by acting as a transport medium for salts in dissolution and recrystallization processes within the pore
space;
4. by providing an essential substrate for biological growth of living organisms such as bacteria, fungi,
algae and lichens.
Stone decay appears in many different forms. Stone may gradually and slowly weather away, leaving a solid
surface behind. At other times sheets or flakes break off from the stone at once. Sometimes the surface starts
to show blisters or a stone just loses its integrity and crumbles away. Some of the stones can appear perfectly
intact for a long time while already losing cohesion underneath.
The small amount of recession rates observed at cultural heritage sites, the complexity of the deterioration
mechanisms, the unavailability of chemical data that characterize the monument building materials on site,
Perakis | Schellewald | Gebremariam | Theoharis – Simulating Erosion on Monuments
3
and the uncontrolled environmental conditions, make it necessary to setup accelerated erosion chambers for
conducting specific purpose experiments, under controlled conditions using chemically characterized stone
samples. These experiments will provide the necessary bench-marking of the parameter values that that drive
the erosion process and its modelling.
Related Work
Although there is much work that has be done concerning in situ studies of the physicochemical processes of
stone erosion and their significance to the conservation treatments of Cultural Heritage objects, the
construction of accelerated erosion chambers and the conduction of specific purpose experiments, under
controlled laboratory conditions is a rather under-studied issue - see the excellent survey of E. Doehne and C.
Price concerning the current research on stone decay and conservation (DOEHNE & PRICE 2010), and the
state-of-the-art report of C. Schellewald et al. concerning the simulation of stone deterioration processes
(SCHELLEWALD, THEOHARIS, GEBREMARIAM & KVITTINGEN 2013).
Gauri, Yerrapragada, Bandyopadhyay et al. in a series of works (YERRAPRAGADA et al. 1994),
(YERRAPRAGADA et al. 1996) and (GAURI & BANDYOPADHYAY 1999) described the erosion on carbonate
stones, and especially marble, under polluted and unpolluted, dry or wet environments. Given that the
mechanisms of surface recession and crust creation are too complex, the authors set up chemical erosion
chambers to study the effects of CO2, SO2 and NO2 in dry or wet controlled conditions. They also made
outdoor experiments measuring the amount of material that runs off during rain showers and related this to the
exposed sample surface allowing them to estimate the recession under rainfall. The chemical processes were
modeled by the unreacted-core model, which led to the calculation of the crust deposition rate in dry
environments or the surface recession rate by acid rain.
G. W. Scherer examined several important weathering processes like the thermal expansion of calcite,
freeze/thaw cycles, salt crystallization along with the swelling of clay inclusions (SCHERER 2006). He
reviewed these weathering mechanisms and outlined which aspects remain to be solved. He concluded that
salt damage is one of the most serious, but least understood, causes of stone deterioration and that the
essential mechanisms that cause stresses in stone are known, but that details are not clear.
D. G. Price noted that chemical weathering usually includes the solution of stone material, the degree of which
depends on the amount of water passing over the surface, the solubility of the material, and the pH value of
the water (PRICE 1995). Considering all possible reactions of stone materials with all possibly present
chemicals becomes quickly very complex. However, for some stones the chemical degradation or weathering
mechanisms of particular material components are relatively well known.
The effects of ozone and NOx on the deterioration of calcareous stone was investigated by S. W. Massey. He
investigated the effects of these gases on the deterioration of different stones in chamber reactions and field
works in urban and rural environments (MASSEY 1999).
The corrosive effects of gaseous SO2, NOx, O3, HNO3, particulate matter, and acid rainfall are the topic of C.
Varotsos et al., concerned with the enhanced deterioration of the cultural heritage monuments (VAROTSOS,
TZANIS & CRACKNELL 2009).
International Conference on Cultural Heritage and New Technologies | Vienna | 2015
4
A. Moropoulou et al. presented in (MOROPOULOU et al. 1998) weathering phenomena on Pentelic marbles at
the Demeter Sanctuary in Elefsis, Greece. A systematic mineralogical, petrographical and chemical
examination of weathered stones and crusts was performed, both in situ and in the lab, on samples taken from
different parts of the monument in relation to the surface characteristics as well as to the exposure to rain,
sea-salt spray and wet and dry deposition of airborne pollutants and dust.
P. Storemyr in a series of works (STOREMYR 1997), (STOREMYR, WENDLER & ZEHNDER 2001) and
(STOREMYR 2004) presented weathering phenomena at the Nidaros cathedral in Trondheim, Norway. He
noted that stones from eight quarries are used in the monument and he presented and compared the behavior
in weathering and conservation of the respective stone types (soapstone and greenschist). Storemyr
discussed the geology, petrography and salt content of soapstone deposits. According to Storemyr the
“Grytdal” stone seems also to contribute to the formation of black gypsum crusts as the observed crusts
cannot be attributed to air pollutants (SO2 and particulate matter) alone.
Erosion Measurements
Erosion Measurements at the Cultural Heritage Sites
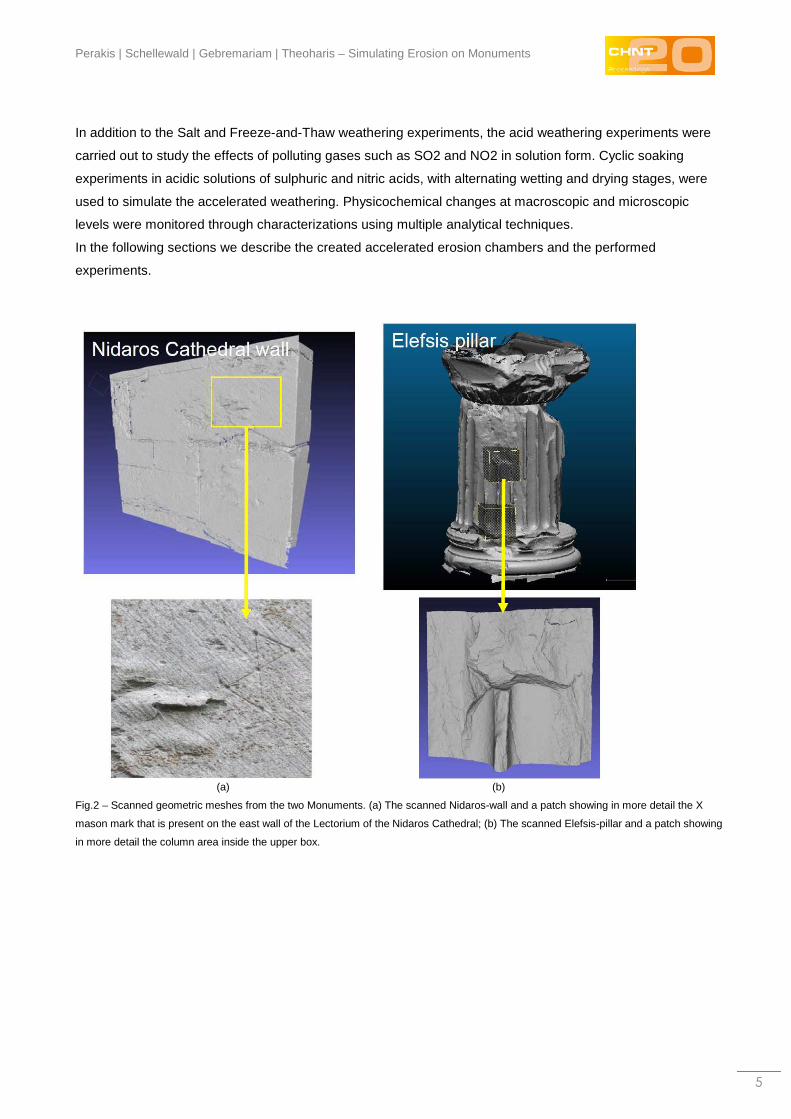
For the investigation of the erosion mechanisms that contribute to the degradation of stones, we collected 3D
geometric data from the two Cultural Heritage sites, the Demeter Sanctuary in Elefsis, Greece, and the
Nidaros Cathedral in Trondheim, Norway (Fig. 1). Fig. 2 (b) shows the result mesh of the geometric scan of
the Elefsis-pillar that took place at Elefsis in March 2013. The areas of the Elefsis-pillar, that are marked with
boxes, indicate the patches we selected for illustration of measurements and investigations. The geometric
scans were repeated in 2014 and 2015.
At the Nidaros Cathedral several smaller areas were selected for scanning. These include two wall parts from
the Lectorium (Lectorium East, with Mason Marks, and Lectorium North) and two scans from the inside of the
North West and South West Tower of the Cathedral. In Fig. 2 (a) we illustrate the geometric scan of the east
wall of the Lectorium that contains two mason marks. A close-up view of the area with a mason mark is
depicted as well.
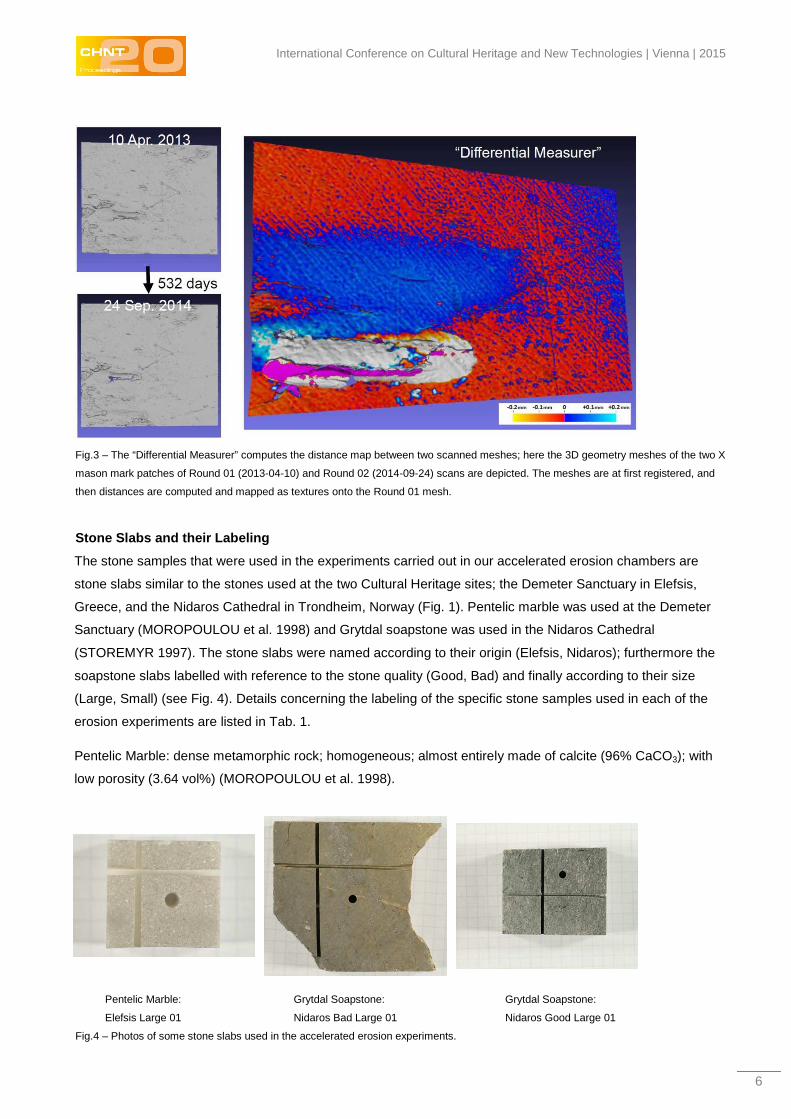
The “Differential Geometry Measurer” is the module within our erosion simulation software that aligns and
measures the erosion of stone surface areas that are scanned consecutively at the cultural heritage sites (Fig.
3) or alternatively using the stone slabs exposed to accelerated erosion (Fig. 11).
Accelerated Erosion Experiments
The unavailability of chemical data and the small amount of recession observed at the Cultural Heritage sites
themselves (Fig. 3), made it necessary to complement these measurements with data obtained from
accelerated erosion experiments that study erosion parameters in isolation. Considered weathering
experiments include effects that originate from polluted environments and from naturally occurring climatic
conditions. The experiments that we finally decided to perform, include the Salt effect (using sodium sulfate
Na2SO4), the Freeze-and-Thaw effect, that simulate mechanical effects and two chemical experiments
simulating polluted industrial environments, rich in SO2 and NO2 (using aqueous solutions of sulfuric acid
H2SO4(aq) and combined sulfuric and nitric acid H2SO4+HNO3(aq)).
Perakis | Schellewald | Gebremariam | Theoharis – Simulating Erosion on Monuments
5
In addition to the Salt and Freeze-and-Thaw weathering experiments, the acid weathering experiments were
carried out to study the effects of polluting gases such as SO2 and NO2 in solution form. Cyclic soaking
experiments in acidic solutions of sulphuric and nitric acids, with alternating wetting and drying stages, were
used to simulate the accelerated weathering. Physicochemical changes at macroscopic and microscopic
levels were monitored through characterizations using multiple analytical techniques.
In the following sections we describe the created accelerated erosion chambers and the performed
experiments.
(a) (b)
Fig.2 – Scanned geometric meshes from the two Monuments. (a) The scanned Nidaros-wall and a patch showing in more detail the X
mason mark that is present on the east wall of the Lectorium of the Nidaros Cathedral; (b) The scanned Elefsis-pillar and a patch showing
in more detail the column area inside the upper box.
International Conference on Cultural Heritage and New Technologies | Vienna | 2015
6
Fig.3 – The “Differential Measurer” computes the distance map between two scanned meshes; here the 3D geometry meshes of the two X
mason mark patches of Round 01 (2013-04-10) and Round 02 (2014-09-24) scans are depicted. The meshes are at first registered, and
then distances are computed and mapped as textures onto the Round 01 mesh.
Stone Slabs and their Labeling
The stone samples that were used in the experiments carried out in our accelerated erosion chambers are
stone slabs similar to the stones used at the two Cultural Heritage sites; the Demeter Sanctuary in Elefsis,
Greece, and the Nidaros Cathedral in Trondheim, Norway (Fig. 1). Pentelic marble was used at the Demeter
Sanctuary (MOROPOULOU et al. 1998) and Grytdal soapstone was used in the Nidaros Cathedral
(STOREMYR 1997). The stone slabs were named according to their origin (Elefsis, Nidaros); furthermore the
soapstone slabs labelled with reference to the stone quality (Good, Bad) and finally according to their size
(Large, Small) (see Fig. 4). Details concerning the labeling of the specific stone samples used in each of the
erosion experiments are listed in Tab. 1.
Pentelic Marble: dense metamorphic rock; homogeneous; almost entirely made of calcite (96% CaCO3); with
low porosity (3.64 vol%) (MOROPOULOU et al. 1998).
Pentelic Marble: Grytdal Soapstone: Grytdal Soapstone:
Elefsis Large 01 Nidaros Bad Large 01 Nidaros Good Large 01
Fig.4 – Photos of some stone slabs used in the accelerated erosion experiments.
Perakis | Schellewald | Gebremariam | Theoharis – Simulating Erosion on Monuments
7
Grytdal Soapstone: dense metamorphic rock; non homogeneous; made mostly of chlorite (20% − 60%) and
talc (5% − 20%); with low porosity (3.60 vol%) (STOREMYR 1997).
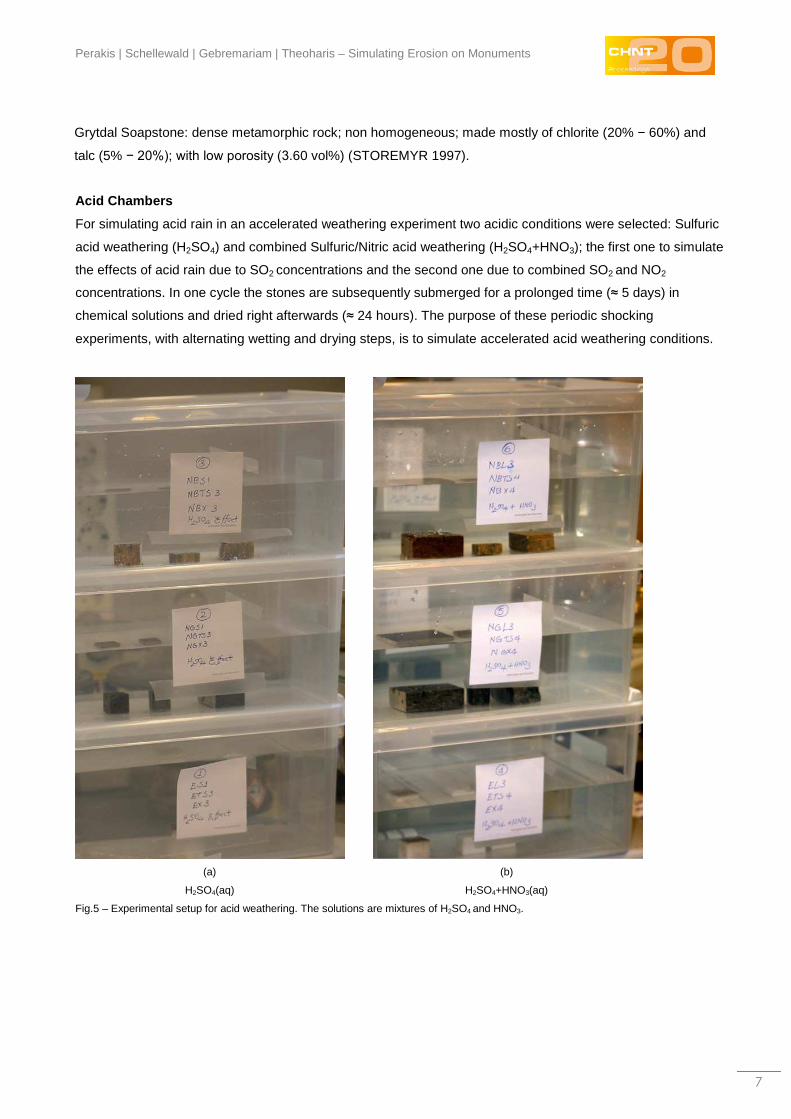
Acid Chambers
For simulating acid rain in an accelerated weathering experiment two acidic conditions were selected: Sulfuric
acid weathering (H2SO4) and combined Sulfuric/Nitric acid weathering (H2SO4+HNO3); the first one to simulate
the effects of acid rain due to SO2 concentrations and the second one due to combined SO2 and NO2
concentrations. In one cycle the stones are subsequently submerged for a prolonged time (≈ 5 days) in
chemical solutions and dried right afterwards (≈ 24 hours). The purpose of these periodic shocking
experiments, with alternating wetting and drying steps, is to simulate accelerated acid weathering conditions.
(a)
H2SO4(aq)
(b)
H2SO4+HNO3(aq)
Fig.5 – Experimental setup for acid weathering. The solutions are mixtures of H2SO4 and HNO3.
International Conference on Cultural Heritage and New Technologies | Vienna | 2015
8
Sulfuric Acid Chambers (H2SO4(aq))
For this experiment an acid solution, H2SO4, of pH 4 was prepared from reagent grade concentrated sulphuric
acid. In each weathering container three samples from the same type of stone were totally immersed in the
solution. The volumes of the solution for each group of identical stone types, Elefsis, Nidaros Good and
Nidaros Bad, were 4 L each, kept in plastic containers of 7 L in size (Fig. 5 (a)). The containers were closed
during the soaking phase to minimize the effect of evaporation.
The pH of the solution was adjusted on daily basis using a 0.1 M solution of H2SO4. The pH measurements
were made through the use of a pH meter (Jenway, model 3510 pH meter). The weathering experiment was
conducted at room temperature and humidity. The CO2 level in the laboratory was continuously measured with
a help of a CO2 data logger. ZyAura ZG1683RU CO2 monitor was used for this purpose along with ZG Series
application software for real-time data analysis, calibration, etc.
After 5 days intervals on average, the samples were taken out of the solution, and dried for 24 hours at 105oC
in a desiccator and weighted afterwards. The stones were exposed to the simulated acidic solutions for a
period of one month and 10 days in the first round before characterization.
Combined Sulfuric/Nitric Acid Chambers (H2SO4+HNO3(aq))
The acid solution was prepared by mixing H2SO4 and HNO3 solutions in the ratio of 2/3 and adjusting the pH
to 4. The solutions are intended to simulate acid rain. The chemicals used are all reagent grade. The volumes
of the solution for each group of identical stone types, Elefsis, Nidaros Good and Nidaros Bad, were 4 L each
kept in a closed plastic container of 7 L in size (Fig. 5 (b)). The stones were immersed in the solution with the
pH adjusted at 4 on a daily basis using a 0.1 M solution of HNO3.
The weathering experiment was conducted at room temperature and humidity. The CO2 level in the laboratory
was continuously measured with a help of a CO2 data logger. The samples were taken out of the solution,
dried for 24 hours and weighted after every 5 days on average. In the first round, the weathering processes
continued for a period of one month before characterization of the stones by multi-analytical techniques.
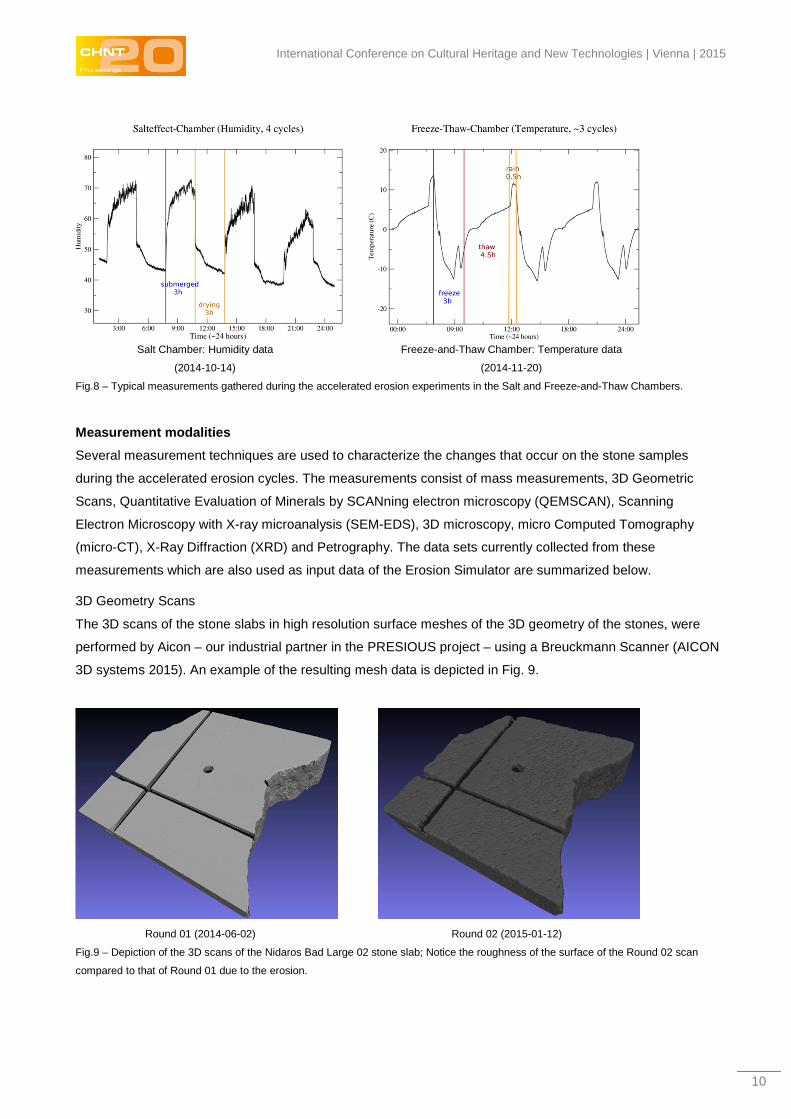
Salt and Freeze-and-Thaw Chambers
In order to investigate the Salt, and the Freeze-and-Thaw effects, we designed and constructed two erosion
chambers for our accelerated erosion experiments. They are controlled by Arduino micro-controllers (Arduino
LLC 2015) and continuous measurements are taken over USB connections. Typical curves that originate from
24 hour measurements from both chambers are shown in Fig. 8.
Salt Chamber
One cycle within the Salt Chamber takes 6 hours and consists of submerging the stones in the salt solution, of
Na2SO4 decahydrate, for 3 hours and drying them for 3 hours in a constant light airflow created by small fans
attached to the chamber. Note that 3 hours is the amount of time taken for the chambers to enter into a steady
state of humidity variation. Fig. 6 shows the Salt Chamber in both states. The left image shows the stones
lifted up. The white crust indicates that the stones already dried for a while. On the right image, the stones are
submerged within the salt solution. The temperature and humidity of the chamber is continuously monitored
over the lifetime of the experiments (Fig. 8 (a)).
Perakis | Schellewald | Gebremariam | Theoharis – Simulating Erosion on Monuments
9
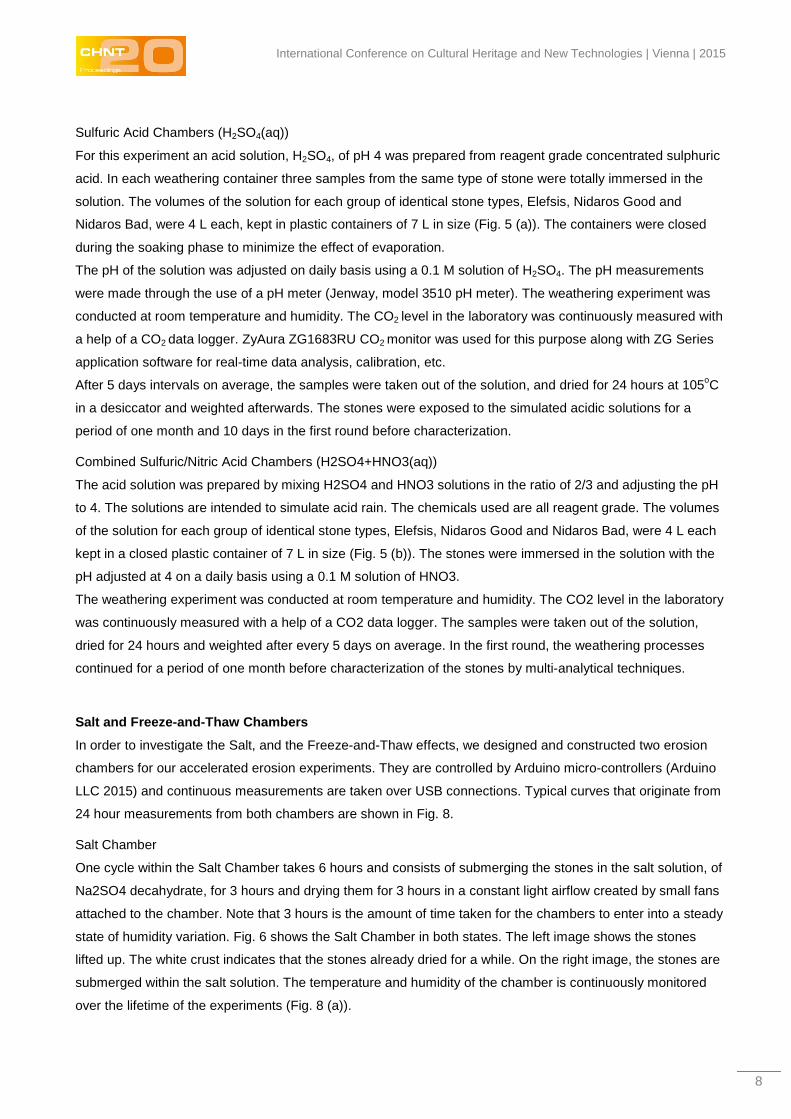
The first round of accelerated Salt effect erosion started on 19th September 2014 and was stopped on 21st
October 2014, and lasted for 32 days having 128 cycles of 21,600 sec (wetting: 10,800 s - drying: 10,800 s).
Salt Chamber with stones being dried (Dry phase) Salt Chamber with stones submerged (Wet phase)
Fig.6 – The Salt Chamber shown at two different cycles and states. Dry and wet phases change every three hours during the accelerated
erosion cycles.
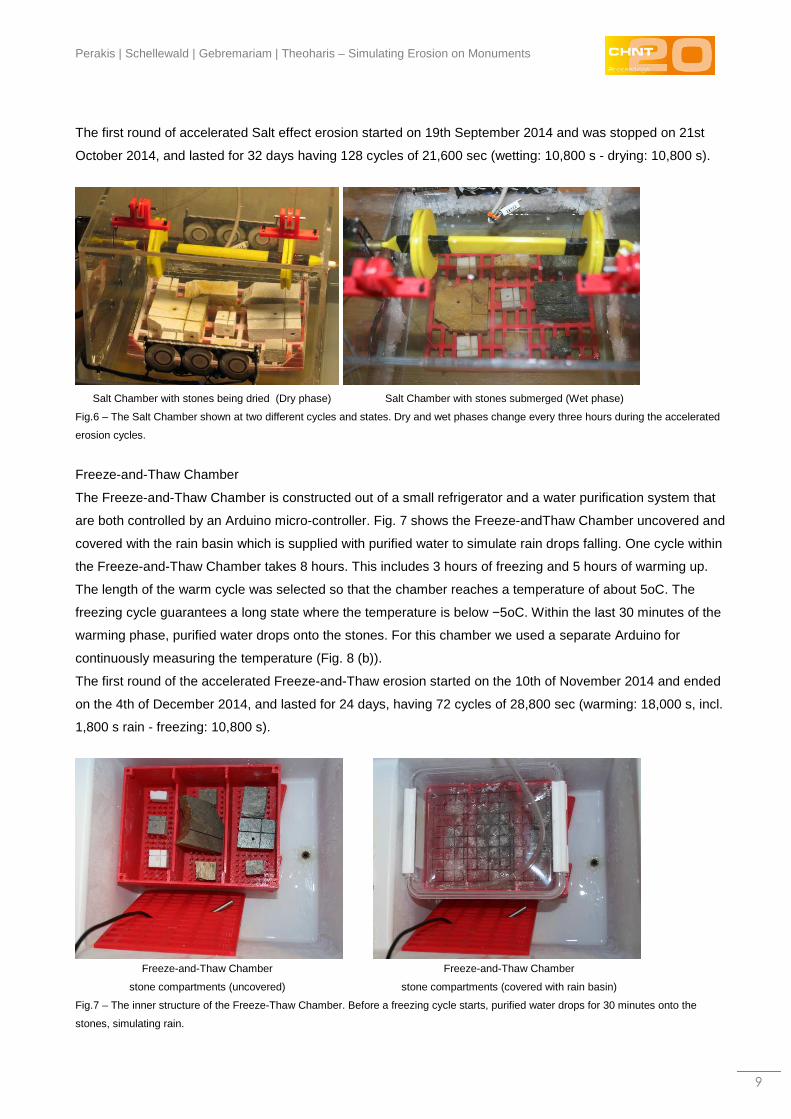
Freeze-and-Thaw Chamber
The Freeze-and-Thaw Chamber is constructed out of a small refrigerator and a water purification system that
are both controlled by an Arduino micro-controller. Fig. 7 shows the Freeze-andThaw Chamber uncovered and
covered with the rain basin which is supplied with purified water to simulate rain drops falling. One cycle within
the Freeze-and-Thaw Chamber takes 8 hours. This includes 3 hours of freezing and 5 hours of warming up.
The length of the warm cycle was selected so that the chamber reaches a temperature of about 5oC. The
freezing cycle guarantees a long state where the temperature is below −5oC. Within the last 30 minutes of the
warming phase, purified water drops onto the stones. For this chamber we used a separate Arduino for
continuously measuring the temperature (Fig. 8 (b)).
The first round of the accelerated Freeze-and-Thaw erosion started on the 10th of November 2014 and ended
on the 4th of December 2014, and lasted for 24 days, having 72 cycles of 28,800 sec (warming: 18,000 s, incl.
1,800 s rain - freezing: 10,800 s).
Freeze-and-Thaw Chamber
stone compartments (uncovered)
Freeze-and-Thaw Chamber
stone compartments (covered with rain basin)
Fig.7 – The inner structure of the Freeze-Thaw Chamber. Before a freezing cycle starts, purified water drops for 30 minutes onto the
stones, simulating rain.
International Conference on Cultural Heritage and New Technologies | Vienna | 2015
10
Salt Chamber: Humidity data
(2014-10-14)
Freeze-and-Thaw Chamber: Temperature data
(2014-11-20)
Fig.8 – Typical measurements gathered during the accelerated erosion experiments in the Salt and Freeze-and-Thaw Chambers.
Measurement modalities
Several measurement techniques are used to characterize the changes that occur on the stone samples
during the accelerated erosion cycles. The measurements consist of mass measurements, 3D Geometric
Scans, Quantitative Evaluation of Minerals by SCANning electron microscopy (QEMSCAN), Scanning
Electron Microscopy with X-ray microanalysis (SEM-EDS), 3D microscopy, micro Computed Tomography
(micro-CT), X-Ray Diffraction (XRD) and Petrography. The data sets currently collected from these
measurements which are also used as input data of the Erosion Simulator are summarized below.
3D Geometry Scans
The 3D scans of the stone slabs in high resolution surface meshes of the 3D geometry of the stones, were
performed by Aicon – our industrial partner in the PRESIOUS project – using a Breuckmann Scanner (AICON
3D systems 2015). An example of the resulting mesh data is depicted in Fig. 9.
Round 01 (2014-06-02) Round 02 (2015-01-12)
Fig.9 – Depiction of the 3D scans of the Nidaros Bad Large 02 stone slab; Notice the roughness of the surface of the Round 02 scan
compared to that of Round 01 due to the erosion.
Perakis | Schellewald | Gebremariam | Theoharis – Simulating Erosion on Monuments
11
QEMSCAN
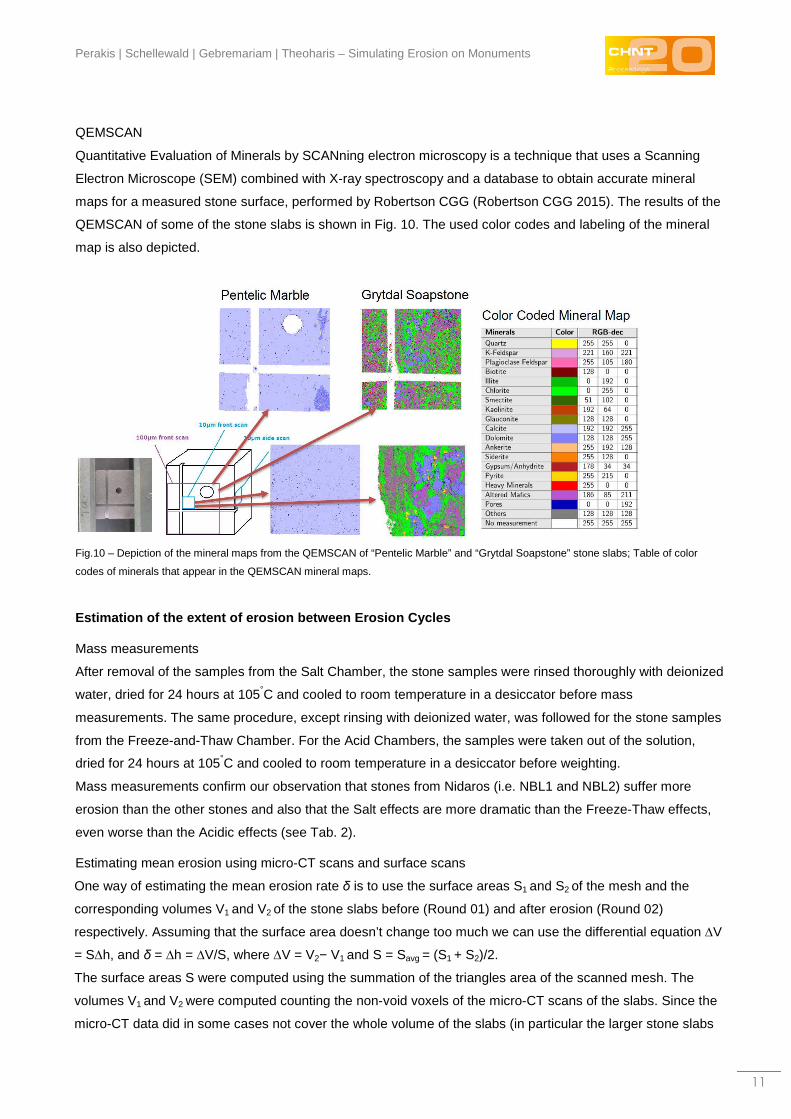
Quantitative Evaluation of Minerals by SCANning electron microscopy is a technique that uses a Scanning
Electron Microscope (SEM) combined with X-ray spectroscopy and a database to obtain accurate mineral
maps for a measured stone surface, performed by Robertson CGG (Robertson CGG 2015). The results of the
QEMSCAN of some of the stone slabs is shown in Fig. 10. The used color codes and labeling of the mineral
map is also depicted.
Fig.10 – Depiction of the mineral maps from the QEMSCAN of “Pentelic Marble” and “Grytdal Soapstone” stone slabs; Table of color
codes of minerals that appear in the QEMSCAN mineral maps.
Estimation of the extent of erosion between Erosion Cycles
Mass measurements
After removal of the samples from the Salt Chamber, the stone samples were rinsed thoroughly with deionized
water, dried for 24 hours at 105°C and cooled to room temperature in a desiccator before mass
measurements. The same procedure, except rinsing with deionized water, was followed for the stone samples
from the Freeze-and-Thaw Chamber. For the Acid Chambers, the samples were taken out of the solution,
dried for 24 hours at 105°C and cooled to room temperature in a desiccator before weighting.
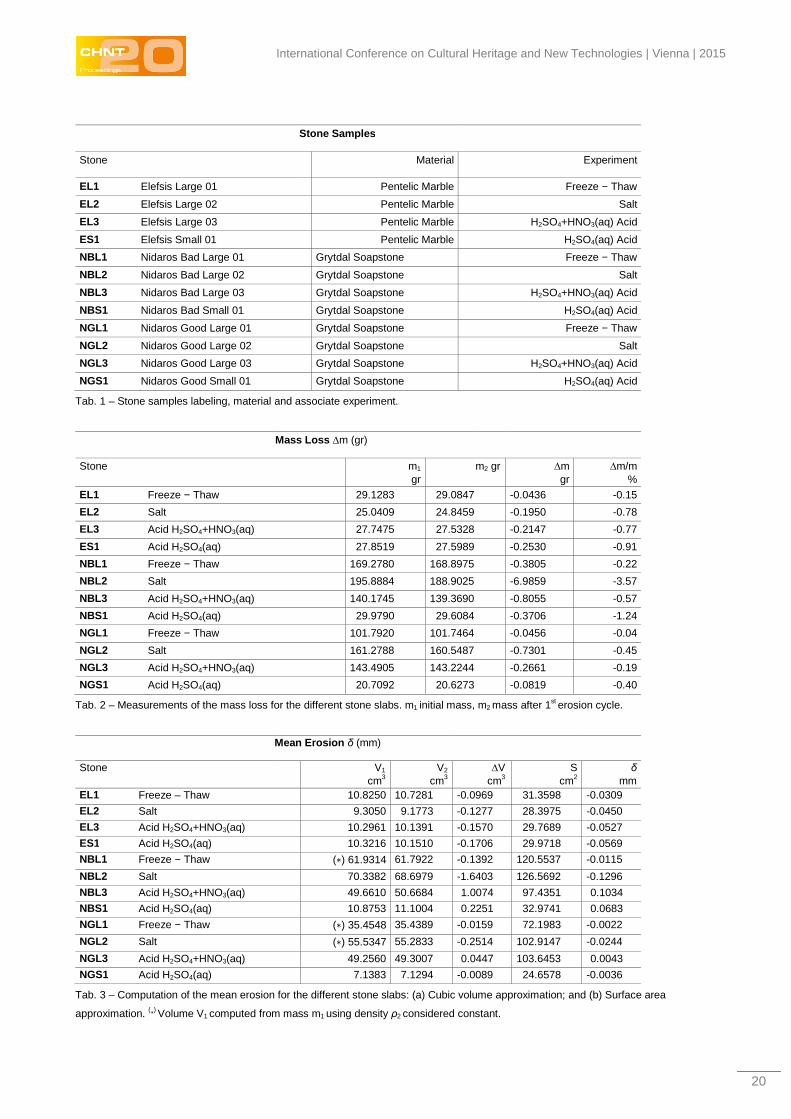
Mass measurements confirm our observation that stones from Nidaros (i.e. NBL1 and NBL2) suffer more
erosion than the other stones and also that the Salt effects are more dramatic than the Freeze-Thaw effects,
even worse than the Acidic effects (see Tab. 2).
Estimating mean erosion using micro-CT scans and surface scans
One way of estimating the mean erosion rate δ is to use the surface areas S1 and S2 of the mesh and the
corresponding volumes V1 and V2 of the stone slabs before (Round 01) and after erosion (Round 02)
respectively. Assuming that the surface area doesn’t change too much we can use the differential equation ∆V
= S∆h, and δ = ∆h = ∆V/S, where ∆V = V2− V1 and S = Savg = (S1 + S2)/2.
The surface areas S were computed using the summation of the triangles area of the scanned mesh. The
volumes V1 and V2 were computed counting the non-void voxels of the micro-CT scans of the slabs. Since the
micro-CT data did in some cases not cover the whole volume of the slabs (in particular the larger stone slabs
International Conference on Cultural Heritage and New Technologies | Vienna | 2015
12
did not fit into the measurement space) during the first round (Round 01) measurements, V1 could not be
directly computed from them, so finally it was computed from the first round mass m1 using the second round
density ρ2, which was considered constant between the two cycles.
We have estimated the mean erosion δ using the previously described method and the results for the various
slabs are presented in Table 3. Note that stone slabs NBL3 and NBS1 under acid weathering exhibit swelling
which overcomes the recession of material from their surfaces. Stone slabs NGL3 and NGS1 under acid
weathering exhibit swelling as well but not so intense which almost equalizes the recession of material from
their surfaces. This swelling phenomenon exhibited on Grytdal soapstones has to be further investigated.
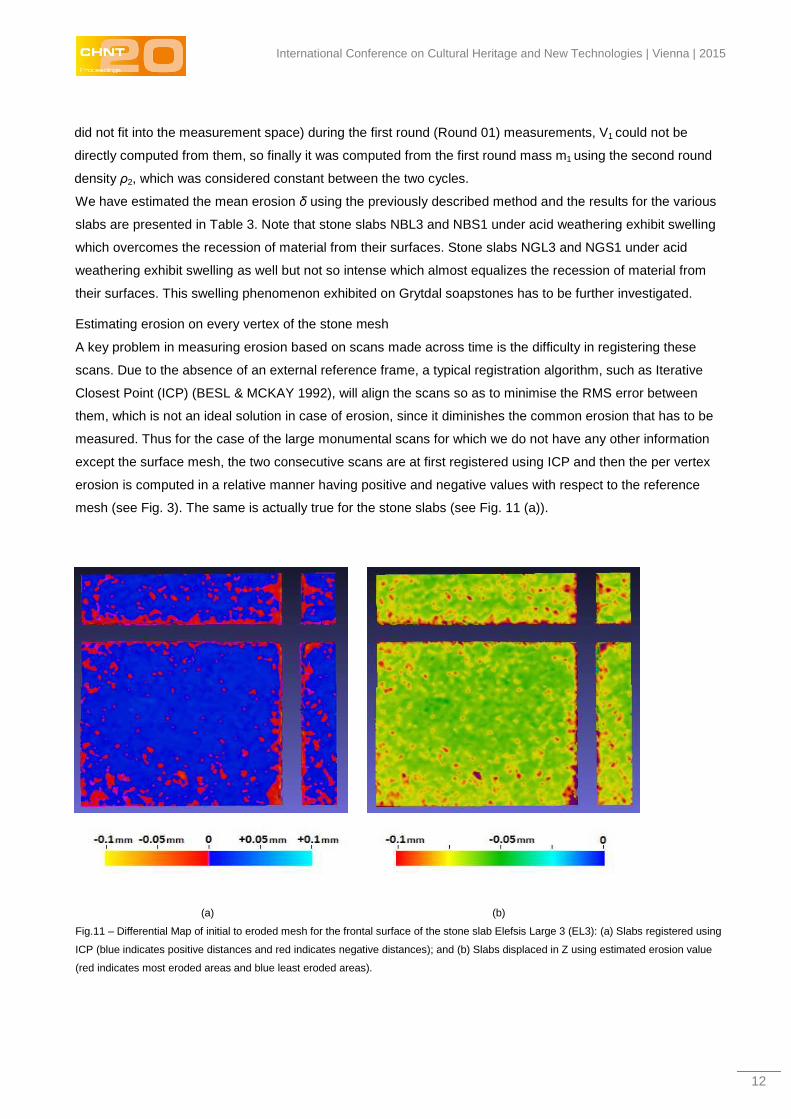
Estimating erosion on every vertex of the stone mesh
A key problem in measuring erosion based on scans made across time is the difficulty in registering these
scans. Due to the absence of an external reference frame, a typical registration algorithm, such as Iterative
Closest Point (ICP) (BESL & MCKAY 1992), will align the scans so as to minimise the RMS error between
them, which is not an ideal solution in case of erosion, since it diminishes the common erosion that has to be
measured. Thus for the case of the large monumental scans for which we do not have any other information
except the surface mesh, the two consecutive scans are at first registered using ICP and then the per vertex
erosion is computed in a relative manner having positive and negative values with respect to the reference
mesh (see Fig. 3). The same is actually true for the stone slabs (see Fig. 11 (a)).
(a) (b)
Fig.11 – Differential Map of initial to eroded mesh for the frontal surface of the stone slab Elefsis Large 3 (EL3): (a) Slabs registered using
ICP (blue indicates positive distances and red indicates negative distances); and (b) Slabs displaced in Z using estimated erosion value
(red indicates most eroded areas and blue least eroded areas).
Perakis | Schellewald | Gebremariam | Theoharis – Simulating Erosion on Monuments
13
Here is how we handled this problem in the case of the stone slabs used in the accelerated erosion
experiments. We first register the top surface of the slabs using ICP and assume that this registration is
sufficient in terms of the X and Y dimensions that define the top surface. Then we translated the surface mesh
by a displacement in Z direction that equals the computed mean erosion δ that is estimated by the previously
described method (see Fig. 11 (b)).
Consider two point sets M = {m1,m2,...,mp}, that represents the initial surface of a stone, and T = {t1,t2,...,tq}
that represents the weathered surface of the same stone, where m i, t j ∈ R3. The distance de(m i) = minj(|m i − t j|)
can be used as a local erosion measure which expresses at each vertex of the initial model M the distance of
the closest vertex of the eroded model T, and is a scalar mapping of the erosion measure at each vertex of the
initial stone model M, to which the eroded model T is registered. |m i − t j| is the Euclidean distance of a point of
M from a point of T.
Fig. 11 depicts the distance maps (i.e. the de(m i)) between the Round 01 and Round 02 meshes of Elefsis
Large 3, and consequently the computed by he “Differential Geometry Measurer” erosion measure textured on
the initial mesh as a distance map. In Fig. 11 (a) the distance map after the ICP registration is depicted, and in
Fig. 11 (b) the distance map after the Z-shift correction that equals mean erosion δ. In Fig. 3 the distance map
between the Round 01 and Round 02 of the X mason mark scanned patch, which is present on the east wall
of the Lectorium of the Nidaros Cathedral, is depicted; the meshes are at first registered, and then distances
are computed and mapped as textures onto the Round 01 mesh.
The Erosion Simulator
Description of the Erosion Simulator
The purpose of the Erosion Simulator is the simulation of the fundamental and most important degradation
mechanisms that impact objects that are made of stone. Therefore the simulator aims to model and simulate
the physico-chemical processes that lead to the degradation of the stone-material over time. Towards this aim
we implemented a prototype for the mesh alteration that acts on the surface geometry and allows therefore to
imitate the surface recession or crust growing. The erosion engine implements a mesh off-setting model. This
model relies on a computational and a physico-chemical model, which will be subsequently described.
Modeling Stone Weathering
The main weathering processes responsible for the erosion of rocks and stones are of chemical and physical
nature.
Chemical weathering describes the decay of the stone material into new chemical products by the chemical
reactions of the stone material with water and atmospheric gases like carbon dioxide (CO2), sulfur dioxide
(SO2) and nitrogen dioxide (NO2). The two different chemical weathering scenarios that are usually
distinguished are the weathering within a natural environment and the weathering within a polluted
environment. The first (unpolluted) scenario considers (beside the air) only the gas carbon dioxide (CO2) while
the second scenario contains also the industrial gases sulfur and nitrogen dioxide (SO2 and NO2). The
chemical weathering results in two main effects; the gain or loss of material. The first one is mostly visible as
International Conference on Cultural Heritage and New Technologies | Vienna | 2015
14
crust building up on surfaces while the second one relates in most cases to surface recession. The crust
formation is usually due to the deposition of chemical material in polluted environments while the loss of
material results mainly due to reactions of water with the stone-material and pollution gases. The chemical
products in this process are subsequently washed away. Temperature and humidity play crucial roles in these
processes (GAURI & BANDYOPADHYAY 1999).
Physical or mechanical weathering describes the disintegration of the stone material into smaller particles
under the action of heat, water and pressure on the stone, which then can be removed by gravity, wind, water
or ice. The two different mechanical weathering scenarios that are usually distinguished are the weathering
caused by soluble salts and the weathering caused by wet/dry and freeze/thaw cycles. Along with air pollution,
soluble salts represent one of the most important causes of stone decay. Salts cause damage to stone in
several ways. The most important is the growth of salt crystals within the pores, fissures and cracks of a stone,
which can generate stresses that are sufficient to overcome the stone’s tensile strength and turn the stone to
fragmented pieces. Another important decay mechanism under the general term “differential stress” includes
the effects of wet/dry cycling, clay swelling, differential hygric stress, differential thermal stress, and stress from
differential expansion rates of material in pores (such as salts or organic material) versus in the stone
(DOEHNE & PRICE 2010).
Modeling Mesh Alteration
The formulas which describe the surface weathering provide usually a measure for the change of the surface
geometry (deposition/recession δ) of the object surface which depends on the environmental parameters
(such as the amount of rain fall, the concentrations of the involved pollution gases, the temperature, the
humidity etc.) and the stone material. This suggests a simple procedure to simulate erosion acting just on the
object surface mesh: For each vertex of the surface mesh one has to calculate the recession rate of the
erosion according to the various environmental parameters with adoptions to the local stone material
parameters. Then the surface mesh change is performed along the normal direction of the surface.
Perakis | Schellewald | Gebremariam | Theoharis – Simulating Erosion on Monuments
15
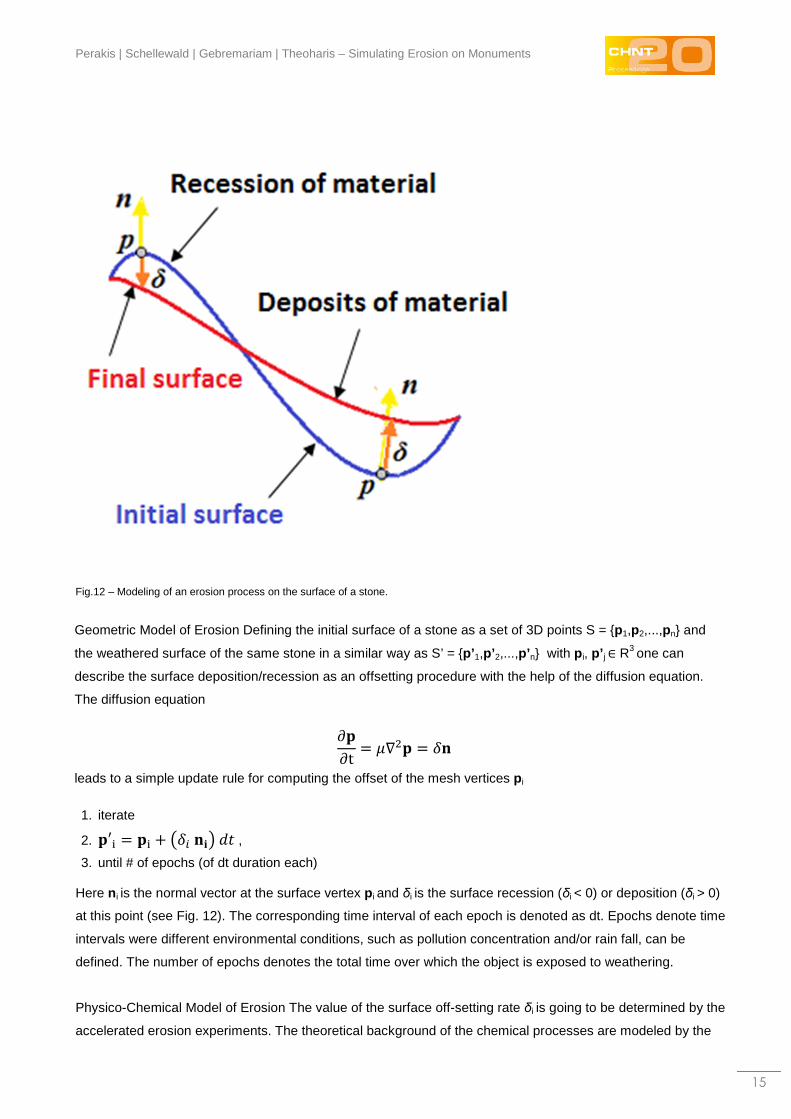
Fig.12 – Modeling of an erosion process on the surface of a stone.
Geometric Model of Erosion Defining the initial surface of a stone as a set of 3D points S = {p1,p2,...,pn} and
the weathered surface of the same stone in a similar way as S’ = {p’ 1,p’ 2,...,p’ n} with p i, p’ j ∈ R3 one can
describe the surface deposition/recession as an offsetting procedure with the help of the diffusion equation.
The diffusion equation
∂�∂t� ���� �
leads to a simple update rule for computing the offset of the mesh vertices p i
1. iterate
2. �′ � � � ������ , 3. until # of epochs (of dt duration each)
Here n i is the normal vector at the surface vertex p i and δi is the surface recession (δi < 0) or deposition (δi > 0)
at this point (see Fig. 12). The corresponding time interval of each epoch is denoted as dt. Epochs denote time
intervals were different environmental conditions, such as pollution concentration and/or rain fall, can be
defined. The number of epochs denotes the total time over which the object is exposed to weathering.
Physico-Chemical Model of Erosion The value of the surface off-setting rate δi is going to be determined by the
accelerated erosion experiments. The theoretical background of the chemical processes are modeled by the
International Conference on Cultural Heritage and New Technologies | Vienna | 2015
16
unreacted-core model, which leads to the computation of the mesh offsetting δ for the cases of dry deposition
of crust due to SO2 + NO2 and surface recession by acid rain due to SO2 + NO2 + CO2 is described in detail in
(GAURI & BANDYOPADHYAY 1999, YERRAPRAGADA et al. 1996, YERRAPRAGADA et al. 1994). Note
how dramatically high the recession rates due to acid rain are, compared to the deposition rates of crust in dry
environments. This result reaffirms that acid rain recession is the most significant component in the erosion
model.
Erosion Simulator Processing Modes
According to the data types that are available to the “Erosion Simulator” module, it can run in two different
processing modes.
Application of the Erosion Simulator on a mesh of homogeneous stone
In this first mode, the input of the Erosion Simulator is 3D geometric surface data only, in a mesh structure.
The Erosion Simulator considers that data come from a homogeneous stone of a known type. The Erosion
Simulator produces the eroded surface geometry considering that δ for deposition/recession is the same on
every vertex of the mesh, determined by the stone type and the environmental parameters.
The 3D geometric surface data are available for large areas - such as from the Elefsis pillar or the Nidaros
Cathedral walls - where no other extra information for the mineral composition of the surface is available. But it
can also be applied to the 3D geometric surface data of the stone slabs by just ignoring the extra mineral
composition information of the QEMSCANs. In this mode, the simulator runs on various complete irregular or
regular meshes acquired at different resolutions. Our scanned datasets have mean-edge-length at 0.060 ~
0.098 mm.
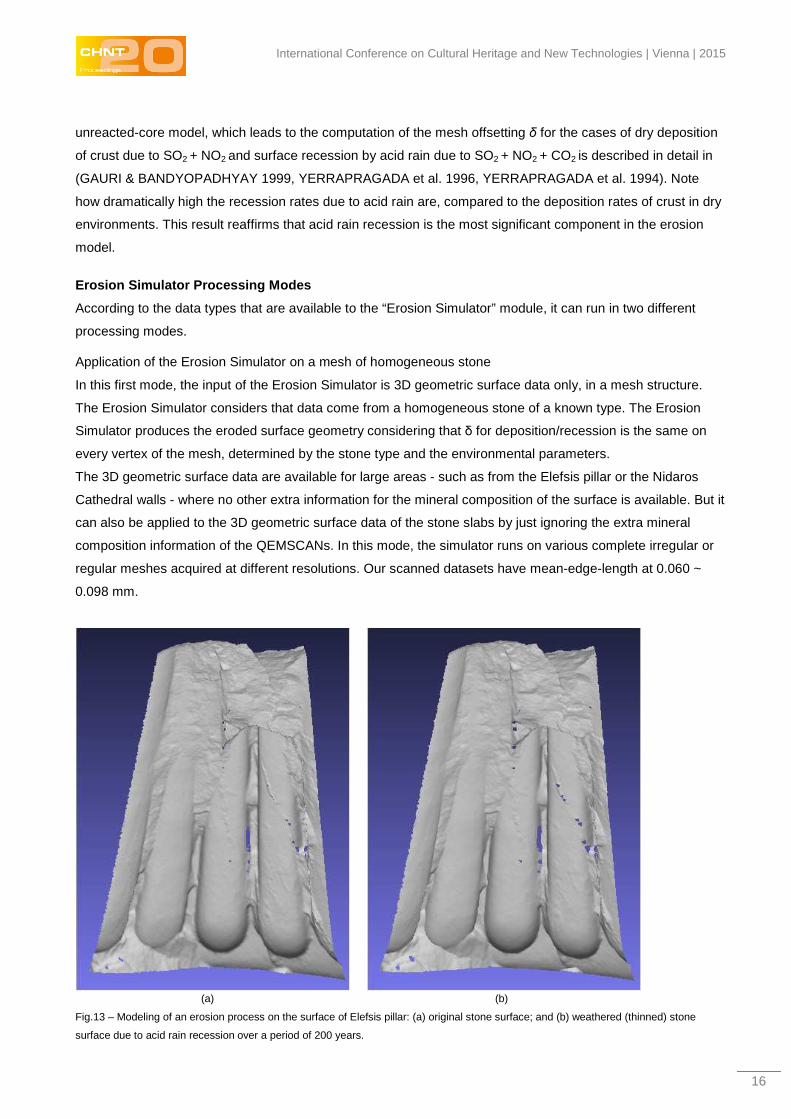
(a) (b)
Fig.13 – Modeling of an erosion process on the surface of Elefsis pillar: (a) original stone surface; and (b) weathered (thinned) stone
surface due to acid rain recession over a period of 200 years.
Perakis | Schellewald | Gebremariam | Theoharis – Simulating Erosion on Monuments
17
For example the implementation of this fundamental surface offsetting model is applied to the surface mesh of
the Elefsis pillar. The effect of this thinning process is depicted in Fig.13. The result simulates the acid rain
recession on marble, under certain environmental conditions over a period of 200 years, yielding a surface
offset of almost 3.4 mm. The computation of the recession rate is an implementation of the (GAURI &
BANDYOPADHYAY 1999) model.
Application of the Erosion Simulator on a mesh textured with a mineral map
The physico-chemical aspects of the erosion involves geometrical information and physicochemical data on
the surface of the object being eroded. In this second mode, the input of the Erosion Simulator involves
geometric information in the form of a mesh and mineral data assigned on the surface of the object being
eroded. The surface physico-chemical data of the stone slabs can be created by registering the available 3D
scanned meshes and the QEMSCAN texture information. The Erosion Simulator produces the eroded surface
geometry considering that δ for deposition/recession is different on every vertex of the mesh, and is
determined by the mineral type assigned to it and the environmental parameters. δ dependencies on mineral
attributes have to be determined by experimental data.
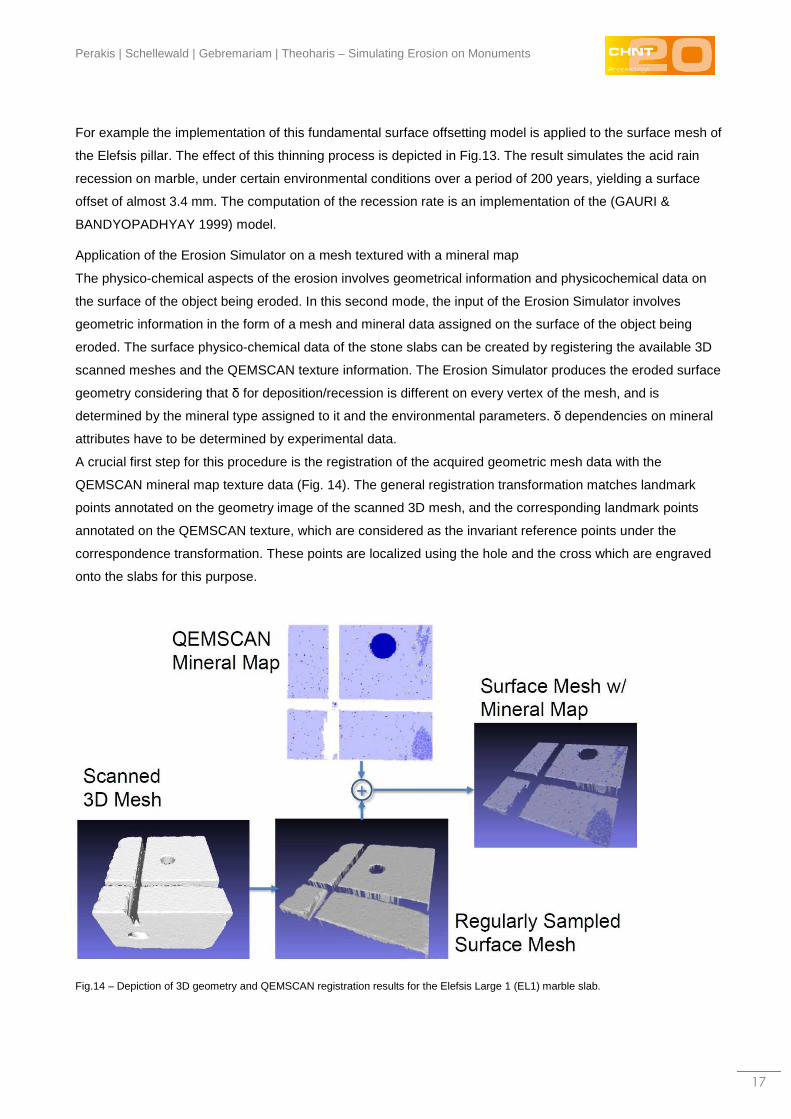
A crucial first step for this procedure is the registration of the acquired geometric mesh data with the
QEMSCAN mineral map texture data (Fig. 14). The general registration transformation matches landmark
points annotated on the geometry image of the scanned 3D mesh, and the corresponding landmark points
annotated on the QEMSCAN texture, which are considered as the invariant reference points under the
correspondence transformation. These points are localized using the hole and the cross which are engraved
onto the slabs for this purpose.
Fig.14 – Depiction of 3D geometry and QEMSCAN registration results for the Elefsis Large 1 (EL1) marble slab.
International Conference on Cultural Heritage and New Technologies | Vienna | 2015
18
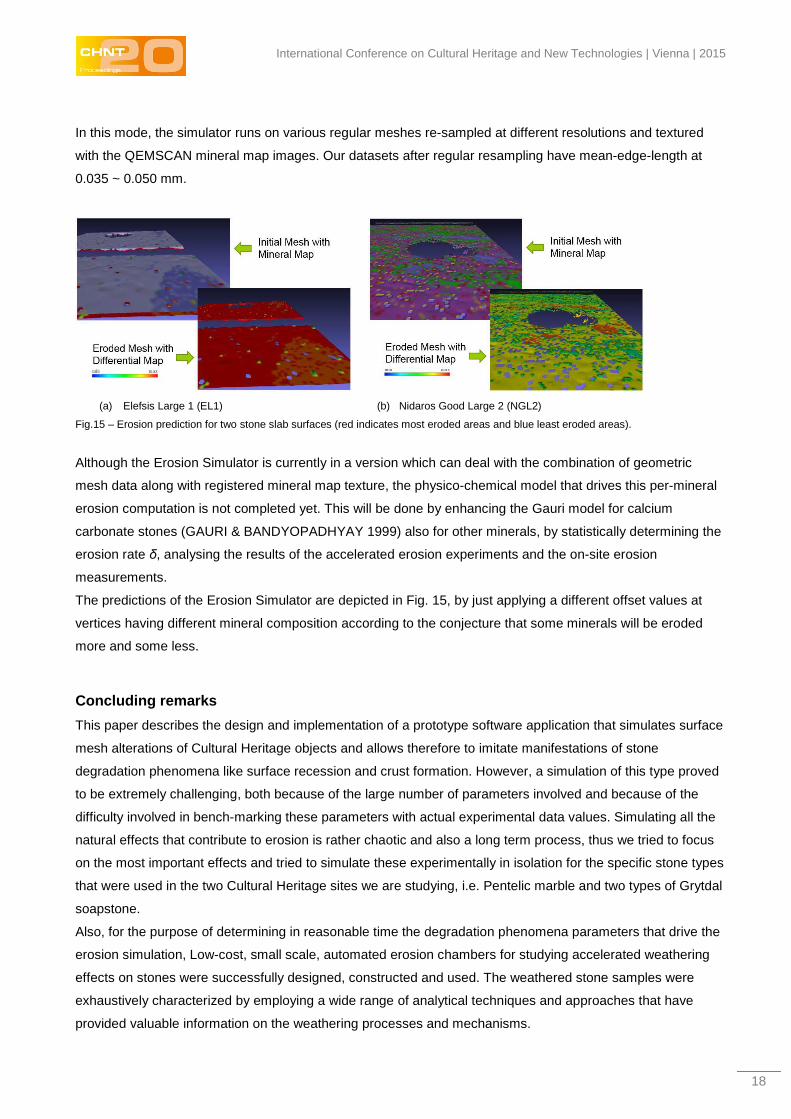
In this mode, the simulator runs on various regular meshes re-sampled at different resolutions and textured
with the QEMSCAN mineral map images. Our datasets after regular resampling have mean-edge-length at
0.035 ~ 0.050 mm.
(a) Elefsis Large 1 (EL1) (b) Nidaros Good Large 2 (NGL2)
Fig.15 – Erosion prediction for two stone slab surfaces (red indicates most eroded areas and blue least eroded areas).
Although the Erosion Simulator is currently in a version which can deal with the combination of geometric
mesh data along with registered mineral map texture, the physico-chemical model that drives this per-mineral
erosion computation is not completed yet. This will be done by enhancing the Gauri model for calcium
carbonate stones (GAURI & BANDYOPADHYAY 1999) also for other minerals, by statistically determining the
erosion rate δ, analysing the results of the accelerated erosion experiments and the on-site erosion
measurements.
The predictions of the Erosion Simulator are depicted in Fig. 15, by just applying a different offset values at
vertices having different mineral composition according to the conjecture that some minerals will be eroded
more and some less.
Concluding remarks
This paper describes the design and implementation of a prototype software application that simulates surface
mesh alterations of Cultural Heritage objects and allows therefore to imitate manifestations of stone
degradation phenomena like surface recession and crust formation. However, a simulation of this type proved
to be extremely challenging, both because of the large number of parameters involved and because of the
difficulty involved in bench-marking these parameters with actual experimental data values. Simulating all the
natural effects that contribute to erosion is rather chaotic and also a long term process, thus we tried to focus
on the most important effects and tried to simulate these experimentally in isolation for the specific stone types
that were used in the two Cultural Heritage sites we are studying, i.e. Pentelic marble and two types of Grytdal
soapstone.
Also, for the purpose of determining in reasonable time the degradation phenomena parameters that drive the
erosion simulation, Low-cost, small scale, automated erosion chambers for studying accelerated weathering
effects on stones were successfully designed, constructed and used. The weathered stone samples were
exhaustively characterized by employing a wide range of analytical techniques and approaches that have
provided valuable information on the weathering processes and mechanisms.
Perakis | Schellewald | Gebremariam | Theoharis – Simulating Erosion on Monuments
19
Although the design of the “Erosion Simulator” software is in its final stage, there are still some unsolved
issues that have to be addressed. These mostly come from the fact that the interpretation of the results from
the accelerated weathering experiments on the marble and soapstone at macroscopic and microscopic levels
is still in progress, and although we can infer that the investigation conducted has given an insight into the
changes occurring during erosion/weathering of these stones, the difficulties for incorporating these qualitative
results in a quantitative simulation model still remain.
Some of the challenges that we faced and have to be addressed in future work are the following:
– ICP registration is not sufficient. By minimising the overall registration error, it ”misses” the possible
erosion ”common” to all points. For this reason, it is only possible to measure relative rather than
absolute erosion values since there are no external fixed reference points.
– The erosion model, which has been yet implemented in the Erosion Simulator, is only applicable to
calcium carbonate stones exposed to acid rain polluted by SO2 and NO2.
– The Nidaros slabs exhibited an unexpected swelling behaviour in both acid solution chambers; this
has not yet been interpreted or modelled.
– The per-mineral recession rates of the stones exposed in the chemical erosion chambers seem quite
chaotic and difficult to be related to the experimental parameters of the erosion chambers.
– The environmental parameters and real exposure times used by the model have not yet been related
to the physico-chemical parameters of the and exposure times of the accelerated erosion chambers.
Acknowledgments
This research is part of the PRESIOUS project and has received funding from the European Union’s Seventh
Framework Programme STREP Project under grant agreement no 600533.
International Conference on Cultural Heritage and New Technologies | Vienna | 2015
20
Stone Samples
Stone Material Experiment
EL1 Elefsis Large 01 Pentelic Marble Freeze − Thaw
EL2 Elefsis Large 02 Pentelic Marble Salt
EL3 Elefsis Large 03 Pentelic Marble H2SO4+HNO3(aq) Acid
ES1 Elefsis Small 01 Pentelic Marble H2SO4(aq) Acid
NBL1 Nidaros Bad Large 01 Grytdal Soapstone Freeze − Thaw
NBL2 Nidaros Bad Large 02 Grytdal Soapstone Salt
NBL3 Nidaros Bad Large 03 Grytdal Soapstone H2SO4+HNO3(aq) Acid
NBS1 Nidaros Bad Small 01 Grytdal Soapstone H2SO4(aq) Acid
NGL1 Nidaros Good Large 01 Grytdal Soapstone Freeze − Thaw
NGL2 Nidaros Good Large 02 Grytdal Soapstone Salt
NGL3 Nidaros Good Large 03 Grytdal Soapstone H2SO4+HNO3(aq) Acid
NGS1 Nidaros Good Small 01 Grytdal Soapstone H2SO4(aq) Acid
Tab. 1 – Stone samples labeling, material and associate experiment.
Mass Loss ∆m (gr)
Stone m1 gr
m2 gr ∆m gr
∆m/m %
EL1 Freeze − Thaw 29.1283 29.0847 -0.0436 -0.15
EL2 Salt 25.0409 24.8459 -0.1950 -0.78
EL3 Acid H2SO4+HNO3(aq) 27.7475 27.5328 -0.2147 -0.77
ES1 Acid H2SO4(aq) 27.8519 27.5989 -0.2530 -0.91
NBL1 Freeze − Thaw 169.2780 168.8975 -0.3805 -0.22
NBL2 Salt 195.8884 188.9025 -6.9859 -3.57
NBL3 Acid H2SO4+HNO3(aq) 140.1745 139.3690 -0.8055 -0.57
NBS1 Acid H2SO4(aq) 29.9790 29.6084 -0.3706 -1.24
NGL1 Freeze − Thaw 101.7920 101.7464 -0.0456 -0.04
NGL2 Salt 161.2788 160.5487 -0.7301 -0.45
NGL3 Acid H2SO4+HNO3(aq) 143.4905 143.2244 -0.2661 -0.19
NGS1 Acid H2SO4(aq) 20.7092 20.6273 -0.0819 -0.40
Tab. 2 – Measurements of the mass loss for the different stone slabs. m1 initial mass, m2 mass after 1st erosion cycle.
Mean Erosion δ (mm)
Stone V1
cm3 V2
cm3 ∆V
cm3 S
cm2 δ
mm EL1 Freeze – Thaw 10.8250 10.7281 -0.0969 31.3598 -0.0309
EL2 Salt 9.3050 9.1773 -0.1277 28.3975 -0.0450
EL3 Acid H2SO4+HNO3(aq) 10.2961 10.1391 -0.1570 29.7689 -0.0527
ES1 Acid H2SO4(aq) 10.3216 10.1510 -0.1706 29.9718 -0.0569
NBL1 Freeze − Thaw (∗) 61.9314 61.7922 -0.1392 120.5537 -0.0115
NBL2 Salt 70.3382 68.6979 -1.6403 126.5692 -0.1296
NBL3 Acid H2SO4+HNO3(aq) 49.6610 50.6684 1.0074 97.4351 0.1034
NBS1 Acid H2SO4(aq) 10.8753 11.1004 0.2251 32.9741 0.0683
NGL1 Freeze − Thaw (∗) 35.4548 35.4389 -0.0159 72.1983 -0.0022
NGL2 Salt (∗) 55.5347 55.2833 -0.2514 102.9147 -0.0244
NGL3 Acid H2SO4+HNO3(aq) 49.2560 49.3007 0.0447 103.6453 0.0043
NGS1 Acid H2SO4(aq) 7.1383 7.1294 -0.0089 24.6578 -0.0036
Tab. 3 – Computation of the mean erosion for the different stone slabs: (a) Cubic volume approximation; and (b) Surface area
approximation. (∗) Volume V1 computed from mass m1 using density ρ2 considered constant.
Perakis | Schellewald | Gebremariam | Theoharis – Simulating Erosion on Monuments
21
References AICON 3D systems (2015), ‘http://aicon3d.com/start.html’.
ARDUINO LLC (2015), ‘http://www.arduino.cc/’.
BESL, P. J. & MCKAY, N. D. (1992), ‘A method for registration of 3-D shapes’, IEEE Trans. Pattern Anal. Mach. Intell. 14(2), 239–256.
DOEHNE, E. & PRICE, C. A. (2010), Stone conservation: An overview of current research, Technical report, Getty Conservation Institute,
Los Angeles, US.
GAURI, K. L. & BANDYOPADHYAY, J. K. (1999), Carbonate Stone, Chemical Behaviour, Durability and Conservation, John Wiley &
Sons, Inc.
MASSEY, S. (1999), ‘The effects of ozone and {NOx} on the deterioration of calcareous stone’, Science of The Total Environment 227(2–
3), 109–121.
MOROPOULOU, A., BISBIKOU, K., ToRfs, K., van GRIEKEN, R., ZEZZA, F. & MACRI, F. (1998), ‘Origin and growth of weathering crusts
on ancient marbles in industrial atmosphere’, Atmospheric Environment 32(6), 967–982.
PRICE, D. G. (1995), ‘Weathering and weathering processes’, Quarterly Journal of Engineering Geology and Hydrogeology 28(3), 243–
252.
ROBERTSON CGG (2015), ‘http://www.robertson-cgg.com/’.
SCHELLEWALD, C., THEOHARIS, T., GEBREMARIAM, K. F. & KVITTINGEN, L. (2013), State of the art report on deterioration
simulation, Technical Report PRESIOUS-D3.1, NTNU, Trondheim, Norway.
SCHERER, G. (2006), Internal stress and cracking in stone and masonry, in M. KONSTA-GDOUTOS, ed., ‘Measuring, Monitoring and
Modeling Concrete Properties’, Springer Netherlands, pp. 633–641.
STOREMYR, P. (1997), The stones of Nidaros: an applied weathering study of Europe’s northernmost medieval cathedral, PhD thesis,
Norwegian University of Science and Technology (NTNU).
STOREMYR, P. (2004), ‘Weathering of soapstone in a historical perspective’, Materials Characterization 53, 191–207.
STOREMYR, P., WENDLER, E. & ZEHNDER, K. (2001), Weathering and conservation of soapstone and greenschist used at Nidaros
Cathedral (Norway), in A. Lunde, Ø. & Gunnarsjaa, ed., ‘Report Raphael II Nidaros Cathedral Restoration Trondheim Norway 2000.’, EC
Raphael Programme – European Heritage Laboratory.
VAROTSOS, C., TZANIS, C. & CRACKNELL, A. (2009), ‘The enhanced deterioration of the cultural heritage monuments due to air
pollution’, Environ Sci Pollut Res 16, 590–592.
YERRAPRAGADA, S., CHIRRA, S., JAYNES, J., Li, S., BANDYOPADHYAY, J. & GAURI, K. (1996), ‘Weathering rates of marble in
laboratory and outdoor conditions’, Journal of Environmental Engineering 122(9), 856–863.
YERRAPRAGADA, S. S., JAYNES, J. H., CHIRRA, S. R. & GAURI, K. L. (1994), ‘Rate of weathering of marble due to dry deposition of
ambient sulfur and nitrogen dioxides’, Analytical Chemistry 66(5), 655–659.
Imprint:
Proceedings of the 20th International Conference on Cultural Heritage and New Technologies 2015 (CHNT 20, 2015)
Vienna 2016
http://www.chnt.at/proceedings-chnt-20/
ISBN 978-3-200-04698-6
Editor/Publisher: Museen der Stadt Wien – Stadtarchäologie
Editorial Team: Wolfgang Börner, Susanne Uhlirz
The editor’s office is not responsible for the linguistic correctness of the manuscripts.
Authors are responsible for the contents and copyrights of the illustrations/photographs.