Simplifying Success
25
Simplifying Success An Ecosystem Initiative for Improving the Financial Sustainability of Independent Digital News Media in Restricted Markets A report to Internews June 2021 Jason Lambert Senior Director, Media Business: Internews
Transcript of Simplifying Success
Simplifying Success
An Ecosystem Initiative for Improving the
Financial Sustainability of Independent
Digital News Media in Restricted Markets
A report to Internews
June 2021
Jason LambertSenior Director, Media Business: Internews
Simplifying Success2
About the author & Acknowledegments 3
Executive summary 4
Background 6
Purpose of this report 7
Analysis: Market challenges 8
Foundational research 9
Initial findings 16
Embedding the 16 Media types in a Platform for all 17
Further recommendations 24
Endnotes 25
Table of Contents
Simplifying Success3
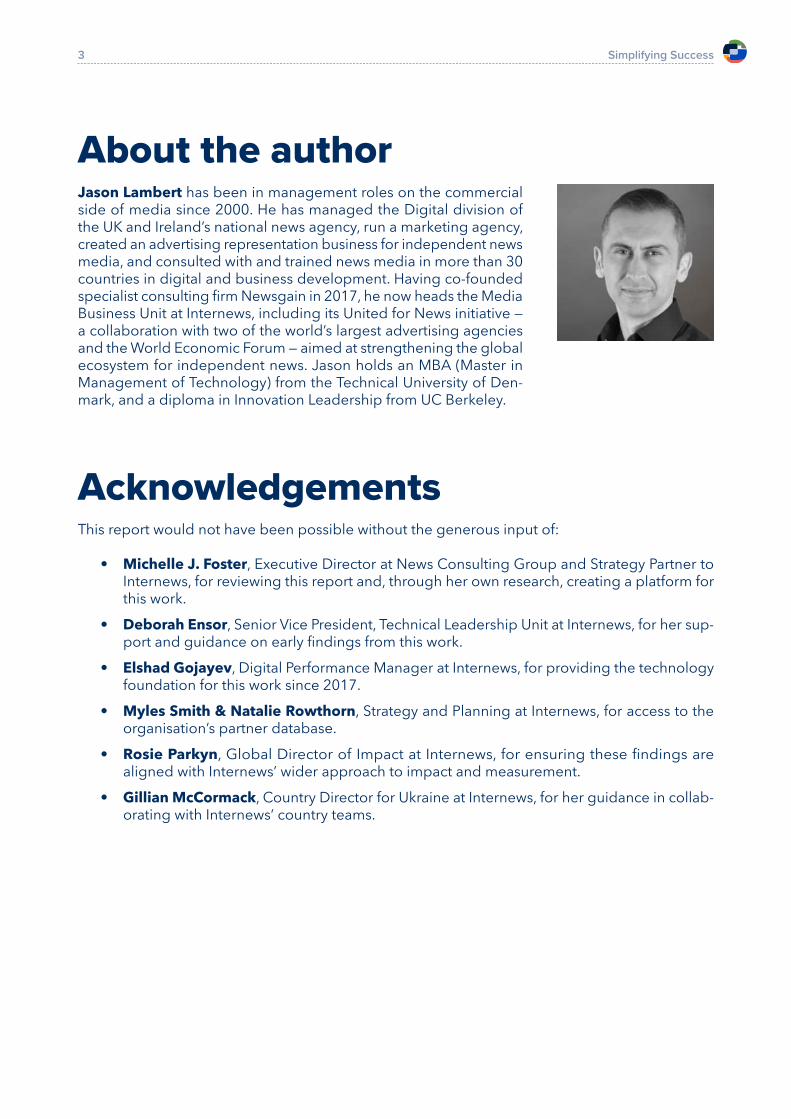
About the authorJason Lambert has been in management roles on the commercial side of media since 2000. He has managed the Digital division of the UK and Ireland’s national news agency, run a marketing agency, created an advertising representation business for independent news media, and consulted with and trained news media in more than 30 countries in digital and business development. Having co-founded specialist consulting firm Newsgain in 2017, he now heads the Media Business Unit at Internews, including its United for News initiative — a collaboration with two of the world’s largest advertising agencies and the World Economic Forum — aimed at strengthening the global ecosystem for independent news. Jason holds an MBA (Master in Management of Technology) from the Technical University of Den-mark, and a diploma in Innovation Leadership from UC Berkeley.
AcknowledgementsThis report would not have been possible without the generous input of:
• Michelle J. Foster, Executive Director at News Consulting Group and Strategy Partner to Internews, for reviewing this report and, through her own research, creating a platform for this work.
• Deborah Ensor, Senior Vice President, Technical Leadership Unit at Internews, for her sup-port and guidance on early findings from this work.
• Elshad Gojayev, Digital Performance Manager at Internews, for providing the technology foundation for this work since 2017.
• Myles Smith & Natalie Rowthorn, Strategy and Planning at Internews, for access to the organisation’s partner database.
• Rosie Parkyn, Global Director of Impact at Internews, for ensuring these findings are aligned with Internews’ wider approach to impact and measurement.
• Gillian McCormack, Country Director for Ukraine at Internews, for her guidance in collab-orating with Internews’ country teams.
Simplifying Success4
Executive summaryThis report aims to progress the media development sector’s work towards the financial sustain-ability of independent news media. It proposes a new ecosystem-level framework for categorising media outlets, measuring their performance and making them more resilient to their obstacles in reaching and generating income from audiences and businesses.
The proposed framework is intended for use by media development implementers (such as Internews), media outlets, donors, technologists and research partners.
If there were an obvious solution to the financial sustainability of such news media, it would have been found. While the media development sector works to understand and improve enabling environments for independent news media and build their capacities, there is no framework for systematically identifying a media outlet’s development needs that is lightweight and fast to use, which connects to live data, looks ahead and can surface strategies for future success.
Solving the problem of media sustainability now requires sectoral collaboration to better under-stand what makes media outlets successful.
While this is a global problem, the report focuses on freedom-restricted countries in which news media are supported by Official Development Assistance (ODA).
The proposed solutionThis report makes two primary suggestions.
The first is adoption of a framework that classifies independent news media outlets in freedom-re-stricted countries. This research identifies a framework that uses four characteristics, derived from analysis of existing tools created by Internews, Newsgain and DW Akademie.
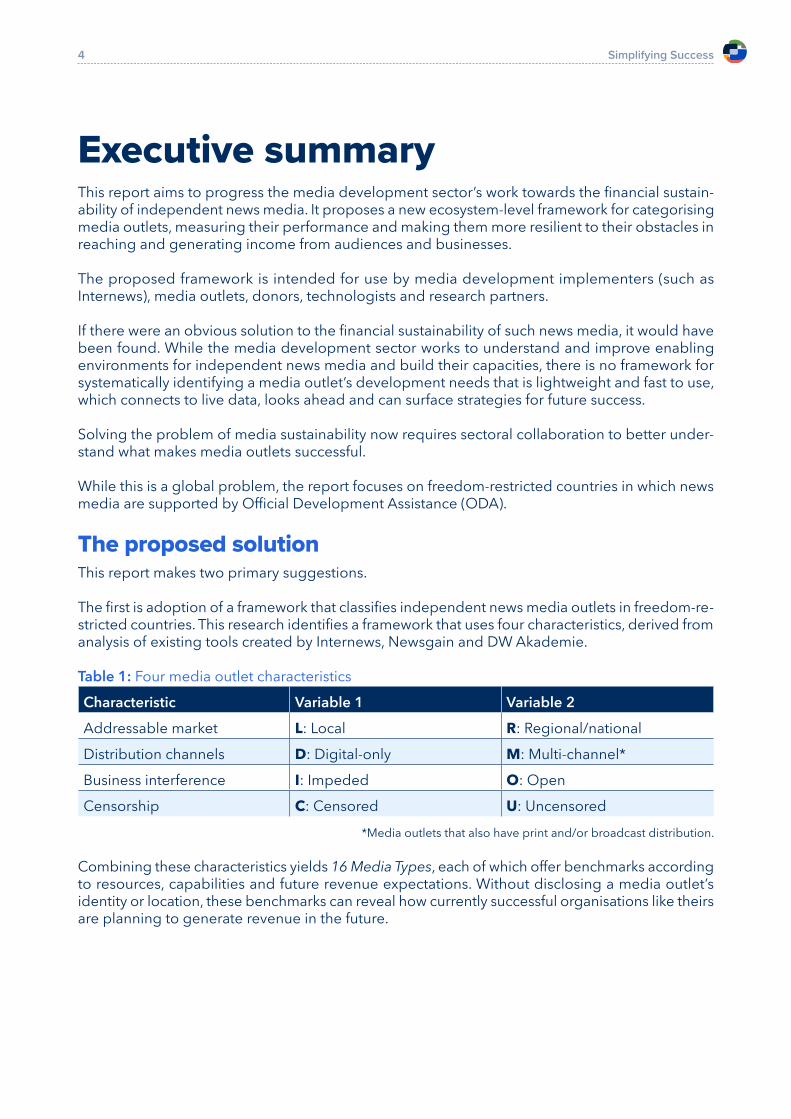
Table 1: Four media outlet characteristics
Characteristic Variable 1 Variable 2
Addressable market L: Local R: Regional/nationalDistribution channels D: Digital-only M: Multi-channel*Business interference I: Impeded O: OpenCensorship C: Censored U: Uncensored
*Media outlets that also have print and/or broadcast distribution.
Combining these characteristics yields 16 Media Types, each of which offer benchmarks according to resources, capabilities and future revenue expectations. Without disclosing a media outlet’s identity or location, these benchmarks can reveal how currently successful organisations like theirs are planning to generate revenue in the future.
Simplifying Success5
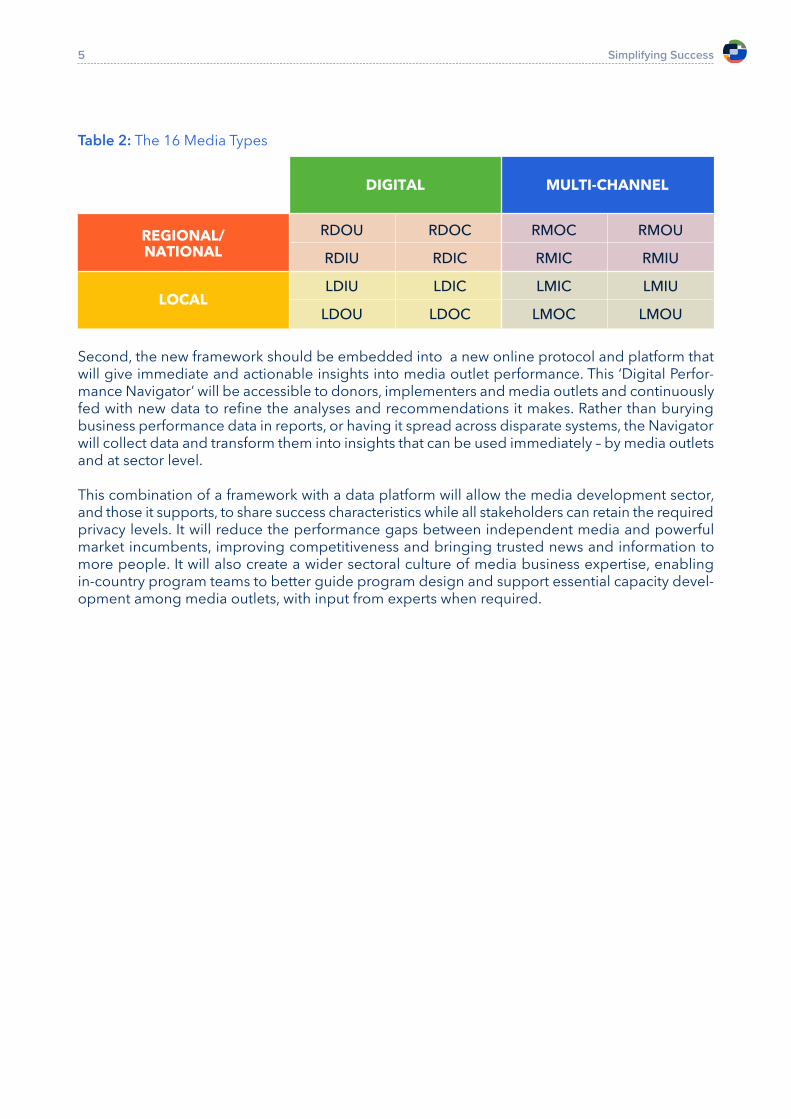
Table 2: The 16 Media Types
Second, the new framework should be embedded into a new online protocol and platform that will give immediate and actionable insights into media outlet performance. This ‘Digital Perfor-mance Navigator’ will be accessible to donors, implementers and media outlets and continuously fed with new data to refine the analyses and recommendations it makes. Rather than burying business performance data in reports, or having it spread across disparate systems, the Navigator will collect data and transform them into insights that can be used immediately – by media outlets and at sector level.
This combination of a framework with a data platform will allow the media development sector, and those it supports, to share success characteristics while all stakeholders can retain the required privacy levels. It will reduce the performance gaps between independent media and powerful market incumbents, improving competitiveness and bringing trusted news and information to more people. It will also create a wider sectoral culture of media business expertise, enabling in-country program teams to better guide program design and support essential capacity devel-opment among media outlets, with input from experts when required.
MULTI-CHANNELDIGITAL
REGIONAL/
NATIONAL
LOCAL
RDOU
RDIU
LDIU
LDOU
RDOC
RDIC
LDIC
LDOC
RMOC
RMIC
LMIC
LMOC
RMOU
RMIU
LMIU
LMOU
Simplifying Success6
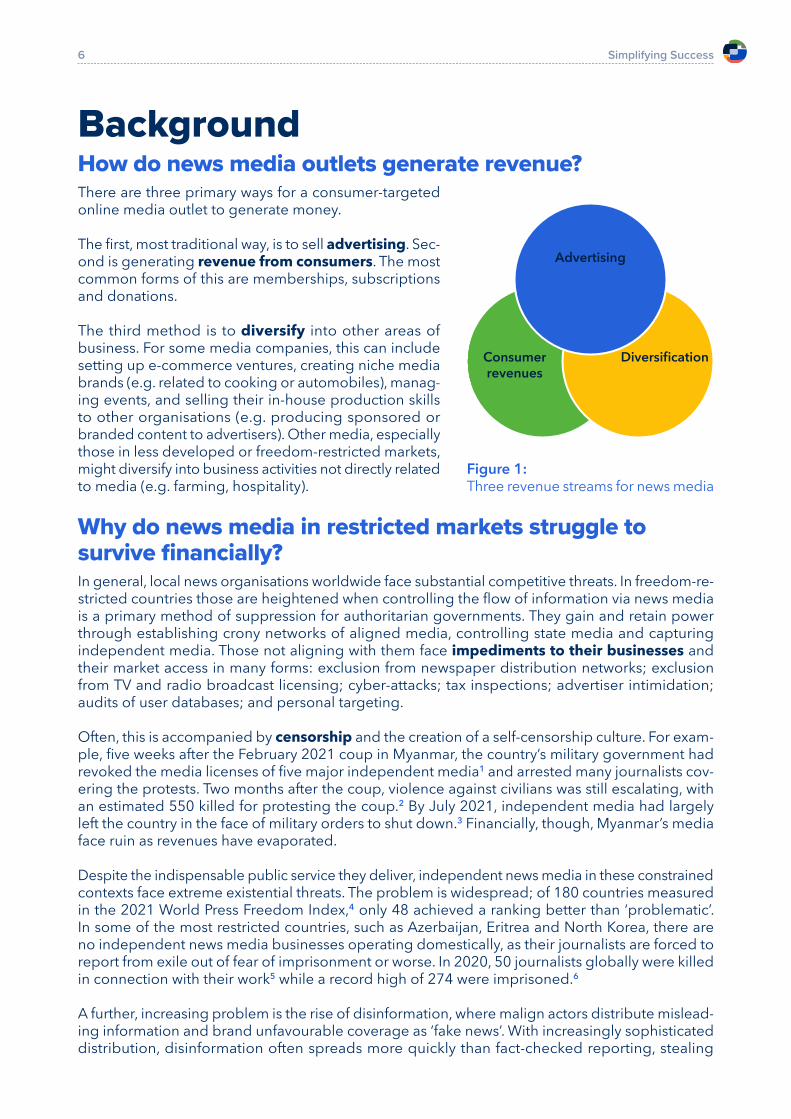
BackgroundHow do news media outlets generate revenue?There are three primary ways for a consumer-targeted online media outlet to generate money.
The first, most traditional way, is to sell advertising. Sec-ond is generating revenue from consumers. The most common forms of this are memberships, subscriptions and donations.
The third method is to diversify into other areas of business. For some media companies, this can include setting up e-commerce ventures, creating niche media brands (e.g. related to cooking or automobiles), manag-ing events, and selling their in-house production skills to other organisations (e.g. producing sponsored or branded content to advertisers). Other media, especially those in less developed or freedom-restricted markets, might diversify into business activities not directly related to media (e.g. farming, hospitality).
Why do news media in restricted markets struggle to survive financially?In general, local news organisations worldwide face substantial competitive threats. In freedom-re-stricted countries those are heightened when controlling the flow of information via news media is a primary method of suppression for authoritarian governments. They gain and retain power through establishing crony networks of aligned media, controlling state media and capturing independent media. Those not aligning with them face impediments to their businesses and their market access in many forms: exclusion from newspaper distribution networks; exclusion from TV and radio broadcast licensing; cyber-attacks; tax inspections; advertiser intimidation; audits of user databases; and personal targeting.
Often, this is accompanied by censorship and the creation of a self-censorship culture. For exam-ple, five weeks after the February 2021 coup in Myanmar, the country’s military government had revoked the media licenses of five major independent media1 and arrested many journalists cov-ering the protests. Two months after the coup, violence against civilians was still escalating, with an estimated 550 killed for protesting the coup.2 By July 2021, independent media had largely left the country in the face of military orders to shut down.3 Financially, though, Myanmar’s media face ruin as revenues have evaporated.
Despite the indispensable public service they deliver, independent news media in these constrained contexts face extreme existential threats. The problem is widespread; of 180 countries measured in the 2021 World Press Freedom Index,4 only 48 achieved a ranking better than ‘problematic’. In some of the most restricted countries, such as Azerbaijan, Eritrea and North Korea, there are no independent news media businesses operating domestically, as their journalists are forced to report from exile out of fear of imprisonment or worse. In 2020, 50 journalists globally were killed in connection with their work5 while a record high of 274 were imprisoned.6
A further, increasing problem is the rise of disinformation, where malign actors distribute mislead-ing information and brand unfavourable coverage as ‘fake news’. With increasingly sophisticated distribution, disinformation often spreads more quickly than fact-checked reporting, stealing
Figure 1: Three revenue streams for news media
Advertising
Consumer revenues
Diversification

Simplifying Success7
public opinion and advertising revenues away from trusted news media. This has contributed to a ‘raging infodemic’ globally that feeds mistrust.7
In less overtly oppressive contexts, sometimes the economics of producing news are just difficult to balance. Local, hyperlocal and community media can lack the addressable market size to sustain teams of salaried, professional journalists. The economics might have worked in past decades of print and broadcast media, but the highly targeted, digital age brings information and advertising efficiencies that such media were not designed for. Further, many media outlets, especially those rooted in activism, have capability shortages in knowing how to run a successful media business.
Even in highly developed media markets like the United States, which was listed only as 44th in the 2021 World Press Freedom Index, local news is facing extinction. There are now 1,300 com-munities there with no local news coverage at all.8
Purpose of this reportWhile much research is conducted in news media sustainability, including identification of rele-vant viability indicators for markets and media outlets operating in them, there is no agreement on indicators or any toolkit for determining how different types of news media outlet can become financially sustainable in different types of freedom-restricted markets.
This was confirmed in comments from Josh Machleder, Senior Advisor for Media and Internet Freedom at USAID:
‘…unfortunately, we really have been grappling with a good set of indicators on media management and business practice. We don’t have a lot of programming that has been very intentional and demanding in this area (except in a few countries where we saw that independent media was not tapping into the market to the full extent possible). We do recognize that this needs to be prioritized if independent media are to survive, and our USAID assistance is to be relevant.’
9
To answer this sectoral problem, this report creates an evidence-based framework to identify development efforts that independent news media, and those supporting them, can prioritise in becoming more financially sustainable as quickly and efficiently as possible.
Delimitations• While learnings can be taken from countries with ‘fairly good’ or ‘good’ press freedom, this
report focuses on those with a 2021 RSF World Press Freedom Index ranking of ‘problem-atic’ or lower, from which survey responses were received.
• While the media development sector covers all forms of independent news media, only media with an online presence will be evaluated. The secular shift to digital media has been accelerated; for news media businesses to survive into the future, they must establish a strong online presence.
• This report focuses on ways for media outlets to generate revenue, the assumption being that this study’s measure of profitability encapsulates revenues minus costs. There is no in-depth analysis of costs.
• This report does not explore media outlets’ administrative resources and capabilities such as finance, legal, accounting and human resources.
Simplifying Success8
Analysis: Market challengesThe global digital advertising market is growing, so why are independent news media struggling to capture that revenue?Even in countries that are not freedom restricted, the past two decades of secular shift in news con-sumption from print and broadcast media to digital platforms — with their personalised targeting and increased advertising efficiency — have left most independent news media outcompeted for audiences and revenues. Technology giants, such as Facebook and Google, win by aggregating audiences and applying algorithms to large datasets of content consumption behaviour to drive ever-increasing engagement and loyalty.
For online, independent news media, the result is that advertising revenues are increasingly challenging for them to capture. Globally in 2020, the $628 billion dollar advertising market had grown by 5.1% compared to 2019, with digital spend growing at more than double the pace at 11.1%.10 However, in this burgeoning digital sector, Facebook, Google and Amazon now collect 62% of digital ad spend.11 In the UK, Facebook and Google alone capture almost 70% of digital ad spend.12
Coronavirus accelerated the shift to digital and the financial pressure on news mediaCoronavirus has accelerated the shift to digital news platforms, as newspaper distribution faltered, and physical delivery became less feasible during lockdowns.
Businesses froze their advertising campaigns, while major brands used broad keyword blocking to avoid advertising adjacencies with Covid-related news topics, resulting in most digital news media being excluded from their targeting. This slashed at least 30% from their traditional revenue base.13
Coronavirus has been attributed as the cause for large numbers of news media closures and staff cutbacks since March 2020, with 65 media outlets closing in the United States.14 For many other countries, equivalent data is hard to find although there are reports of media outlets across Africa closing their print operations in favour of digital operations while ‘they have not figured out how to make money online.’15 Media in Kenya were particularly affected, with major independent news media like Nation Media Group laying off large numbers of staff.16
What about revenue from consumers?Whereas print and broadcast media have historically been funded by a combination of audiences paying for access and businesses paying for access to those audiences, the culture of free infor-mation online has exacerbated the sustainability challenge for news media as users increasingly consume news online. While 72.5% of internet users now pay for content online, only 10% of those pay for news.17 Activating consumer revenue is much more dependent on audience trust, loyalty and visit frequency than advertising is, so in these winner-takes-most markets, smaller and medi-um-sized independent media are left chasing advertising revenues and diversifying into activities that are not necessarily related to their news-gathering business. As the purely advertising-driven business model increasingly fails to support digital news media, there is growing acceptance among consumers of the need to pay for online news. While this is now more common in some industrialised nations, with 42% of consumers in Norway paying for online news content in 2020, the UK was at just 7%.18 It will take years to be significant in many countries where Internews operates.
Simplifying Success9
What is the result of this adversity?When independent news media globally face a myriad of threats from the shift to digital, algo-rithmic audience engagement, the rise of disinformation and a pandemic, financial sustainability is far from assured.
In freedom-restricted markets, the business interference and censorship they face intensify the challenge.
Further, when independent media operate in freedom-restricted countries, they rarely have the same access to broadcast and print distribution channels as state-aligned media, and therefore lack the ability to cross-promote between online, print and broadcast distribution and to deliver multi-channel campaigns to advertisers.
The role of Official Development Assistance (ODA)To survive, many independent news media in freedom-restricted markets rely on funding from donor organisations — comprised of the overseas development agencies of industrialised democ-racies, and private sector organisations.19 Such funding always has time horizons, the aim being to support the distribution of fact-based information while nurturing media businesses off support. USAID, which is the largest contributor to Official Development Assistance,20 has referred to this as the ‘journey to self-reliance.’21
The scale and scope of funding towards media outlets varies according to donor priorities, market context and the needs of each media outlet. The most common components are: core funding to cover overheads and operational costs; project-based awards for specific activities; funding for capacity-building to improve the capabilities of media outlets.
Foundational researchThe Media Outlet SurveyIn developing a framework by which to classify media outlets, a survey was designed, based on the four sources outlined below.
• DW Akademie’s Media Viability Indicators:22 A comprehensive set of 104 indicators of mar-ket and organisational conditions that support media viability.
• Internews’ Organisational Capacity Assessment: A methodology for developing baselines and measuring change with 31 indicators of organisational capacity.
• Internews Due Diligence Questionnaire: A document that requests 110 datapoints cov-ering organisational contact details, financial processes and situation, and disclosures on propriety.
• Newsgain’s Business Planning Baselines: A survey with 136 questions, created by Michelle Foster before co-founding Newsgain, and adapted — with this report’s author — to the work Newsgain and Internews’ Media Business Unit have performed since 2017. It also includes topics covered by both the OCA and DDQ.
At the outset of this research, the aim was to understand the universe of factors that can impact a news media outlet’s ability to generate revenue. Although Newsgain and Internews had devel-oped their own their own standards, DW Akademie’s Media Viability Indicators (MVI), released in
Simplifying Success10
May 2020, were a step forward in comprehensiveness. The indicators are grouped into pillars that closely resemble the classic PESTLE analysis,23 designed to analyse markets according to Political, Economic, Sociological, Technological, Legal and Environmental factors. The MVI replaces PESTLE’s Sociological and Legal pillars with Community and Content & Expertise.
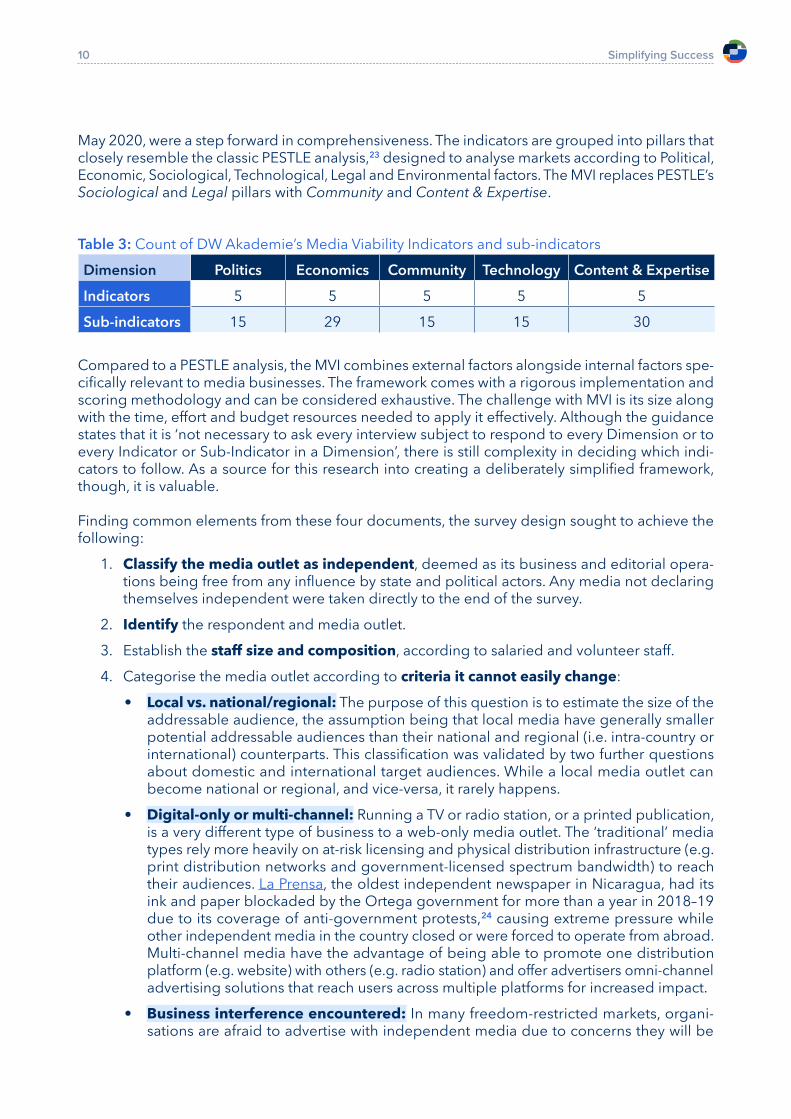
Table 3: Count of DW Akademie’s Media Viability Indicators and sub-indicatorsDimension Politics Economics Community Technology Content & Expertise
Indicators 5 5 5 5 5
Sub-indicators 15 29 15 15 30
Compared to a PESTLE analysis, the MVI combines external factors alongside internal factors spe-cifically relevant to media businesses. The framework comes with a rigorous implementation and scoring methodology and can be considered exhaustive. The challenge with MVI is its size along with the time, effort and budget resources needed to apply it effectively. Although the guidance states that it is ‘not necessary to ask every interview subject to respond to every Dimension or to every Indicator or Sub-Indicator in a Dimension’, there is still complexity in deciding which indi-cators to follow. As a source for this research into creating a deliberately simplified framework, though, it is valuable.
Finding common elements from these four documents, the survey design sought to achieve the following:
1. Classify the media outlet as independent, deemed as its business and editorial opera-tions being free from any influence by state and political actors. Any media not declaring themselves independent were taken directly to the end of the survey.
2. Identify the respondent and media outlet.
3. Establish the staff size and composition, according to salaried and volunteer staff.
4. Categorise the media outlet according to criteria it cannot easily change:• Local vs. national/regional: The purpose of this question is to estimate the size of the
addressable audience, the assumption being that local media have generally smaller potential addressable audiences than their national and regional (i.e. intra-country or international) counterparts. This classification was validated by two further questions about domestic and international target audiences. While a local media outlet can become national or regional, and vice-versa, it rarely happens.
• Digital-only or multi-channel: Running a TV or radio station, or a printed publication, is a very different type of business to a web-only media outlet. The ‘traditional’ media types rely more heavily on at-risk licensing and physical distribution infrastructure (e.g. print distribution networks and government-licensed spectrum bandwidth) to reach their audiences. La Prensa, the oldest independent newspaper in Nicaragua, had its ink and paper blockaded by the Ortega government for more than a year in 2018–19 due to its coverage of anti-government protests,24 causing extreme pressure while other independent media in the country closed or were forced to operate from abroad. Multi-channel media have the advantage of being able to promote one distribution platform (e.g. website) with others (e.g. radio station) and offer advertisers omni-channel advertising solutions that reach users across multiple platforms for increased impact.
• Business interference encountered: In many freedom-restricted markets, organi-sations are afraid to advertise with independent media due to concerns they will be
Simplifying Success11
targeted by state or political actors. In Belarus, for example, advertisements must carry a domestically registered company registration number so they can be traced back to the organisations that placed them. Foreign companies without a Belarus registration have thereby been excluded from advertising in the country. Business interference can also include media outlets being targeted by tax investigations, or having their license to operate withheld, withdrawn or unreasonably priced.
• Censorship encountered: In the most restrictive markets, governments exert direct control over the content available online, and journalism itself more widely. While most stop short of banning search engines and specific social media networks entirely, they do instruct domestic Internet Service Providers to block access to entire websites/plat-forms or specific pages of those platforms. In Azerbaijan, independent news websites such as Meydan TV and Azadliq are blocked. In Belarus, the Lukashenko government took the extraordinary step of using a military jet to re-route journalist Roman Prota-sevich’s Vilnius-bound passenger flight to Minsk, causing international outcry.25 While censored digital media can remain available to in-country audiences that use proxy services, such use is not widespread enough to reach all underserved audiences. Just as significant as external censorship, however, is self-censorship, whereby media refrain from publishing content due to the interference they expect from state or political actors from doing so.
5. Assess each media outlet’s perceived importance of having specific resources and capa-bilities related to running a media outlet. These included questions about pillars selected from analysis of the four source documents:• Governance includes having a strong board, a written strategy and the necessary reg-
istrations and licenses to operate.
• Brand includes having a strong, trusted brand that is represented consistently every-where it is used.
• Content focuses on producing a high volume of original, fact-based content that is brand-safe for advertisers and which includes audio and video.
• Audience focuses on the need for developing large, engaged, loyal audiences that can be analysed in depth, every day.
• Technology includes essential skills in running a digital media outlet, such as creating mobile-friendly websites, optimised for a great user experience that deliver advertising, take payments online and which are secure.
• Business development: focuses on the hiring of dedicated staff in sales, marketing and customer support roles — all directly connected to revenue.
These questions were asked in a standalone section without indicating that, in the following section, media outlets would be asked to rate their own performance on the same measures.
6. Capture each media outlet’s self-assessed performance against each of the resources and capabilities they had just evaluated the importance of. The purpose was to establish gaps, which could then be correlated to each type of media outlet (e.g. Digital-only media outlets placing higher importance on digital advertising than their multi-channel counterparts, and having a smaller skill gap to close).
7. A forecast on composition of prevalent digital news media revenues three years from now, according to various types of advertising and consumer-generated revenues (e.g. memberships, subscriptions). As an increasing number of media in unrestricted markets start collecting payments from audiences rather than relying on advertising, it is useful to correlate this to market contexts and any gaps in media outlets’ resources and capabilities.
Simplifying Success12
This section is designed to discover if media outlets have the required skills to capture the markets they expect to occupy in the future;
8. A forecast by each media outlet on the significance of media-related revenue diversifi-cation, into event management and media production.
9. Free-text answer to capture any other sources of revenue the media outlet expects to have in the future.
10. Profit percentage of each media outlet in the most recent fiscal year.11. Percentage of revenues from donors in the most recent fiscal year. This, combined with
the media outlet’s score for profit percentage, could create an understanding of financial sustainability.
12. Any other thoughts on the financial sustainability of news media.
With this structure, the survey allowed media to be categorised by types according to relatively fixed attributes of being local or regional/national and digital-only or multi-channel, which could then be deepened by adding measures of the business interference and censorship they encounter. The rest of the survey’s data enabled correlation between these characteristics and the media outlet’s resources and capabilities, along with an understanding of how each can determine financial sustainability and, therefore, how development efforts can be prioritised.
The survey was released in English, French, Russian and Ukrainian on 6 April 2021, distributed to a filtered list of Internews’ global partners and further promoted by country teams thanks to the support of Internews’ regional and country directors. By the time of closing ten days later, it had generated 143 responses, of which the 129 responses from independent media outlets were analysed. In total, an estimated 298 invitations were sent, meaning the completion rate was 48%. The survey invitation offered $100 to ten randomly chosen respondents.
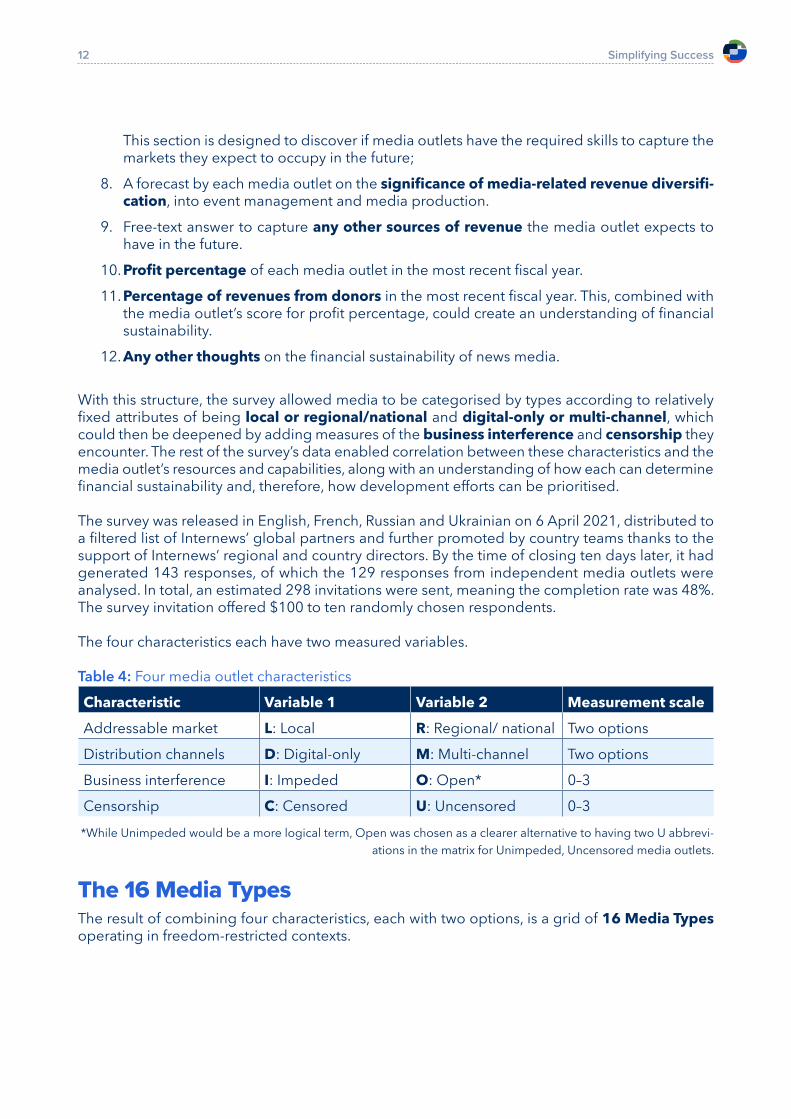
The four characteristics each have two measured variables.
Table 4: Four media outlet characteristics
Characteristic Variable 1 Variable 2 Measurement scale
Addressable market L: Local R: Regional/ national Two optionsDistribution channels D: Digital-only M: Multi-channel Two optionsBusiness interference I: Impeded O: Open* 0–3
Censorship C: Censored U: Uncensored 0–3
*While Unimpeded would be a more logical term, Open was chosen as a clearer alternative to having two U abbrevi-ations in the matrix for Unimpeded, Uncensored media outlets.
The 16 Media TypesThe result of combining four characteristics, each with two options, is a grid of 16 Media Types operating in freedom-restricted contexts.
Simplifying Success13
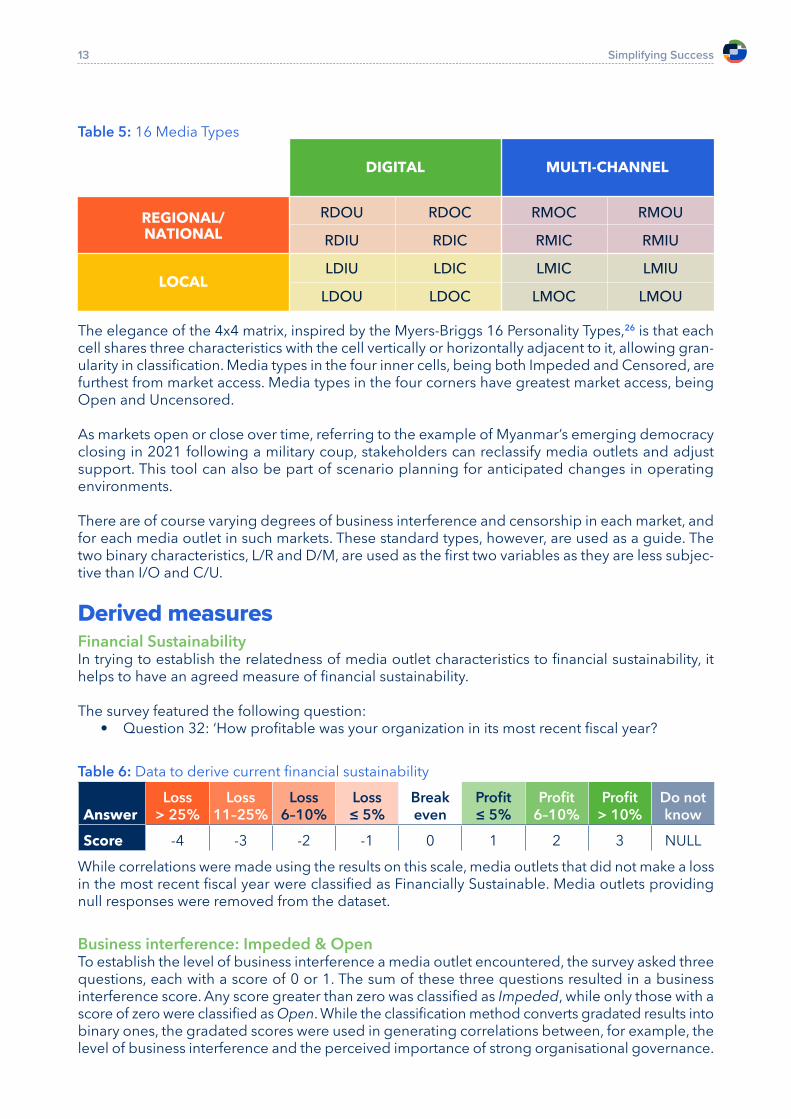
Table 5: 16 Media Types
The elegance of the 4x4 matrix, inspired by the Myers-Briggs 16 Personality Types,26 is that each cell shares three characteristics with the cell vertically or horizontally adjacent to it, allowing gran-ularity in classification. Media types in the four inner cells, being both Impeded and Censored, are furthest from market access. Media types in the four corners have greatest market access, being Open and Uncensored.
As markets open or close over time, referring to the example of Myanmar’s emerging democracy closing in 2021 following a military coup, stakeholders can reclassify media outlets and adjust support. This tool can also be part of scenario planning for anticipated changes in operating environments.
There are of course varying degrees of business interference and censorship in each market, and for each media outlet in such markets. These standard types, however, are used as a guide. The two binary characteristics, L/R and D/M, are used as the first two variables as they are less subjec-tive than I/O and C/U.
Derived measuresFinancial SustainabilityIn trying to establish the relatedness of media outlet characteristics to financial sustainability, it helps to have an agreed measure of financial sustainability.
The survey featured the following question:• Question 32: ‘How profitable was your organization in its most recent fiscal year?
Table 6: Data to derive current financial sustainability
AnswerLoss
> 25%Loss
11–25%Loss
6–10%Loss ≤ 5%
Break even
Profit ≤ 5%
Profit 6–10%
Profit > 10%
Do not know
Score -4 -3 -2 -1 0 1 2 3 NULLWhile correlations were made using the results on this scale, media outlets that did not make a loss in the most recent fiscal year were classified as Financially Sustainable. Media outlets providing null responses were removed from the dataset.
Business interference: Impeded & OpenTo establish the level of business interference a media outlet encountered, the survey asked three questions, each with a score of 0 or 1. The sum of these three questions resulted in a business interference score. Any score greater than zero was classified as Impeded, while only those with a score of zero were classified as Open. While the classification method converts gradated results into binary ones, the gradated scores were used in generating correlations between, for example, the level of business interference and the perceived importance of strong organisational governance.
MULTI-CHANNELDIGITAL
REGIONAL/
NATIONAL
LOCAL
RDOU
RDIU
LDIU
LDOU
RDOC
RDIC
LDIC
LDOC
RMOC
RMIC
LMIC
LMOC
RMOU
RMIU
LMIU
LMOU
Simplifying Success14
Censorship The same method, with three other questions, classified media outlets as Censored or Uncensored.
Survey representation of each characteristicThis analysis is based on a small sample of the many media outlets in the world. The responses represent the four top-level characteristics: Local/Regional, Digital/Multi-channel, Censored/Uncensored and Impeded/Open. As a proof of concept, though, the small dataset is still consid-ered a meaningful representation.
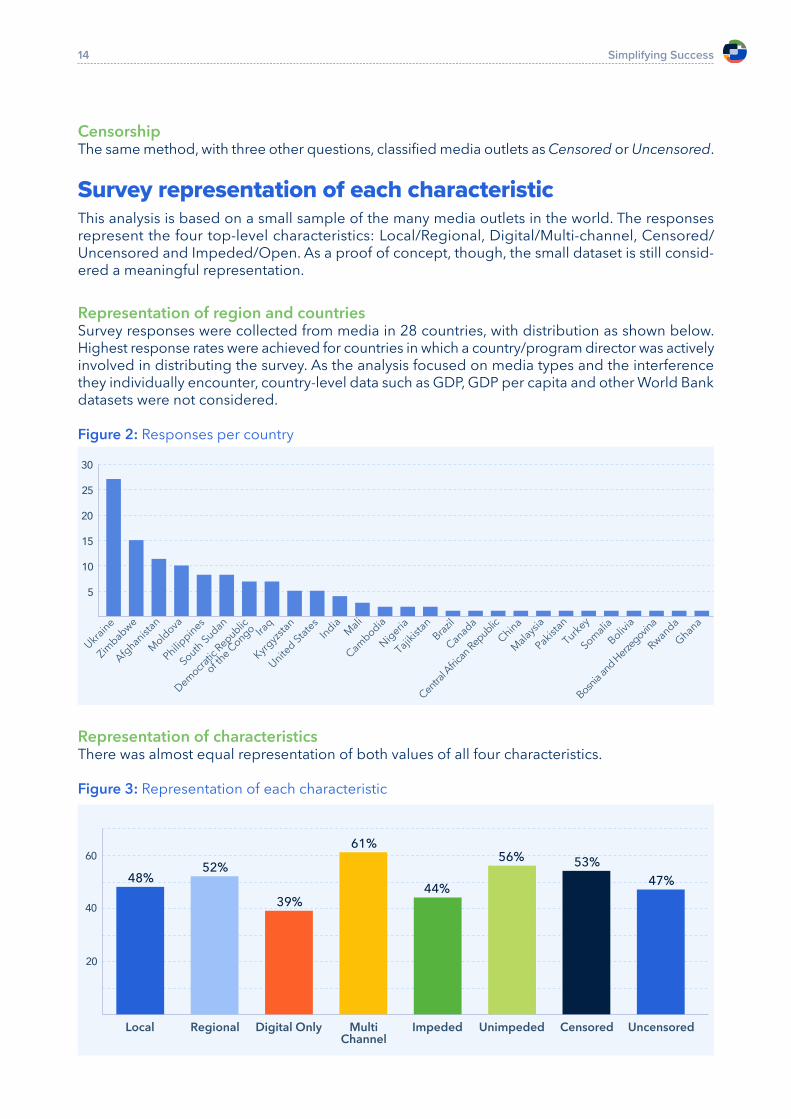
Representation of region and countriesSurvey responses were collected from media in 28 countries, with distribution as shown below. Highest response rates were achieved for countries in which a country/program director was actively involved in distributing the survey. As the analysis focused on media types and the interference they individually encounter, country-level data such as GDP, GDP per capita and other World Bank datasets were not considered.
Figure 2: Responses per country
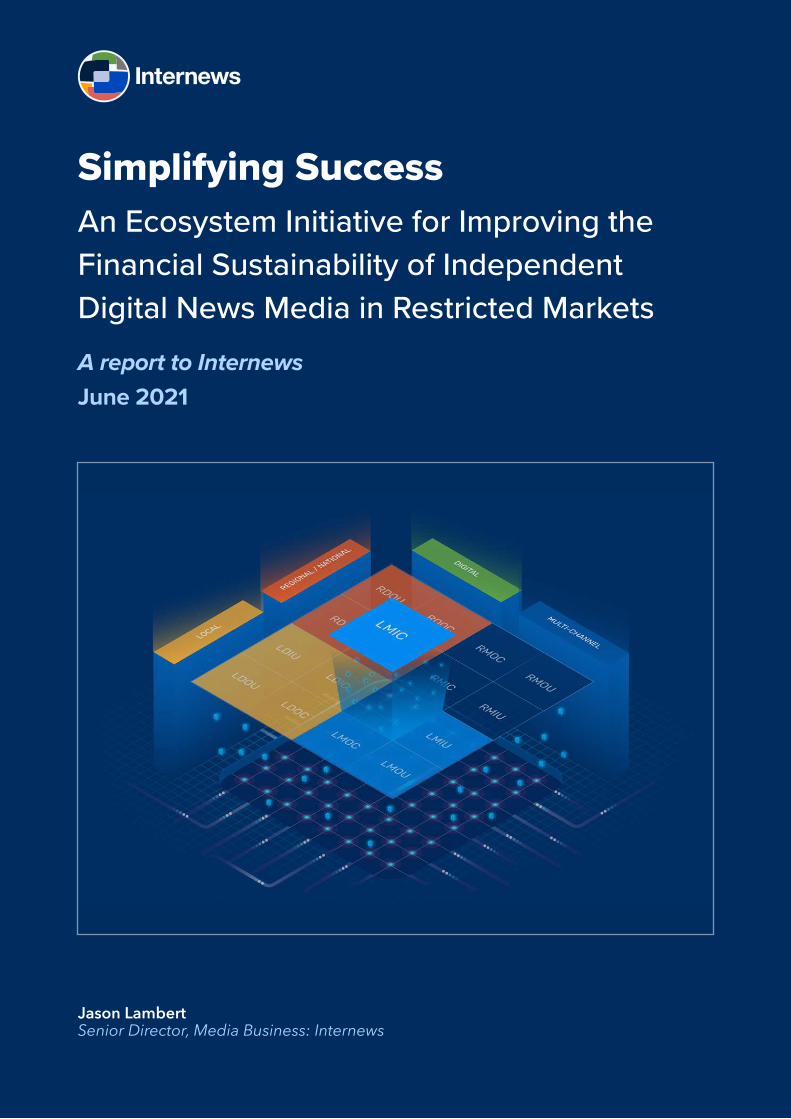
Representation of characteristicsThere was almost equal representation of both values of all four characteristics.
Figure 3: Representation of each characteristic
5
10
15
20
25
30
Ukraine
United S
tate
s
China
Zimbabwe
India
Malaysia
Afghanistan
Mali
Pakistan
Moldova
Cambodia
Turkey
Philippines
Nigeria
Somalia
Dem
ocrat
ic R
epublic
of the C
ongoBrazil
Bosnia
and H
erze
govina
South
Sudan
Tajikistan
Bolivia
Iraq
Canada
Rwanda
Kyrgyzstan
Central A
frica
n Republic
Ghana
20
40
60
Local Regional Digital Only Multi
Channel
Impeded Unimpeded Censored Uncensored
48%52%
39%
61%
44%
56%53%
47%
Simplifying Success15
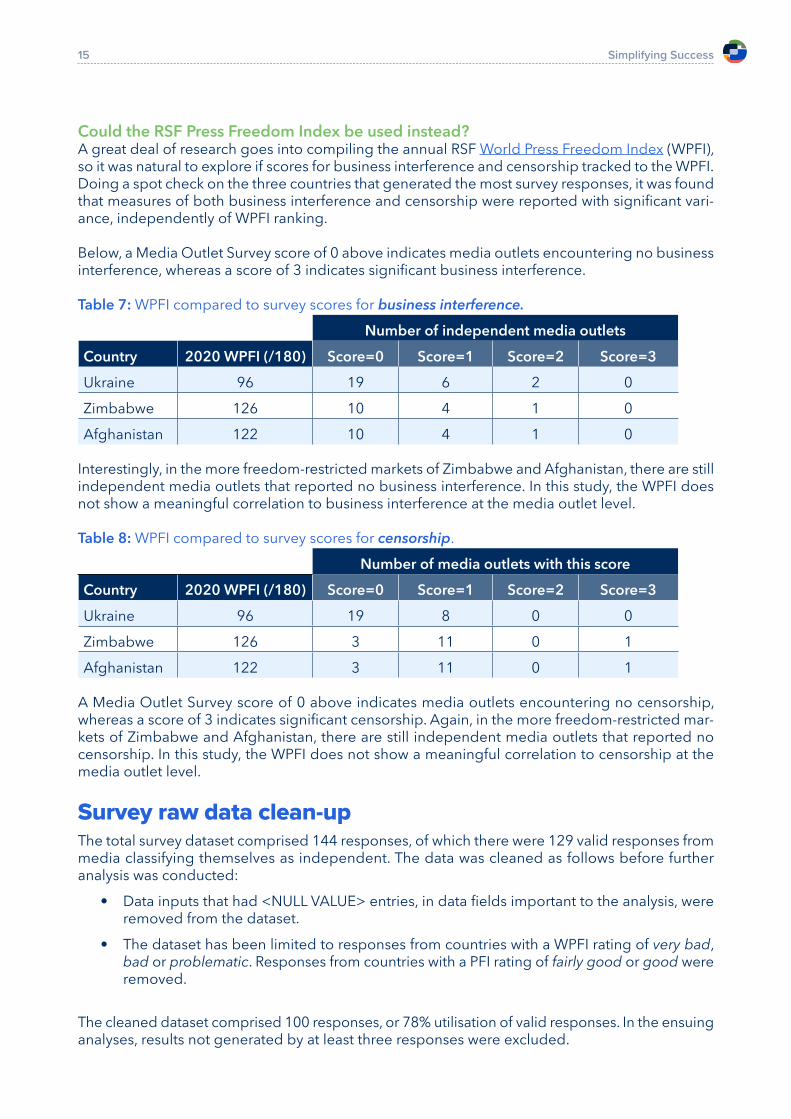
Could the RSF Press Freedom Index be used instead?A great deal of research goes into compiling the annual RSF World Press Freedom Index (WPFI), so it was natural to explore if scores for business interference and censorship tracked to the WPFI. Doing a spot check on the three countries that generated the most survey responses, it was found that measures of both business interference and censorship were reported with significant vari-ance, independently of WPFI ranking.
Below, a Media Outlet Survey score of 0 above indicates media outlets encountering no business interference, whereas a score of 3 indicates significant business interference.
Table 7: WPFI compared to survey scores for business interference.
Number of independent media outlets
Country 2020 WPFI (/180) Score=0 Score=1 Score=2 Score=3
Ukraine 96 19 6 2 0
Zimbabwe 126 10 4 1 0
Afghanistan 122 10 4 1 0
Interestingly, in the more freedom-restricted markets of Zimbabwe and Afghanistan, there are still independent media outlets that reported no business interference. In this study, the WPFI does not show a meaningful correlation to business interference at the media outlet level.
Table 8: WPFI compared to survey scores for censorship.
Number of media outlets with this score
Country 2020 WPFI (/180) Score=0 Score=1 Score=2 Score=3
Ukraine 96 19 8 0 0
Zimbabwe 126 3 11 0 1Afghanistan 122 3 11 0 1
A Media Outlet Survey score of 0 above indicates media outlets encountering no censorship, whereas a score of 3 indicates significant censorship. Again, in the more freedom-restricted mar-kets of Zimbabwe and Afghanistan, there are still independent media outlets that reported no censorship. In this study, the WPFI does not show a meaningful correlation to censorship at the media outlet level.
Survey raw data clean-up The total survey dataset comprised 144 responses, of which there were 129 valid responses from media classifying themselves as independent. The data was cleaned as follows before further analysis was conducted:
• Data inputs that had <NULL VALUE> entries, in data fields important to the analysis, were removed from the dataset.
• The dataset has been limited to responses from countries with a WPFI rating of very bad, bad or problematic. Responses from countries with a PFI rating of fairly good or good were removed.
The cleaned dataset comprised 100 responses, or 78% utilisation of valid responses. In the ensuing analyses, results not generated by at least three responses were excluded.
Simplifying Success16
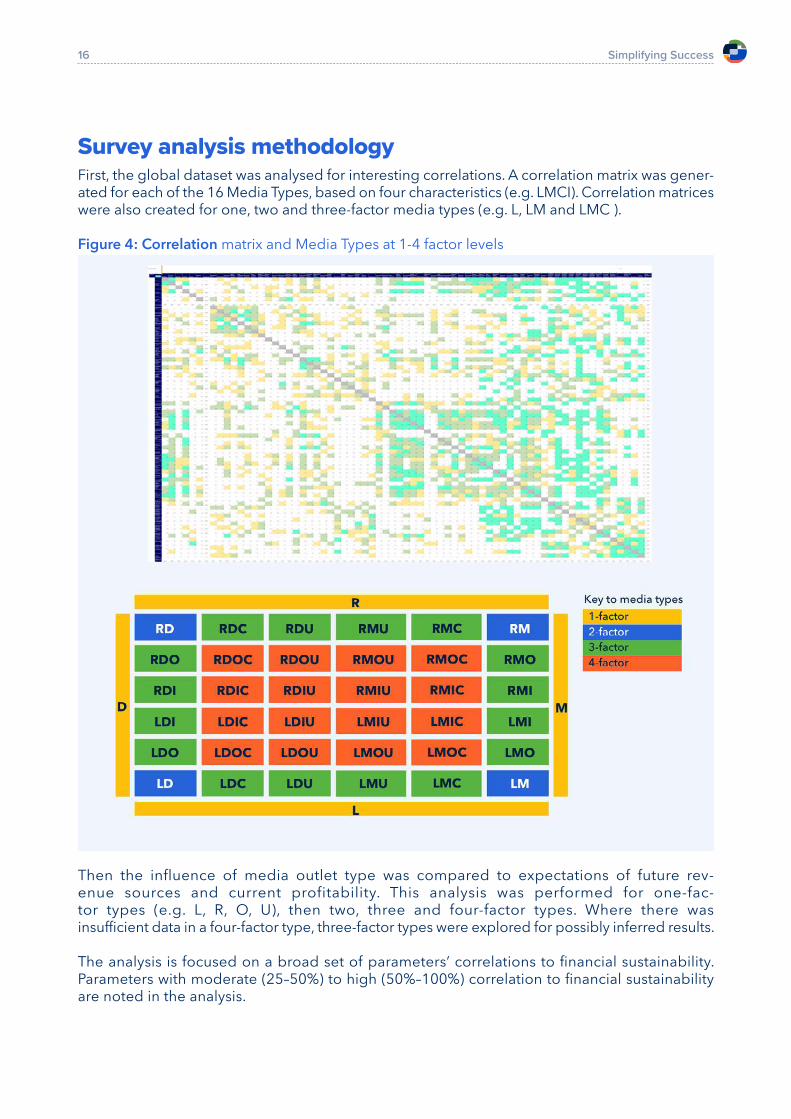
Survey analysis methodologyFirst, the global dataset was analysed for interesting correlations. A correlation matrix was gener-ated for each of the 16 Media Types, based on four characteristics (e.g. LMCI). Correlation matrices were also created for one, two and three-factor media types (e.g. L, LM and LMC ).
Figure 4: Correlation matrix and Media Types at 1-4 factor levels
Then the influence of media outlet type was compared to expectations of future rev-enue sources and current profitability. This analysis was performed for one-fac-tor types (e.g. L, R, O, U), then two, three and four-factor types. Where there was insufficient data in a four-factor type, three-factor types were explored for possibly inferred results.
The analysis is focused on a broad set of parameters’ correlations to financial sustainability. Parameters with moderate (25–50%) to high (50%–100%) correlation to financial sustainability are noted in the analysis.
Simplifying Success17
Initial findingsThe survey was designed to test if the four chosen characteristics could be used to drive effective implementations in support of media outlets becoming more financially sustainable.
Analysis was focused on combinations of these four characteristics at one, two, three and four-factor levels. Both two and three-factor analysis revealed some useful guidance for media outlets. The clearest results, however, came from three and four-factor correlations. In building a framework for designing and implementing activities to improve the financial sustainability of digital news media in freedom-restricted contexts, all four of the proposed characteristics can be applied. Further findings:
• The 16 Media Types will allow stakeholders in independent media to narrow their focus towards activities with a proven likelihood of producing positive results.
• While the findings from this report alone cannot overcome the market challenges identi-fied (i.e. Facebook and Google capturing the majority of advertising revenue; coronavirus and its catalysing effect on shift to digital; consumer revenue models), they will help media outlets and their stakeholders to navigate these challenges more effectively.
• There are multiple correlations between specific media types and financial sustainability.• Different media types have differing capabilities, each of which correlate to financial sus-
tainability differently.
• Multiple correlations have been discovered between media type, their expectations of future revenue and their current financial sustainability. This framework allows media outlets to replicate the future planning of currently sustainable media outlets in a way that does not reveal any other media outlet’s identity.
Embedding the 16 Media Types in a platform for allTo create a truly useful application of the 16 Media Types, to refine the framework and identify other relevant characteristics and indicators in time, requires data. The more data it is fed, the more powerful the solution will become, and the greater impact and value will be generated by independent media in freedom-restricted countries.
This data platform, herein referred to as the Digital Performance Navigator, is intended for use primarily by media business specialists, in-country program teams, media outlets and donors. In its first iteration, it will offer a dashboard on media outlet performance and benchmarks, along with resources for each media outlet tailored to its media type – such as e-learning, research and tools. The Navigator should be built to support AI-driven recommendations in the future, with further investment.
Components of the Navigator are currently being built and integrated with Power BI by the Media Business Unit at Internews, in data panels that dynamically show or hide information based on the user’s roles and permissions. For example, a donor will be able to see performance data across its funded programs, but not data on individual media outlets outside its programs . When becoming a sectoral tool, though, a custom-built solution will be required.
Simplifying Success18
There are three main sources of data that will drive the Navigator. By default, each media outlet’s performance will be compared to other media of the same type, but other media types can also be benchmarked.
• Open Web: Data will be scraped from each media outlet’s website to give an indication of its performance on metrics such as website optimisation, details of technologies imple-mented (which can feed into Digital capabilities scoring), and content volume.
• Permissioned: This data, driven by API connections to platforms like Google Analytics (and in later iterations, social media) present the viewer with a summary of traffic volume, engagement and loyalty metrics.
• Submitted: This data is shared by each media outlet and includes specific revenue details along with a version of the Media Outlet Survey, which would be updated on at least an annual basis. This data will enable evaluation of each media outlet’s capabilities and reve-nue performance gaps, allowing work plans to be created that improve the right capabilities towards improved financial performance.
• Additionally, the Navigator will include extra tools and insights of relevance to the specific media type. These can be offered in a marketplace or added in for closed groups of users. The marketplace will be populated by a variety of providers, such as media development non-profits, business specialists, research providers and technologists. These components will be able to connect to the Navigator by API.
The Digital Performance Navigator in useTake an example of a Regional/national (R), Digital-only (D) media outlet in Country X, founded in 2014 with 25 salaried Full Time Employees (FTEs). The media outlet is Impeded (I) in its busi-ness, with advertisers having historically avoided it due to fear of government targeting. Further, it has Censored (C) itself in order to mitigate attacks from the government. However, recent sales performance shared to the Navigator indicates that it is having some success selling advertising directly to companies domestically. It is therefore in a possible transition between Media Types RDIC and RDOC, with O representing Open access to businesses.
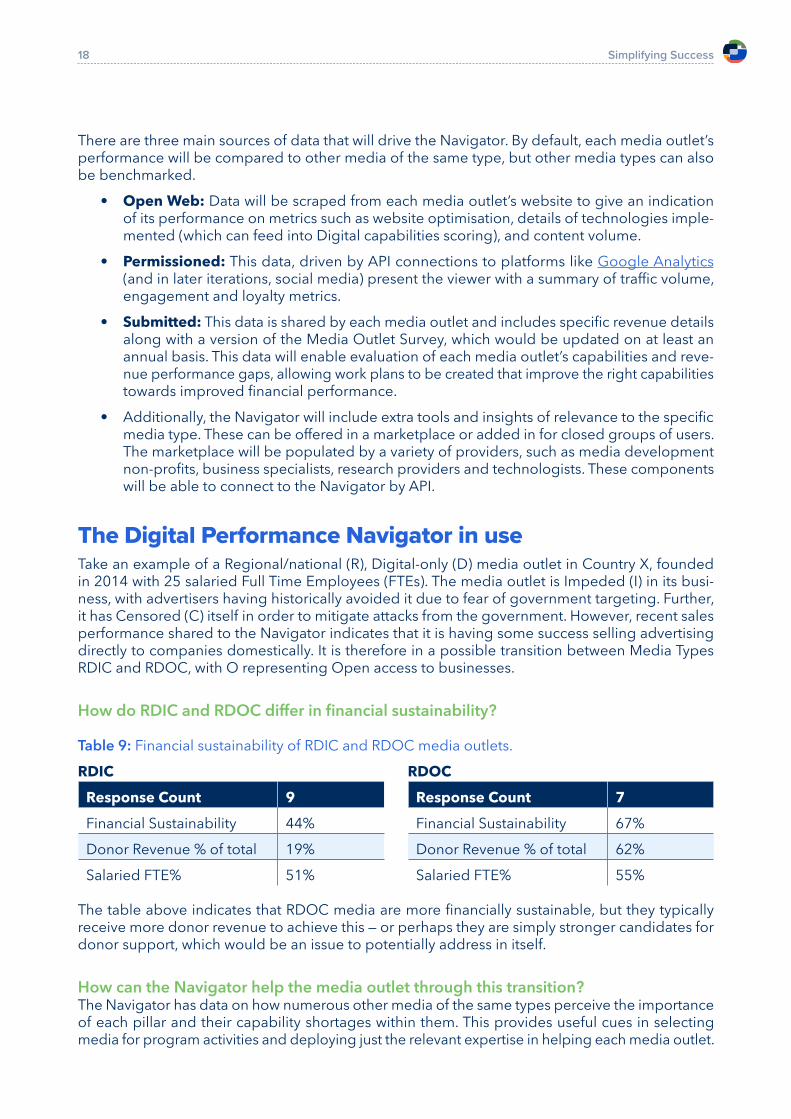
How do RDIC and RDOC differ in financial sustainability?
Table 9: Financial sustainability of RDIC and RDOC media outlets.RDIC
Response Count 9
Financial Sustainability 44%Donor Revenue % of total 19%Salaried FTE% 51%
The table above indicates that RDOC media are more financially sustainable, but they typically receive more donor revenue to achieve this — or perhaps they are simply stronger candidates for donor support, which would be an issue to potentially address in itself.
How can the Navigator help the media outlet through this transition?The Navigator has data on how numerous other media of the same types perceive the importance of each pillar and their capability shortages within them. This provides useful cues in selecting media for program activities and deploying just the relevant expertise in helping each media outlet.
RDOC
Response Count 7
Financial Sustainability 67%Donor Revenue % of total 62%Salaried FTE% 55%
Simplifying Success19
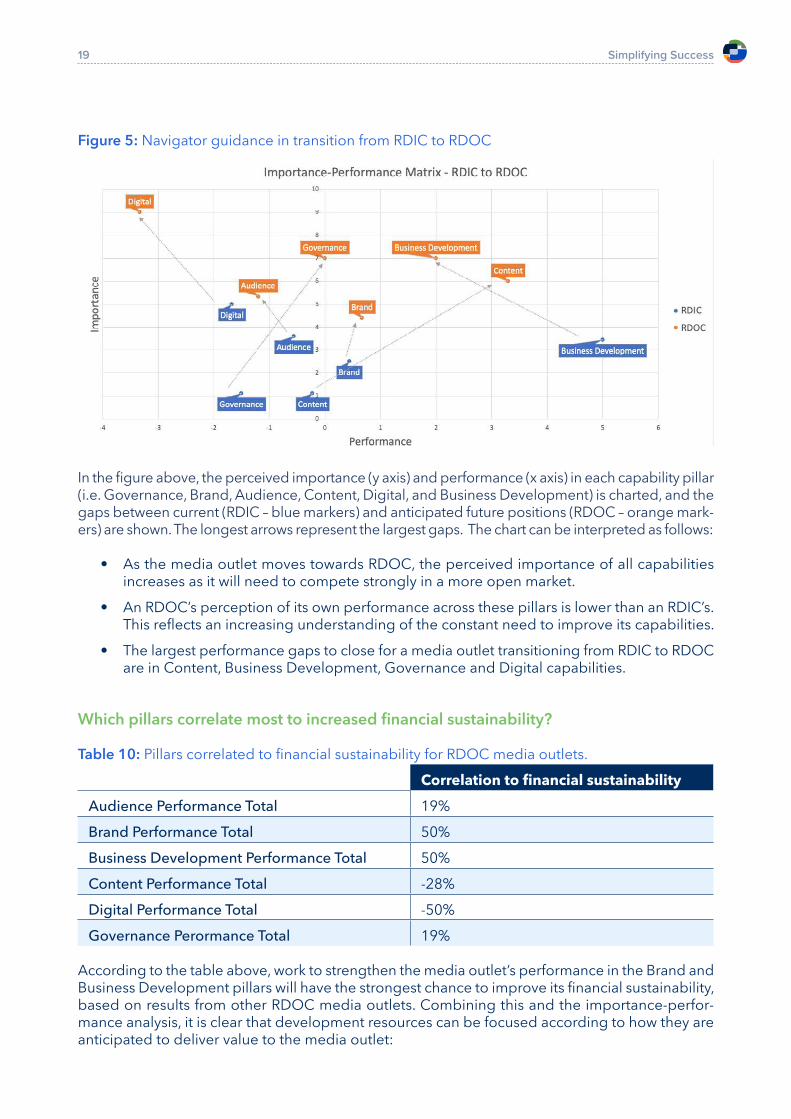
Figure 5: Navigator guidance in transition from RDIC to RDOC
In the figure above, the perceived importance (y axis) and performance (x axis) in each capability pillar (i.e. Governance, Brand, Audience, Content, Digital, and Business Development) is charted, and the gaps between current (RDIC – blue markers) and anticipated future positions (RDOC – orange mark-ers) are shown. The longest arrows represent the largest gaps. The chart can be interpreted as follows:
• As the media outlet moves towards RDOC, the perceived importance of all capabilities increases as it will need to compete strongly in a more open market.
• An RDOC’s perception of its own performance across these pillars is lower than an RDIC’s. This reflects an increasing understanding of the constant need to improve its capabilities.
• The largest performance gaps to close for a media outlet transitioning from RDIC to RDOC are in Content, Business Development, Governance and Digital capabilities.
Which pillars correlate most to increased financial sustainability?
Table 10: Pillars correlated to financial sustainability for RDOC media outlets.Correlation to financial sustainability
Audience Performance Total 19%Brand Performance Total 50%Business Development Performance Total 50%Content Performance Total -28%Digital Performance Total -50%Governance Perormance Total 19%
According to the table above, work to strengthen the media outlet’s performance in the Brand and Business Development pillars will have the strongest chance to improve its financial sustainability, based on results from other RDOC media outlets. Combining this and the importance-perfor-mance analysis, it is clear that development resources can be focused according to how they are anticipated to deliver value to the media outlet:
Simplifying Success20
• Improving the media outlet’s brand is a relatively small gap to close but has a relatively large impact on its financial sustainability.
• Strengthening the media outlet’s business development capabilities will have a similar level of impact to work on its brand, but the gap to close is wider so it can be anticipated that greater resources will be needed.
• Improving the media outlet’s ability to analyse, attract and retain audiences is a relatively small gap to close, and will not require such heavy input as the previous two pillars.
• Achieving more robust governance is also a high priority for the RDOC.• While content production and digital capabilities are still essential, as are all pillars, this
dataset did not show that improving those as part of the media outlet’s transition from RDIC to RDOC would correlate to improved financial sustainability.
Where is future revenue coming from?
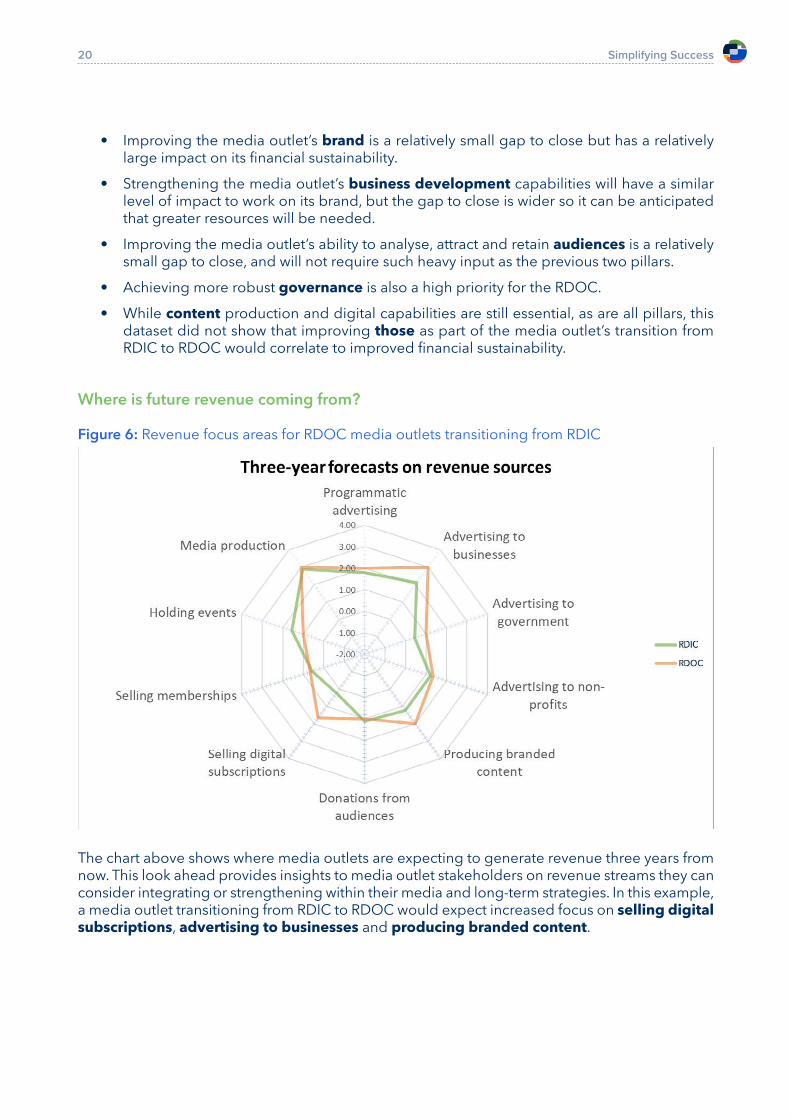
Figure 6: Revenue focus areas for RDOC media outlets transitioning from RDIC
The chart above shows where media outlets are expecting to generate revenue three years from now. This look ahead provides insights to media outlet stakeholders on revenue streams they can consider integrating or strengthening within their media and long-term strategies. In this example, a media outlet transitioning from RDIC to RDOC would expect increased focus on selling digital subscriptions, advertising to businesses and producing branded content.
Simplifying Success21
How does each future revenue source correlate to current financial sustainability?How can a media outlet take inspiration from the plans of currently successful RDOCs?
Table 11: Future revenue sources correlated to current financial sustainability for RDOC media outletsThree-year revenue forecasts Correlation to financial sustainabilityProgrammatic advertising -38%Advertising to businesses 0%Advertising to government -87%Advertising to non-profits 76%Producing branded content 87%Donations from audiences 50%Selling digital subscriptions -19%Selling memberships -50%Holding events -19%Media production 100%
In the table above, RDOC media that are currently financially sustainable believe their revenue in the next three years will come from media production, producing branded content, selling adver-tising to non-profits and securing donations from audiences. A media outlet transitioning from RDIC to RDOC should keep these revenue opportunities in mind when prioritising development efforts with its stakeholders. Such media outlets should also not rely heavily on advertising to governments, programmatic advertising or selling memberships. These general trend predictions will also be relevant to stakeholders supporting these media outlets.
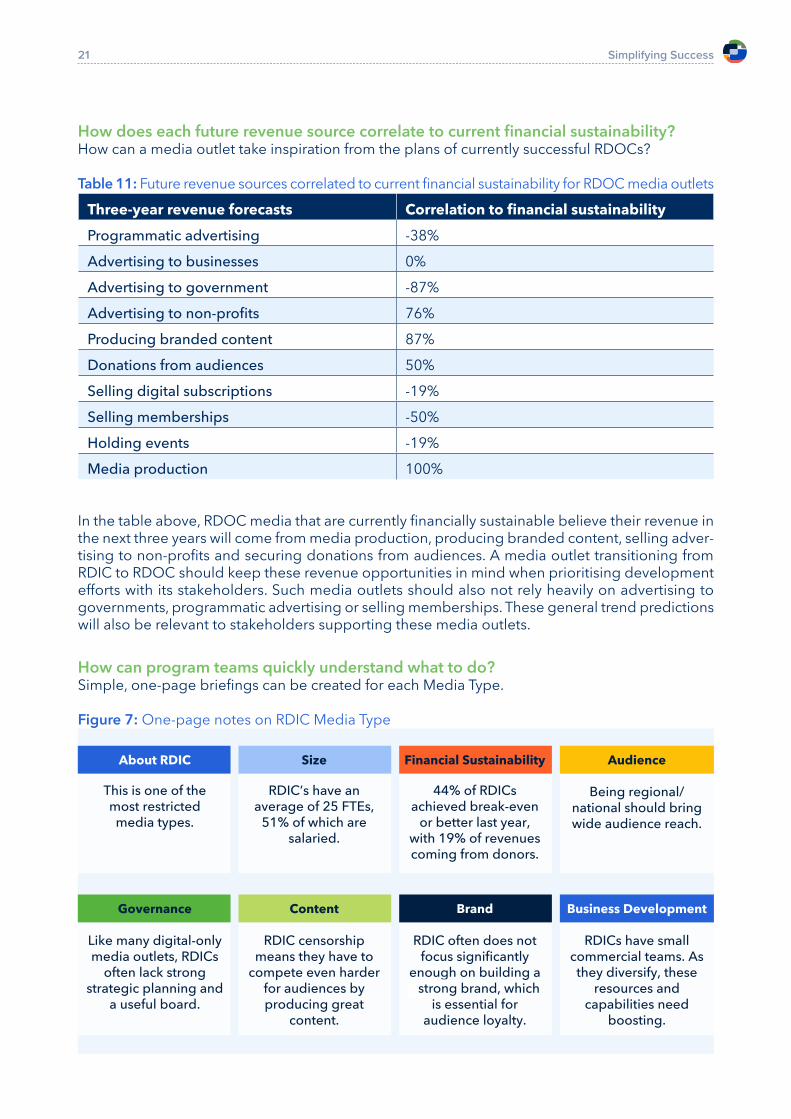
How can program teams quickly understand what to do?Simple, one-page briefings can be created for each Media Type.
Figure 7: One-page notes on RDIC Media Type
This is one of the most restricted media types.
Like many digital-only media outlets, RDICs
often lack strong strategic planning and
a useful board.
About RDIC Size Financial Sustainability Audience
Governance Content Brand Business Development
RDIC’s have an average of 25 FTEs,
51% of which are salaried.
RDIC censorship means they have to
compete even harder for audiences by producing great
content.
44% of RDICs achieved break-even
or better last year, with 19% of revenues coming from donors.
RDIC often does not focus significantly
enough on building a storong brand, which
is essential for audience loyalty.
Being regional/national should bring wide audience reach.
RDICs have small commercial teams. As they diversify, these
resources and capabilities need
boosting.
strong
Simplifying Success22
SummaryThis section represents a small sample of the guidance the Navigator will be able to provide. While the above charts and tables can already be created from the existing survey data using Microsoft Excel, the Digital Performance Navigator will become more valuable by being continuously fed with new data to refine its recommendations with.
How will the Navigator be adopted?Encouraging adoption of the Navigator will require change. Some key points are highlighted below.
MEL teams: Beyond this initial concept for the Navigator, the influence of Monitoring, Evaluation and Learning teams will be essential. Such teams will be a guiding force in ensuring strong imple-mentation and exploring potential applicability of the 16 Media Types and Digital Performance Navigator in other areas of media development, such as editorial and security.
Program teams — modular approach: When asked if this approach would work well for his team, an Internews Project Director saw challenges associated with varying skills levels across teams but that, in the longer-term, this work could influence course development in local colleges and universities
‘I agree with the direction that you want to take. It is more sustainable and doable in the long run. However, the biggest challenge is that many countries have capacity deficiencies in terms of media business skills. The other challenge is that most programs, including ours, do not have specific people focusing on the media business. It is easier if we ensure that new programs have people dedicated to that role. As an organization, we can then, over time, dedicate time to build those skills internally. I have done a quick scan of the courses offered by most colleges and universities in our region and discovered that the majority, if not all, are very weak on that front.
In the short run, we can ensure some form of “on the job training” to country-based people who will then do some of the implementation. In the long run, we can support a few colleges / universities to include such courses in their curricula.’
The aim of the proposed Navigator and the 16 Media Types framework is not to make every program team member a media business expert, but instead to enable teams to build core competencies in key members of staff who can then manage media sustainability initiatives more effectively in cooperation with experts.
Consultants — reduced reporting time: Preparing quarterly and annual program reports takes more time than it should, in compiling performance data from multiple sources, often needing to repeatedly ask media outlets for it. The Navigator will enable consultants to spend more time analysing performance and making better recommendations on how media outlets can become more financially sustainable.
Media outlets — active participation in performance: Whereas media outlets until now have been unreliable in submitting performance data, particularly financial data, doing so can now become a pre-requisite for joining programs, and will yield powerful, immediate insights. With much of the basic data-gathering automated, and with strictly managed roles and permissions in the Navigator, there should be confidence that the data will be gathered safely and secured effectively.
Ecosystem: If the Digital Performance Navigator becomes an ecosystem tool, used by media
Simplifying Success23
development non-profits in addition to Internews, there are the following considerations:• Coalition ‘wrapper’: Internews leads the United for News coalition (in collaboration with
the World Economic Forum) and the Ads for News sub-brand, both of which engage multi-ple other stakeholders. A coalition-based sub-brand such as ‘Sustainability for News’ could be suitable for collaboration around the 16 Media Types and Digital Performance Navigator, with equal participation by other stakeholders, also offering reach into the United for News coalition for engagement with the wider media sector.
• Full disclosure: Others in the sector will want to review the findings and have chance to provide their own ideas. More detail on the research for this report, and the dataset gen-erated, can be shared when all parties have a collaboration agreement in place.
• Data protection and the ability for media development non-profits to create walled gar-dens around their media outlet partners and data will be essential. By joining the system, they could expect to contribute to and gain from benchmarking, but roles and privileges for accessing specific media outlet data will need to be tightly controlled.
What could a successful rollout look like?First, the definition of what constitutes success should be clarified. In its most basic form, if the Digital Performance Navigator is actively used by more independent media outlets than currently served by the sector, it will have provided data, benchmarks, recommendations and resources that can improve their financial sustainability — and this constitutes success.
Beyond that, the measures of success below should be built into the rollout plan.
• Navigator users: Number of media outlets, media development non-profits and donors actively using the system.
• Navigator usage: Number of logins; logins per media outlet; users per media outlet; total logged-in hours per month.
• Navigator coverage: Number of countries covered; estimated % of population reached by media using the system (i.e. unique users per month divided by population aged 16+).
• Performance changes: Reduction in capability gaps; increased audience scale, engage-ment and loyalty; increased revenue; increased Page RPM (revenue per 1,000 page loads); increased ARPU (i.e. Average Revenue Per User); reduced percentage of media outlets generating a financial loss.
• Ratings from media outlets in platform usability and effectiveness in guiding them.
• Ratings from program staff in platform usability and effectiveness in guiding their work with media outlets.
• Ratings from experts in time saved on reporting, and increased work effectiveness.
• Ratings from donors in establishing global benchmarks and program oversight: improved reach and impact of funded media outlets.
Simplifying Success24
Further recommendationsThis research sought to identify a simple set of variables that could be used to classify media outlets so that efforts to help them become more financially sustainable could be deployed more widely and effectively. With the 16 Media Types, it has achieved that goal although there are areas in which this work could be improved and extended.
• While there are strong indications that the 16 Media Types outlined in this report are valid and useful, substitute characteristics could be explored.
• The cleaned dataset comprised 100 media outlets. For some media types, there was insuf-ficient data to draw specific conclusions. Repeating the survey with a larger dataset would be helpful in further validating some findings.
• The Media Outlet Survey lacked one important question about the media outlet being for-profit or non-profit, resulting in the study’s measure of financial sustainability being determined by simply not making a loss in the most recent fiscal year. A more nuanced measure of financial sustainability could be worth exploring.
• Similar studies could include analysis of costs and administrative capabilities.
Simplifying Success25
Endnotes
1 Myanmar coup: Military cracks down on free speech, press freedom, Deutsche Welle, 10 March 20212 Myanmar: At least 550 civilians killed since coup, Deutsche Welle, 3 April 20213 Violence erupts in Myanmar as thousands gather to call for ‘spring revolution’ against military junta, TheJournal.
ie, 2 May 20214 2020 World Press Freedom Index, Reporters Sans Frontières, 28 December 2020 5 RSF’s 2020 Round-up: 50 journalists killed, two-thirds in countries “at peace”, Reporters Sans Frontières, 28
December 2020
6 Record number of journalists jailed worldwide, Committee to Protect Journalists, 15 December 20207 Edelman Trust Barometer 2021, Edelman, accessed 11 April 2021 8 Local newsrooms across the country are closing. Here’s why that matters, PBS, 1 January 20209 Email exchange between Josh Machleder and Jason Lambert, 27 May 202110 Internet media jobs are at an all-time high, and online ad spend will rise to 60% by 2022, reports AdAge, What’s
New in Publishing, 11 US Triopoly Digital Ad Revenue Share, by Company, 2019 & 2020, eMarketer, 1 March 202112 The Duopoly’s Share of the UK Ad Market Will Dip Below 66%, eMarketer, 19 August 202013 COVID-19 is devastating local news. Here’s how advertisers can help to save it, World Economic Forum, 4 May
2020
14 The journalism crisis across the world, Columbia Journalism Review, 31 March 202115 Digitization without monetization: African news media stuck between a rock and a hard place, DW, & August
2020
16 Nation Media Group Announces Mass Firing, Kenyans.co.ke, 1 July 202017 Digital 2021, We Are Social, slides 254 & 256, accessed 11 April 202118 Share of consumers who paid for online news content in selected countries worldwide in the last year as of
February 2020, Statista, June 202019 Media Development Donors, CIMA, accessed 10 April 202120 Donor profile on the United States, Donor Tracker, accessed 10 April 202121 Journey to Self-Reliance, USAID, accessed 10 April 202122 Measuring Beyond Money: The Media Viability Indicators, Deutsche Welle Akademie, April 202023 What is PESTLE Analysis? Everything you need to know about it, Analytics Steps, accessed 26 May 202124 To silence a newspaper, Nicaragua’s government took away its paper and ink, Los Angeles Times, 21 February
2020
25 Belarus journalist Roman Protasevich’s colleagues fear for their lives, BBC, 27 May 202126 Myers-Briggs Type Indicator, Wikipedia, accessed 17 May 2021