Simplification Overview and Q1 2015 Financial and ...
17
Presentation Title Presentation Subtitle Connections for America’s Energy ™ ™ Presentation Title Presentation Subtitle Connections for America’s Energy ™ ™ Presentation Title Presentation Subtitle Connections for America’s Energy ™ ™ 5/5/2015 Presentation Title Presentation Subtitle Connections for America’s Energy ™ ™ Presentation Title Presentation Subtitle Connections for America’s Energy ™ ™ Crestwood Midstream Partners LP Crestwood Equity Partners LP Connections for America’s Energy ™ ™ Simplification Overview and Q1 2015 Financial & Operating Results May 6, 2015
Transcript of Simplification Overview and Q1 2015 Financial and ...

Presentation TitlePresentation Subtitle
Crestwood Midstream Partners LP Crestwood Equity Partners LP
Connections for America’s Energy™
™
Presentation TitlePresentation Subtitle
Crestwood Midstream Partners LP Crestwood Equity Partners LP
Connections for America’s Energy™
™
Presentation TitlePresentation Subtitle
Crestwood Midstream Partners LP Crestwood Equity Partners LP
Connections for America’s Energy™
™
5/5/2015
Presentation TitlePresentation Subtitle
Crestwood Midstream Partners LP Crestwood Equity Partners LP
Connections for America’s Energy™
™
Presentation TitlePresentation Subtitle
Crestwood Midstream Partners LP Crestwood Equity Partners LP
Connections for America’s Energy™
™
Crestwood Midstream Partners LP Crestwood Equity Partners LP
Connections for America’s Energy™
™
Simplification Overview and Q1 2015 Financial & Operating Results
May 6, 2015

Connections for America’s Energy™ ™™ ™™ ™
Forward-Looking Statements
2
ADDITIONAL INFORMATION AND WHERE TO FIND IT
This press release contains information about the proposed merger involving Crestwood Equity and Crestwood Midstream. In connection with the proposedmerger, Crestwood Equity will file with the SEC a registration statement on Form S-4 that will include a proxy statement/prospectus for the unitholders ofCrestwood Midstream. Crestwood Midstream will mail the final proxy statement/prospectus to its unitholders. INVESTORS AND UNITHOLDERS ARE URGED TOREAD THE PROXY STATEMENT/PROSPECTUS AND OTHER RELEVANT DOCUMENTS FILED OR TO BE FILED WITH THE SEC CAREFULLY WHEN THEY BECOMEAVAILABLE BECAUSE THEY WILL CONTAIN IMPORTANT INFORMATION ABOUT CRESTWOOD EQUITY, CRESTWOOD MIDSTREAM, THE PROPOSED MERGER ANDRELATED MATTERS. Investors and unitholders will be able to obtain free copies of the proxy statement/prospectus (when available) and other documents filedwith the SEC by Crestwood through the website maintained by the SEC at www.sec.gov. In addition, investors and unitholders will be able to obtain free copiesof documents filed by Crestwood with the SEC from Crestwood’s website, www.crestwoodlp.com.
PARTICIPANTS IN THE SOLICITATION
Crestwood Equity, Crestwood Midstream, and their respective general partner’s directors and executive officers may be deemed to be participants in thesolicitation of proxies from the unitholders of Crestwood Midstream in respect of the proposed merger transaction. Information regarding the persons who may,under the rules of the SEC, be deemed participants in the solicitation of the unitholders of Crestwood Midstream in connection with the proposed transaction,including a description of their direct or indirect interests, by security holdings or otherwise, will be set forth in the proxy statement/prospectus when it is filedwith the SEC. Information regarding Crestwood Midstream’s directors and executive officers is contained in Crestwood Midstream’s Annual Report on Form 10-Kfor the year ended December 31, 2014, which is filed with the SEC on March 2, 2015, and any subsequent statements of changes in beneficial ownership on filewith the SEC. Information regarding Crestwood Equity’s directors and executive officers is contained in Crestwood Equity’s Annual Report on Form 10-K for theyear ended December 31, 2014, which is filed with the SEC on March 2, 2015, and any subsequent statements of changes in beneficial ownership on file withthe SEC. Free copies of these documents may be obtained from the sources described above.
The statements in this communication regarding future events, occurrences, circumstances, activities, performance, outcomes and results are forward-lookingstatements. Although these statements reflect the current views, assumptions and expectations of Crestwood’s management, the matters addressed herein aresubject to numerous risks and uncertainties which could cause actual activities, performance, outcomes and results to differ materially from those indicated.Such forward-looking statements include, but are not limited to, statements about the benefits that may result from the merger and statements about thefuture financial and operating results, objectives, expectations and intentions and other statements that are not historical facts. Factors that could result in suchdifferences or otherwise materially affect Crestwood’s financial condition, results of operations and cash flows include, without limitation, the possibility thatexpected cost reductions will not be realized, or will not be realized within the expected timeframe; fluctuations in crude oil, natural gas and NGL prices(including, without limitation, lower commodity prices for sustained periods of time); the extent and success of drilling efforts, as well as the extent and qualityof natural gas and crude oil volumes produced within proximity of Crestwood assets; failure or delays by customers in achieving expected production in their oiland gas projects; competitive conditions in the industry and their impact on our ability to connect supplies to Crestwood gathering, processing andtransportation assets or systems; actions or inactions taken or non-performance by third parties, including suppliers, contractors, operators, processors,transporters and customers; the ability of Crestwood to consummate acquisitions, successfully integrate the acquired businesses, realize any cost savings andother synergies from any acquisition; changes in the availability and cost of capital; operating hazards, natural disasters, weather-related delays, casualtylosses and other matters beyond Crestwood’s control; timely receipt of necessary government approvals and permits, the ability of Crestwood to control thecosts of construction, including costs of materials, labor and right-of-way and other factors that may impact Crestwood’s ability to complete projects withinbudget and on schedule; the effects of existing and future laws and governmental regulations, including environmental and climate change requirements; theeffects of existing and future litigation; and risks related to the substantial indebtedness, of either company, as well as other factors disclosed in Crestwood’sfilings with the U.S. Securities and Exchange Commission. You should read filings made by Crestwood with the U.S. Securities and Exchange Commission,including Annual Reports on Form 10-K and the most recent Quarterly Reports and Current Reports for a more extensive list of factors that could affect results.Readers are cautioned not to place undue reliance on forward-looking statements, which reflect management’s view only as of the date made. Crestwood doesnot assume any obligation to update these forward-looking statements.

Connections for America’s Energy™ ™™ ™™ ™
Transaction Overview
3
• Crestwood Equity Partners LP (NYSE: CEQP) and Crestwood Midstream Partners LP (NYSE: CMLP) have executed definitive agreements to merge the two partnerships
– Terms of the simplification transaction have been approved by both conflicts committees and boards of directors
– The merger must be approved by a majority of CMLP unitholders
– First Reserve retains 100% non-economic GP interest (control)
• CMLP unitholders will receive 2.75 CEQP units for each CMLP unit owned in a tax-free exchange
– Implies 17% premium to CMLP closing price as of 5/5/2015
– ~498 MM units issued to CMLP unitholders or 73% of pro forma CEQP
• CMLP becomes wholly-owned subsidiary and all existing and new debt remains at CMLP entity
– CMLP’s incentive distribution rights eliminated
– CEQP remaining operating assets contributed to CMLP immediately following the merger
– CEQP and CMLP revolvers refinanced into a new $1.5 billion facility
– Class A Preferred units at CMLP exchanged into a substantially equivalent security at CEQP
• Transaction is expected to close in Q3 2015, subject to CMLP unitholder approval and customary closing conditions

Connections for America’s Energy™ ™™ ™™ ™4
Transaction Highlights
4
• Elimination of ~$30 million of IDRs drives immediate cost of capital improvement
• Competitive cost of capital improves positioning for >$3.0 billion of identified expansion opportunities
Improved Cost ofCapital
Improved Cost ofCapital
• Simplified entity that should attract a broader universe of investors
• Improved credit profile due to the elimination of structural subordination
• Simplification of Crestwood’s governance structure better positions the partnership to participate in the continuing trend of industry consolidation
Simplify Corporate Structure
Simplify Corporate Structure
• Eliminates $5 million of estimated public company costs
• Additive to $25 million to $30 million run-rate savings identified as a part of Crestwood’s 2015 cost reduction initiatives
Further Reduce Cost Structure / Fixed Charges
Further Reduce Cost Structure / Fixed Charges
• Pro forma 2015 CEQP coverage ratio improved to ~1.05x at $0.55 per unit distribution (~$15 million excess cash flow coverage)(1)
• 2% dilutive to CMLP in 2016, 3% accretive in 2017, substantial accretion thereafter
• Expected pro forma DCF growth of ~11% through 2017(2); accelerated with greater M&A and organic investment
Growth and Stability in
Distributions
Growth and Stability in
Distributions
• Focus on core strategy of servicing the full midstream value chain in the premier shale plays in North America
• Eliminates existing conflicts of interest arising from financial complexity
Unified Corporate Strategy
Unified Corporate Strategy
1) Estimated coverage ratio and cash coverage assumes January 1, 2015 effective date for the transaction for illustrative purposes.2) Represents growth rate from 2015E pro forma DCF (assuming January 1, 2015 effective date) to 2017E pro forma DCF.
Connections for America’s Energy™ ™™ ™™ ™
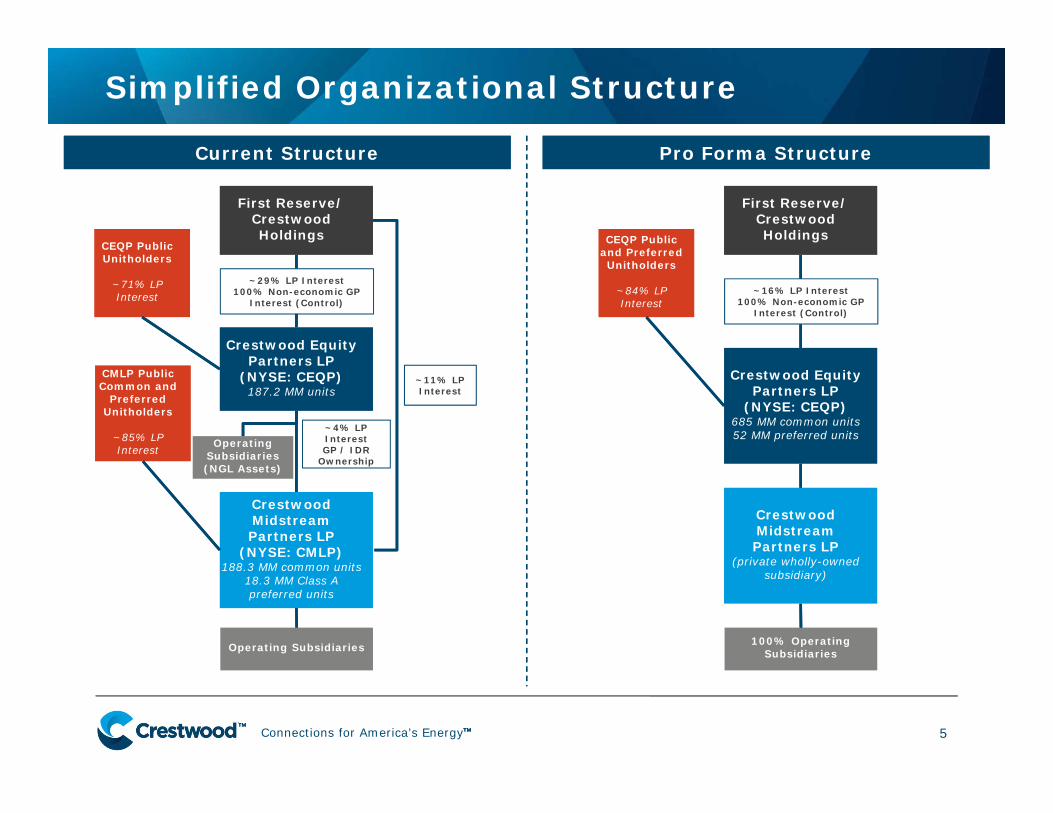
Simplified Organizational Structure
5
Crestwood Equity Partners LP
(NYSE: CEQP)187.2 MM units
First Reserve/Crestwood Holdings
~11% LP Interest
Crestwood Midstream Partners LP
(NYSE: CMLP)188.3 MM common units
18.3 MM Class A preferred units
Operating Subsidiaries
~4% LP InterestGP / IDR
Ownership
CEQP Public Unitholders
~71% LP Interest
CMLP Public Common and
Preferred Unitholders
~85% LP Interest
~29% LP Interest100% Non-economic GP
Interest (Control)
Operating Subsidiaries(NGL Assets)
Current StructureCurrent Structure Pro Forma StructurePro Forma Structure
Crestwood Equity Partners LP
(NYSE: CEQP)685 MM common units52 MM preferred units
First Reserve/Crestwood Holdings
Crestwood Midstream Partners LP
(private wholly-owned subsidiary)
100% Operating Subsidiaries
CEQP Public and Preferred Unitholders
~84% LP Interest
~16% LP Interest100% Non-economic GP
Interest (Control)
Connections for America’s Energy™ ™™ ™™ ™
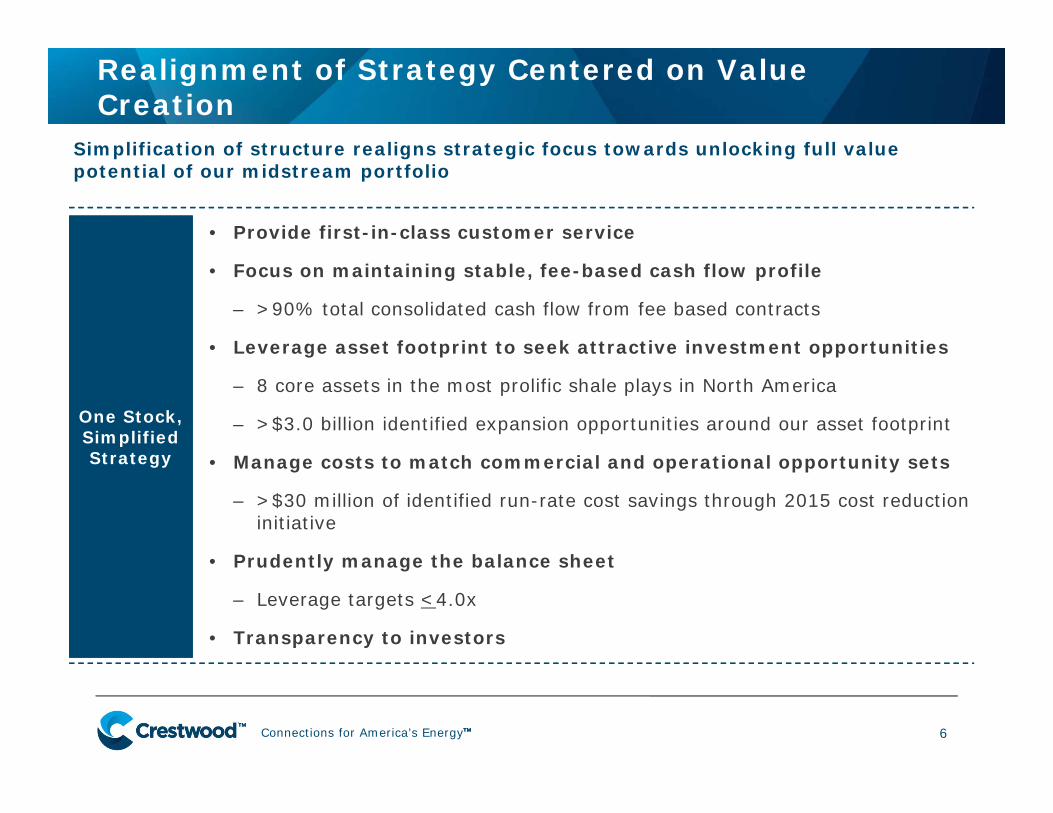
Realignment of Strategy Centered on Value Creation
One Stock, Simplified Strategy
One Stock, Simplified Strategy
6
• Provide first-in-class customer service
• Focus on maintaining stable, fee-based cash flow profile
– >90% total consolidated cash flow from fee based contracts
• Leverage asset footprint to seek attractive investment opportunities
– 8 core assets in the most prolific shale plays in North America
– >$3.0 billion identified expansion opportunities around our asset footprint
• Manage costs to match commercial and operational opportunity sets
– >$30 million of identified run-rate cost savings through 2015 cost reduction initiative
• Prudently manage the balance sheet
– Leverage targets <4.0x
• Transparency to investors
Simplification of structure realigns strategic focus towards unlocking full value potential of our midstream portfolio

Connections for America’s Energy™ ™™ ™™ ™
($ millions except per unit data) $500 MM Investment $500 MM InvestmentInvestment Multiple 6.0x 9.0x 12.0x 6.0x 9.0x 12.0x
Acquired EBITDA $83 $56 $42 $83 $56 $42(‐) Maintenance Capex (4) (3) (2) (4) (3) (2)(‐) Incremental Interest Expense (16) (16) (16) (16) (16) (16)(‐) Cost of New Equity (1) (26) (26) (26) (20) (20) (20)Incremental DCF Available to Distribute $38 $12 ($2) $43 $17 $4(‐) Incremental GP Distribution / IDRs (19) (6) 0 – – –Incremental DCF Available to LPs $19 $5 ($2) $43 $17 $4Existing Units 188 188 188 685 685 685New Units 16 16 16 37 37 37Pro Forma Total Units 204 204 204 722 722 722Distribution SummaryCurrent Distribution per Unit $1.64 $1.64 $1.64 $0.55 $0.55 $0.55(+) Incremental Distribution per Unit (2) 0.08 0.02 (0.01) 0.06 0.02 0.01Pro Forma Distribution per Unit $1.72 $1.66 $1.63 $0.61 $0.57 $0.56
Distribution Growth % 4.8% 1.1% (0.8%) 10.4% 4.1% 0.9%
Cost of Capital Analysis – Impact of IDR Elimination
7
Key Assumptions:• $500 MM Investment, 50% Equity / 50% Debt Consideration
• Cost of Debt: 6.25%, CMLP Unit Price = $16.00, CEQP Unit Price = $6.82 (as of 5/5/2015)
Illustrative Cost of Capital UpliftIllustrative Cost of Capital Uplift
CMLP Pro Forma CEQP
1) Current LP distribution on newly issued units.2) Assumes 1.05x distribution coverage on incremental DCF.

Connections for America’s Energy™ ™™ ™™ ™8
Positioning Crestwood for GrowthImproving cost of capital to capture >$3.0 billion of identified potential expansion opportunities around asset footprint
Expansion Opportunities
A. Marcellus Shale:~$500 to $600 million
B. South Texas:~$1.1 to $1.3 billion
C. Permian Basin:~$600 to $700 million
D. Niobrara Shale:~$300 to $350 million
E. Bakken Shale:~$500 to $750 million
F. West Coast:~$75 to $100 million
8
EE
DD
FF
CC
BB
AA

Connections for America’s Energy™ ™™ ™™ ™
Proposed Transaction Timeline
9
Announce Transaction
Complete new $1.5 BB Revolver
syndicationMay 6
May Jun Jul Aug Sep
May
CEQP /CMLP Files S-4 and
Proxy Statement with SEC
SEC Completes Review of CMLP Proxy Statement
July / August
Merger Completed
(CMLP Delisted)
September
CMLP Unitholder Vote
Aug / Sep
• Transactions recommended by CEQP and CMLP conflicts committees and approved by CEQP and CMLP Boards of Directors
• No major regulatory approvals required
• CMLP majority unitholder approval required
– CEQP, Crestwood Holdings, Crestwood management, the board of directors, and the Class A Preferred Holders own approximately 26% of the CMLP units entitled to vote and have indicated their support for the transaction
May / June
Conservative estimate of ~4+ months from Announcement to Merger Closing
Connections for America’s Energy™ ™™ ™™ ™
First Quarter Highlights
1010

Connections for America’s Energy™ ™™ ™™ ™
First Quarter Highlights
• Adjusted EBITDA of $124.7MM, 26% over 1Q 2014
• Distributable cash flow of $93.1MM, 34% over 1Q 2014
• Quarterly cash distribution of $0.41/common unit to be paid May 15, 2015 to unit holders of record on May 8, 2015
• Consolidated Adjusted EBITDA of $141.9MM, 22% over 1Q 2014
• Distributable cash flow of $21.4MM, 9% over 1Q 2014
• Quarterly cash distribution of $0.1375/common unit to be paid May 15, 2015 to unit holders of record on May 8, 2015
Note: See reconciliations of Adjusted EBITDA and distributable cash flow in the Appendix of this presentation.
11
Connections for America’s Energy™ ™™ ™™ ™
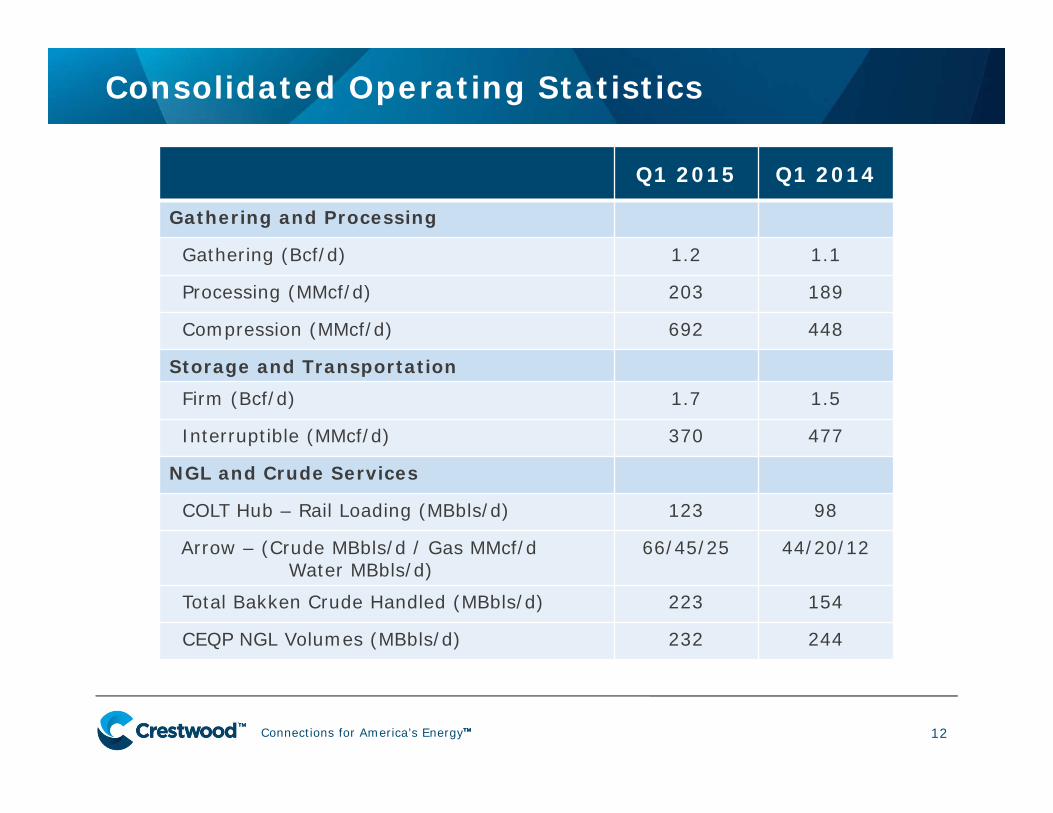
Consolidated Operating Statistics
Q1 2015 Q1 2014
Gathering and Processing
Gathering (Bcf/d) 1.2 1.1
Processing (MMcf/d) 203 189
Compression (MMcf/d) 692 448
Storage and TransportationFirm (Bcf/d) 1.7 1.5
Interruptible (MMcf/d) 370 477
NGL and Crude Services
COLT Hub – Rail Loading (MBbls/d) 123 98
Arrow – (Crude MBbls/d / Gas MMcf/d Water MBbls/d)
66/45/25 44/20/12
Total Bakken Crude Handled (MBbls/d) 223 154
CEQP NGL Volumes (MBbls/d) 232 244
12

Connections for America’s Energy™ ™™ ™™ ™
First Quarter Financial Results - CMLP
Q1 2015 Q1 2014
Total Revenues $455 $537
Gross Margin 169 139
Operations and Maintenance 35 28
General and Administrative 24 24
Net Income 22 6
Adjusted EBITDA 125 99
(-) Cash Interest Expense (28) (26)
(-) Maintenance Capital (3) (3)
Distributable Cash Flow(1) 93 70
($US Millions)
(1) Other adjustments include income tax expense and deficiency payments.
13

Connections for America’s Energy™ ™™ ™™ ™
First Quarter Financial Results - CEQP
Q1 2015 Q1 2014Total Revenues $732 $972
Gross Margin 202 186
Operations and Maintenance 51 44
General and Administrative 28 28
Net Income 18 13
Adjusted EBITDA 142 117
(-) Cash Interest Expense (32) (30)
(-) Maintenance Capital (5) (7)
(-) CMLP DCF Attributable to Public LPs (82) (60)
CEQP Distributable Cash Flow(1) 21 20
($US Millions)
(1) Other adjustments include income tax expense and deficiency payments.
14

Connections for America’s Energy™ ™™ ™™ ™
Non GAAP Reconciliations
1515

Connections for America’s Energy™ ™™ ™™ ™
CMLP Non-GAAP Reconciliations
16
2015 2014
EBITDANet income 21.7$ 5.5$ Interest and debt expense, net 29.9 28.1Provision for income taxes 0.3 0.7Depreciation, amortization and accretion 59.9 50.8
EBITDA (a) 111.8$ 85.1$ Significant items impacting EBITDA:Unit-based compensation charges 5.2 4.6(Gain) loss on long-lived assets, net 0.8 (0.5)Loss on contingent consideration — 2.1(Earnings) loss from unconsolidated affiliates, net (3.4) 0.1Adjusted EBITDA from unconsolidated affiliates, net 6.5 1.7Significant transaction and environmental related costs and other items 3.8 5.8 Adjusted EBITDA (a) 124.7$ 98.9$
Distributable Cash FlowAdjusted EBITDA (a) 124.7$ 98.9$ Cash interest expense (b) (28.0) (26.3)Maintenance capital expenditures (c) (2.7) (3.3)Provision for income taxes (0.3) (0.7)Deficiency payments (0.6) 1.1Distributable cash flow attributable to CMLP (d) 93.1$ 69.7$
(a)
(b) Cash interest expense is book interest expense less amortization of deferred financing costs plus bond premium amortization.(c)(d)
EBITDA is defined as income before income taxes, plus net interest and debt expense, and depreciation, amortization and accretion expense. In addition, Adjusted EBITDA considers the adjusted earnings impact of our unconsolidated affiliates by adjusting our equity earnings or losses from our unconsolidated affiliates for our proportionate share of their depreciation and interest and the impact of certain significant items, such as unit-based compensation expenses, gains and impairments of long- lived assets and goodwill, gains and losses on acquisition- related contingencies, third party costs incurred related to potential and completed acquisitions, certain environmental remediation costs, change in fair value of certain commodity derivative contracts, certain costs related to our 2015 cost savings initiatives, and other transactions identified in a specific reporting period. EBITDA and Adjusted EBITDA are not measures calculated in accordance with GAAP, as they do not include deductions for items such as depreciation, amortization and accretion, interest and income taxes, which are necessary to maintain our business. EBITDA and Adjusted EBITDA should not be considered an alternative to net income, operating cash flow or any other measure of financial performance presented in accordance with GAAP. EBITDA and Adjusted EBITDA calculations may vary among entities, so our computation may not be comparable to measures used by other companies.
Maintenance capital expenditures are defined as those capital expenditures which do not increase operating capacity or revenues from existing levels. Distributable cash flow is defined as Adjusted EBITDA, less cash interest expense, maintenance capital expenditures, income taxes, defic iency payments (primarily related to deferred revenue), and other adjustments. Distributable cash flow should not be considered an alternative to cash flows from operating activities or any other measure of financial performance calculated in accordance with generally accepted accounting principles as those items are used to measure operating performance, liquidity, or the ability to service debt obligations. We believe that distributable cash flow provides additional information for evaluating our ability to declare and pay distributions to unitholders. Distributable cash flow, as we define it, may not be comparable to distributable cash flow or similarly titled measures used by other corporations and partnerships.
Three Months Ended March 31,
(in millions, unaudited)

Connections for America’s Energy™ ™™ ™™ ™
CEQP Non-GAAP Reconciliations
17
2015 2014
EBITDANet income 18.1$ 13.2$ Interest and debt expense, net 33.6 31.7Provision for income taxes 0.4 0.8Depreciation, amortization and accretion 74.2 66.3
EBITDA (a) 126.3$ 112.0$ Significant items impacting EBITDA:Unit-based compensation charges 5.8 5.4(Gain) loss on long-lived assets, net 1.0 (0.5)Loss on contingent consideration — 2.1Earnings (loss) from unconsolidated affiliates, net (3.4) 0.1Adjusted EBITDA from unconsolidated affiliates, net 6.5 1.7Change in fair value of commodity inventory-related derivative contracts 1.1 (10.7)Significant transaction and environmental related costs and other items 4.6 6.5 Adjusted EBITDA (a) 141.9$ 116.6$
Distributable Cash FlowAdjusted EBITDA (a) 141.9$ 116.6$ Cash interest expense (b) (31.8) (30.4)Maintenance capital expenditures (c) (5.4) (7.0)Provision for income taxes (0.4) (0.8)Deficiency payments (0.6) 1.1Public Crestwood Midstream LP unitholders interest in CMLP distributable cash flow (d) (82.3) (59.8)Distributable cash flow attributable to CEQP (e) 21.4$ 19.7$
(a)
(b) Cash interest expense less amortization of deferred financing costs plus bond premium amortization plus or minus fair value adjustment of interest rate swaps.(c)(d)(e)
Crestwood Midstream distributable cash flow less incentive distributions paid to the general partner and the public LP ownership interest in Crestwood Midstream.Distributable cash flow is defined as Adjusted EBITDA, less cash interest expense, maintenance capital expenditures, income taxes, defic iency payments (primarily related to deferred revenue), and public Crestwood Midstream LP unitholders interest in CMLP distributable cash flow. Distributable cash flow should not be considered an alternative to cash flows from operating activities or any other measure of financial performance calculated in accordance with generally accepted accounting princ iples as those items are used to measure operating performance, liquidity, or the ability to service debt obligations. We believe that distributable cash flow provides additional information for evaluating our ability to declare and pay distributions to unitholders. Distributable cash flow, as we define it, may not be comparable to distributable cash flow or similarly titled measures used by other corporations and partnerships.
Three Months Ended March 31,
EBITDA is defined as income before income taxes, plus net interest and debt expense, and depreciation, amortization and accretion expense. In addition, Adjusted EBITDA considers the adjusted earnings impact of our unconsolidated affiliates by adjusting our equity earnings or losses from our unconsolidated affiliates for our proportionate share of their depreciation and interest and the impact of certain significant items, such as unit-based compensation expenses, gains and impairments of long- lived assets and goodwill, gains and losses on acquisition- related contingencies, third party costs incurred related to potential and completed acquisitions, certain environmental remediation costs, change in fair value of certain commodity derivative contracts, certain costs related to our 2015 cost savings initiatives, and other transactions identified in a specific reporting period. EBITDA and Adjusted EBITDA are not measures calculated in accordance with GAAP, as they do not include deductions for items such as depreciation, amortization and accretion, interest and income taxes, which are necessary to maintain our business. EBITDA and Adjusted EBITDA should not be considered an alternative to net income, operating cash flow or any other measure of financial performance presented in accordance with GAAP. EBITDA and Adjusted EBITDA calculations may vary among entities, so our computation may not be comparable to measures used by other companies.
Maintenance capital expenditures are defined as those capital expenditures which do not increase operating capacity or revenues from existing levels.
(in millions, unaudited)