
Simple Steps, Smart Savings Process Evaluation Findings · PDF fileSimple Steps, Smart Savings...
47
Simple Steps, Smart Savings Process Evaluation Findings Webinar Presentation 9-20-16
Transcript of Simple Steps, Smart Savings Process Evaluation Findings · PDF fileSimple Steps, Smart Savings...
Simple Steps, Smart Savings Process Evaluation Findings
Webinar Presentation 9-20-16
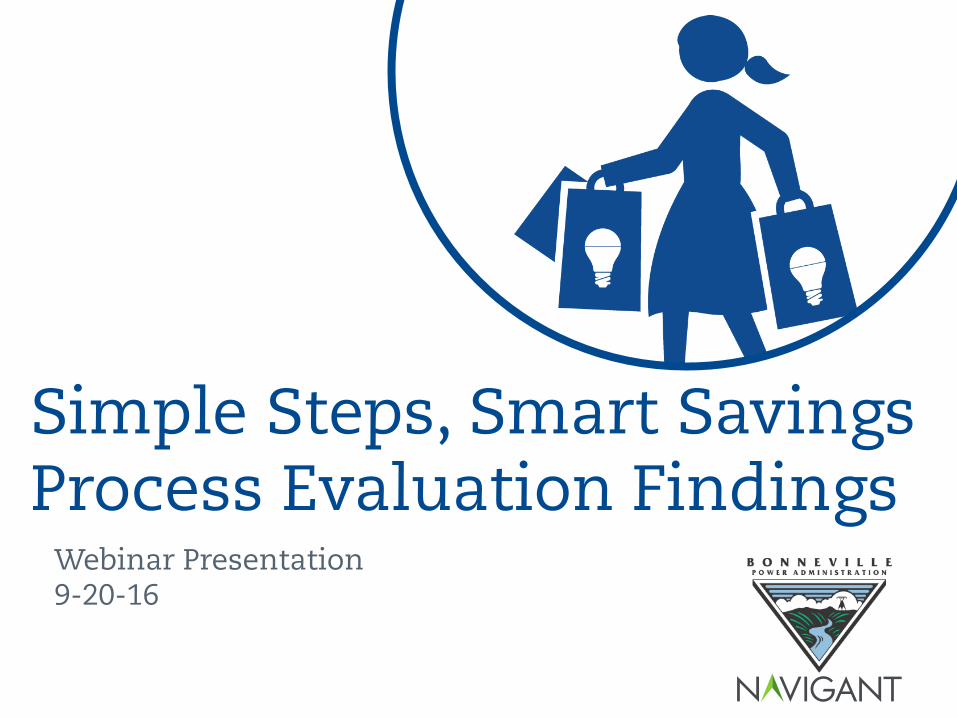
Why Process Evaluation? (work in progress…QSSI team working)
2
• Independent program assessment • Documentation of goals and
approaches
Transparency
• Helps ensure effective use of ratepayer funds
• Understand customer satisfaction Stewardship
• Validation of what’s working • Recommendations for improvement
where opportunities exist Improvement
Agenda
• Welcome • Program Introduction • Results and Key Findings • Recommendations • Discussion
3

Program Introduction
4
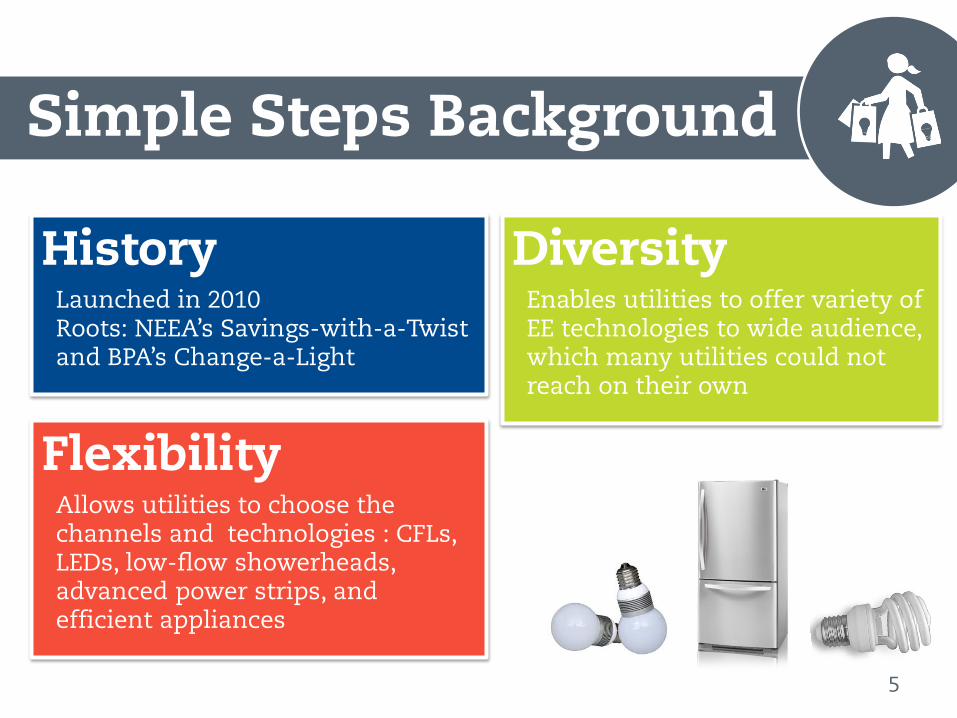
Simple Steps Background
History Launched in 2010 Roots: NEEA’s Savings-with-a-Twist and BPA’s Change-a-Light
Diversity Enables utilities to offer variety of EE technologies to wide audience, which many utilities could not reach on their own
Flexibility Allows utilities to choose the channels and technologies : CFLs, LEDs, low-flow showerheads, advanced power strips, and efficient appliances
5
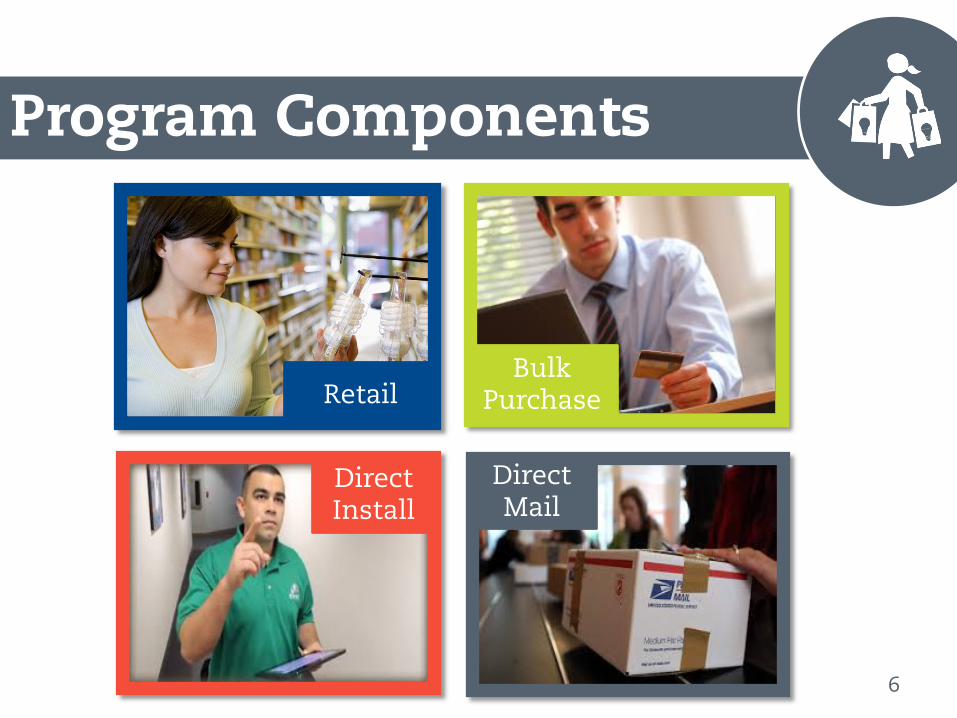
Retail
Direct Install
Bulk Purchase
Direct Mail
Program Components
6
7
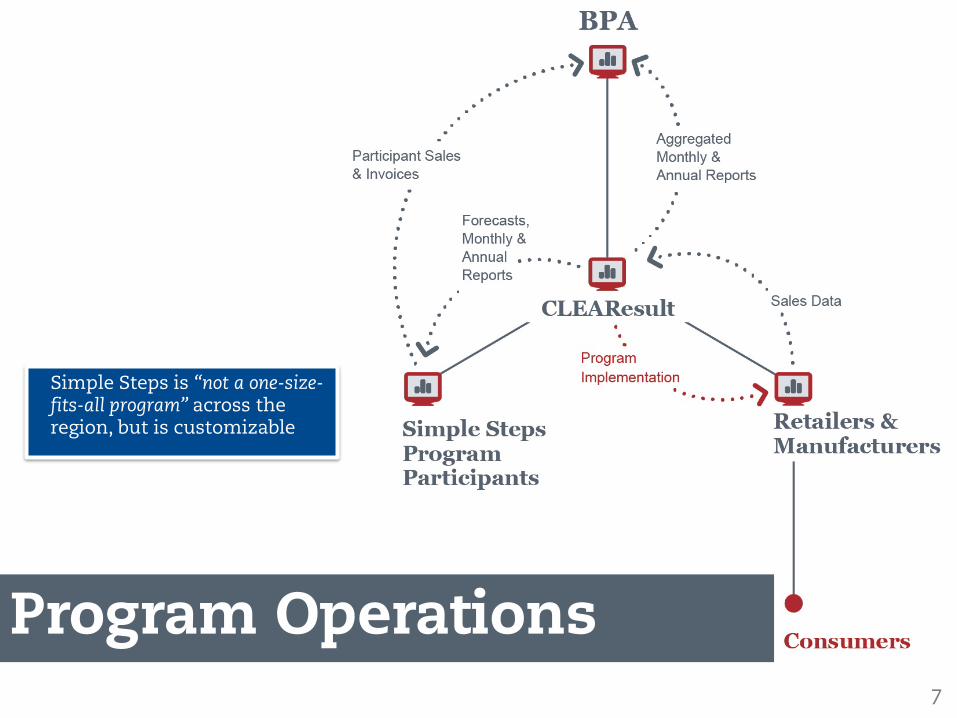
Simple Steps is “not a one-size-fits-all program” across the region, but is customizable
Program Operations
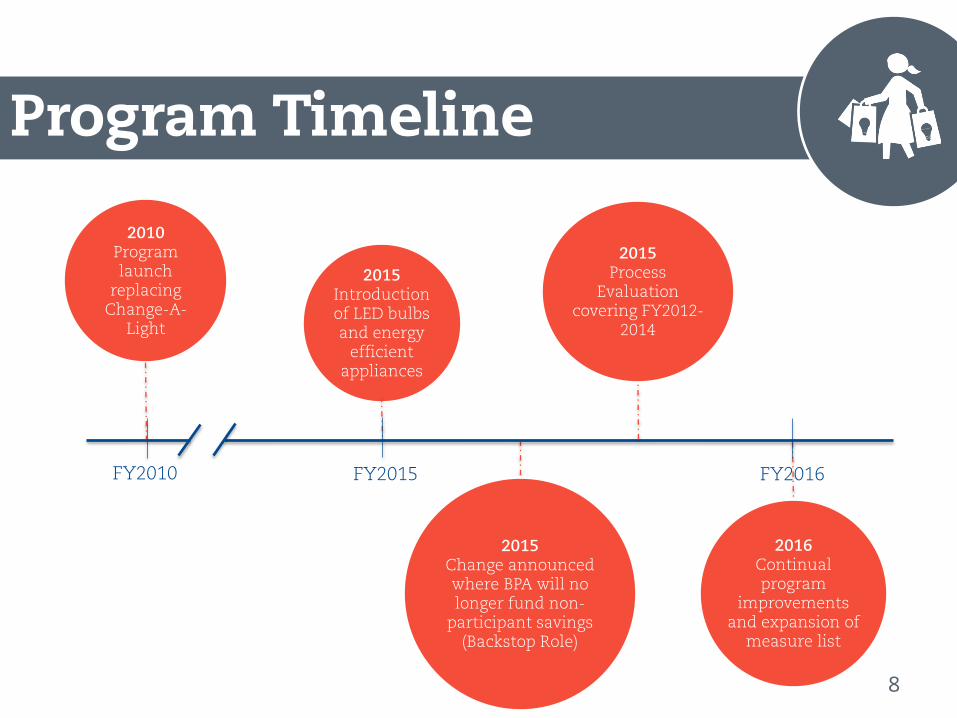
2015 Change announced where BPA will no longer fund non-
participant savings (Backstop Role)
2010 Program launch
replacing Change-A-
Light
2015 Introduction of LED bulbs and energy
efficient appliances
FY2010 FY2015 FY2016
2015 Process
Evaluation covering FY2012-
2014
2016 Continual program
improvements and expansion of
measure list
Program Timeline
8
Evaluation Overview
9
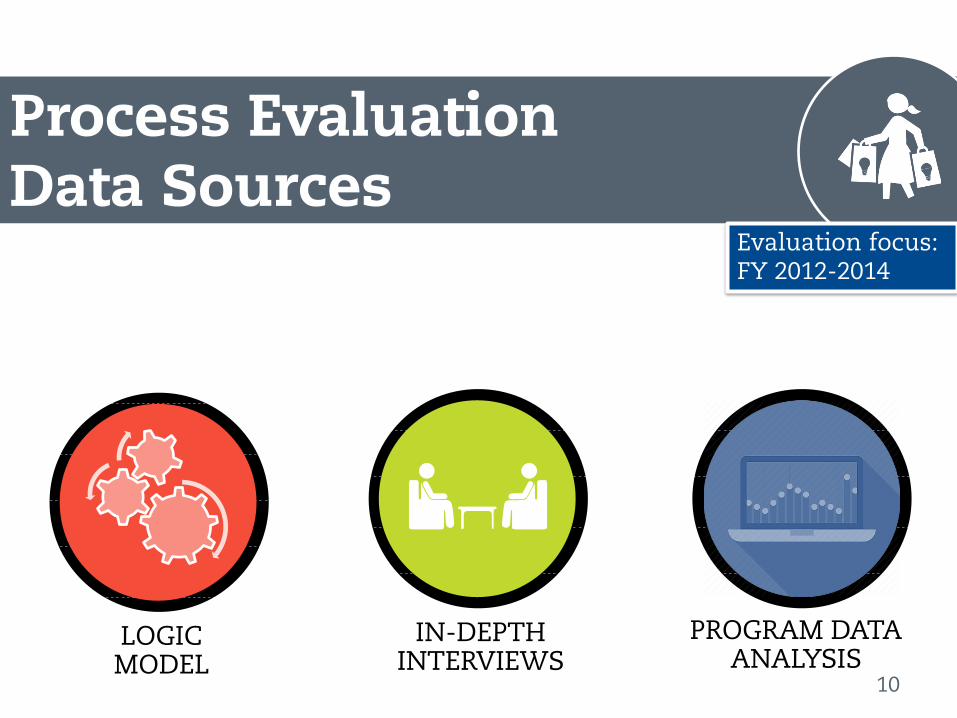
PROGRAM DATA ANALYSIS
IN-DEPTH INTERVIEWS
LOGIC MODEL
Process Evaluation Data Sources
10
Evaluation focus: FY 2012-2014
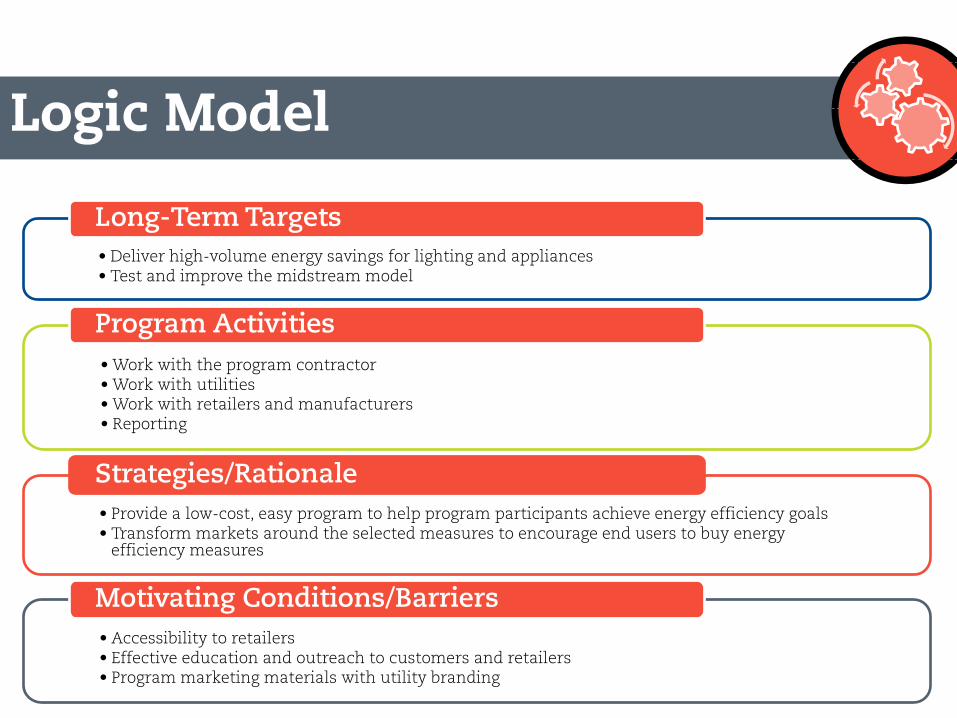
• Deliver high-volume energy savings for lighting and appliances • Test and improve the midstream model
Long-Term Targets
• Work with the program contractor • Work with utilities • Work with retailers and manufacturers • Reporting
Program Activities
• Provide a low-cost, easy program to help program participants achieve energy efficiency goals • Transform markets around the selected measures to encourage end users to buy energy
efficiency measures
Strategies/Rationale
• Accessibility to retailers • Effective education and outreach to customers and retailers • Program marketing materials with utility branding
Motivating Conditions/Barriers
Logic Model
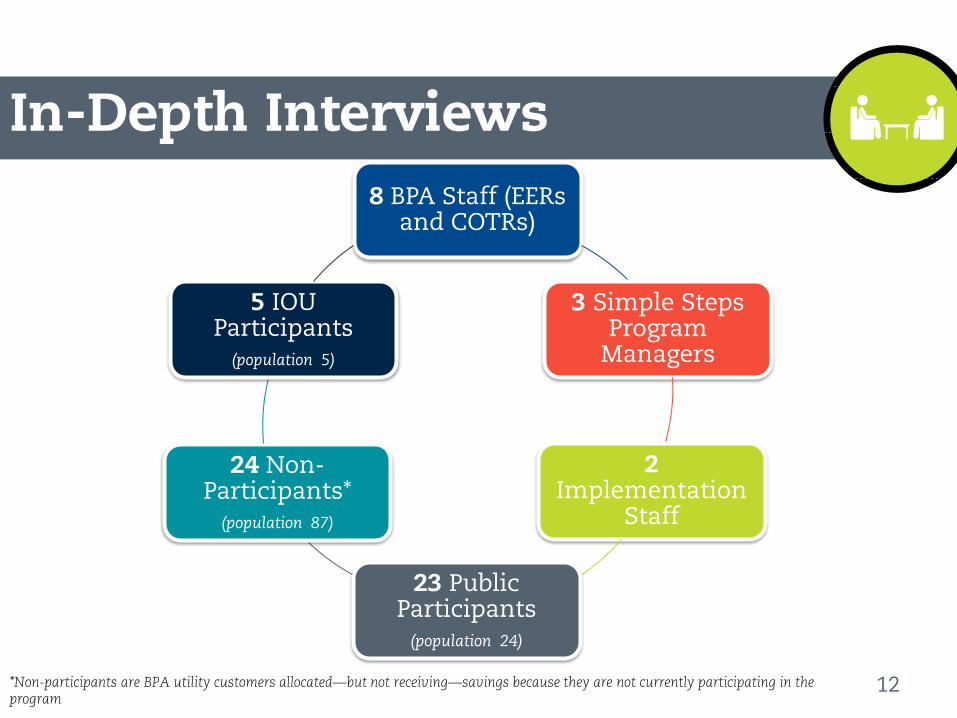
*Non-participants are BPA utility customers allocated—but not receiving—savings because they are not currently participating in the program
8 BPA Staff (EERs and COTRs)
3 Simple Steps Program
Managers
2 Implementation
Staff
23 Public Participants
(population 24)
24 Non-Participants*
(population 87)
5 IOU Participants
(population 5)
In-Depth Interviews
12
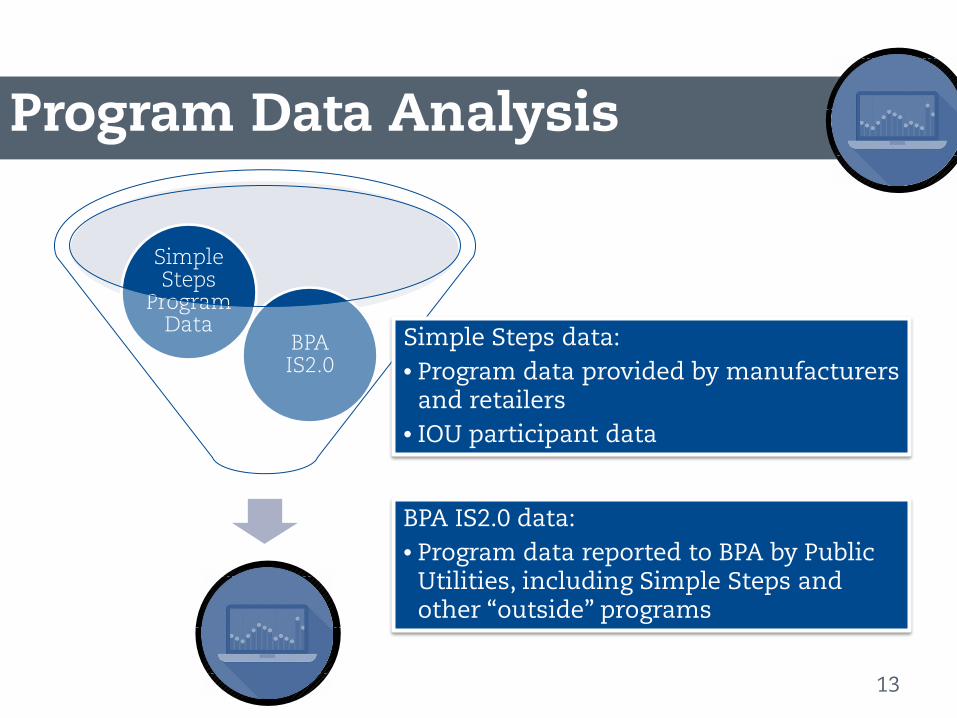
BPA IS2.0
Simple Steps
Program Data
BPA IS2.0 data: • Program data reported to BPA by Public
Utilities, including Simple Steps and other “outside” programs
Simple Steps data: • Program data provided by manufacturers
and retailers • IOU participant data
Program Data Analysis
13
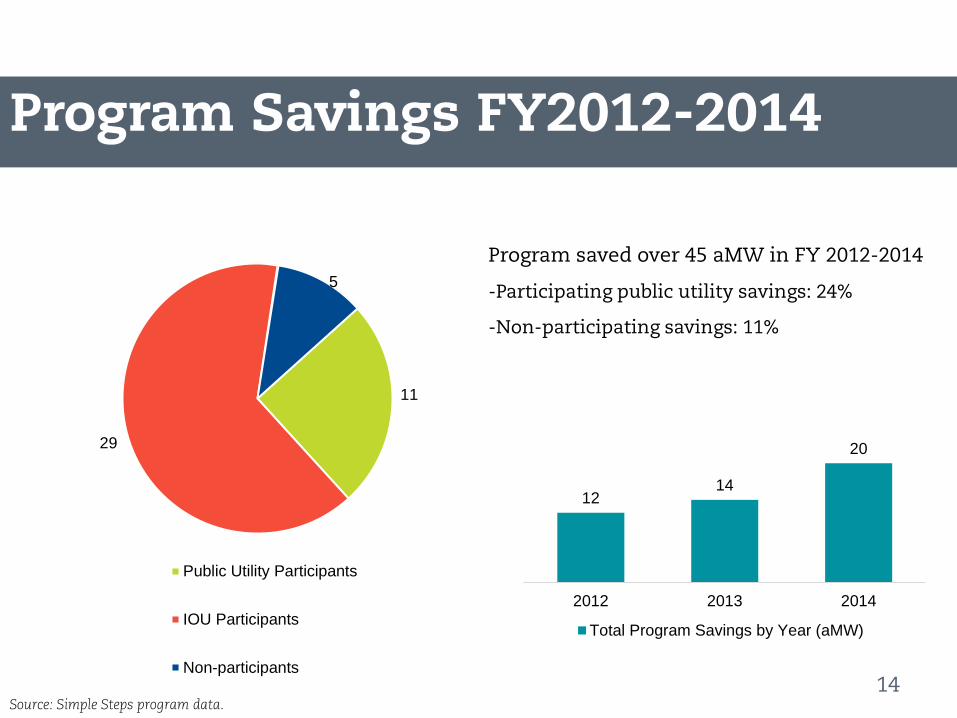
12 14
20
2012 2013 2014
Total Program Savings by Year (aMW)
Program saved over 45 aMW in FY 2012-2014
-Participating public utility savings: 24%
-Non-participating savings: 11%
11
29
5
Public Utility Participants
IOU Participants
Non-participants
Program Savings FY2012-2014
Source: Simple Steps program data. 14
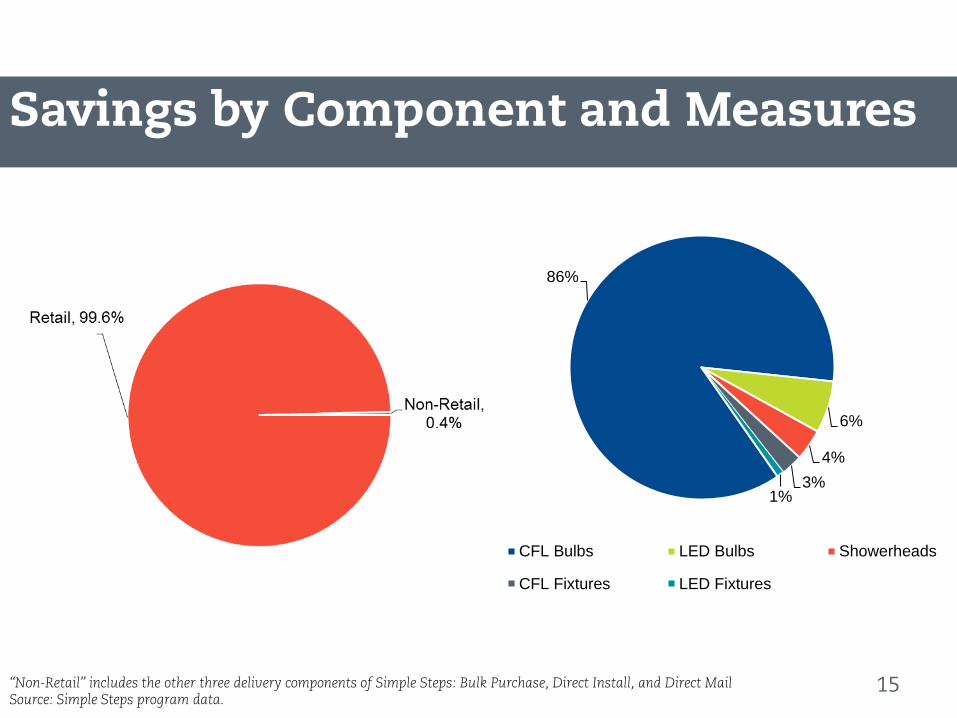
“Non-Retail” includes the other three delivery components of Simple Steps: Bulk Purchase, Direct Install, and Direct Mail Source: Simple Steps program data.
86%
6%
4% 3%
1%
CFL Bulbs LED Bulbs Showerheads
CFL Fixtures LED Fixtures
Savings by Component and Measures
15
Results and Key Findings
16
Program Effectiveness
17
KEY FINDING: Public utilities like the ease of Simple Steps calling it a “turnkey” program. IOUs like the benefit the program brings to the region and the promotion of energy efficient technologies.
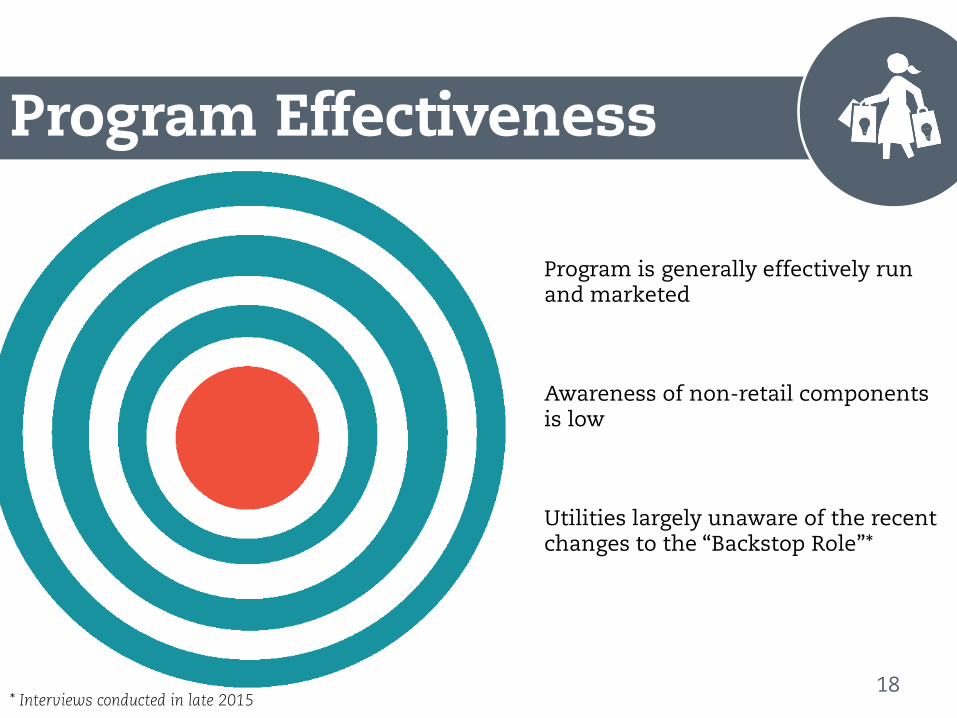
* Interviews conducted in late 2015
Program Effectiveness
Program is generally effectively run and marketed
Awareness of non-retail components is low
Utilities largely unaware of the recent changes to the “Backstop Role”*
18
Interview Results: Overall Program Satisfaction
19
KEY FINDING: Satisfaction among public participants is moderate for the program overall. Stakeholders generally liked the types of measures and flexibility in measure offerings the program allows, but were less satisfied with the amount of utility branding overall.
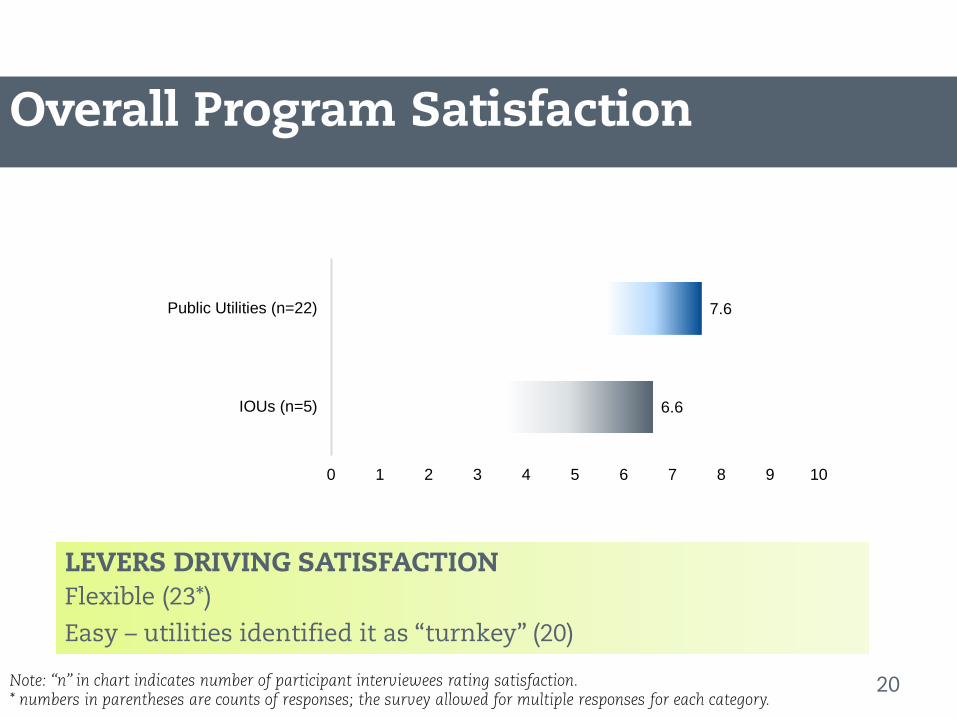
Note: “n” in chart indicates number of participant interviewees rating satisfaction. * numbers in parentheses are counts of responses; the survey allowed for multiple responses for each category.
LEVERS DRIVING SATISFACTION Flexible (23*)
Easy – utilities identified it as “turnkey” (20)
6.6
7.6
0 1 2 3 4 5 6 7 8 9 10
IOUs (n=5)
Public Utilities (n=22)
Overall Program Satisfaction
20

Note: “n” in chart indicates number of participant interviewees rating satisfaction. * numbers in parentheses are counts of responses; the survey allowed for multiple responses for each category.
STICKING POINTS HINDERING SATISFACTION Lack of visibility and utility branding (15)
Wanted to expand measure list to include heat pump
water heaters, thermostats, and efficient washer/dryers (10)
Low oversight or engagement in rural areas (4)
IOUs had issues with monthly sales reports not meeting reporting requirements (3)
Overall Program Satisfaction
21
Overall Program Satisfaction
22
KEY FINDING: Participants who reported valuing the savings aspect of the program (n=11), gave higher overall satisfaction scores than those who reported valuing customer connections and utility branding (n=5).
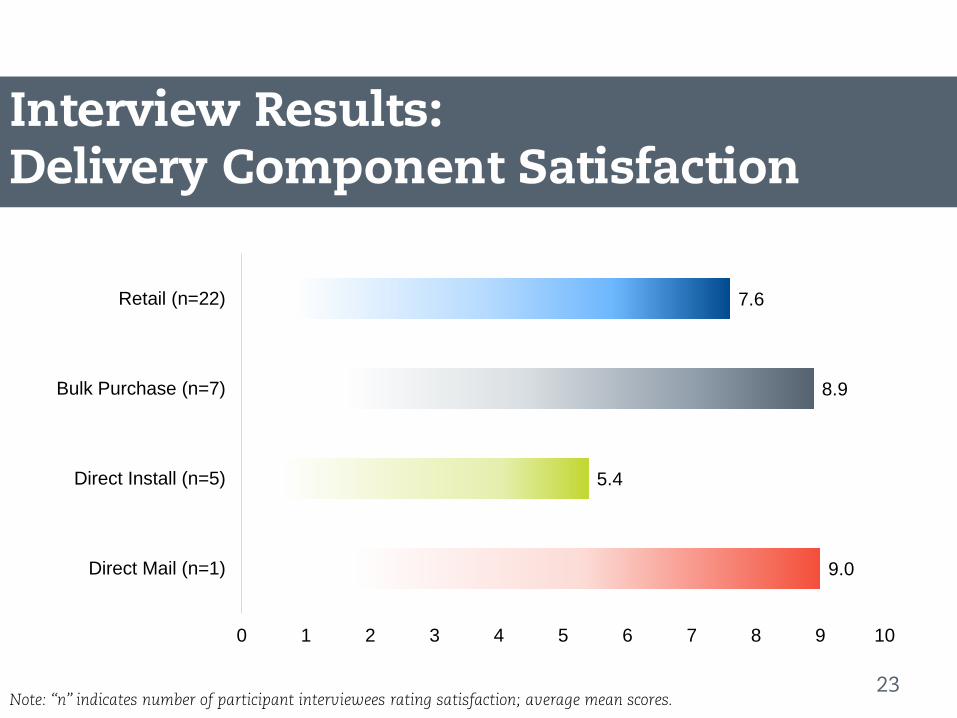
Note: “n” indicates number of participant interviewees rating satisfaction; average mean scores.
9.0
5.4
8.9
7.6
0 1 2 3 4 5 6 7 8 9 10
Direct Mail (n=1)
Direct Install (n=5)
Bulk Purchase (n=7)
Retail (n=22)
Interview Results: Delivery Component Satisfaction
23
Retail Component Satisfaction
24
“The program works. It’s incredibly easy for us, requires almost no effort, [and it] helps our customers without them really knowing about it.”
– Satisfied Public Participant
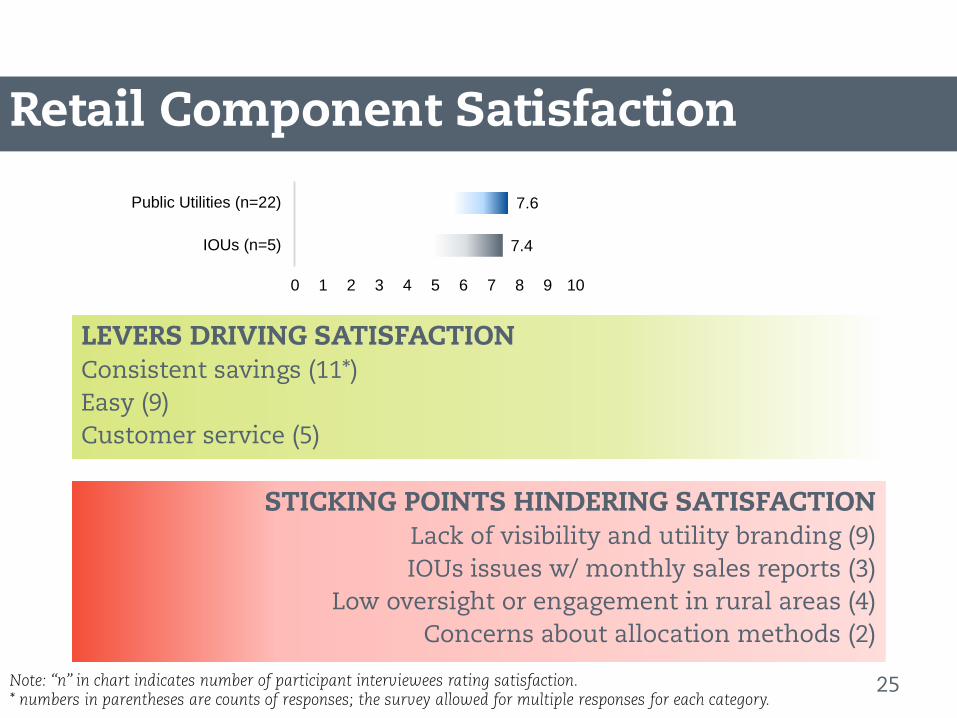
Note: “n” in chart indicates number of participant interviewees rating satisfaction. * numbers in parentheses are counts of responses; the survey allowed for multiple responses for each category.
LEVERS DRIVING SATISFACTION Consistent savings (11*) Easy (9) Customer service (5)
7.4
7.6
0 1 2 3 4 5 6 7 8 9 10
IOUs (n=5)
Public Utilities (n=22)
STICKING POINTS HINDERING SATISFACTION Lack of visibility and utility branding (9) IOUs issues w/ monthly sales reports (3)
Low oversight or engagement in rural areas (4) Concerns about allocation methods (2)
Retail Component Satisfaction
25
Bulk Purchase Component Satisfaction
26
“It’s just really easy and it’s low cost. We ask a lot of the bulk purchase program and it really delivers.”
– Satisfied Public Participant
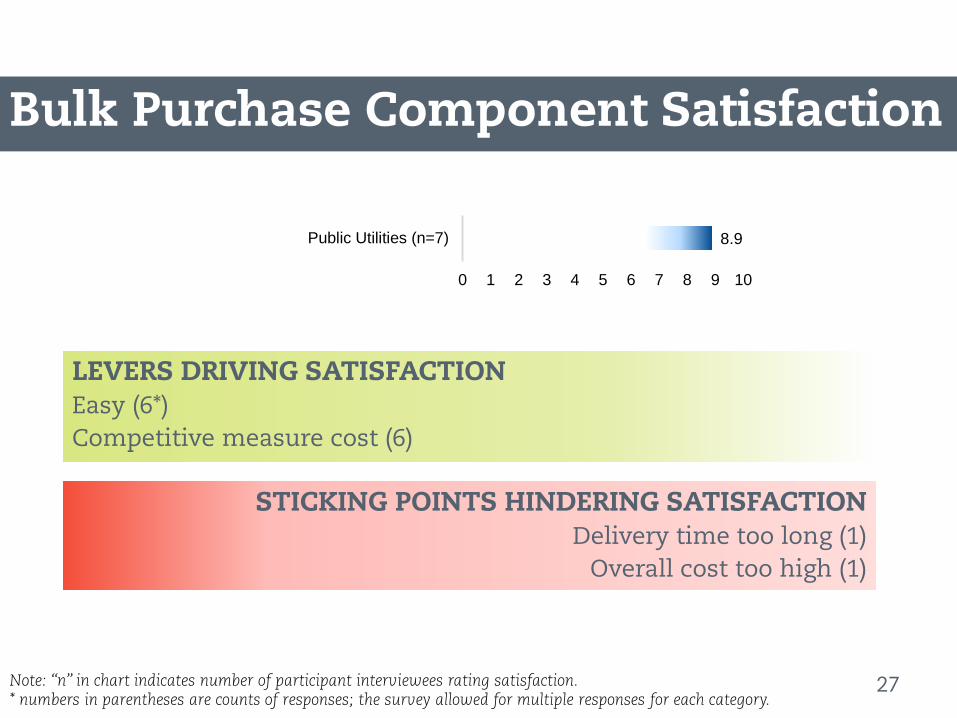
Note: “n” in chart indicates number of participant interviewees rating satisfaction. * numbers in parentheses are counts of responses; the survey allowed for multiple responses for each category.
LEVERS DRIVING SATISFACTION Easy (6*) Competitive measure cost (6)
STICKING POINTS HINDERING SATISFACTION Delivery time too long (1)
Overall cost too high (1)
8.9
0 1 2 3 4 5 6 7 8 9 10
Public Utilities (n=7)
Bulk Purchase Component Satisfaction
27
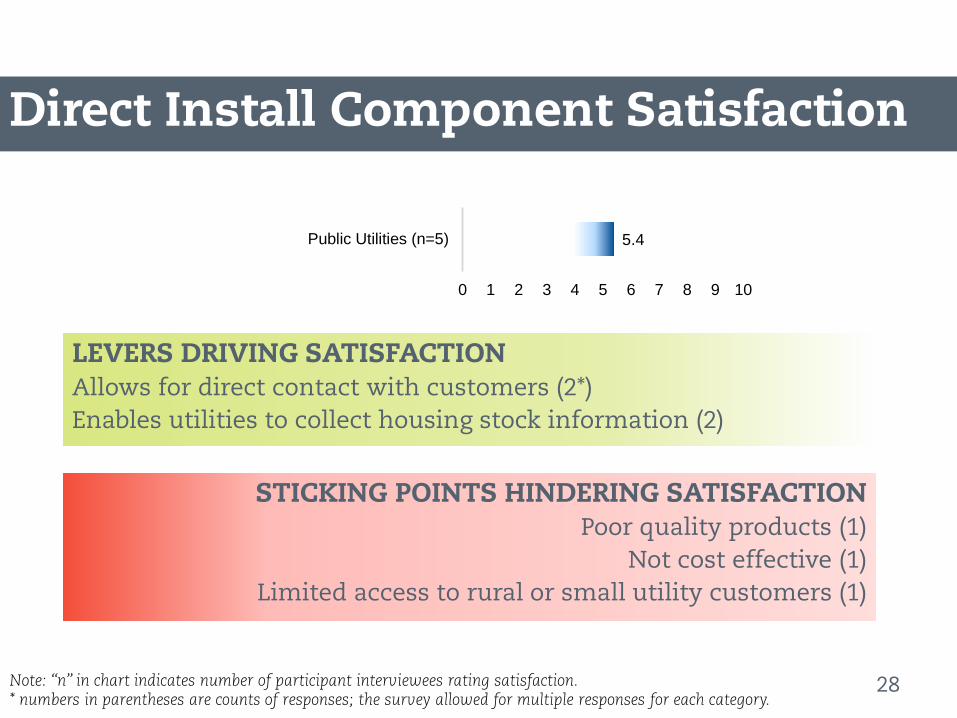
Note: “n” in chart indicates number of participant interviewees rating satisfaction. * numbers in parentheses are counts of responses; the survey allowed for multiple responses for each category.
LEVERS DRIVING SATISFACTION Allows for direct contact with customers (2*) Enables utilities to collect housing stock information (2)
STICKING POINTS HINDERING SATISFACTION Poor quality products (1)
Not cost effective (1) Limited access to rural or small utility customers (1)
5.4
0 1 2 3 4 5 6 7 8 9 10
Public Utilities (n=5)
Direct Install Component Satisfaction
28
Note: “n” in chart indicates number of participant interviewees rating satisfaction. * numbers in parentheses are counts of responses; the survey allowed for multiple responses for each category.
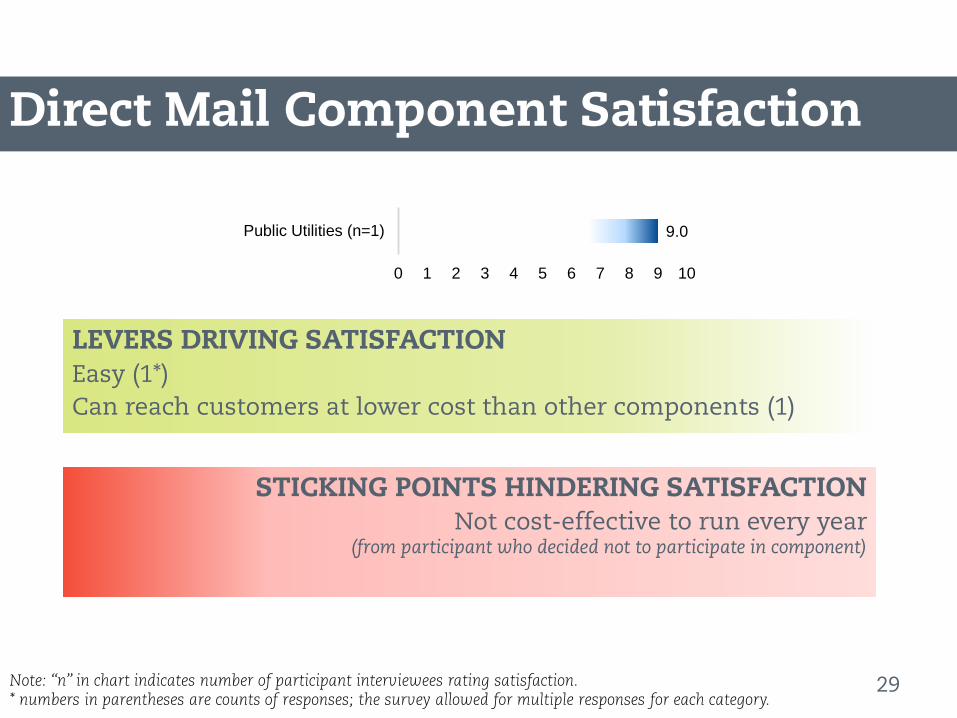
LEVERS DRIVING SATISFACTION Easy (1*) Can reach customers at lower cost than other components (1)
STICKING POINTS HINDERING SATISFACTION Not cost-effective to run every year
(from participant who decided not to participate in component)
9.0
0 1 2 3 4 5 6 7 8 9 10
Public Utilities (n=1)
Direct Mail Component Satisfaction
29
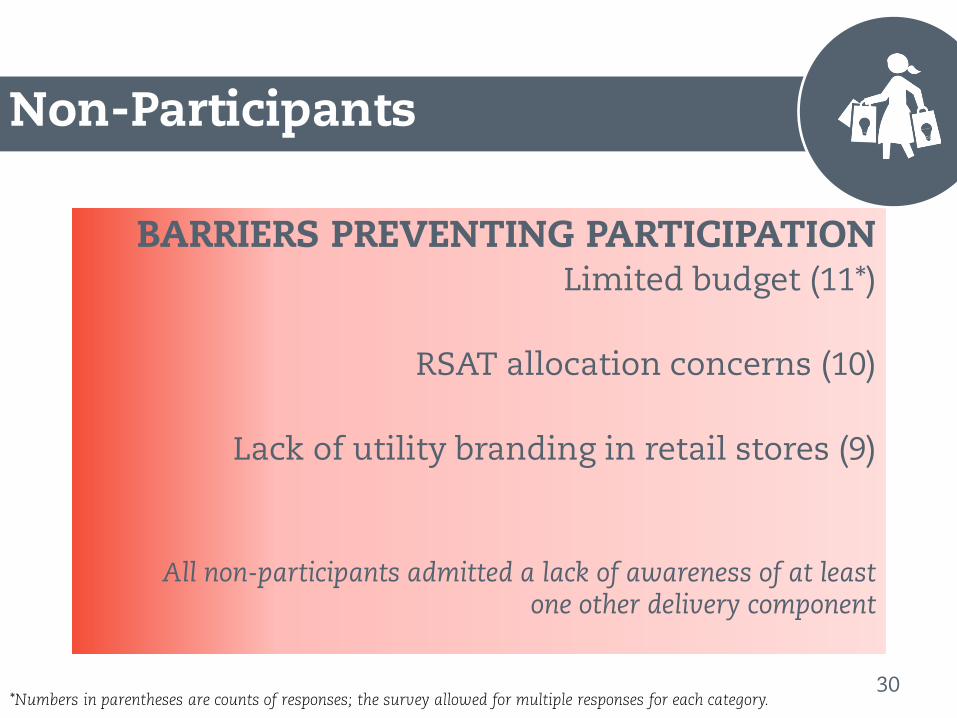
*Numbers in parentheses are counts of responses; the survey allowed for multiple responses for each category.
BARRIERS PREVENTING PARTICIPATION Limited budget (11*)
RSAT allocation concerns (10)
Lack of utility branding in retail stores (9)
All non-participants admitted a lack of awareness of at least one other delivery component
Non-Participants
30
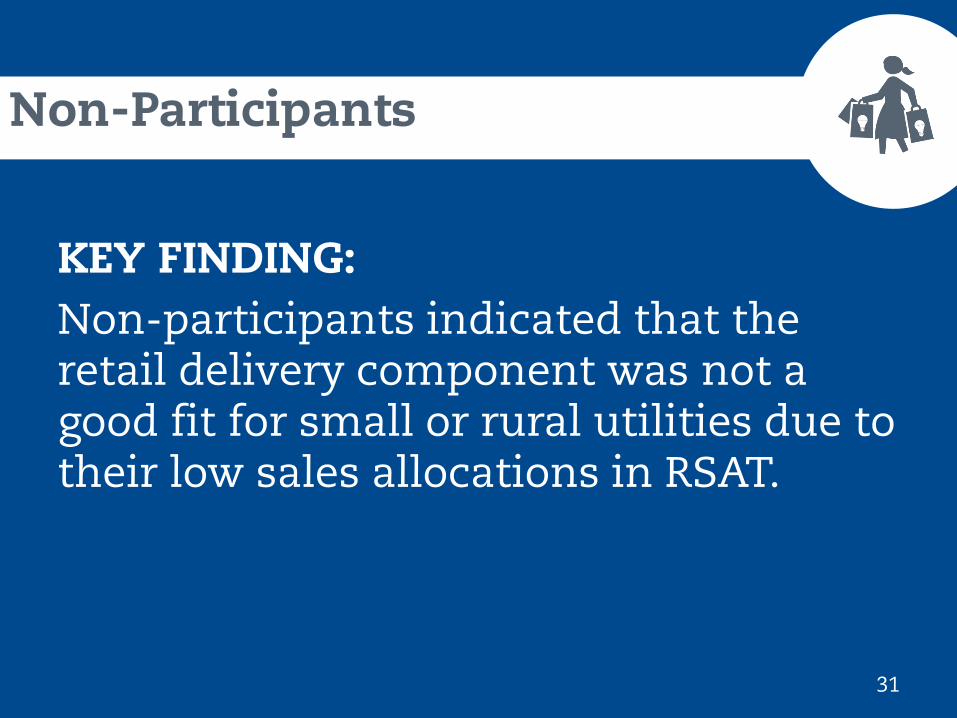
Non-Participants
31
KEY FINDING: Non-participants indicated that the retail delivery component was not a good fit for small or rural utilities due to their low sales allocations in RSAT.

0
20
40
60
80
100
120
Utility A Utility B Utility C
Uni
ts
Example - Ref No. 123456 - Omnidirectional LED
Simple Steps Program Data IS2.0 Data
This gap indicates unreported savings
This gap indicates outside savings
Alignment
Database Comparisons
32
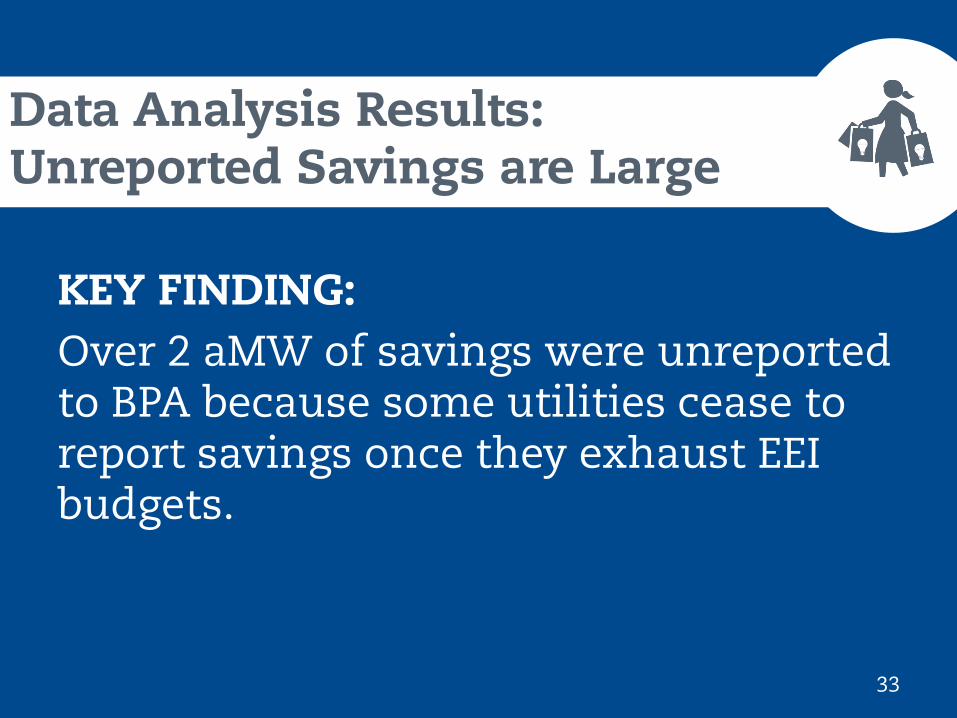
Data Analysis Results: Unreported Savings are Large
33
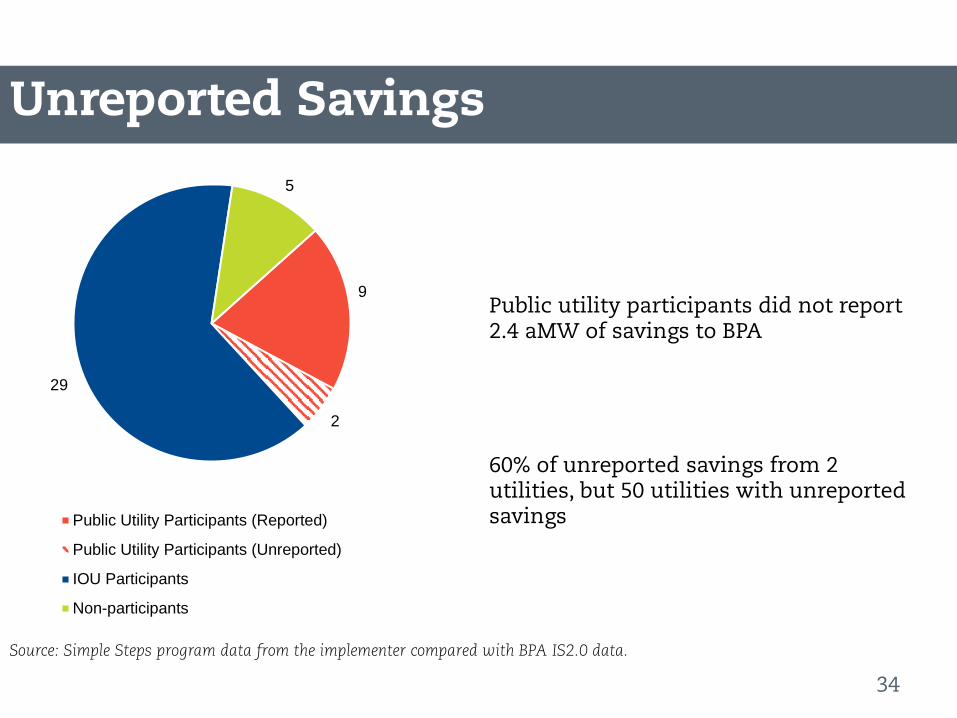
KEY FINDING: Over 2 aMW of savings were unreported to BPA because some utilities cease to report savings once they exhaust EEI budgets.
Source: Simple Steps program data from the implementer compared with BPA IS2.0 data.
Public utility participants did not report 2.4 aMW of savings to BPA
60% of unreported savings from 2 utilities, but 50 utilities with unreported savings
Unreported Savings
9
2
29
5
Public Utility Participants (Reported)
Public Utility Participants (Unreported)
IOU Participants
Non-participants
34

Outside Program Savings
35
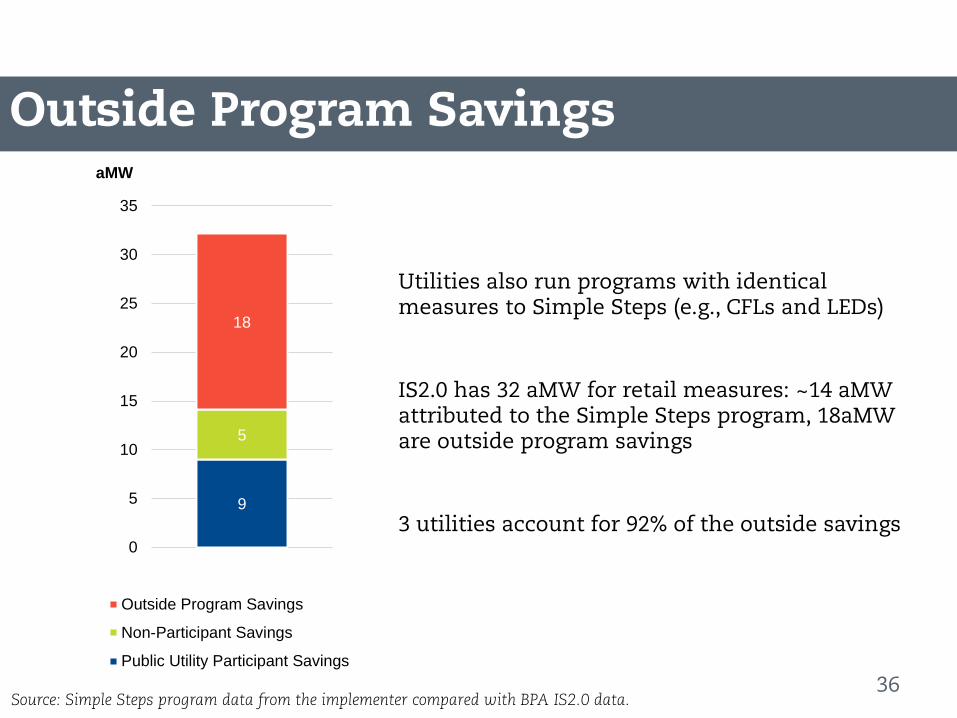
KEY FINDING: A significant amount of savings in the region (18 aMW) come from outside programs offering identical retail measures to those offered by Simple Steps.
Source: Simple Steps program data from the implementer compared with BPA IS2.0 data.
Utilities also run programs with identical measures to Simple Steps (e.g., CFLs and LEDs)
IS2.0 has 32 aMW for retail measures: ~14 aMW attributed to the Simple Steps program, 18aMW are outside program savings
3 utilities account for 92% of the outside savings 9
5
18
0
5
10
15
20
25
30
35
aMW
Outside Program Savings
Non-Participant Savings
Public Utility Participant Savings
Outside Program Savings
36
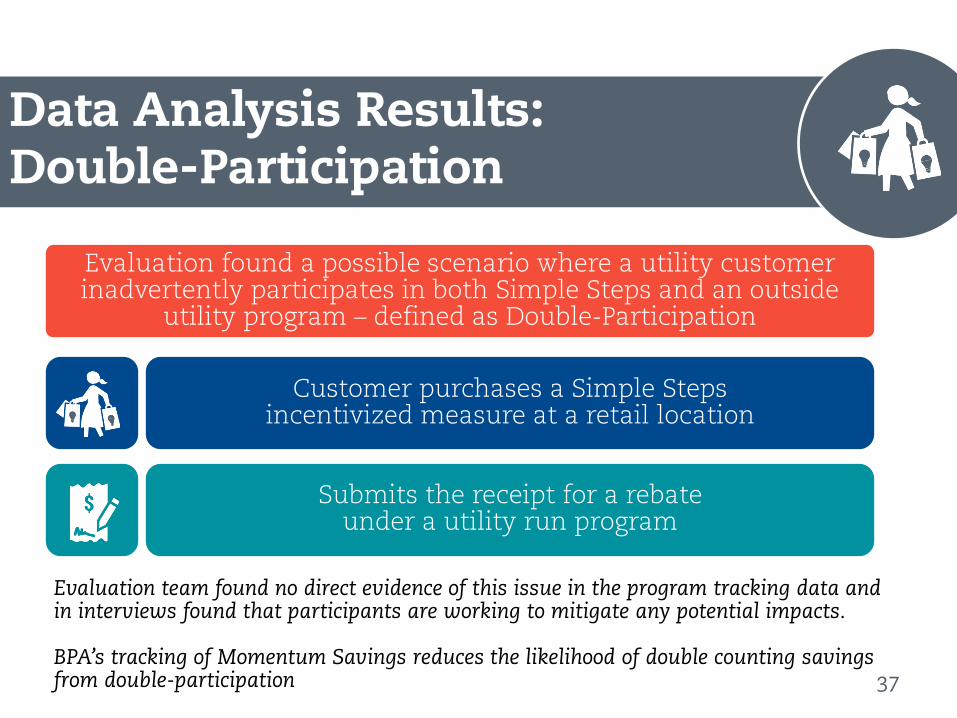
Evaluation found a possible scenario where a utility customer inadvertently participates in both Simple Steps and an outside
utility program – defined as Double-Participation
Customer purchases a Simple Steps incentivized measure at a retail location
Submits the receipt for a rebate under a utility run program
Evaluation team found no direct evidence of this issue in the program tracking data and in interviews found that participants are working to mitigate any potential impacts. BPA’s tracking of Momentum Savings reduces the likelihood of double counting savings from double-participation
Data Analysis Results: Double-Participation
37

Recommendations
38
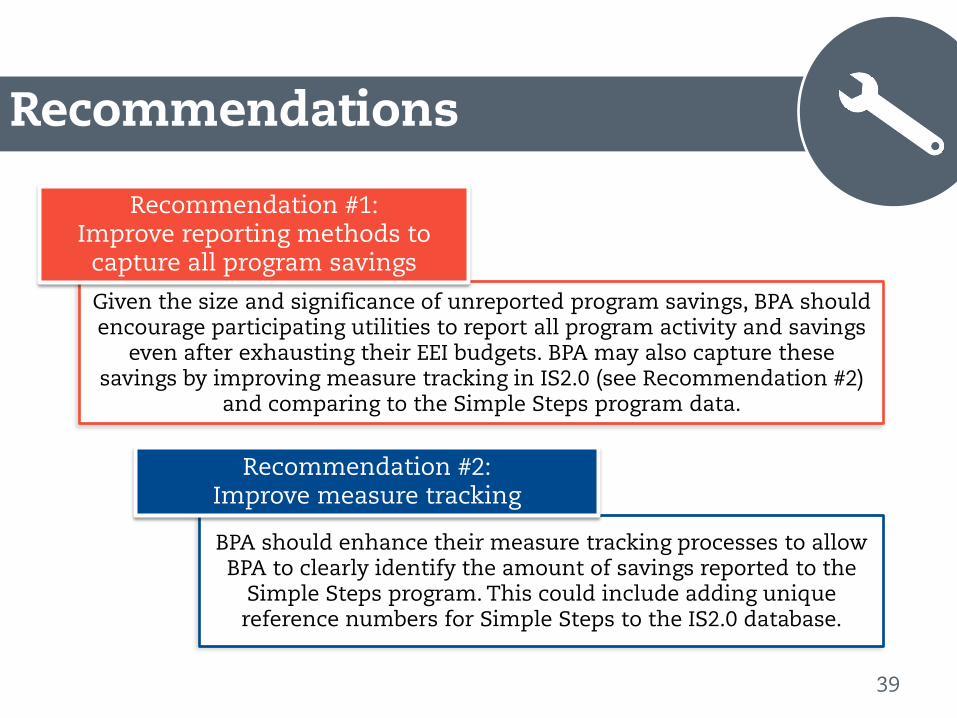
BPA should enhance their measure tracking processes to allow BPA to clearly identify the amount of savings reported to the
Simple Steps program. This could include adding unique reference numbers for Simple Steps to the IS2.0 database.
Recommendation #2: Improve measure tracking
Given the size and significance of unreported program savings, BPA should encourage participating utilities to report all program activity and savings
even after exhausting their EEI budgets. BPA may also capture these savings by improving measure tracking in IS2.0 (see Recommendation #2)
and comparing to the Simple Steps program data.
Recommendation #1: Improve reporting methods to
capture all program savings
Recommendations
39
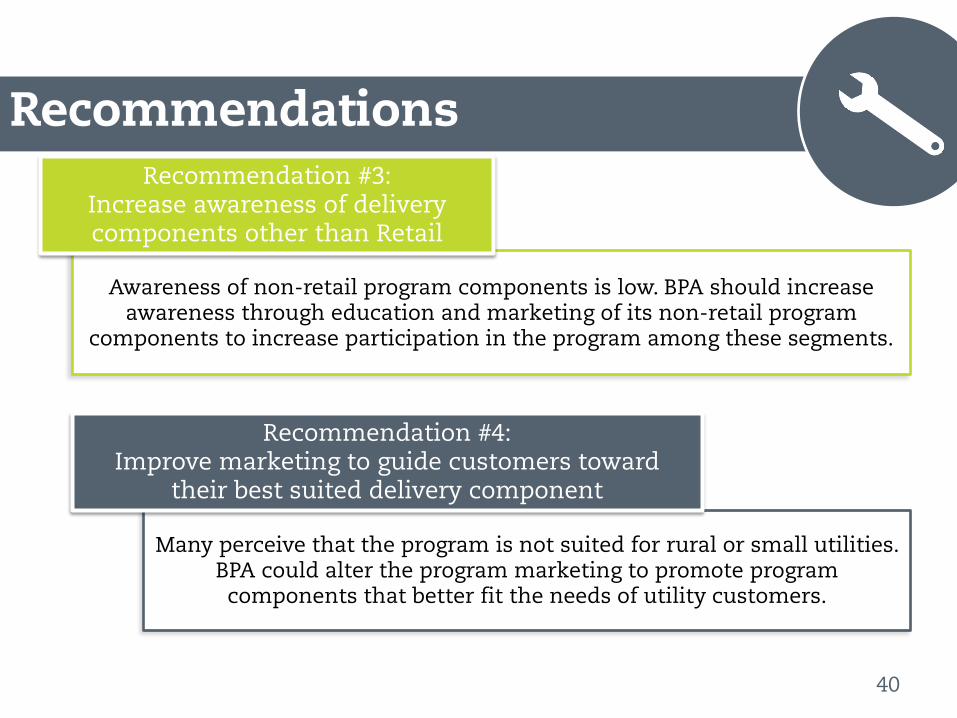
Many perceive that the program is not suited for rural or small utilities. BPA could alter the program marketing to promote program components that better fit the needs of utility customers.
Recommendation #4: Improve marketing to guide customers toward
their best suited delivery component
Awareness of non-retail program components is low. BPA should increase awareness through education and marketing of its non-retail program
components to increase participation in the program among these segments.
Recommendation #3: Increase awareness of delivery components other than Retail
Recommendations
40
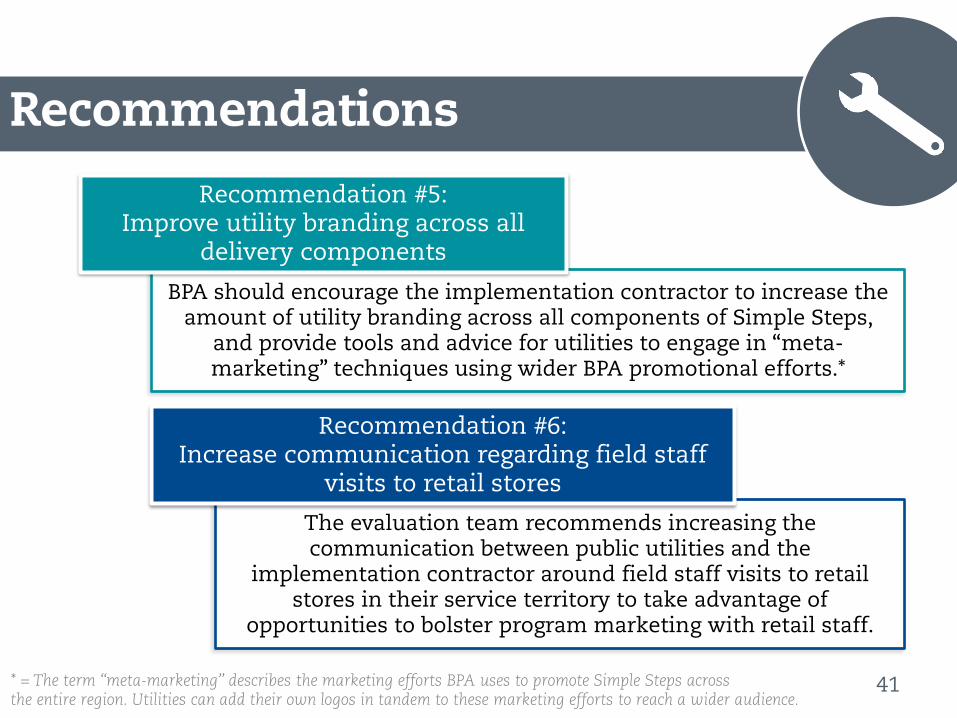
* = The term “meta-marketing” describes the marketing efforts BPA uses to promote Simple Steps across the entire region. Utilities can add their own logos in tandem to these marketing efforts to reach a wider audience.
BPA should encourage the implementation contractor to increase the amount of utility branding across all components of Simple Steps,
and provide tools and advice for utilities to engage in “meta-marketing” techniques using wider BPA promotional efforts.*
Recommendation #5: Improve utility branding across all
delivery components
The evaluation team recommends increasing the communication between public utilities and the
implementation contractor around field staff visits to retail stores in their service territory to take advantage of
opportunities to bolster program marketing with retail staff.
Recommendation #6: Increase communication regarding field staff
visits to retail stores
Recommendations
41
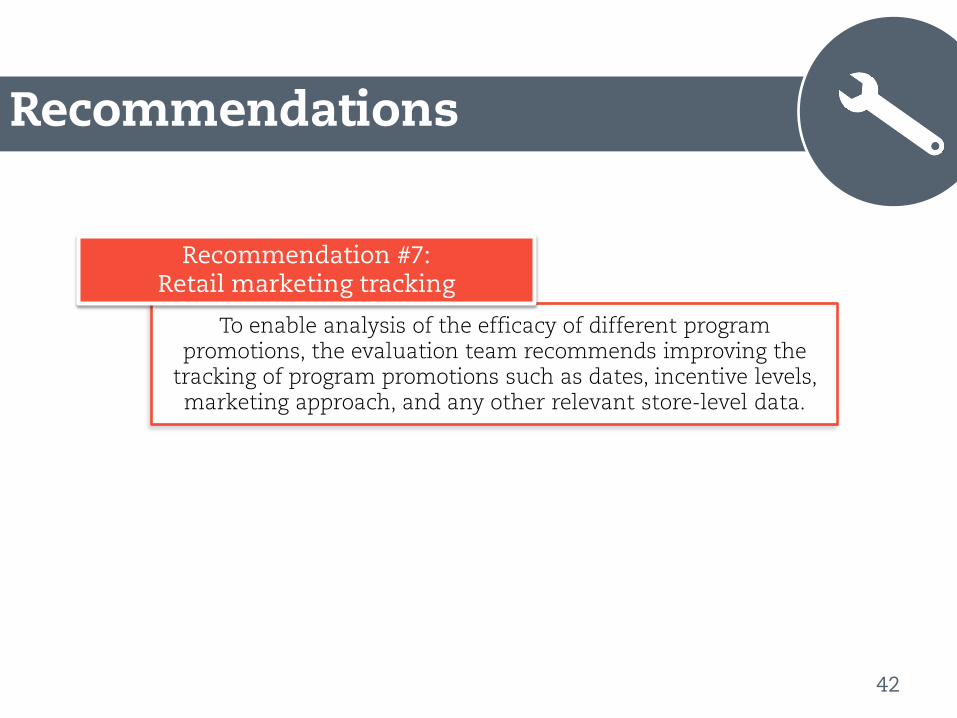
To enable analysis of the efficacy of different program promotions, the evaluation team recommends improving the
tracking of program promotions such as dates, incentive levels, marketing approach, and any other relevant store-level data.
Recommendation #7: Retail marketing tracking
Recommendations
42
Evaluation Take and Next Steps
43
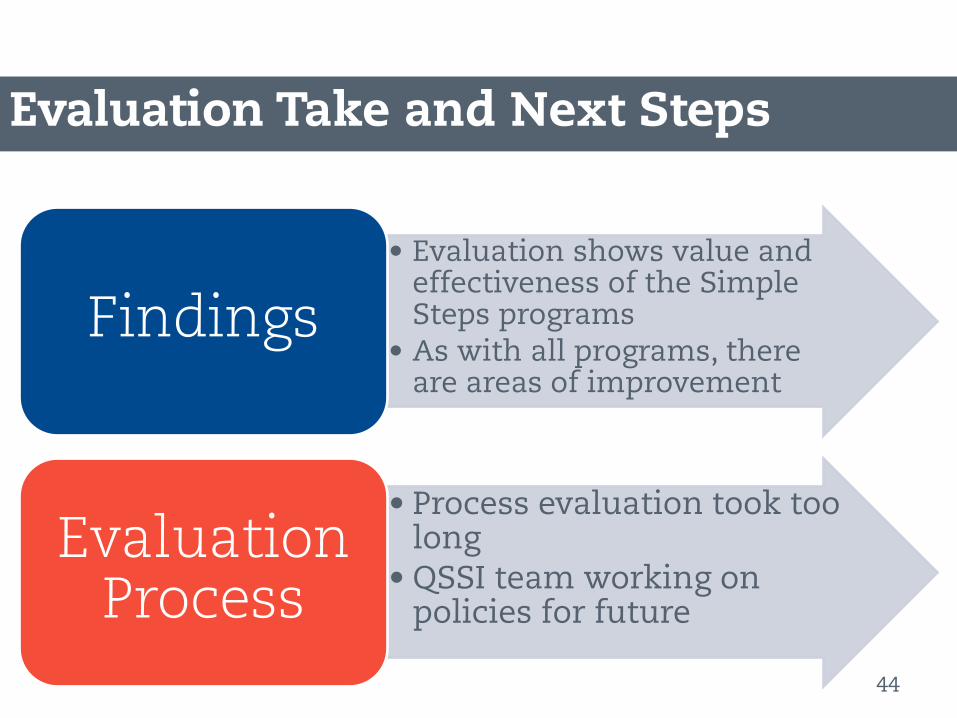
Evaluation Take and Next Steps
44
• Evaluation shows value and effectiveness of the Simple Steps programs
• As with all programs, there are areas of improvement
Findings
• Process evaluation took too long
• QSSI team working on policies for future
Evaluation Process
Program Perspective
45
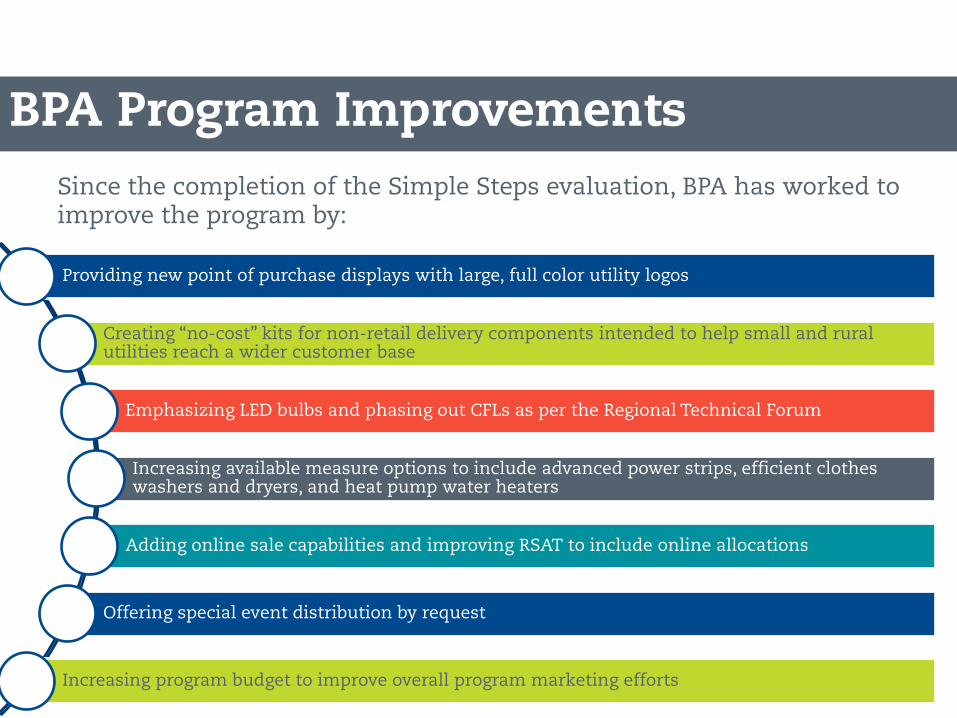
BPA Program Improvements Since the completion of the Simple Steps evaluation, BPA has worked to improve the program by:
46
Providing new point of purchase displays with large, full color utility logos
Creating “no-cost” kits for non-retail delivery components intended to help small and rural utilities reach a wider customer base
Emphasizing LED bulbs and phasing out CFLs as per the Regional Technical Forum
Increasing available measure options to include advanced power strips, efficient clothes washers and dryers, and heat pump water heaters
Adding online sale capabilities and improving RSAT to include online allocations
Offering special event distribution by request
Increasing program budget to improve overall program marketing efforts