Simple Metrics for Curricular Analytics - CEUR-WS.orgceur-ws.org/Vol-1590/paper-04.pdf · Simple...
7
Simple Metrics for Curricular Analytics Xavier Ochoa Escuela Superior Politécnica del Litoral Vía Perimetral, Km. 30.5 Guayaquil, Ecuador [email protected] ABSTRACT The analysis of a program curriculum is traditionally a very subjective task. Perceptions and anecdotes, faculty pref- erences and content or objectives check-lists are the main sources of information to undergo the revision of the struc- ture of a program. This works proposes a list of simple met- rics, that can be easily extracted from readily available aca- demic data that contains the information about the actual interactions of students with the curriculum. These metrics, divided into time- and performance-related, are calculated at program level. The use of these metrics provides objective information in which to base discussions about the current state and efficiency of the curriculum. To exemplify the feasibility and usefulness of the metrics, this work presents some illustrative analysis that make use of the simple cur- riculum metrics. CCS Concepts •Applied computing ! Education; Keywords Learning Analytics, Curriculum Analytics 1. INTRODUCTION Learning Analytics has been traditionally applied to un- derstand and optimize the learning process at course level. The learning process is analyzed through the captured in- teractions between students and instructor, content or tools. However, Learning Analytics are not restricted to act at this level. Adapted techniques, applied to di↵erent sources of information, could be used to understand and optimize learning at the program level, as exemplified by the works of Pechenizkiy et al. [8] and Gonzalo et al. [7]. Due to the interconnection between learning at the course and the program level, Program Analytics are an indispensable com- plement to traditional Learning Analytics in order to have an e↵ective end-to-end learning process. . There are several sources of information that can be used to analyze a program curriculum. The first main categoriza- tion of this information responds to its level of objectivity. Surveys about needs, perceptions and sentiments are a com- mon tool in curricula analysis. These surveys can be directed to students [6], faculty [7], alumni [3] or the labor market [5]. The result of these surveys provide subjective information. On the other hand, curriculum analysis could also employ factual data obtained from the curriculum and its usage. This data can be classified as objective information. The objective information could be further classified in three main groups: • Intrinsic: This is the information that is contained in the curriculum itself. For example, Sekiya et al., used the descriptions provided in the syllabi of several Com- puter Science curricula to compare their compliance to with the Computer Science Curriculum recommenda- tion from ACM [9]. • Extrinsic: This is the information external to the pro- gram that influence its content or structure. For exam- ple, Sugar et al., [10] found required multimedia pro- duction competencies for instructional designers, com- piling information from instructional design job adver- tisements. • Interaction: This is information that is generated when the students interact with the curriculum. The most common interactive information is the course selection and the grades obtained by students. This information is commonly refereed as student academic records. For example, Bendatu and Yahya [1], inspired by the cur- riculum mining idea of Pechenizkiy et al. [8], use stu- dent records to extract information about the course- taking behavior of students. From all this sources of data, this work will concentrate in the curriculum interaction data for three main reasons: First, it is automatically captured and readily available to any running program. Second, contrary to the intrinsic in- formation, academic records are easier to analyze and un- derstand. And finally, the relative uniformity in which this information is represented and stored make it an ideal target for analysis techniques that can be used between programs and institutions. The structure of this paper is as follows: Section two pro- poses an initial list of useful and easy-to-obtain metrics that can be extracted from curriculum interaction data. Section three validates the ideas behind the metrics through it use
Transcript of Simple Metrics for Curricular Analytics - CEUR-WS.orgceur-ws.org/Vol-1590/paper-04.pdf · Simple...

Simple Metrics for Curricular Analytics
Xavier OchoaEscuela Superior Politécnica del Litoral
Vía Perimetral, Km. 30.5Guayaquil, Ecuador
ABSTRACTThe analysis of a program curriculum is traditionally a verysubjective task. Perceptions and anecdotes, faculty pref-erences and content or objectives check-lists are the mainsources of information to undergo the revision of the struc-ture of a program. This works proposes a list of simple met-rics, that can be easily extracted from readily available aca-demic data that contains the information about the actualinteractions of students with the curriculum. These metrics,divided into time- and performance-related, are calculatedat program level. The use of these metrics provides objectiveinformation in which to base discussions about the currentstate and e�ciency of the curriculum. To exemplify thefeasibility and usefulness of the metrics, this work presentssome illustrative analysis that make use of the simple cur-riculum metrics.
CCS Concepts•Applied computing ! Education;
KeywordsLearning Analytics, Curriculum Analytics
1. INTRODUCTIONLearning Analytics has been traditionally applied to un-
derstand and optimize the learning process at course level.The learning process is analyzed through the captured in-teractions between students and instructor, content or tools.However, Learning Analytics are not restricted to act atthis level. Adapted techniques, applied to di↵erent sourcesof information, could be used to understand and optimizelearning at the program level, as exemplified by the worksof Pechenizkiy et al. [8] and Gonzalo et al. [7]. Due tothe interconnection between learning at the course and theprogram level, Program Analytics are an indispensable com-plement to traditional Learning Analytics in order to havean e↵ective end-to-end learning process.
.
There are several sources of information that can be usedto analyze a program curriculum. The first main categoriza-tion of this information responds to its level of objectivity.Surveys about needs, perceptions and sentiments are a com-mon tool in curricula analysis. These surveys can be directedto students [6], faculty [7], alumni [3] or the labor market [5].The result of these surveys provide subjective information.On the other hand, curriculum analysis could also employfactual data obtained from the curriculum and its usage.This data can be classified as objective information.
The objective information could be further classified inthree main groups:
• Intrinsic: This is the information that is contained inthe curriculum itself. For example, Sekiya et al., usedthe descriptions provided in the syllabi of several Com-puter Science curricula to compare their compliance towith the Computer Science Curriculum recommenda-tion from ACM [9].
• Extrinsic: This is the information external to the pro-gram that influence its content or structure. For exam-ple, Sugar et al., [10] found required multimedia pro-duction competencies for instructional designers, com-piling information from instructional design job adver-tisements.
• Interaction: This is information that is generated whenthe students interact with the curriculum. The mostcommon interactive information is the course selectionand the grades obtained by students. This informationis commonly refereed as student academic records. Forexample, Bendatu and Yahya [1], inspired by the cur-riculum mining idea of Pechenizkiy et al. [8], use stu-dent records to extract information about the course-taking behavior of students.
From all this sources of data, this work will concentratein the curriculum interaction data for three main reasons:First, it is automatically captured and readily available toany running program. Second, contrary to the intrinsic in-formation, academic records are easier to analyze and un-derstand. And finally, the relative uniformity in which thisinformation is represented and stored make it an ideal targetfor analysis techniques that can be used between programsand institutions.
The structure of this paper is as follows: Section two pro-poses an initial list of useful and easy-to-obtain metrics thatcan be extracted from curriculum interaction data. Sectionthree validates the ideas behind the metrics through it use
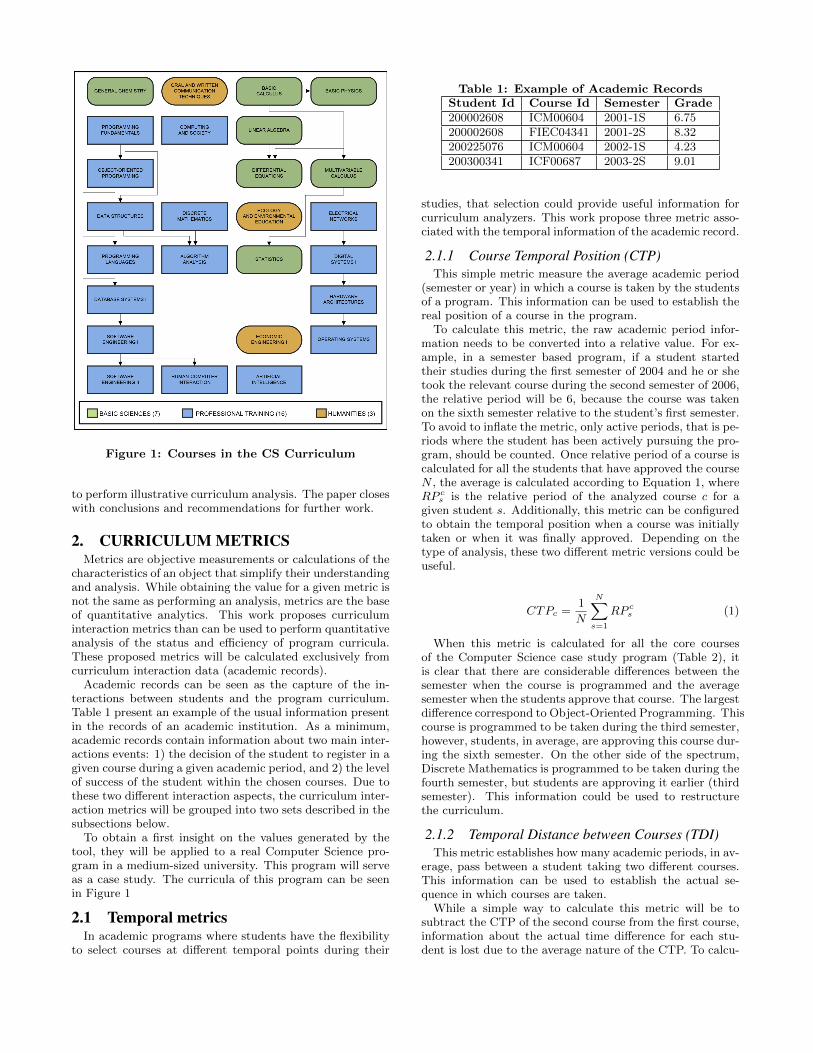
Figure 1: Courses in the CS Curriculum
to perform illustrative curriculum analysis. The paper closeswith conclusions and recommendations for further work.
2. CURRICULUM METRICSMetrics are objective measurements or calculations of the
characteristics of an object that simplify their understandingand analysis. While obtaining the value for a given metric isnot the same as performing an analysis, metrics are the baseof quantitative analytics. This work proposes curriculuminteraction metrics than can be used to perform quantitativeanalysis of the status and e�ciency of program curricula.These proposed metrics will be calculated exclusively fromcurriculum interaction data (academic records).
Academic records can be seen as the capture of the in-teractions between students and the program curriculum.Table 1 present an example of the usual information presentin the records of an academic institution. As a minimum,academic records contain information about two main inter-actions events: 1) the decision of the student to register in agiven course during a given academic period, and 2) the levelof success of the student within the chosen courses. Due tothese two di↵erent interaction aspects, the curriculum inter-action metrics will be grouped into two sets described in thesubsections below.
To obtain a first insight on the values generated by thetool, they will be applied to a real Computer Science pro-gram in a medium-sized university. This program will serveas a case study. The curricula of this program can be seenin Figure 1
2.1 Temporal metricsIn academic programs where students have the flexibility
to select courses at di↵erent temporal points during their
Table 1: Example of Academic Records
Student Id Course Id Semester Grade
200002608 ICM00604 2001-1S 6.75200002608 FIEC04341 2001-2S 8.32200225076 ICM00604 2002-1S 4.23200300341 ICF00687 2003-2S 9.01
studies, that selection could provide useful information forcurriculum analyzers. This work propose three metric asso-ciated with the temporal information of the academic record.
2.1.1 Course Temporal Position (CTP)
This simple metric measure the average academic period(semester or year) in which a course is taken by the studentsof a program. This information can be used to establish thereal position of a course in the program.
To calculate this metric, the raw academic period infor-mation needs to be converted into a relative value. For ex-ample, in a semester based program, if a student startedtheir studies during the first semester of 2004 and he or shetook the relevant course during the second semester of 2006,the relative period will be 6, because the course was takenon the sixth semester relative to the student’s first semester.To avoid to inflate the metric, only active periods, that is pe-riods where the student has been actively pursuing the pro-gram, should be counted. Once relative period of a course iscalculated for all the students that have approved the courseN , the average is calculated according to Equation 1, whereRP c
s is the relative period of the analyzed course c for agiven student s. Additionally, this metric can be configuredto obtain the temporal position when a course was initiallytaken or when it was finally approved. Depending on thetype of analysis, these two di↵erent metric versions could beuseful.
CTPc =1N
NX
s=1
RP cs (1)
When this metric is calculated for all the core coursesof the Computer Science case study program (Table 2), itis clear that there are considerable di↵erences between thesemester when the course is programmed and the averagesemester when the students approve that course. The largestdi↵erence correspond to Object-Oriented Programming. Thiscourse is programmed to be taken during the third semester,however, students, in average, are approving this course dur-ing the sixth semester. On the other side of the spectrum,Discrete Mathematics is programmed to be taken during thefourth semester, but students are approving it earlier (thirdsemester). This information could be used to restructurethe curriculum.
2.1.2 Temporal Distance between Courses (TDI)
This metric establishes how many academic periods, in av-erage, pass between a student taking two di↵erent courses.This information can be used to establish the actual se-quence in which courses are taken.
While a simple way to calculate this metric will be tosubtract the CTP of the second course from the first course,information about the actual time di↵erence for each stu-dent is lost due to the average nature of the CTP. To calcu-

Table 2: Values of planned semester vs. CTP for all the core courses in the CS Program
Course Planned Semester CTP
OBJECT-ORIENTED PROGRAMMING 3 5.768965517HARDWARE ARCHITECTURES 6 8.725OPERATING SYSTEMS 8 10.51557093PROGRAMING LANGUAGES 5 7.457478006DIGITAL SYSTEMS I 5 7.303882195ELECTRICAL NETWORKS 4 6.238329238HUMAN-COMPUTER INTERACTION 8 10.19935691SOFTWARE ENGINEERING II 8 9.97318612SOFTWARE ENGINEERING I 7 8.920821114ALGORITHM ANALYSIS 5 6.903743316DIFERENCIAL EQUATIONS 3 4.868390129DATABASE SYSTEMS I 6 7.845737483ARTIFICIAL INTELLIGENCE 8 9.504983389ORAL AND WRITTEN COMMUNICATION TECHNIQUES 1 2.498585573MULTIVARIATE CALCULUS 2 3.471134021GENERAL CHEMISTRY 1 2.294483294PROGRAMMING FUNDAMENTALS 2 3.252823632DATA STRUCTURES 4 4.946681175STATISTICS 5 5.934782609BASIC CALCULUS 1 1.846450617BASIC PHYSICS 1 1.804273504LINEAR ALGEBRA 2 2.791219512COMPUTING AND SOCIETY 2 2.356042174ECOLOGY AND EVIRONMETAL EDUCATION 4 4.025195482ECONOMIC ENGINEERING I 7 6.876140808DISCRETE MATHEMATICS 4 3.333333333
late TDI (Equation 2), the relative periods of the relevantcourses (c1 and c2) are subtracted for each student. Then,the average is taken.
TDIc1,c2 =1N
NX
s=1
(RP c2s �RP c1
s ) (2)
When applied to the CS case study program, it is nowapparent that courses that should be taken in sequence, areactually taken with 2 or more semesters apart. For example,reviewing course position in Figure 1 and the values in Table2, it is clear that subjects like Di↵erential Equations shouldbe taken immediately after Linear Algebra. In reality, theyare taken, in average, two semesters apart. This informationcould be useful to better guide students in course selection.
2.1.3 Course Duration (CDU)
This metric measures the average number of academic pe-riods that students need to pass a given course. This metricprovides information about the e↵ect that a course has inthe length of the program.
CDU is obtained by subtracting the relative period of thefirst time each student took the course (RPfirstcs) from therelative period when the student finally passed (RPpasscs)it and then averaging these values between all the students(Equation 3). A variation of this metric only considers theperiods where the course was taken. In this case, the metricis identical to the average number of times that studentsneed to repeat the course before passing.
CDUc =1N
NX
s=1
(RPpasscs �RPfirstcs) (3)
When CDU is applied to the CS case study program,the values (Table 3) present some interesting results. Somecourses perceived as di�cult, for example Basic Calculus,takes 2 semesters to be approved. However, other courses,also considered di�cult, for example Software Engineering,are always passed during the first attempt.
2.2 Difficulty metricsEach time a student undertakes a course, performance in-
formation is captured and stored. The way in which this in-formation is represented varies, but usually involved a grad-ing scale. This scales could be categorical (letters, passing/not-passing etc.) or numerical (20 out of 100, 4 out of 5, etc.).The information stored in the student grades can be pro-cessed to produce useful information about the di�culty ofdi↵erent courses in the program. This work summarizessome simple di�culty metrics proposed by previous worksand propose two new profile-base metrics.
2.2.1 Simple Difficulty Metrics
The most basic metrics of the di�culty of a course arethe passing rate (PR), the number of students that haveapproved the course divided by the number of students thathave taking the course, and the average grade (AG), thesum of the grades of all students (converted to a numericalvalue) divided by the number of students. These metrics,however, are not comparable between courses because they

Table 3: CDU values for all the core courses of the CS Program ordered from largest to smallest
Course CDU
BASIC CALCULUS 2.213775179PROGRAMMING FUNDAMENTALS 1.873074101STATISTICS 1.804930332BASIC PHYSICS 1.743679775DIFERENCIAL EQUATIONS 1.730544747ELECTRICAL NETWORKS 1.586794462LINEAR ALGEBRA 1.534738486DATA STRUCTURES 1.439759036GENERAL CHEMISTRY 1.438584316MULTIVARIATE CALCULUS 1.426287744PROGRAMING LANGUAGES 1.415881561OBJECT-ORIENTED PROGRAMMING 1.285101822DISCRETE MATHEMATICS 1.268479184DIGITAL SYSTEMS I 1.263420724DATABASE SYSTEMS I 1.247706422ARTIFICIAL INTELLIGENCE 1.236245955ALGORITHM ANALYSIS 1.230769231COMPUTING AND SOCIETY 1.207446809OPERATING SYSTEMS 1.205042017ECOLOGY AND EVIRONMETAL EDUCATION 1.149152542ORAL AND WRITTEN COMMUNICATION TECHNIQUES 1.097040606ECONOMIC ENGINEERING I 1.093867334HUMAN-COMPUTER INTERACTION 1.05229794HARDWARE ARCHITECTURES 1.037356322SOFTWARE ENGINEERING II 1.026479751SOFTWARE ENGINEERING I 1.017492711
depend on the group of students that taken the course. Acourse with relatively good students will have a better PRand AG than a course when only regular or bad students.
Calulkins et al. [2] proposed more robust di�culty met-rics. Two metrics, Grading Stringency, also called � (Equa-tion 4) and Multiplicative Magnitude, also called ↵ (Equa-tion 5) eliminate the bias introduced by the group of stu-dents taking the course by subtracting from the GPA of eachstudent (GPAs) the grade that he or she obtained in thecourse (rsc) and averaging those values over all the students(N). However, the calculation of � and ↵ metrics assumea normal distribution of grades that is usually not the realcase.
�c =1Nc
NcX
s=1
(GPAs � rsc) (4)
↵c =
PNcs=1 GPAs
2
PNcs=1(rsc ⇤GPAs)
(5)
These metrics were applied to the CS case study and werereported in a previous work [7].
2.2.2 Profile-Based Metrics
Simple Di�culty metrics (PR, AG, � and ↵) reduce thedi�culty of a course to a single number. However, as demon-strated by Mendez et al. [7], course di�culty is di↵erent fordi↵erent types of students. To account for this di↵erence,this work proposes a set of profile-based di�culty metrics.
The basic idea behind profile-based metrics is to dividethe population of students in di↵erent groups according to
their performance (usually their GPA). For example, in aprogram with grades between 0 and 10 and a passing gradeof 6, students could be grouped in with following schema:students with [GPA higher than 8.5], [GPA of 7.5 to 8.5],[GPA of 6.5 to 7.5], [GPA of 5.5 to 6.5] and [GPA lowerthan 5.5]. Then the relevant metric for a course is calculatedseparately for each group using only information from theperformance of its members.
The use of profile for the di�culty metrics reduce the biasof the PR and AG as it is calculated only for similar studentsin di↵erent courses. Also, the profile-based metrics preservethe basic grade distribution shape for � and ↵.
The proposed profile-based di�culty metrics are:
• Course Approval Profile (CAP): This is the profile-based version of the Passing Rate (PR) metric. Foreach student group, the number of students on thatprofile that have passed the course in a give period isdivided by the number of students in the group thathave taken the course in the same period.
• Course Performance Profile (CPP): This is the profile-based version of the Average Grade (AG) metric. Foreach group of students that have taken the course, theAG is calculated.
• Course Di�culty Profile (CDP): This is the profile-based versions of the metrics proposed by Calulkinset al. It can be Additive (CDP-�) or Multiplicative(CDP-↵), depending on the di�culty metric used foreach group.

The result of the profile-based di�culty metrics is a vec-tor. This representation enables the use of more sophisti-cated data mining techniques to compare and group coursesaccording to their di�culty.
All the di�culty metrics could also be calculated for eachCourse-Instructor pair to provide a better di�culty estima-tion given that the characteristics and grade stringency ofeach instructor could bias the metric result if averaged overall instructors.
When applied to the CS case study, the profiled metricsare able to highlight di↵erent patterns among courses. Forexample, in Figure 2, courses perceived as easy, such as Oraland Written Communication have a very similar Profile Ap-proval Rate for all but lowest performing students. On theother hand, di�cult courses, such as Di↵erential Equationsand Programming Fundamentals, have a very steep decreasein Approval Rate for di↵erent type of students. Another ex-ample can be sen in Figure 3, where the Profiled Di�cultyis represented. For courses perceived as easy, such as Eco-nomic Engineering, improve the GPA of all but the lowestperforming students. Di�cult courses, however, negativelya↵ect the GPA of all students in a degree related to theiractual GPA, as is the case for Programming Fundamentals.
3. CURRICULUM ANALYSISThe main purpose of calculating a set of well understood
metrics over the di↵erent courses of a program curriculumis able to easily find answers through more complex analysisbased on a combination of the metrics’ results. This sectionprovides five illustrative examples of these analysis usingonly the temporal and di�culty metrics presented before.
3.1 Course ConcurrencyOne of the main tasks in curriculum analysis is to deter-
mine the workload that a student will receive over a givenacademic period. It is a usual practice that instructors fromconcurrent courses, that is, courses that are taken togetherin a period, interchange information about their course load(homework, projects, etc.) to avoid to overload the studentsover specific times during the period, for example near theexams). However, it is not always easy to determine whichcourses are actually concurrent, specially if the program ifflexible.
This analysis can be performed mainly in two ways. With-out previously calculated metrics, the recommended tech-nique is to use a frequent itemset mining technique, such asFP-Growth [4]. This technique discover courses commonlytaken together more than a given percentage of times (sup-port). However, it is not easy for instructors to determinethe right value of the support and the crisp sets that thisalgorithm return hide information about less frequent butalso occurring course concurrences.
In the second method, the determination of concurrencybetween courses can be easily obtained from the CourseTemporal Position (CTP) metric. For example, in a semester-based program, all courses with at CTP between 1 and 1.5could be considered to be part of the first semester, whileall the courses with a CTP between 1.5 and 2.5 could beconsidered to be in the second semester. Moreover, overlap-ping sets could be used to assure that less frequent, but alsorelevant concurrences are taken into account in the periodworkload discussions.
3.2 Neglected CoursesIt is common to find curricula with small sequences of
related courses. When those sequences are designed, it isexpected that students follow the courses one after anotherin consecutive periods. This is specially important for dif-ficult courses such as Calculus or Physics where conceptslearned in a previous course are necessary to master theconcepts of the next one. However, students, specially inflexible programs, could neglect taking some courses dueto di↵erent factors (di�culty, personal preferences, reducedavailable time, etc.) If too much time pass between courses,some of the previously learned concepts could be forgottenby the time the next course requires them, generating lowerthan expected performance.
To find if there are courses that are consistently neglectedby students, the Temporal Distance between Courses (TDI)can be used. TDI is applied to each pair of consecutivecourses in the analyzed sequence. If a pair of expectedconsecutive courses have a TDI value higher than a thresh-old (for example 1.5) the second course could be consid-ered neglected and actions should be taken to encourage thestudents to take them as originally planned (for example,adding the second course as a prerequisite to a course withTDI between 2 and 2.5 from the first course).
3.3 Bottlenecks IdentificationDue to economic constraints, the time that a student takes
in completing the program has been of great interest for aca-demic institutions. However, it is not always clear whichcourses are the bottlenecks that reduce the overall through-put of the program.
One way to identify the o↵ending courses is to convert thecurriculum into a graph. Each course will be a node in thisgraph. A edge will connect each pair of courses. The weightof each edge will be equal to the TDI between the courses itconnects. All the edges with weights lower than 1 and higherthan 2 are removed to leave only courses taken in sequence.Then the course with lowest CTP is selected as the initialnode and the critical path is found in the graph. The criticalpath determines the longest sequential path from the initialcourse. For each of the nodes in the critical path, the courseduration (CDU) is calculated. Those courses in the criticalpath with the higher CDU could be flagged as bottlenecksbecause they are likely to increase the number of periodsthat a student has to stay in the program.
3.4 Section PlanningPhysical or regulatory limitations often determine the max-
imum numbers of students in a given class. When there aremore students than places in a class, it is common prac-tice to create additional sections of the course taught eitherby the same or a di↵erent instructor. Planning the numberof sections needed for the next period, before the end of thecurrent period is sometimes a challenge and usually providesunreliable results. This leads to wasting of resources (for ex-ample, two half-full sections) or under-served students (forexample, students that can not follow the course during theperiod due to full sections).
The average passing rate it the usual way in which theforecast about the number of students that will be availableto take the next courses is calculated. However, given thateach period the composition of students varies, the pass-ing rate does not remain constant, leading to inaccurate re-

Figure 2: Profiled Approval Rate for di↵erent courses in the CS program
sults. The use of the profile-base approval metric (CAP)could provide a better way to forecast the actual numberof students that will pass the course because it takes intoaccount the di↵erent performance of the students taking thecourse. These CAP could be refined by using a combinationof Course-Instructor to also take into account the gradingstringency of the instructor.
3.5 Course SimilarityOne of the main curricular decisions that students make
is the selection of the course load for each period. The num-ber and di�culty of the courses has a been found to havedirect impact on the performance of the students [7]. Thisdecision is so important that it is common for academic in-stitutions to provide course-selection counseling for studentsthat seems to be struggling with their workload. The coun-seling session, however, only transfer the burden of courseselection to instructors or professors that do not necessarilyhave a current picture of the di�culty and load of all thecourses in the program. The decision is taken with a betterbackground knowledge, but still perceptions and beliefs arethe main sources of information.
The vector nature of the profile-based di�culty metricscould be exploited to apply straight-forward clustering tech-niques to group the courses according to their type of di�-culty. These groupings could provide an easier way to char-acterize courses. For example, courses with the same pass-ing rate AG, could be grouped separately according to theirDi�culty profile (CDP). Di�cult courses, with a linearlydecreasing negative � for students with lower GPAs, will beclustered together. The same will happen to easy coursesthat have a constant � value among the groups. Courseswith other distributions (for example, very easy for goodperformers, but hard for bad performers) will also be clus-
tered with similar courses. Presenting this information forall courses in the program could help instructors to associatethe di�culty of known courses to new or unknown courses.This potentially could lead to a better recommendation tothe student.
4. CONCLUSIONS AND FURTHER WORKDi↵erently from data produced at course-level, program-
level data tend to be more homogeneous between programsand institutions. This similarity could lead to the develop-ment of a sub-field of Learning Analytics with a common setof metrics and methodologies for Program Curriculum anal-ysis that could be called Curricular Analytics. This work isone of the first steps towards the creating this sub-field.
Even simple metrics, when well defined and transferablebetween programs, have the capacity to improve the way inwhich curricula are analyzed and improved. The list of met-rics presented in this work is by no means comprehensive,but provides a starting point from which more advanced andinformative metrics could be created.
The presented illustrative analysis served as an initial val-idation of the feasibility and usefulness of the metrics. How-ever, a series of evaluation studies with real data from exist-ing programs is needed before these metrics could be safelyused by practitioners to draw conclusions from their pro-grams. The operational complexity of these studies is verylow given that only the raw data and simple computationaltools (for example a spreadsheet) are needed to obtain themetrics. On the other hand, measuring the informationalvalue of the metrics to solve real-world questions requires amore complex quantitative and qualitative analysis.
The relative homogeneity of the data could also lead to thecreation of Curricular Analytics tools or plugins that could
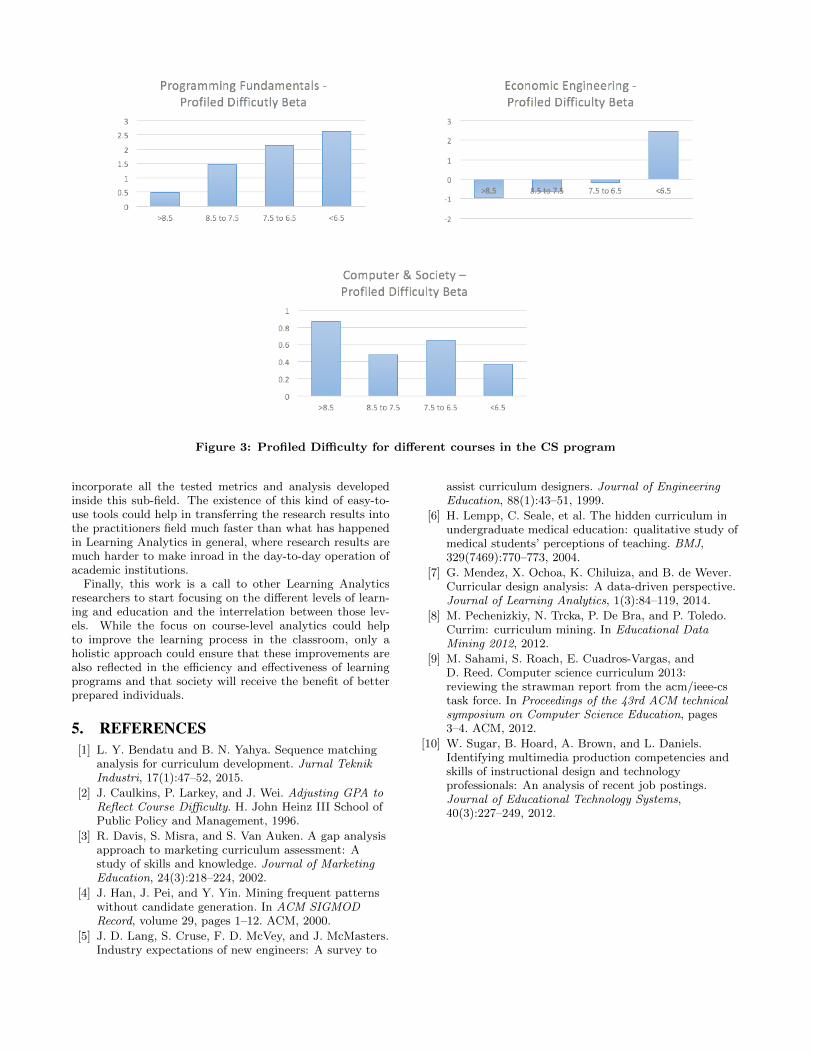
Figure 3: Profiled Di�culty for di↵erent courses in the CS program
incorporate all the tested metrics and analysis developedinside this sub-field. The existence of this kind of easy-to-use tools could help in transferring the research results intothe practitioners field much faster than what has happenedin Learning Analytics in general, where research results aremuch harder to make inroad in the day-to-day operation ofacademic institutions.
Finally, this work is a call to other Learning Analyticsresearchers to start focusing on the di↵erent levels of learn-ing and education and the interrelation between those lev-els. While the focus on course-level analytics could helpto improve the learning process in the classroom, only aholistic approach could ensure that these improvements arealso reflected in the e�ciency and e↵ectiveness of learningprograms and that society will receive the benefit of betterprepared individuals.
5. REFERENCES[1] L. Y. Bendatu and B. N. Yahya. Sequence matching
analysis for curriculum development. Jurnal TeknikIndustri, 17(1):47–52, 2015.
[2] J. Caulkins, P. Larkey, and J. Wei. Adjusting GPA toReflect Course Di�culty. H. John Heinz III School ofPublic Policy and Management, 1996.
[3] R. Davis, S. Misra, and S. Van Auken. A gap analysisapproach to marketing curriculum assessment: Astudy of skills and knowledge. Journal of MarketingEducation, 24(3):218–224, 2002.
[4] J. Han, J. Pei, and Y. Yin. Mining frequent patternswithout candidate generation. In ACM SIGMODRecord, volume 29, pages 1–12. ACM, 2000.
[5] J. D. Lang, S. Cruse, F. D. McVey, and J. McMasters.Industry expectations of new engineers: A survey to
assist curriculum designers. Journal of EngineeringEducation, 88(1):43–51, 1999.
[6] H. Lempp, C. Seale, et al. The hidden curriculum inundergraduate medical education: qualitative study ofmedical students’ perceptions of teaching. BMJ,329(7469):770–773, 2004.
[7] G. Mendez, X. Ochoa, K. Chiluiza, and B. de Wever.Curricular design analysis: A data-driven perspective.Journal of Learning Analytics, 1(3):84–119, 2014.
[8] M. Pechenizkiy, N. Trcka, P. De Bra, and P. Toledo.Currim: curriculum mining. In Educational DataMining 2012, 2012.
[9] M. Sahami, S. Roach, E. Cuadros-Vargas, andD. Reed. Computer science curriculum 2013:reviewing the strawman report from the acm/ieee-cstask force. In Proceedings of the 43rd ACM technicalsymposium on Computer Science Education, pages3–4. ACM, 2012.
[10] W. Sugar, B. Hoard, A. Brown, and L. Daniels.Identifying multimedia production competencies andskills of instructional design and technologyprofessionals: An analysis of recent job postings.Journal of Educational Technology Systems,40(3):227–249, 2012.