Simon Townsend - territorystories.nt.gov.au · a ,,,ere collected at approximately monthly...
32
Technical Report WRD94064 Viewed at 20:02:30 on 17/02/2010 Page 1 of 32. • Simon Townsend Chemical Stratification in Darwin River Reservoir Report 64/94 Water Quality Research and Evaluation Branch Water Resources Division DARWIN
Transcript of Simon Townsend - territorystories.nt.gov.au · a ,,,ere collected at approximately monthly...
Technical Report WRD94064
Viewed at 20:02:30 on 17/02/2010 Page 1 of 32.
•
Simon Townsend
Chemical Stratification in Darwin River Reservoir
Report 64/94
Water Quality Research and Evaluation Branch Water Resources Division DARWIN
Technical Report WRD94064
Viewed at 20:02:30 on 17/02/2010 Page 2 of 32.
•
This report was presented at an international conference on tropical limnology held in Indonesia, July 1994. The paper will be included in the conference proceedings in a special edition of the journal Hydrobiologia.
This report shall not be copied without the permission of the author. Anyone quoting inforwation or data from this report and using that infoLHlation or data in any other document shall make proper written acknowledgement .
Technical Report WRD94064
Viewed at 20:02:30 on 17/02/2010 Page 3 of 32.
.n.bstract
Oxygen depletion during stratification, which is
characteristic of eutrophic lakes in temperate regions, is
shown to occur in an oligotrophic, tropical reservoir. Deep
water deoX"ygenation in Darwin River Reservoir, Austral ia,
was highly responsive to thermal stratification. Rapid
oAy-gen depletion rates (maximlliLl 12.2 mg 1-1 month-I) and
long periods of anoxia (maximurn 20 1,o1eeks) 'iN"ere recorded in
the hypolirnnion and metalimrlion. DeoX"'ygenation vias
attributed primarily to the reservoir's elevated
temperatures (-25-30 'C) and its effect on microbial
metabolism. ~lorphometric influences ',-.rere considered
secondary. Periods of enoxia occu!'"red during the dt:.:~-\.;et
season transition end after wet season holomixis .. ilnoxia
calls'ed orl accurnulat lOr! ot iron, ma.nganese and arp!nonia In the
... ~, , me .... al.l.rru'l~on . P' -nospnorus release C~orn ~h'" sec'; men t c ho' --"e Y !..;... :t L. ~ ...... : ~~ ..... ·.·i~'/ _
was not detected due to its relatively 10''''; concentration end
immobilization. T'he efEect of terr.perature or. hypolimnetic
dissolved oX"y'gen depletion rates in lakes is rr.ore
significant than either morphometry or productivit.y.
2
Technical Report WRD94064
Viewed at 20:02:30 on 17/02/2010 Page 4 of 32.
3
1. Introduction
'The hypolimnion of warm, tropical lakes is more susceptible
than that of temperate lakes to anoxia and pronounced
chemical stratification. This is due to the reduced
solubi 1 i ty of OA,},gen at higher temperatures coupled wi th
increased microbial metabolism. This paper describes
chemical stratification in Dar"vin River Reservoir {DRR} I a
tr"opical ;"-later body of low trophic status. Data collected
over a six year period sho\\' the effects of year to year
climatic variation on various stratification characteristics
including oxygen depletion rates. The reservoir, despite
its 10'''; trophic status, exhibits marked chemical
stratification with long periods - . or aDOXl.a.
2. Study site and methods
DP~~ (12' 54' S, 131· 00' E) is located 50 ~~ inland from the
coastal city of Dar.'lin. ~.t full capacity the ~;late!:' body has
a mean depth of 6~5 fit maxim~~ depth of 20 m and storage
Volu.lne of 260 x 10 6 m]. It is broad and shallm'/, with
c.pprox.::..mately 90% of the total reser~,,"'oir volume contained in
the upper 10 ID. The dfuTl'S catchment is dominated by eucalypt
Technical Report WRD94064
Viewed at 20:02:30 on 17/02/2010 Page 5 of 32.
4
woodland, and managed by a "closed catchment policy" which
excludes almost all human activity.
The regions climate comprises of two seasons, the 'wet' and
the 'dry' > Cool, dry, south-easterly trade winds, of
continental origin, are the dominate feature of dr.t> season
weather {May - Oct}. In contrast, the wet season
(Nov - lmril) is characterised by ViaL"', moist winds, of
maritime origin. Monsoonal bursts end depressions produce
sustained rainfall lasting several days during the f7-.'iet!.
~Jater colu..rn.:.'"1 temperat.ure l dissolved oxy"gen,. conductivity end
pH were measured at one metre intervals a.t the deepest site
by a Nartek Nk XV or Hydrolab Surveyor 2 rnultiparameter
probe between ,.Julj/ 1985 and Jur~e 1991 .. "A. total of 237
profiles were measured, beti,<leen 09:30 and 10:30 hours , at
weekly or fortnightly intervals over most oE the study
period. The probes were calibrated prior to each field
according to the manufacturers direc:.ions. Rair;fall data for
Dar-ylin Jl.~irport was provided by the Aestralian Bureau of
Heteorology>
Water samples for analyses of total iron , total manganese,
total phosphorus, arr~onia, nitrate, nitrite and chlorophyll
a ,,,ere collected at approximately monthly intervals at
depths of 0, 41 St 12, 14, and 16 m~ In the last year of the
study/ Sful1pleS itlere taken for the analysis of
Technical Report WRD94064
Viewed at 20:02:30 on 17/02/2010 Page 6 of 32.
5
nutrients and chlorophyll a. Once a year, samples were
collected from the surface and from 14 m depth for total
alkalinity analysis. For most of the study period, total
iron and manganese ",,,-ere analysed on unfiltered samples.
During the last three months, though, these metals were
determined by the SQm of their respective filterable and
residual components. The analytical methods used are
surrmarized in Table 1. k~~nia, nitrite and nitrate
concentrations are expressed as elemental nitrogen.
HypolillL'1ion and metalimnion mean oxygen concentrations and
depletior~ rates are volume weighted end aSSLLrne cn epililnnion
Isopleth data for iron, w~nganese and a~~onia
concentrations are presented only for periods of detailed
data collection.
In June 1993, SCUBA divers collected three samples £rc~,,(l a
flocculent layer above the sediment {"'vater depth lS m} .
These sa."'TIples were oven dried at 105 ·C and analysed for
loss on ignition, kjeld.:.'1al nitrogen and total phosphorus by
the met~ods listed in Table 1. Total al~uiniurr~1 calcilli~;
iron and manganese concentrations in the sediment h,"ere
detelmined by inductively coupled spectrometry after
digestion with e~~al portions of concentrated nitric and
hydrochloric acids. A particle size analysis was performed
on one sediment saInple by sieving and suspension {Loveday
1974) for the following particle size fractions; clay
Technical Report WRD94064
Viewed at 20:02:30 on 17/02/2010 Page 7 of 32.
6
«2 ~~), silt (2-20 pm), fine sand (20-200 ~~), coarse sand
(200-2000 ~~) and gravel (>2000 pm).
3. Results
3.1 Seasonal stratification and mixing.
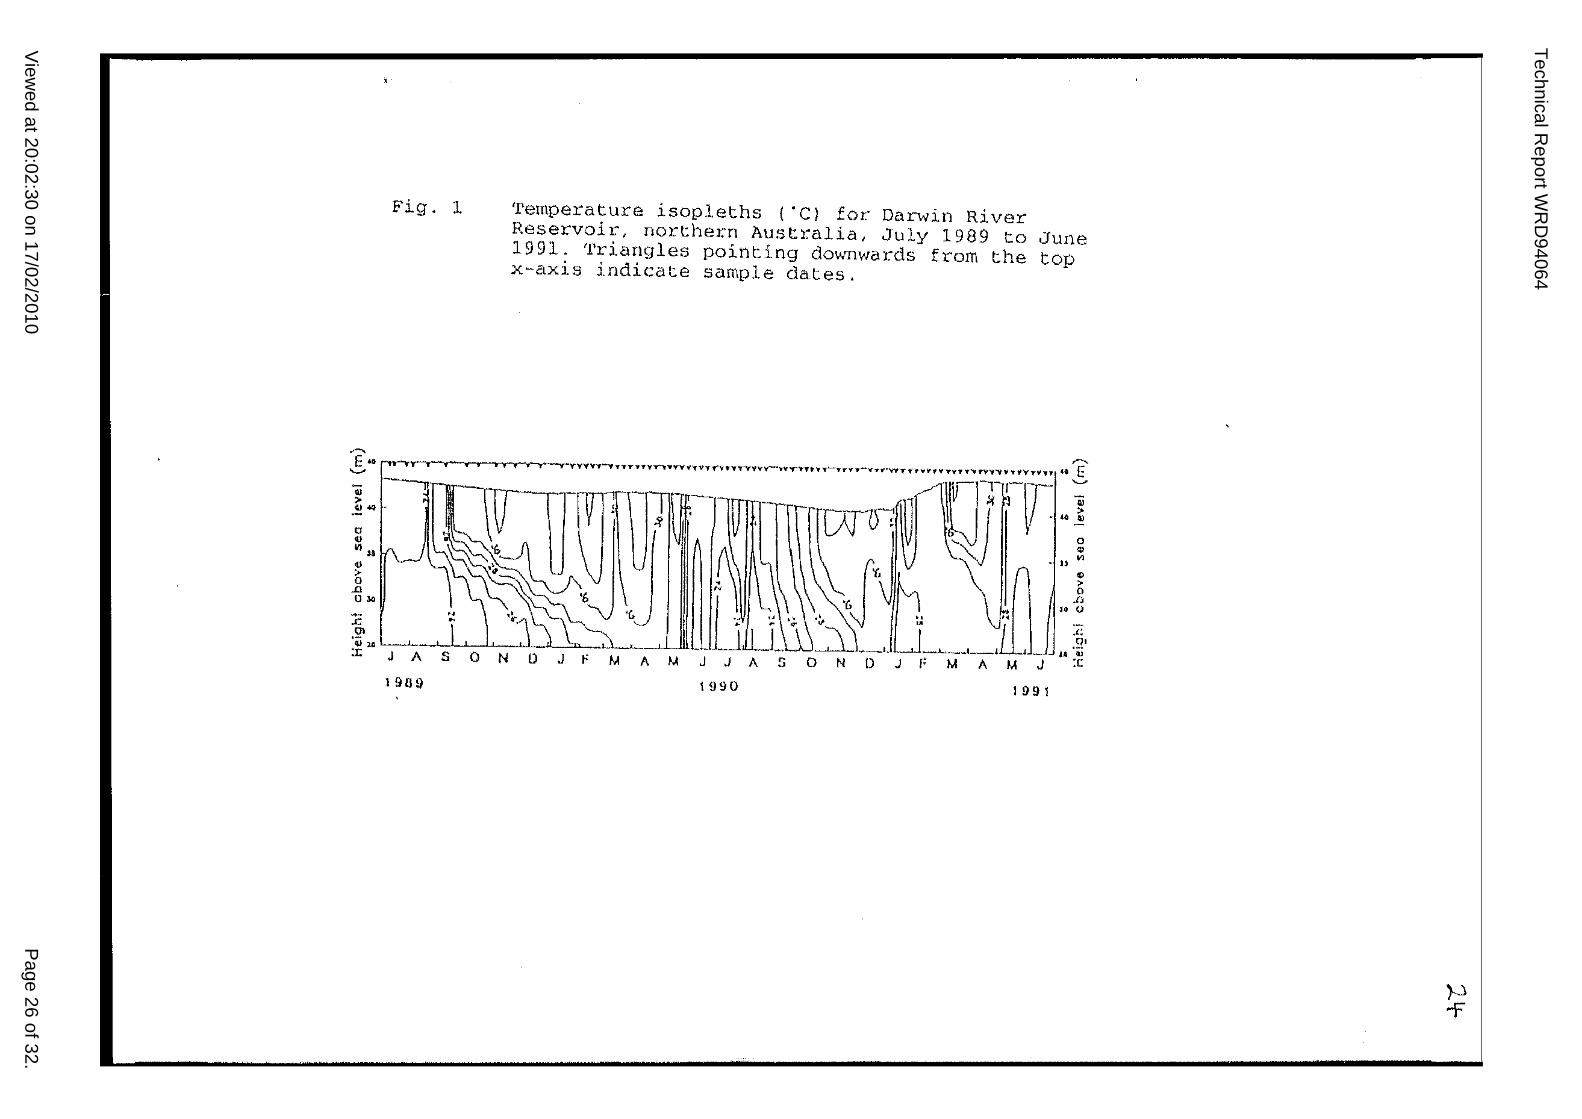
Figure 1 shm..;s isothe!."ls for a two year peri.od I-Ihich
featured characteristic d0/ season stratification and mixing
but contras ting ,yet season thermal behaviour. The
wet seasons had total rainfalls ot 1180
and 2220 rmn, respectively. This is reflected in the
diffe~ent wcter level changes of the reservoir in Ja~ucry
and Feb!.'"uar.x".
Heat loss and strong south-easterly trade winds completely
mixed the reservo~r I for up to three weeks J each dr:! season
(Hay - August). During periods of rela;:ive calm, however,
the ~,.,ater body stratified with a maximuIn vertical
temperature range of 1-2 ·C~ MinimlUTI reservoir temperacu!."es
usually occurred in July~
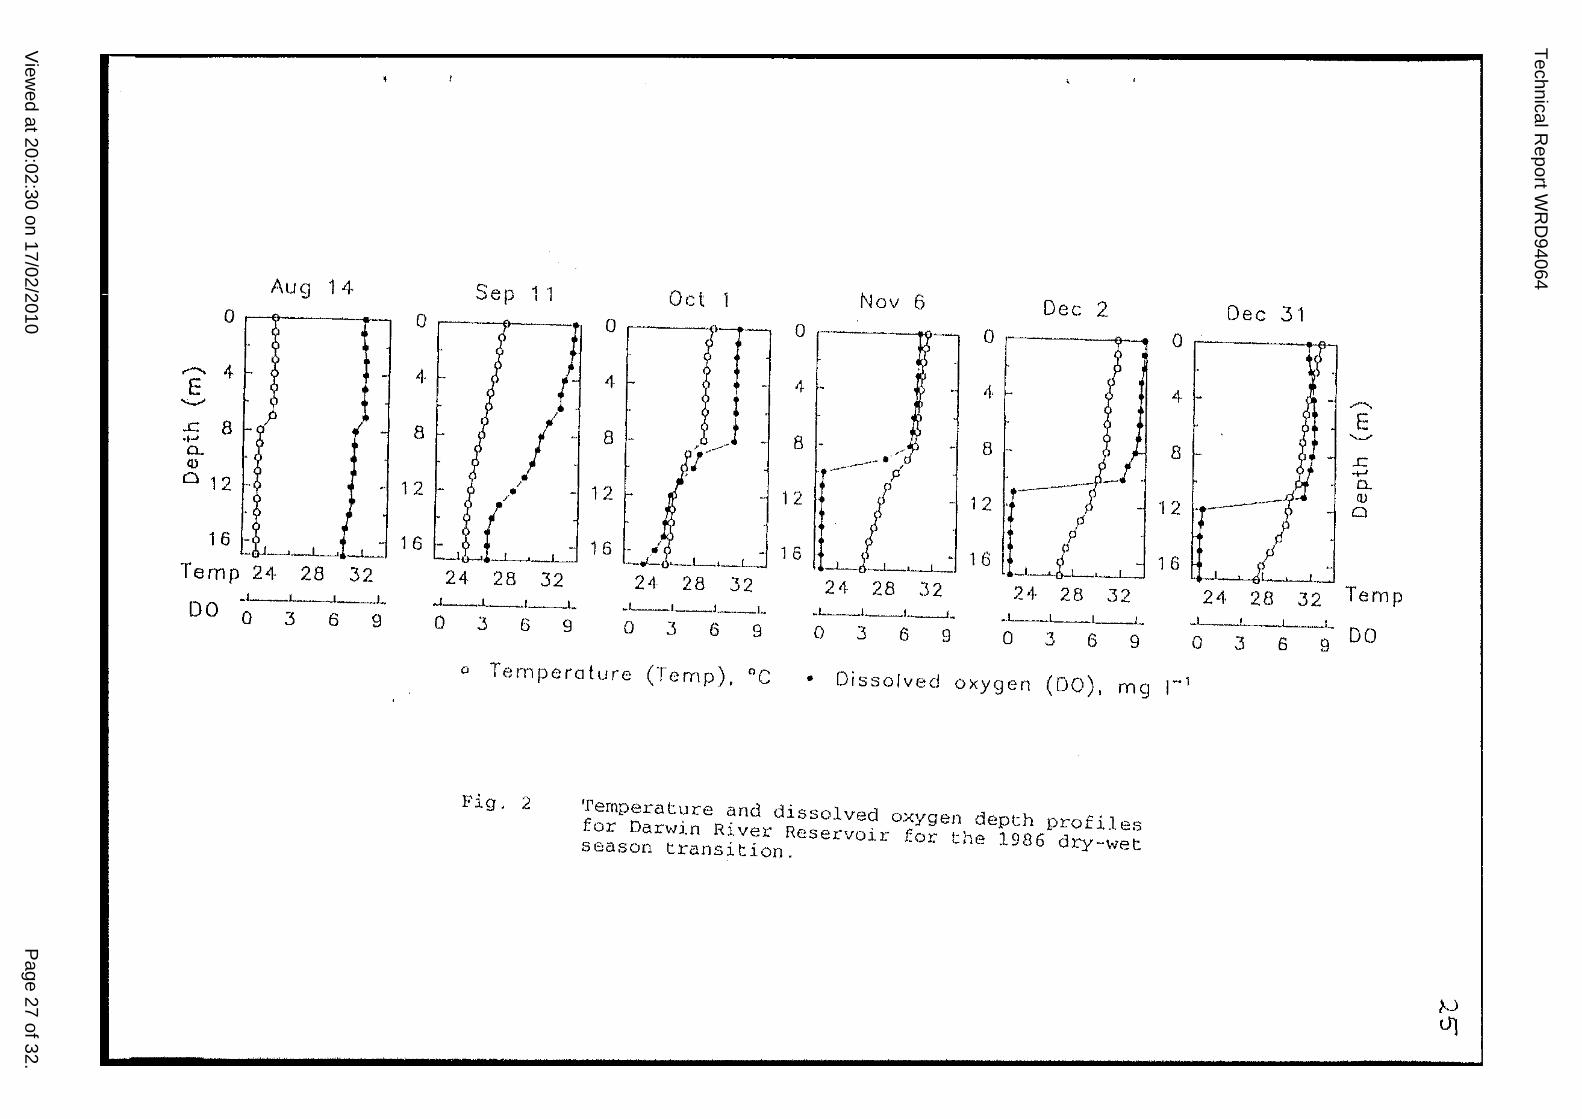
Prolonged stratification, lasting several months, develoged
ae the beginning of the dr~-wet transition iAug, Sep).
Initially the reservoir stratified with a classical
layered theLllal structure {ego Aug 14 1986, Fig 21. The
Technical Report WRD94064
Viewed at 20:02:30 on 17/02/2010 Page 8 of 32.
7
hypolimnion, however, ItlaS progressively eroded by the
metalirrUlion. rrne interface between the tViO layers was
marked by an change in the temperature gradient which
deepened during the dry-wet transition period (Fig. 2) and
ot.her periods of stratification. Most of the reservoir's
V01U!l1e (-90%) during stratification ItlaS contained within the
epili~,ion, which extended to 10-12 m depth.
Monsoonal weather caused t.he resec,,'oir to cool and
completely mix, usually for 2-3 days. This occurred every'
'",let season excluding the 1989/90 'wet I v/hen monsoonal
weather was brief and had little impact on the reservoir's
thermal structure I}. When weather conditions cieared l
the reservoir restratified. NaximtlJt1 ' .... ater temperat.ures ;,,-le:r:e
recorded towards the end of the wet season, generally in
March. The reser~.,.·oir then cooled over the wet-dry transition
(April} Hay} and either gradually destrac.ified or
eAyerienced alternating periods of deep vertical sixing and
stratification. A more detailed account of the reservoir' 5
~, 1 ,-Derma reglme is published elSEwhere (Tc'\'VTlsend et al.
1994 j •
3 ~ 2 Stratification of dissol vee oxygen
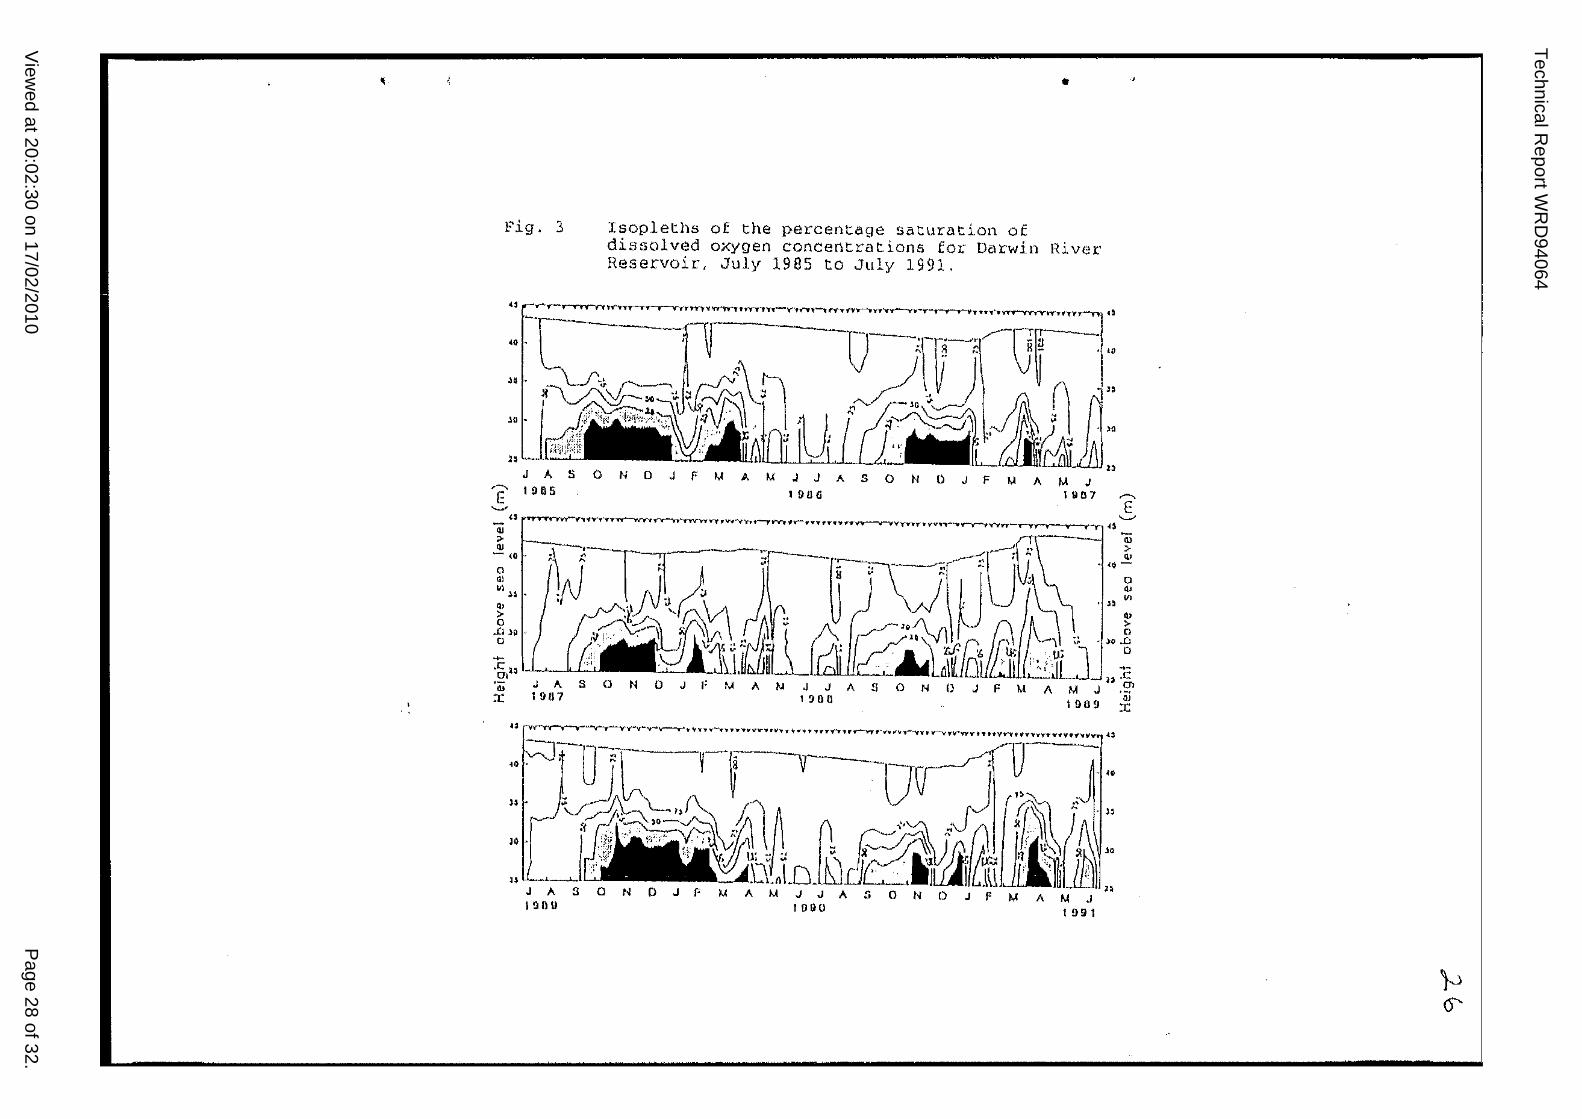
The pattern of the.:..lllal stratificat.ion \-laS reflected in the
distribution of dissol":led orygen (Fig. 3). The longest
period of stratification of dissolved oX""ygen occurred OVer
Technical Report WRD94064
Viewed at 20:02:30 on 17/02/2010 Page 9 of 32.
the dry-wet transition (Aug/Sep - Dec/Jan). Between the
cornmencement of stratification and onset of anoxia, average
oX'.Igen depletion rates were 2.4 - 4.6 mg 1-1 month- 1 (mean
3.3 mg 1- 1 month-I); the maximum rate was
8~7 mg 1-1 month~l. At the epili~nion-metalimnion interface,
a pronounced oX'.Icline often developed coincident with a
small temperature discoI'.tinui ty (<1 . C m- I ; Fig. 2).
Hetallmrlion-hypolimrlion aI'.oxia over the drl'-wet trar,sition
lasting 5-20 weeks and usually
commencing in October. The earlier Grlset of therrnal
stratification, in August 1985, favoured a long period of
strat i f icet ion of dissolved o;.,.ygen (Fig. 3). On the other
hand, the timing and extent of monsoonal "t.'leather det.el~dined
\'let season holomixis and the end of this . • r perJ..oa 01.
stratification. This occurred in Dece:rrber or Januari each
Viet season except during the 1989/90 Iwet t when the
reservoir remained stratiEied until the transition oet\';€en
the wet and dry seasons in April.
Depletion rates of dissolved oxygen during the dr./-wet
transition were affected by variation.s in the rese:!':'loir's
vollli-ne. ~vater level fluctuations of 3.4 m caused the
metaLLmnion voltune to vary between 2.5 x 10 6 m3 and
1 - 106 3 ~h . ~h . l' . 1 x ill I ~ ouan ~~e epl~lmn~on to
rnetalimnion-hypolimnion ratio (- 10) remained constar:.t.
Depletion rates were inversely related to
8
Technical Report WRD94064
Viewed at 20:02:30 on 17/02/2010 Page 10 of 32.
9
metalimnetic-h}~oli~~€tic volume. A Spearman rank
correlation test of mean oX'.fgen depletion rate and
metali~~ion volume for each year explained 36% of the total
variance (P<O.05).
Ttlhen the.:...dtal stratification first developed in the early
dry-wet transition, dissol\red OA.:t'gen concentrations were
. , -1 . between 5.8 and 8.3 mg.l. A lugh initial oxygen
concentration would be expected to delay the development of
metali~~etic-hypoli~,etic anoxia because of the greater
amount of oxygen available. There was no significant
Spearman rank correlation (P>O.05) however between the
initial dissolved ox-y-;en concentration and time for
metal irrt'1ion-hypol imnion anoxia to develop. Other factors,
such as inter-annual differences in the degree of theLdlal
stratification, probably overvihell7l the influence of initial
OAygen concentrations.
.
Deep vertical mixing following a period of stratification
produced an OA.fgen sag through the water COllliUD (Fig. 3) due
to the ox~gen demand of the former metaliu~etic and
hy-polimnetic waters and dilution of the former o:.-...ygenc.ted
waters. This was most pronounced during ','~'et season holomixis
;',fhen surface oxygen concentrations decreased by as much as
- 1 1 - i ...::::. mg _ -, returning to pre-holomixis concentrations Vlithin
1-2 weeks.
Technical Report WRD94064
Viewed at 20:02:30 on 17/02/2010 Page 11 of 32.
10
I'[nen the reservoir restrati f ied after wet season holomixis,
metallmnetic and hypolinmetic oxygen was quickly depleted,
often at rates higher (maximum 12.2 mg 1-1 month-I) than
those recorded over the dry-'ttet transition. p.~"lOxia, lasting
2-6 weeks, was reached during most wet seasons .. Longe~'
periods o-f: anoxia were prevented by deep vertical mixing and
Cl~c>ct-'r-ltl' f'f'ac' l'on o"er ~he W"'~ dry ..... r--.-:::it-ion '-' .... '-..-~(:.J, J......,. v L~ ~l.,..-,j.., '-_c:.!! .... _~_ •
Dr,i season holomixis produced water colunL,,! oxygen
concentrations of 80-100% saturation. wnen the south-east
trade winds eased however, thermal stratification developed
accompanied by hypolimnion oX"".:(gen depletion at rates similcr
to other periods of stratification. In July 1989 and 100 0 --'-' ,
for eXfu'11ple I oxygen concent rat ions Hi thin the hypol irnnion
decreased by 2.4 mg I _1
_ - over a one week period. Dry season
strati. f ication of dissolved OKy'gen pers isced for c maXlffiUIn
of 2-3 weeks, too brief a period to allow anoxia to develop.
3.3 Cherrdcal stratification.
Nitrate and nitrite were present in ~le;::-:! lO'd concentrations
in DK"' .. Nitrate concentrations were <0.001 - 0.002 mg 1-1 In
98% of sarr~les, whilst nitrite was not detected
«0.001 ma 1-1 ) in any samples. Nitrate would not therefore
haVe been a significant terminal electron acceptor in
microbial metabolism.
Technical Report WRD94064
Viewed at 20:02:30 on 17/02/2010 Page 12 of 32.
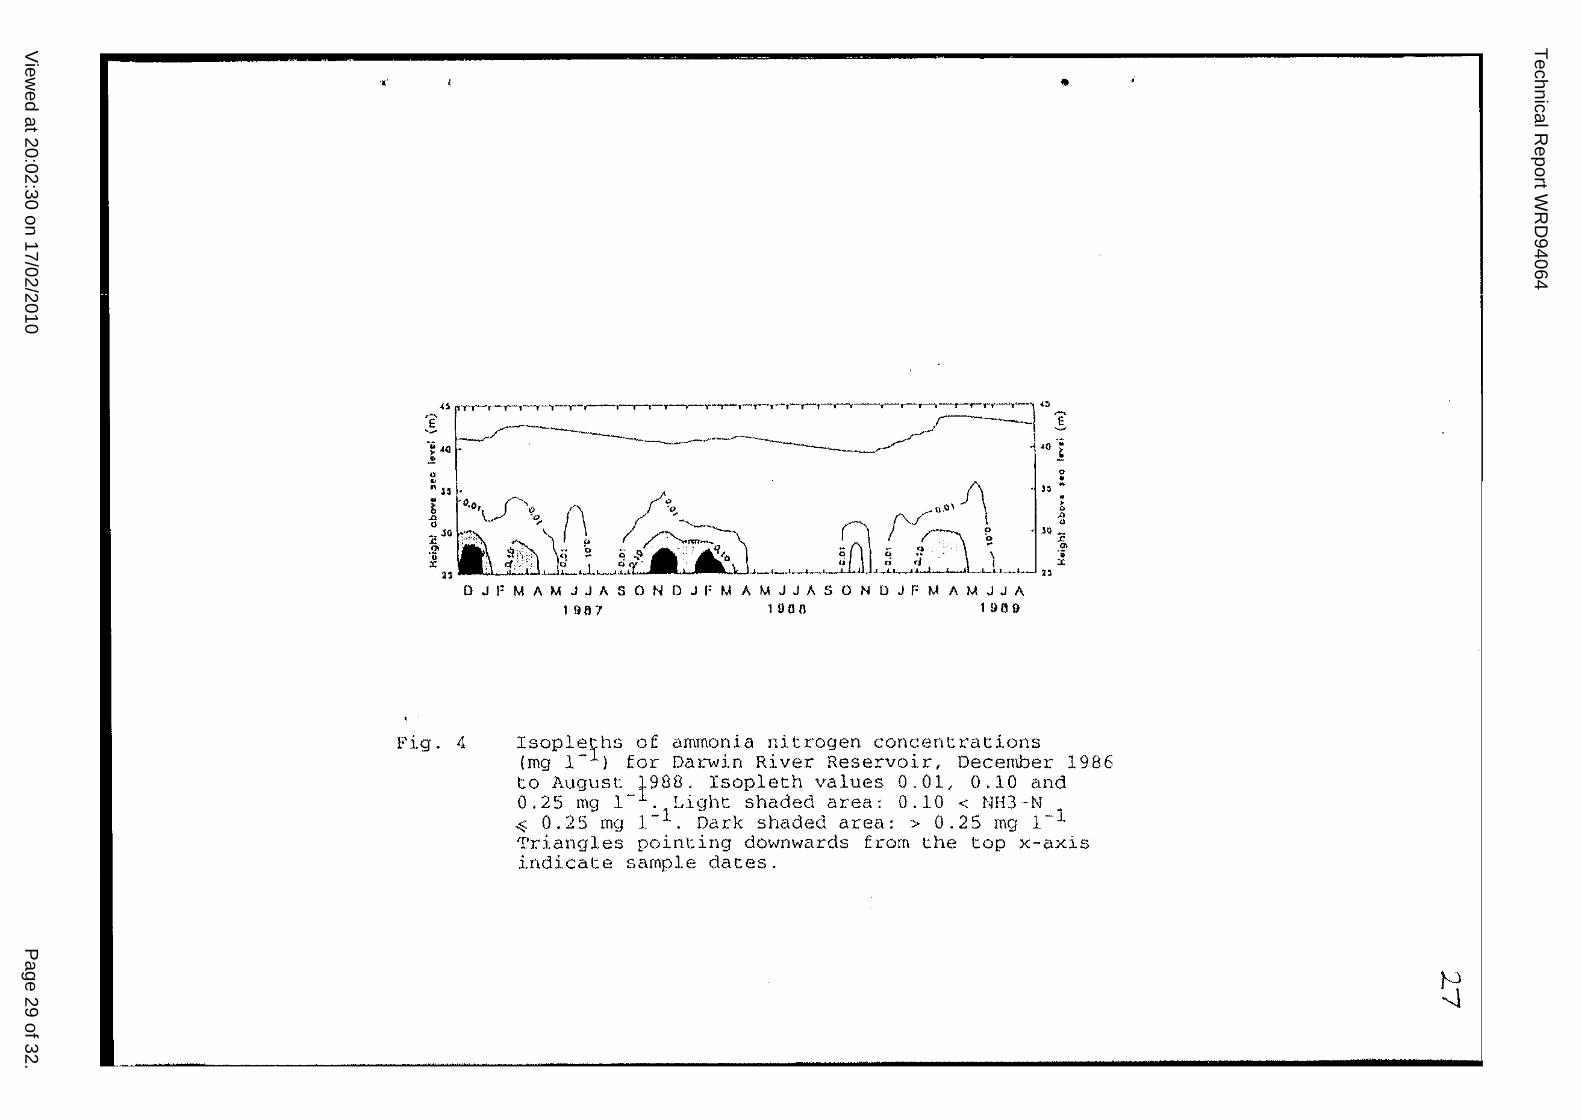
Higher concentrations of ammonia at the sediment-water
interrace of DRR (Fig. 4) indicated conversion of organic
nitrogen in the sediment to fu-nrrlonia and its transportation
to overlying waters (Fig. 4). Concentrations of ammonia
decreased exponentially with distance from the
, _ 1) . sediment-ftlater interface {maximtun 1.3 mg .!. - to
undetectable amounts «0.01 mg 1 -1) at the ox-xcI ine.
Destratification and oxidation of arn.lTlonia caused temporary
high nitrate concentrations of 0.005 - 0.01 mg 1-1 through
che water colUITn.
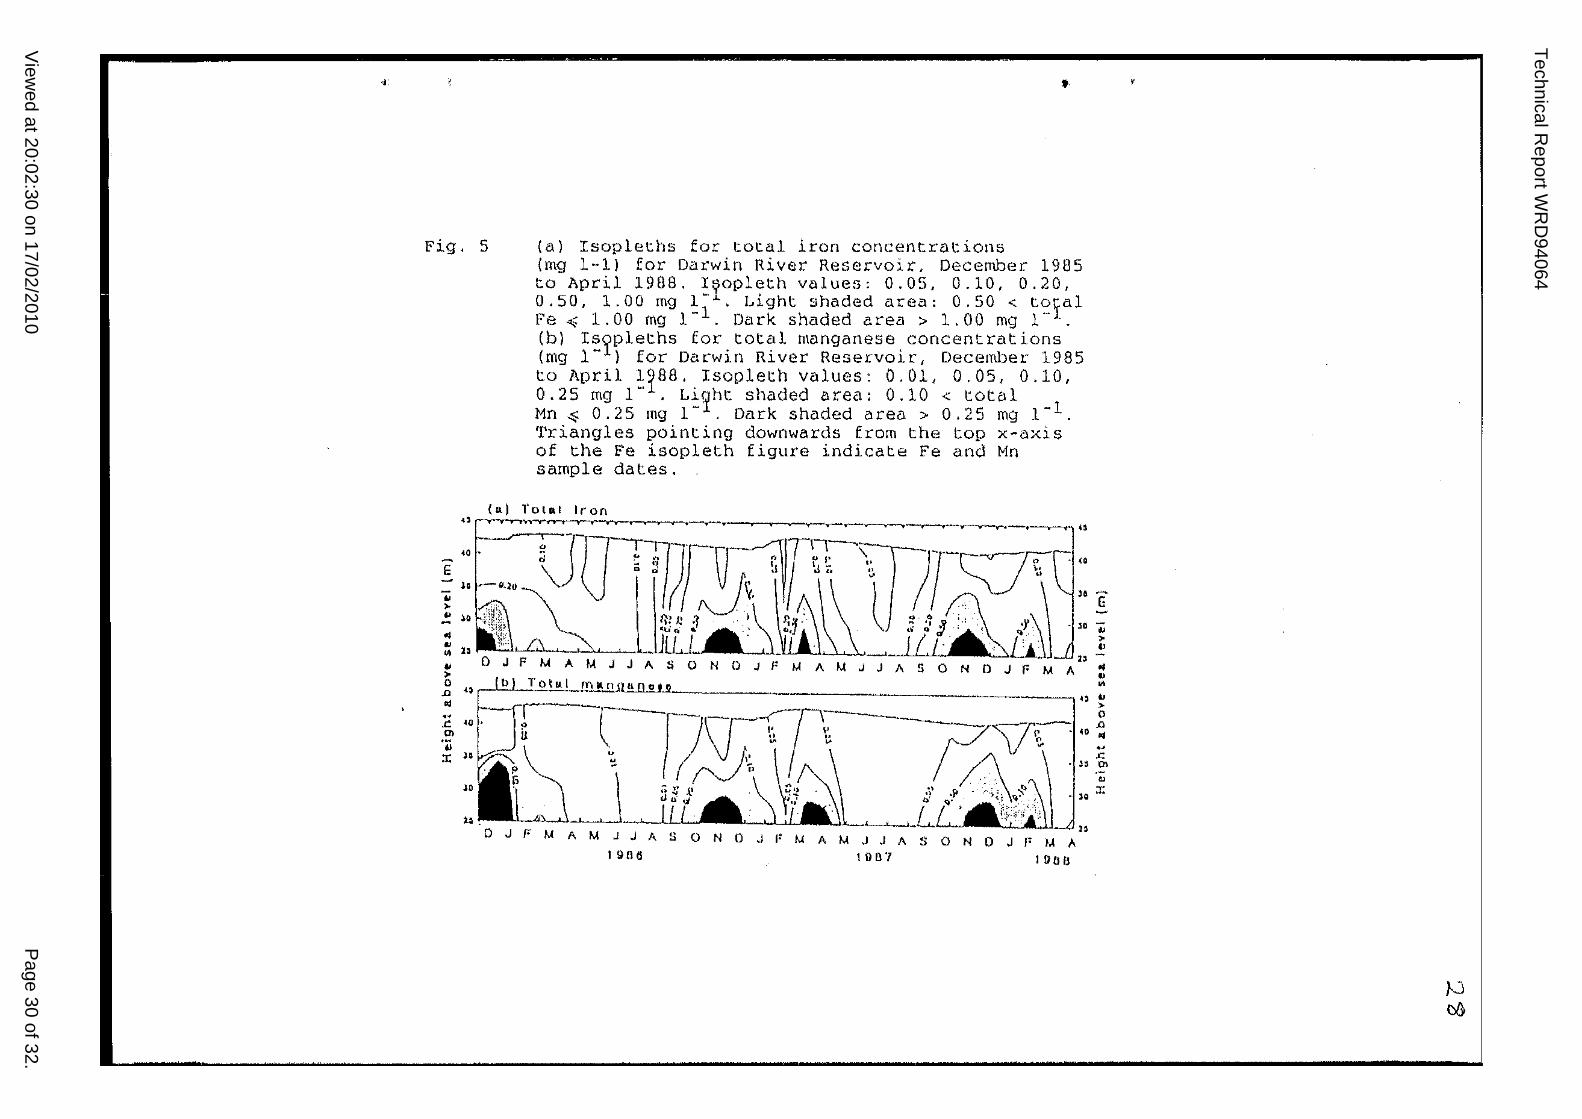
Iron ane manganese acc~~ulated in the metali~nion of DRR
1.10 ,_'0 ~) .J , reaching concentrations 2-3 orders of magnitude
higher than typical epilirnnetic concentrations
-1 1-1 ) m' (0.05··0.10 mg 1 - Fe; 0.01-0.05 mg Hn. d1e maXlmu..rn
hypolimnetic concentrations of iron and manganese measured
\'lere, respectively, 7.1 mg 1- 1 and 1.5 mg 1- 1 , The ratio of
iron to manganese concentrations (3:1 - 10:1) in the
hy-polimnion was higher than their ratio in the sediment
(50:1; Table 2) because manganese is reduced at a higher
redox potential than iron {:tsfortirner 1941). 'flet season
holomixis distributed both metals through the water coll.lJ.-nD(
increasing surface concentrations 5-10 times for several
days until stratification re-established. Similar
concentrations of iron and manganese were occasionally
11
Technical Report WRD94064
Viewed at 20:02:30 on 17/02/2010 Page 13 of 32.
measured during the dry-wet transition in the epilimnion due
to the entrainrr,ent of metalirnnetic waters.
In the latter part of the dry-wet transition, sulphide was
detected by smell in samples collected within 2.5 m of the
sediments. This field observation provides indirect evidence
of a minimum redox potential (corrected to pH 7) of
0.10 - 0.06 V in DRR (Hortimer 1941).
H}~oliunetic and metalinmetic total phosphorus
concentrations were similar to those mea.sured lD ox~{gena::ed
\vaters (0.002-0.006 mg 1-1), suggesting there is little
~elease of phosphorus from the sediments.
The conductivity of epilimnetic waters ranged from
6 _1
55 to ·5 ~S em -. h h'" .' . . t.lOUg. n~gner conauctlvltl.€S
{maximlllLl 140 !-is C1U- 1 } ;'\i'ere measured near the sediment-\'la.ter
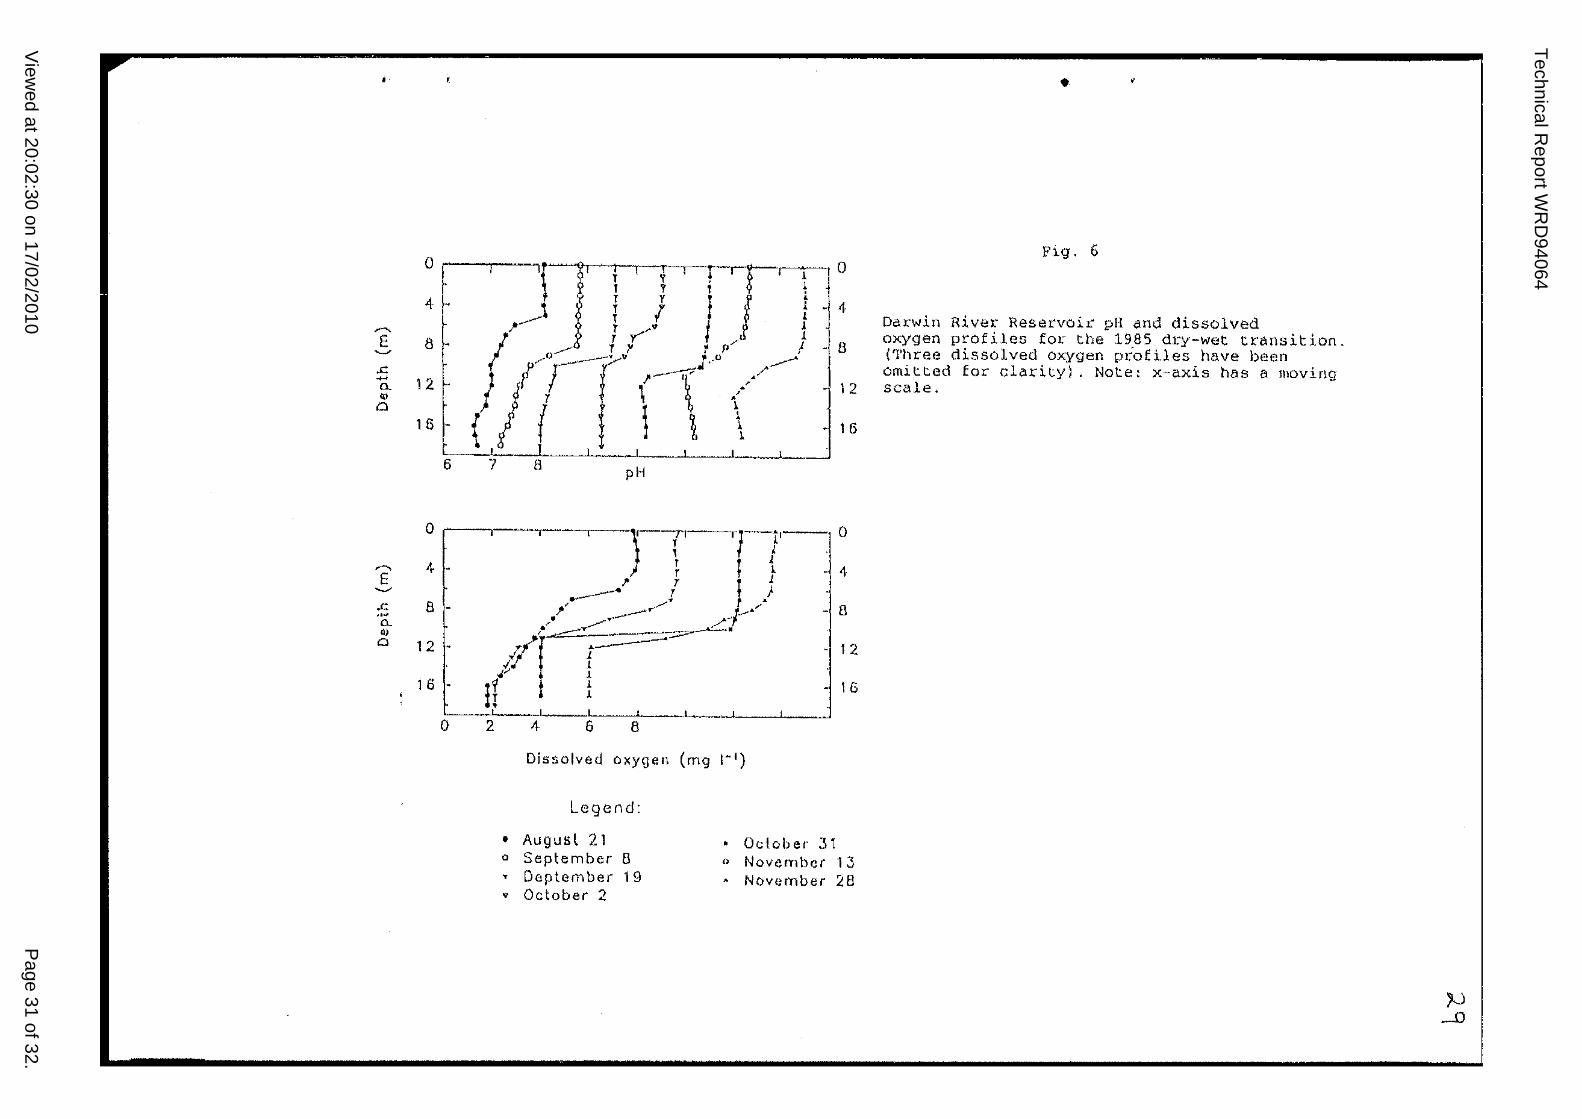
total alkalinities were 30-40 mg 1-1 (as CaC03). Oxygen
depletion in the h}~oliIDnion end metalirrnion of D~~ was
accompanied by decreaSed pH (Fi-;; 6), ;'.t the cormnenC~\1ent of
thermc.l stratification, minimuzn pH values 'Here loca.ted at
the sediment-water interface. with cQmplece metalinmetic
. 1 t-' oxygen cep e_lon, pH miniIT~ were located higher in the
profile. near the oxic-anoxic interface, 0.1 - 0.2 pH units
less than those measured close to the sediment-IVater
interf~ce.
12
Technical Report WRD94064
Viewed at 20:02:30 on 17/02/2010 Page 14 of 32.
The pilrticle size distribution of DEE's sediments indicilted
the follo·.,· ... ing composition: 36% clay, 16% silt, 35% fine sand
and 13% coarse sand and no gravel. Sediment loss on
ignition, an approximation of organic material, was 20%.
l-lean sediment concentrations for nutrients and metals in DRR
are Slli[~liarized in Table 2. Concentrations varied from the
mean by a maXlITtUm of 14%.
Chlorophyll a conce~trations in the e~photic zone of ORR 1
which extended to 10m cepth (Toy,'I1send et a 1. 1994), had a
median concentration· of 3.5 mg m- 3 , and 10 and 90 percentile
1 = - 0 . ~ 8 -3 va_ues o!....::. anc:J. mg m .
The t~ophic status of DRR, based on the totcl phosphorus
criteria of Carlson (1977), Sakamoto (1956), USSPA (1974)
c!:'iteria classify the reservoir as either ol.igotrophic
(USEP_~. l Q7d) o~ meso-ol;-o"rAp~;r (C-r'~A--" _ ~. ......'::! '-- "-' _._.... , c:. ......... v~l Sakamoto
1966) .
4. Discussion
Deep water oX1gen depletion is a functicn of la.ke
productivity, morphometry and water tempe!:"ature {Cha!.~lton
1980, vollenweider & Janus 1982). Rates of dissolved oxygen
13
Technical Report WRD94064
Viewed at 20:02:30 on 17/02/2010 Page 15 of 32.
14
depletion in the hypoliITL""1ion tend to increase with the
trophic status oE a lake. Hypolimnetic anoxia typically
occurs in eutrophic I temperate lakes and is considered
characteristic of eutrophic conditions (Cole 1983, Goldmann
& Horne 1983, Wetzel 1983) .
The eEEect of DK"l's 1m., trophic stacus on oX"ygen depletion
rates is cDuntered to some extent by the reservoirrs
morphometry which has a large epilim.netic volu . .l.ue compared to
its hy-poliITh'1ion and metalirr~T1ion vollL."!,e. Such volili-netric
ratios f.a~lour rapid oXJgen depletioD because of the small
oxygen mass available for oxidation compared to a lak.e ',·lith
c relatively large hypolirr~ion and t~e same temperature and
productivity ratio Q£ the
hypolimnion volth'11e to sediment surfa::e area f a potentially
significant source of oxygen demand l is smaller than in
lakes with relatively large hypolinE:ions.
To assess the influence of lake trc;r-.ic s~atus anc
rnO'!..pnometry \..;::--~ilst accounting for tje i:1fluence of
teILtgerature, oX"},rgen depletion rates ~~:Gve been sta:"!dard,:,sed
to 4 ·C by seve:::-al authors t aSSlli7.i.::Q a Ql0 of 2
(eg. Charlton 1980 1 Vollenweider & Janus 1982, Ferris &
~yler 1992). D~q's Bean temperature corrected oxygen
depletion rate for the dry-wet trar:sition, vlhen hyorpoliIT'lnion
and metali~~ion temperatures 26 ·C, was 0.72 mg
Technical Report WRD94064
Viewed at 20:02:30 on 17/02/2010 Page 16 of 32.
15
~h--l T'-IEont...._ _ nlS , l' h 1 h" h h ' lS S 19 t_y 19ner t.an t .. e temperacure
corrected median rate
(0.51, range 0.01 - 2.11 mg 1-1 month-I) for 21 north
l'.mer'ican and European lakes studied by Vollenweider & Janus
(1982). It is also higher than the long term mean for Lake
1 -1 h-1 ' Burragorang (0.58 mg mont. -; FerrlS & ~~ler 1992), a
deep !'eservoi:.c in temperate .p~ustralia of low trophic status ~
• The ::relatively high; temperature corrected oX""y'gen ciepletion
rate of DP~ is attributed to its high epiliwnion to
h~~olirrnion-metalirrL~ion vol~~e ratio rather than the
reservoir's trophic status.
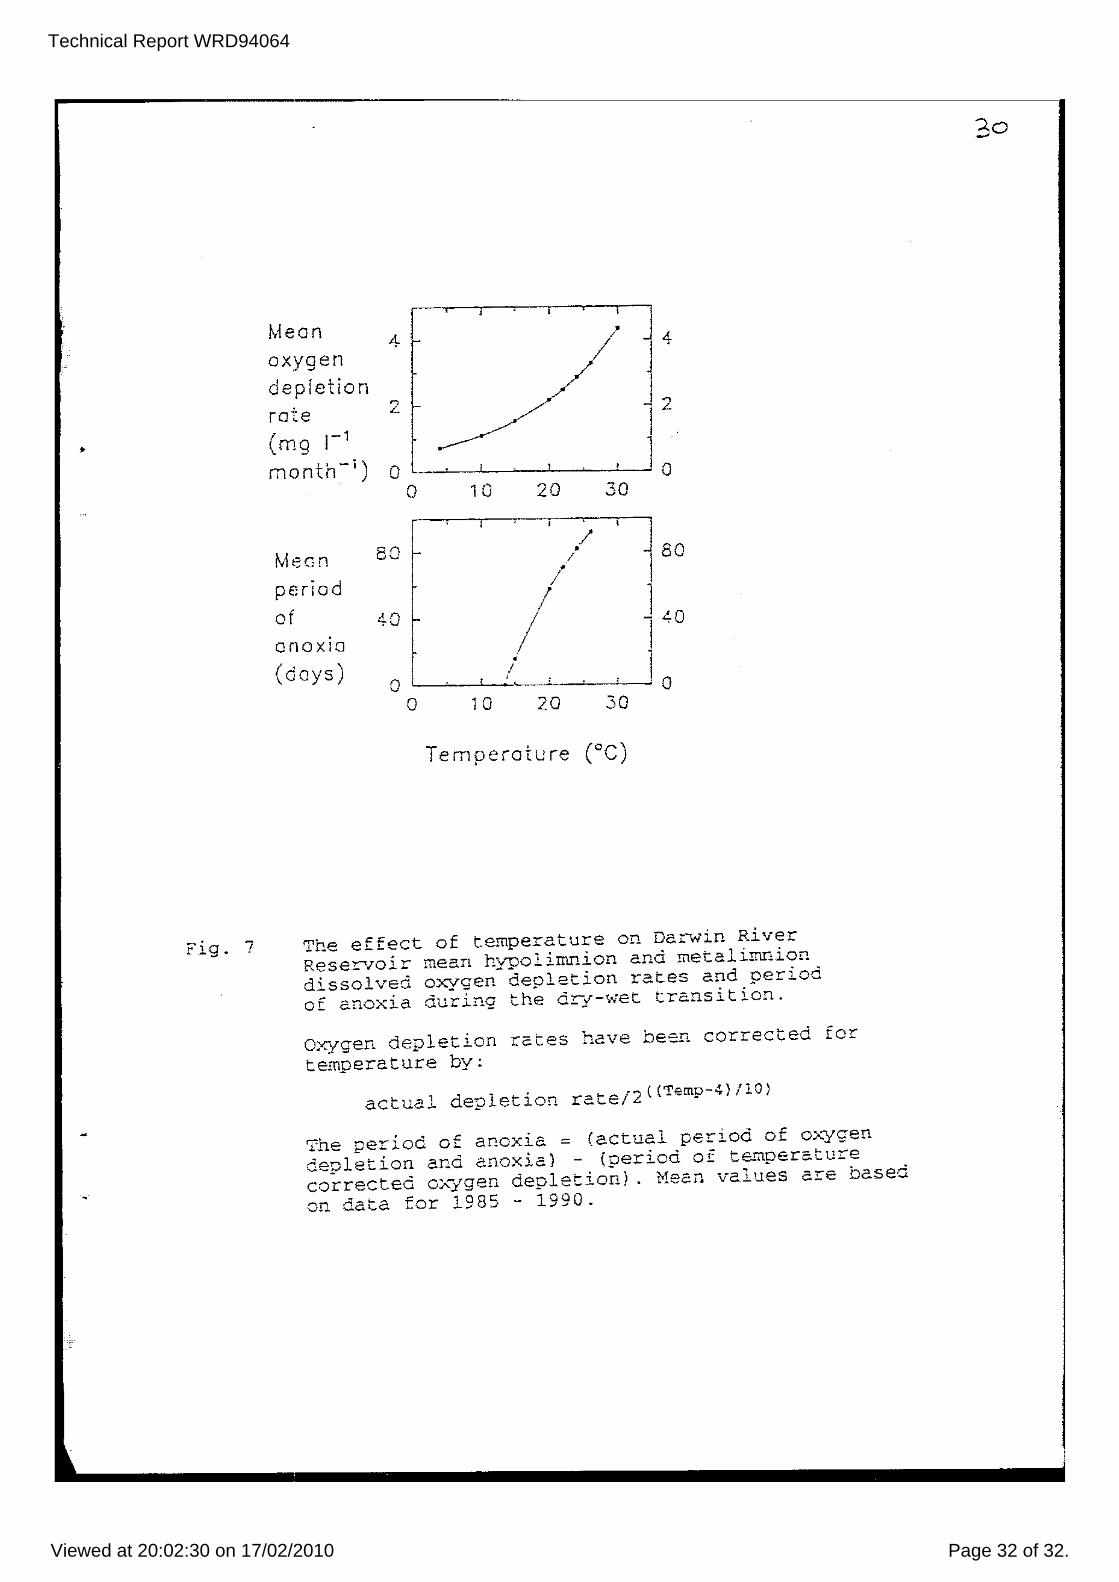
The calculated relationship between tempe:rature ana mean
hypolimI1ion-metalimI1ion deplec.ion re.te in DR? durir!g the
is shown .In Figu!:E 7~ Because t!-le rate is
exponential, small t~'1lperature chan~es can have considerable
impact on depletion rates and the pe:-icd of anoxia . . ~.
hypolinL'I1ion-metalimnion te.-nperature of 13.5 ·C, \v'hich yields
1_, ,-1 l' me - mont~ - J WOU_G noe. produce
in DPR anoxia during the dry-wet transition. This
temperature is higher than that recc-~ded in most tempe::ate
monomictic, and all dimictic, lakes. Straskraba (1980)
predicts a bottom te~perature of 13.5 ·C in lakes 30 m deep •
to occur at latitude 24·. The trends SnO'NTl in Figure 7
, , h empnaS1.Ze t.e influence of t&uperatu=e on oxygen depletion
ra ~e<; 1.'" ~UD" the sam" rese"-"Toir _in,;.;, .......... !T' ..... e ..... ,=. .... e ..... ':m~i-o:l 1-.... .l.. "-"':;"1 ._.1.. '. _ ..... L.e;,!..,~ J... ..... L I"....l...l.., 0,1....."
\"'lould probably not develop anoxia aT!c pronounced chemical
Technical Report WRD94064
Viewed at 20:02:30 on 17/02/2010 Page 17 of 32.
stratification, The affect of temperature in warm tropical
waters on .oX"Jgen depletion rates is probably more
significant than either morphometry' or productivity,
rapid development of stratification ~n the tropics, due to
high insolation rates and the relatively large density
dif fer-ential of vfaLd waters, further increases the
likelihood of OA1'ge1'. depletion in warm tropical waters
compared to temperate waters,
Vollenweider & Janus (1982) examined the statistical
relationship betvleen lake morphometry (maximum depths
26 - 406 m) and trophic status (chlorophyll a concentrations
1.1 - 17 mg m- 3 ) I and temperature corrected hypolimnion
depletion rates for: several temperate lakes. A
Iilultiplicative regression, using log transformed
Chlorophyll a concentration" euphotic depth and mean depth
was founc to explain 91% of the variability of o)..'ygen
depletion rates. Although D?~ falls outside the morphometric
range of the lakes examined by lilollenweider & Janus (1982) I
the regression predicts a temperatu~e corrected depletion
( Il C9 1 -1 ,-1) -' - 1 rate ~.C mg ~ montn c~mos~ equc_
average (0 ..,~
, ,L. --1 ,-I) mg 1. - montn .
Decreased hypoliM,ion pH is also characteristic of
r.. <"m,pe-"r.· A OT1tropi-l~c h 7-l-er'" ('\"er-_'7eJ 19B.-'\), hu·r as is ;::;:."ria'enlt _~. ;.. ..... ~J ...... -.... ~_.J. .1Ct- ..... 1 _____ ~-' ...,. _ _ __ _ _
from DRR data, low pH values can also occur in the
metaliITlJ."!.ion and hypoli!..llIlion of tropical lak.es of low trophic
16
Technical Report WRD94064
Viewed at 20:02:30 on 17/02/2010 Page 18 of 32.
17
status. The pH profiles with minima in the upper layers of
the anoxic metalimnion recorded in D~q are classified acid
heterograde by Hutchinson (1957). These occur in watex's of
low buffering capacity and are due to the transport of
ferrous and manganous bicarbonates from the sediments to the
overlying waters, raising the alkalinity of these waters and
neutralising the acidity of carbonic and organic acids.
Reductive solublization of ferric iron "las not accompanied
by phosphorus release from DP<-.-R. r s sediments due to its 101,0.1
concentration and i~mobilization. Compared to the total
phosphorus concentration of othe:r- lake sediments \o;ith
concentrations of <0.10 - - 1. . . 10.1 mg g - or.! :,,"elgnt. (Bartleson
& Lee 1974, Bostrom 1984, Flanner.! et el. 1982 and Klap .. ·,rijk
,. . 1G8?' e~ al. _ ~), the phosphorus content of D~q sediment
(0.36 mg g-l) is relatively low. The different flux of iron
and phosphorus at t:he sediment-water interface is due t:o the
high sediment stoichometric ratio of. Fe:? {3S:1) ;·;hich is
considerably greater than the ratios (1:1 - 22:1) at t.he
sediments investigated by the above auc1:.ors. A large
proportion of DRR sediment phosphorus is probably
imrr~bilized as apatite, allliuini~~ pnosphctes t refractory
organic compounds, and sorbed to clay minerals and
h~T.ic-iron complexes (see Bostrom et al. 1982) .
• Stratification in DRR and the det·/elopmenc of anOXl.a resul:::ed
III a significant flux of nitrogen l but ~!detectable fuuounts
Technical Report WRD94064
Viewed at 20:02:30 on 17/02/2010 Page 19 of 32.
18
of phosphorus, from the sediments. Holomixis, after
prolonged stratification, will increase the N:P ratio of the
reservoirs surface waters and may affect its phytoplankton
ccrrrrnunity. Such an effect, ho\.,rever I will be minimal in DRR
due to its relatively large epilirnnion to
hypolimnion-metalironion volumetric ratio, but mav' be . -significant in other oligotrophic, tropical water bodies of
di f ferent morphometry.
Acknowledgements
Dr K. Boland «dater ?esources Division, Northern Terri:ory
PO"IOY Cl-no' rA;ater 'uthorl· t-vl p. rof~_ssoT' n, '.-:r_~ ffl' >-hs ~ .... _ ... f"' •• : __ <~ _ _ -...., ~-'- .... '- (James
Cook University of North Queensland) and Dr J. Luong-Van
(Northern Territor,/' University) for COnlI71ents 0[1
an earlier draft of this paper,
Re£erences
?..;."10n. 1985. Standard methods for the examinat ion of water
and wast.e .... Jaters, 16th ed. ~.merican Public Eealth
Associat ior., ;. .... '11erican ~'ljater liiorks Assoc., &uerican
Pollution Water Pollution Control '""'~ ,> rec.eraclon f
New York 1268 pp.
Technical Report WRD94064
Viewed at 20:02:30 on 17/02/2010 Page 20 of 32.
19
Bort1eson, G.C. & G.F. Lee, 1974. Phosphorus, iron and
manganese distribution in sediment cores in six
\'iisconsin lakes. Limnol. Oceanogr:. 19: 794-801.
Bostrom, B., 1984. Potential mobility of phosphorus in
different types of lake sediment. Int. Revue ges.
Hydrobiol. 69: 457-474.
Bostrom, B., Jansson, M. & C. Forsberg, 1982. Phosphorus
release from lake sediments. Arch. Eydrobiol. Beih.
E . . . • , 8 5 50 ... rgenn, LlrnIl0.l _ ..L: -,., .
Carlson I R.E., 1977. A trophic state index Eor lakes.
Charltonf
H.N., 1980 ~ Hypolimnion ox-Jgen consumption In
lakes: discussion of product i vi ty end morphometry
effects. Can. J. Fish. Aquat. Sci. 37: 1531-1539.
Cole, G_~ZI_" 1983. Textbook of lim.r101ogy. The C.V. Hosby
Co .. St. Louis, 464 pp.
Ferris, J .M. & P.A. TJ"ler, 1992. The effects of inflow and
outflo\·, on the seasonal behaviour of a stratified
~-s-~"o;r ;n temperate ~u~"r-;:-_>::::: t:: ..... \I ............ _ .U _ __ .... L Cl..i....i...C - a 20 year analysis.
Arch. Eydrobiol. 126: 129-162.
Technical Report WRD94064
Viewed at 20:02:30 on 17/02/2010 Page 21 of 32.
20
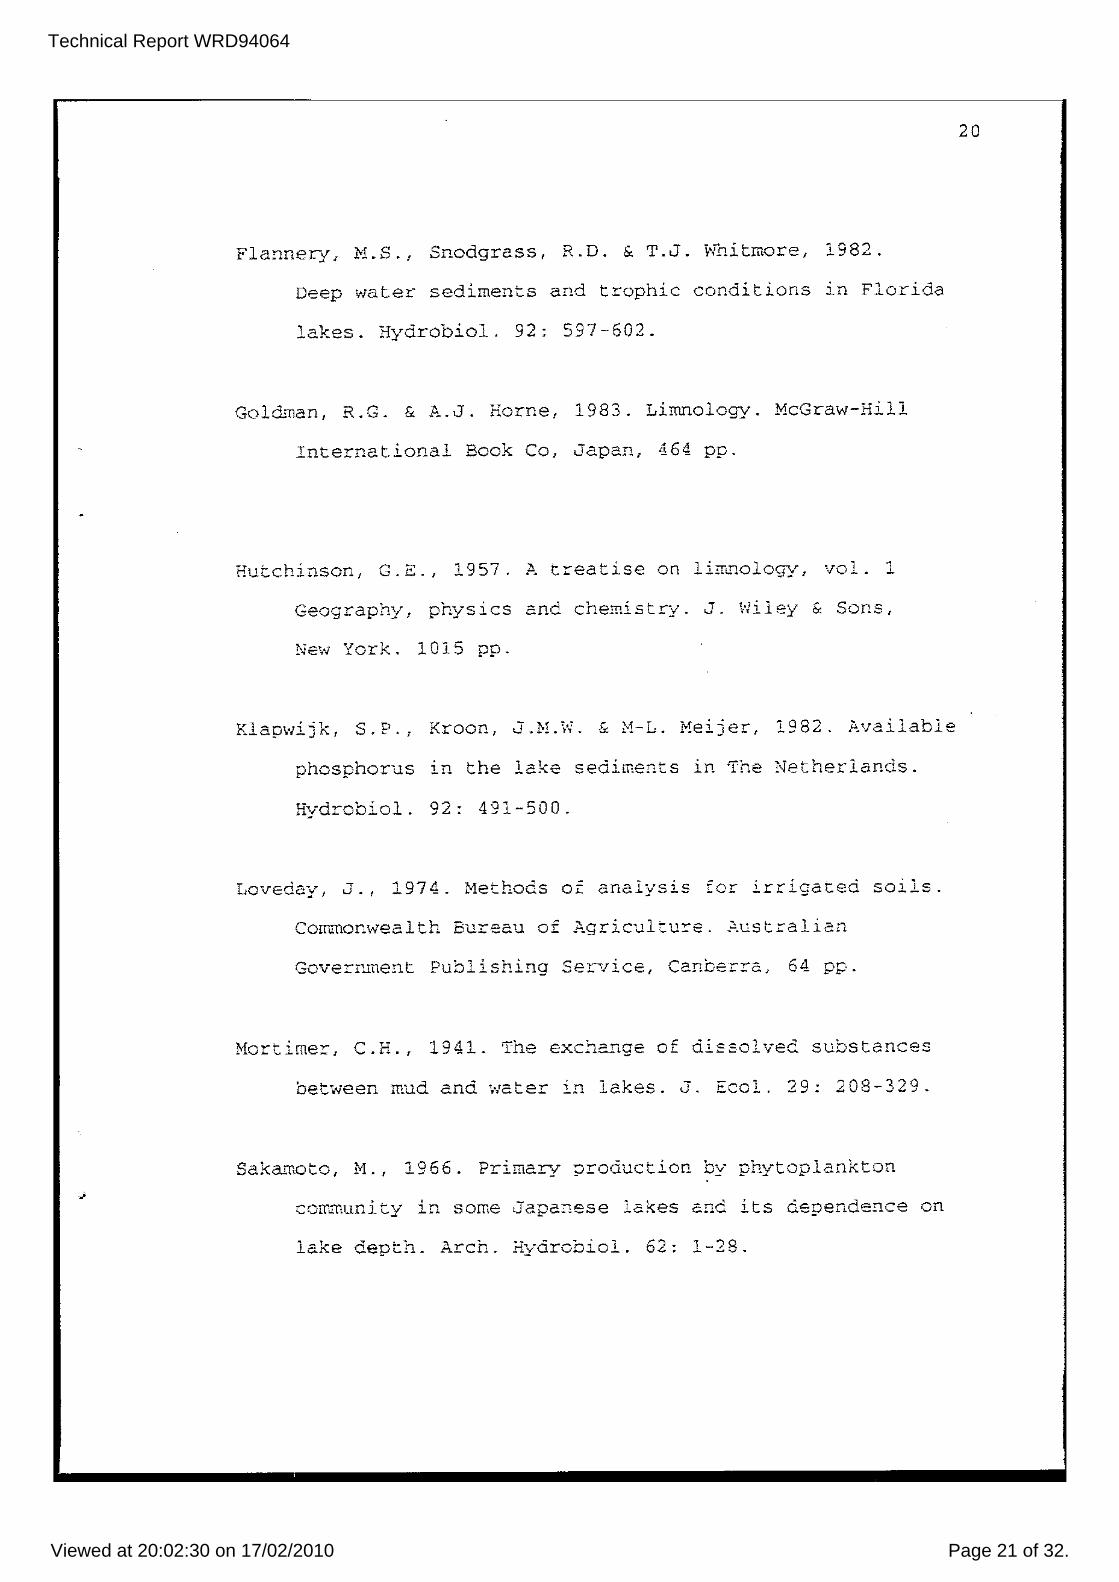
Fla!1nery, H. S., Snodgrass, R. D. & T. J. K'1itmore, 1982.
Deep \>/ate~' sediments and trophic conditions in Florida
lakes. Hydrobiol. 92: 597-602.
Gol&~an, R.G. & A.J. Horne, 1983. Limnology. McGraw-Hill
International Book Co, Japan, 464 pp.
Hutchinson, G.S., 1957. A treatise on 1 iTImology , vol. 1
Geography, physics and chemistry. J. i/Jiley & Sons,
Nev.; York. 1015 pp.
Kl-O\'li";1~ S D ___ 0. -J!."., .... . J Kroon, J.M.W. & M-L. Meiier, 1982 .. ;vailable
phosphorus in the lake sediments in The NetherlaTIds.
Hydrobiol. 92: 491-500.
Loveday, J. , 1974. Methods o~ for irrigated soils.
Commonvrealth Bureau of .z:'.Qricultu::-e .. :O.ustralian
Goverlli-nent Publishing Se:r-vice, Canberra; 64 pp.
Mo "-" 'me- C U • _ .... ..1.." _: .,i.,i. • , 1941. The exchange of di22.o1vec. substances
'oP~"een m'ud -na.- • '-"e"- in i ake" ., ;:--0 1 ?9' 208 ,~Q _,-w ... ~ t C. .·.c~ _ _.:.~ ~ ....... I..... _ ...... _, ...... - _':'.J •
Saka~oto, M'l 1966. Primary production by phytoplankton
corrmunity In some Japa~ese lakes and its dependence on
lake depth. Arch. Hyarobiol. 62: 1-28.
Technical Report WRD94064
Viewed at 20:02:30 on 17/02/2010 Page 22 of 32.
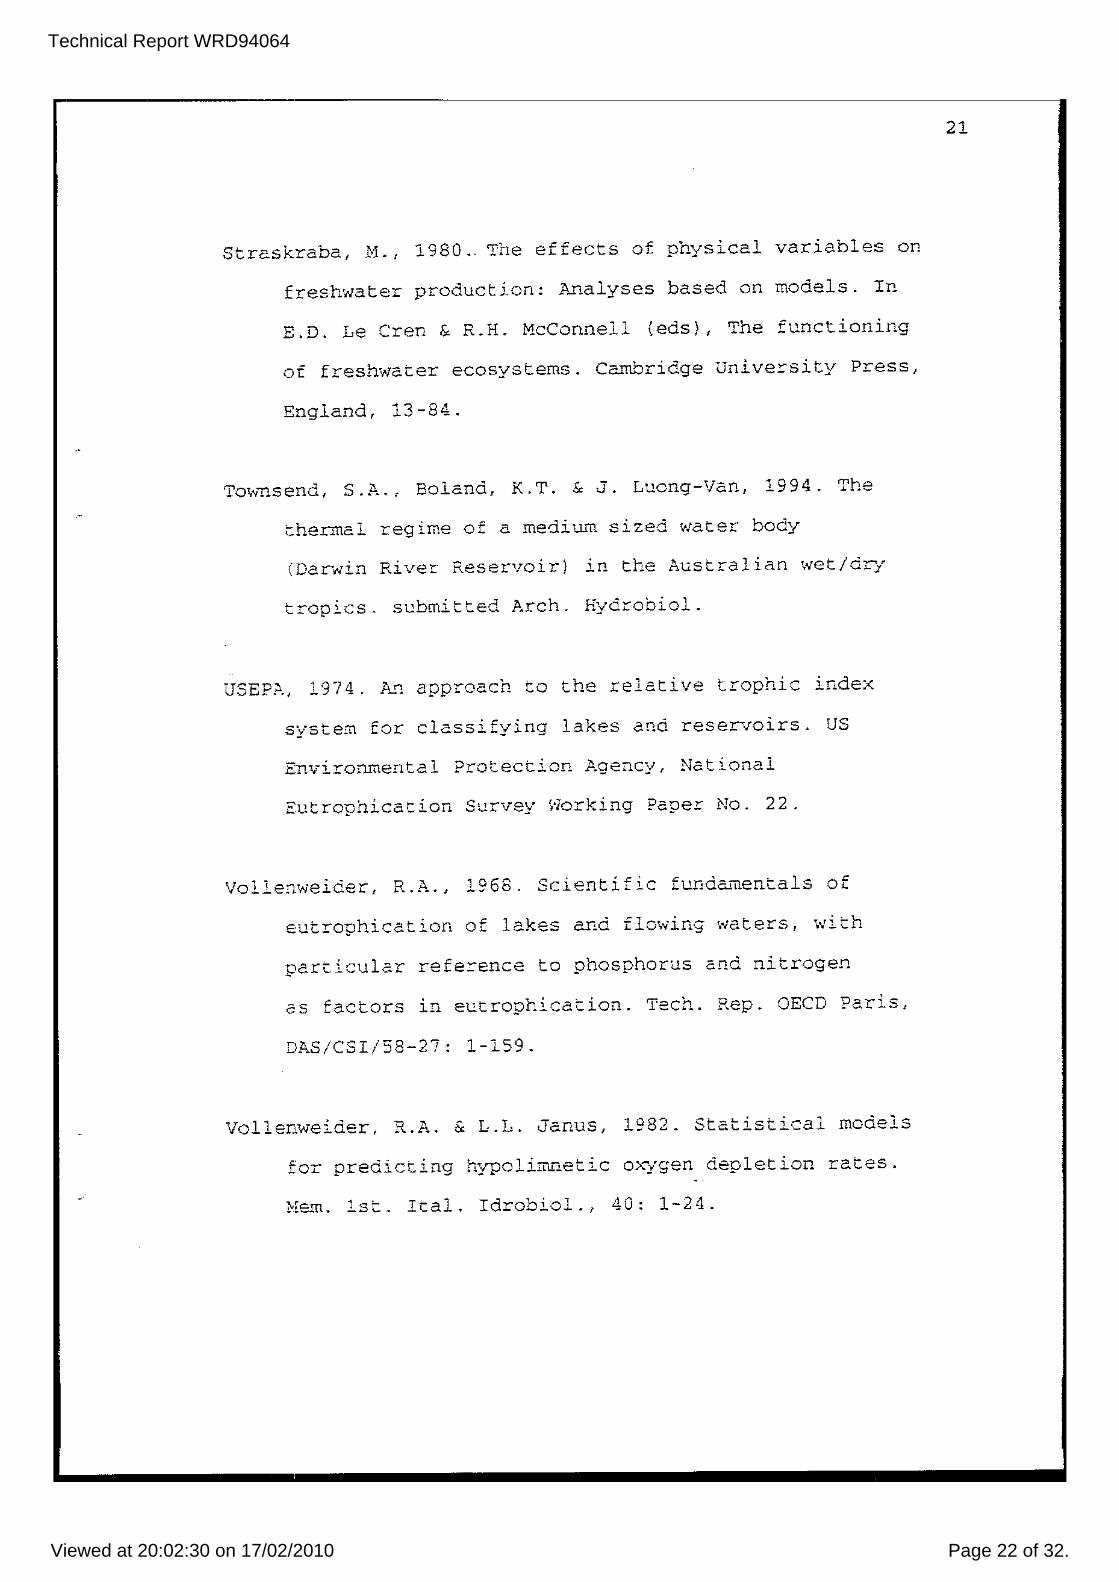
Straskraba, N., 1980 .. The effects of physical variables on
freshwater production: Fnalyses based on models. In
E.D. Le Cren & R.R. McConnell (eds) , The functioning
of freshwater ecosystems. Cambridge University Press,
England, 13-84.
Townsend, S.A., Boland, K.T. & J. Luong-Van, 1994. The
thermal regime of a medium sized water body
(Darwin River Reservoir) in the Australian wet/dr.!
tropics. submitted Arch. Eydrobiol.
USEPA, 1974. p_~ approach to the relative trophic index
system for classifying lakes and reservoirs. US
Environmental Protection Agency, National
Eutrophication Survey '/lorking Paper No. 22.
. l' . . '1 068 ",' ." " 1 c Yo_..Lenwe~cer, R.r..,....... . ,-,Clent~rlC runOfullenta S 0.1.
eutrophicat ion of lakes and flo\,iinc waters 1 ;,·.rith
par~icular reference to phosphorus and nitrogen
as ractors in eutrophication. Tech. Rep. OEeD Paris,
DAS/CSI!58-27: 1-159.
Vollenweider, R.A. & L.L. Janus, 1982. Statistical models
for predicting h:..rpoliTILTletic oxygen depletion rates.
,,. 1 ~ - 1 Id b' 1 40 1 2' ~~em .. _SL .. ~ca.. ro 1.0 '! _: - ':1.
21
Technical Report WRD94064
Viewed at 20:02:30 on 17/02/2010 Page 23 of 32.
Wetzel, R.G., 1983. Li~~ology. Saunders College Publishing,
U.S.A., 767 pp.
22
Technical Report WRD94064
Viewed at 20:02:30 on 17/02/2010 Page 24 of 32.
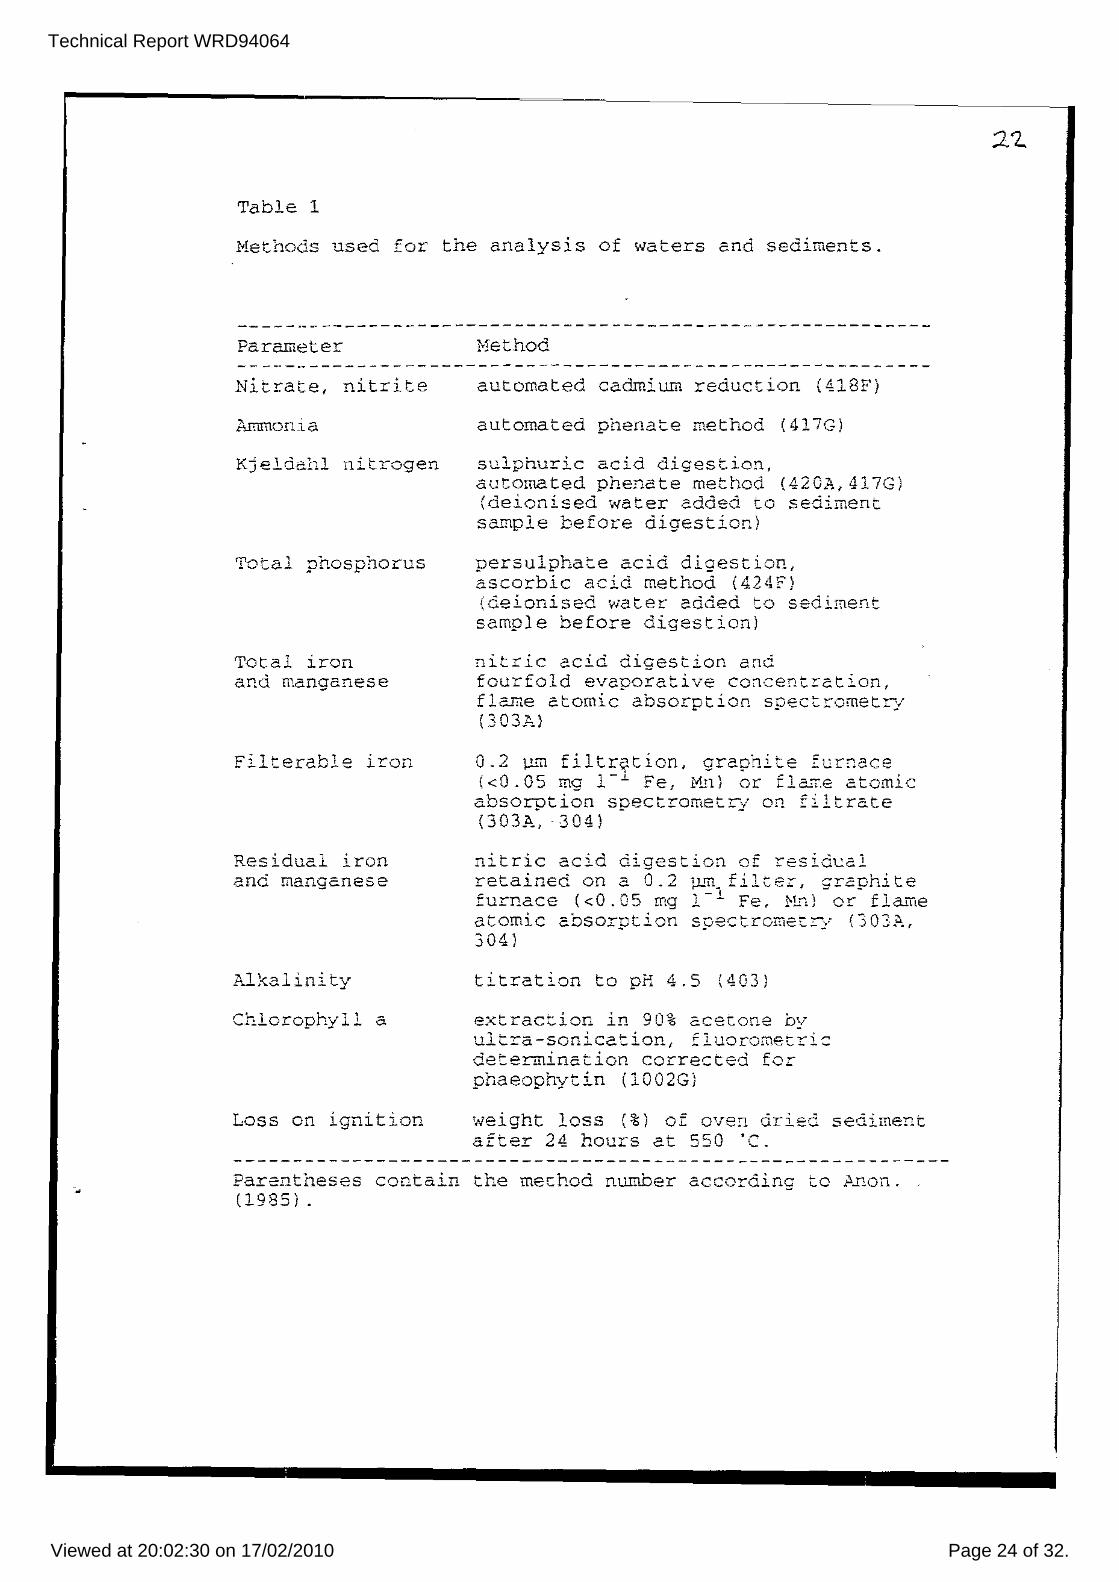
Table 1
Methods used for the analysis of waters and sediments.
Parameter
nitrite
Ammonia
Kjeldahl nitrogen
Total phosphorus
Total iron and manganese
Filterable iron
Residual iron and nanganese
Alkalinity
Chlorophyll a
Loss on ignition
Hethod
automated cadmium reduction (418F)
automated phenate method (417G)
s~lphuric acid digestion, automated phenate method (420A,417G) (deionised water .added to sediment s~mple before digestion)
persulphate acid digestion l
ascorbic acid method (424F) (deionised \'later added to sediment sample before digestion)
nitric acid digestion and fourfold evaporative concent~etion, flame atomic absorption spectrometry f;n3l>.) \ -' '-' --
0.2 lJ,nl filtriCtion, gra<;Jnite furnace {<D.OS mg l-J.. Fe l i-'t • .n} or: flai'.e atomic absorption spectrometr:/ on f i 1 trate (303A,304)
nitric acid digestion of resid~al retained on a D42 1J-TTI filter, ar.cohite furnace «0.05 mg 1- 1 Fe, t-!..:. ... d ~ or- flame ~ , 'e' " (-0-;' al....-oml.C aDsorp,-~on specJ....-rometrlf .) J~.,
304)
titration to pH 4.5 (403)
extraction in 90% acecone by ul j-,.-- -son).' cal- i on r' u·or,....,..-.c. .... 'Y"l,..... ...... _0- '-_ ~t __ V!.I.!'-zL __ "-
deteLluinatiop. corrected for phaeophytin (l002Gj
weight loss (%) of oven arled sediment after 24 hours at 550 ·C.
Parentheses contain the mechod number according to ~non. (1985) .
2L.
Technical Report WRD94064
Viewed at 20:02:30 on 17/02/2010 Page 25 of 32.
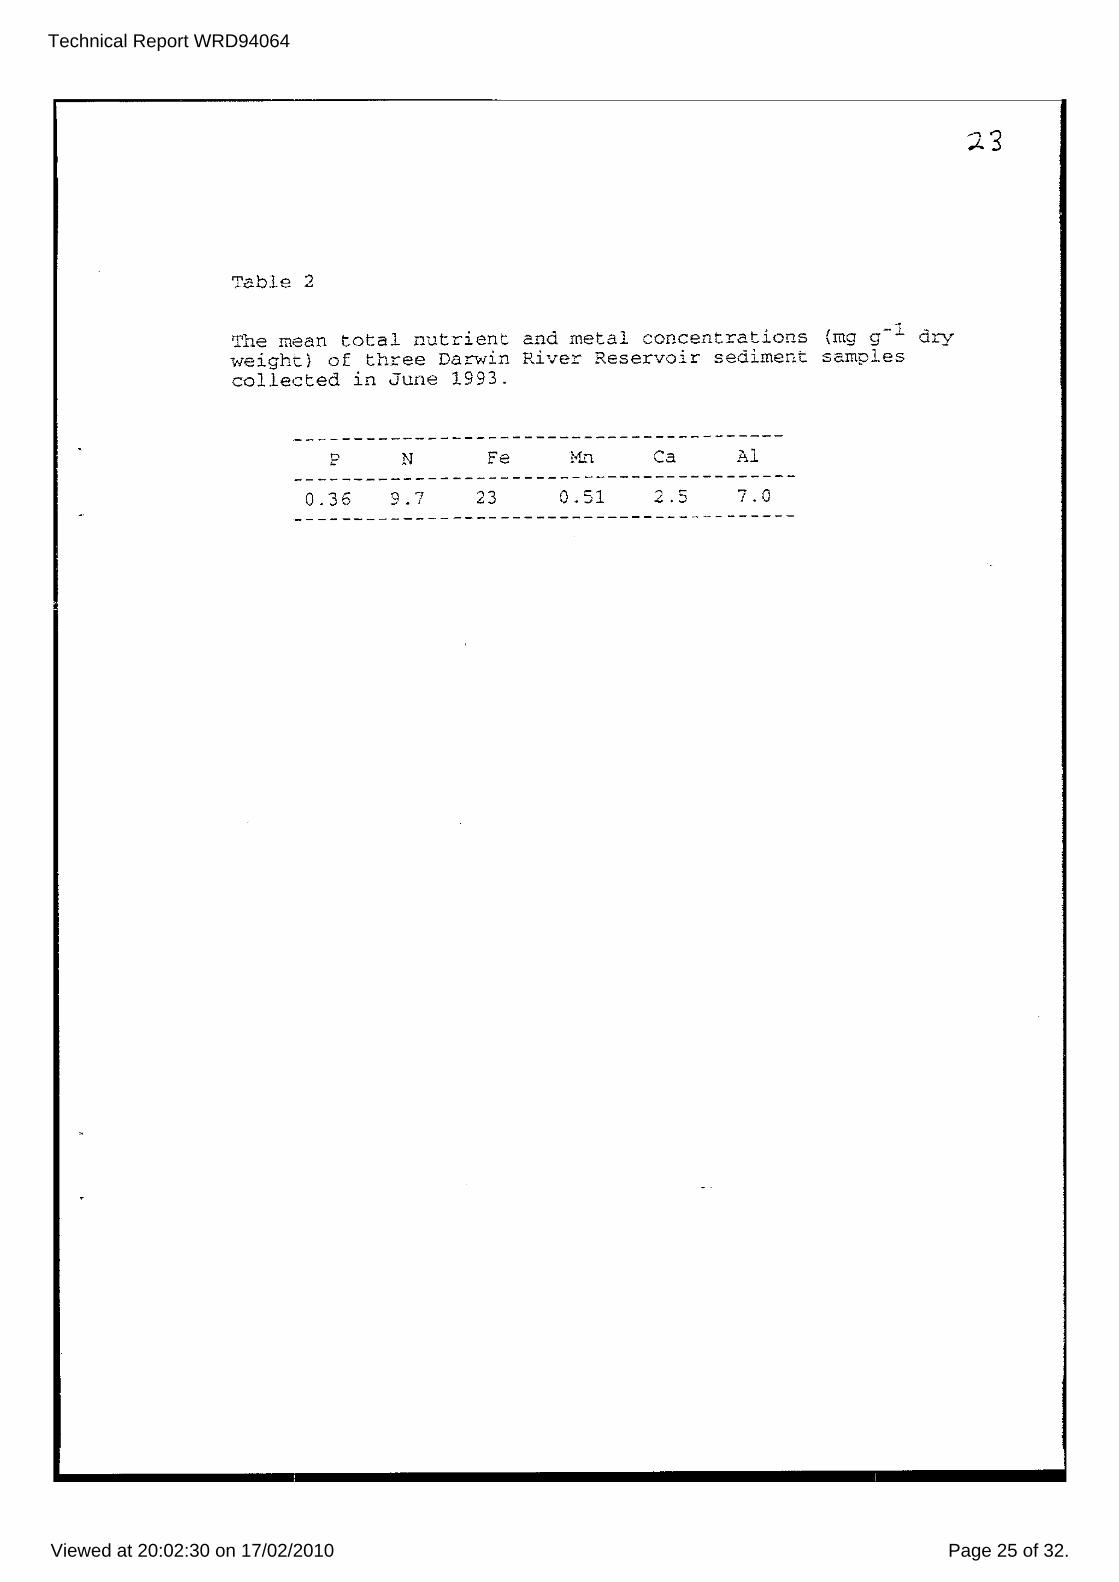
Table 2
The mean total nutrient and metal concentrations (mg g-l dry weight) of three Darwin River Reservoir sediment samples collected in June 1993.
-----------------------------------------p N Fe Ca Al
------------------------------------------0.36 Q '7
~ . , 23 0.51 2.5 7.0 ------------------------------------------
Technical R
eport WR
D94064
View
ed at 20:02:30 on 17/02/2010P
age 26 of 32.
Fig. 1 'remperature isopleths ('C) for. Darwin River Reservoir.. northern Australia, July 1989 to June 1991. 'l'riangles pointing downwards from the top x-axis i.ndicate sample dates.
~ ~ E" Fl . ., I • j , •• .MyTYY..,-Y,.y9' .. "yY")'yV-Y"""T1'"V .. vrvv¥v-YV y .... l'l' .. v-"r'f"-".y·VVTf.""'"v ... yy" ....... vv"'l"""y.,-v., ••• E
~ ·\!Vl'~rlr ~ ~ " ~rr-[ II I I nnTITnrrJ;-llmn-TrI'-'[)J1P ~ t:J r II V .,,]
.~~L-~~ __ ,L _ x-t~_,_.11UJ .... :J; JASONOJfMAMJJASONDJFMAMJ:C
1969 1990 1991
}J of
Technical R
eport WR
D94064
View
ed at 20:02:30 on 17/02/2010P
age 27 of 32.
Aug 14- Sep 1 1 Oct 1 Nov 6 o~
...--. 4-E
'--'
..c 8 .'J CL III
o 12
16 1-9 .j~
Temp 24 28
DO .1
0 3
Dec 2 • , 0.--___o ., 0,
Gl~ 0
1 ----n'i 0, ~~ 0
4 (- 4 4
J ~. 4- -1
j 8 8 - 8 8 - 8 ~/ -~ --~ .... ~~ . - 1 2 - 12 /
l 1 2 - 1 2 12
,LJ 16 LLL_,- 16 I
- 1 G 1 6 _I~ . 1 6 --,--L.l , 32
I - ..J
6 9 0
24 28 32 24 28 32 24 28 32 24- 28 32 l,----------L -'--' __ ' __ 1. .1 '~I , . ~_~l 3 6 9 0 3 6 9 0 3 6 9 0 3 G 9 0 Temperature (Temp), °C • Dissolved oxygen (DO), mg 1- 1
Fig. 2 'J'emperature and dissolved oxygen depth profiles for Darwin River Reservoir for the 1986 dry-wet season transition.
0
Dec 31
-L~
J ~ - 0
1 , 1
24 28 32 Temp
3 6 '. DO 9
I-J tfJ
Technical R
eport WR
D94064
View
ed at 20:02:30 on 17/02/2010P
age 28 of 32.
•
Fig. 3 Isopleths of the percentage saturation of dissolved oxygen concentrations for Darwin Reservoir. July 1985 to July 1991.
•
River
~~ ,..-"-,, , •• •• ,,........-,.-....T-,--vy".n'i.,......,....."'YY"Y.,'<..-.,..'n"YV __ fY,,.".....-..." ... y,,.---,.W_"(_~ ... h ... ·.~v-.-y-~T"'''fr-Tll .1
",. [ " .. "
lD ,.
" l~ l..Jl,·q·"j"'.o
.11 ,til! JlJJ1j
J A SON 0 J F M A tJ J J A oS 0 N 0 J F M A M J ..-., 1965 1911G 11HH ""::' E E ~ ~ -;;; "r~'" .. ~-,~m~~.,~ry .. n~~~'n.m .. n~".m··"-'~~"-~Fl~~"iii
III .- ......---- ,- __ • ... III . -~.~ . - " ,\" 2 "f --1"--"" ~ -.r----:Oj·' I . "-o "/\ I • , - "\ •
" ~" " > o .£ll~ a
-·~l~ IL. I. C', ';U J A S 0 X 1967
N o J I: " A " J J A 1 90 II
5 o
a "
" V>
" > o ·,~o .0
o
-LflIIL.1UUIJ.JUh .. :::'JL • .J.J" :c N 0 J F M A M J ,2"
1969 :r:
u rvv-v~~"-v-"'-'''--''-'~''YTY'''''~'''''n''...-~.""" .... ~ ~ ~".,. ... ~ • ...-...... ". ~"""""'''T..--y.'rY>'Y '"'',TV''''' h'''VI'Y,..T''''''''''I''"1 " _ .. ~·-n ~
\[-- .. " "
" n .... _- ____ ---~---.~.---,,~ ....... ' ......... ----."'-'-'--JIJ ~~
J A SON 0 J r- )J A M J .J A SON D J F M A M J \90U 1090 19!J1
).J ()'
Technical R
eport WR
D94064
View
ed at 20:02:30 on 17/02/2010P
age 29 of 32.
, ..
i:: p~-'-~-C-~'-'~Y=~'-'-'-~--~-~~n-'-l: I " · . " • j o :c JO
.2' • "' "
o • " . • ~ A
" Jq •• ~ ~ .,
LUJ_.I_....l_'----~U.l__LL._.J; 'LL_l.l~l-..-J ~~ :x
DJI'MAMJJASONOJfMAMJJASONDJfMAMJJA
Fig. 4
1 991 1900 190 {)
Isople1hs De ammonia ni.trogen concentrations (mg 1- ) for Darwin River Reservoir, December 1986 to August pB8. Isopleth values 0.01, 0.10 and 0.25 mg 1- . Light shaded area: 0.10 < NH3-N ~ 0.25 mg 1-1 . Dark shaded area: > 0.25 mg 1-1 Triangles pointing downwards from the top x-axis indicate sample dates.
~
Technical R
eport WR
D94064
View
ed at 20:02:30 on 17/02/2010P
age 30 of 32.
'. •
Fig. 5 (a) Isop1eths for total iron concentrations
E
• > • • • • • > 0
I>
• ., "' '" • X
(mg 1-1) for Darwin River Reservoir. Decenmer 1985 to April 1988, Iyopleth values: 0.05. 0.10, 0.20, 0.50, 1.00 109 1 '.~, Light shaded area: 0,50 <: toral Fe < 1.00 109 1- 1 . Dark shaded area> 1.00 109 1-' (b) Is~pleths for total manganese concentrations (mg 1- ) for Darwin River Reservoir, December 1985 to April 1~88. Isopleth values: 0,01, 0.05, 0.10, 0.25 109 1- . Li2ht shaded area: 0.10 <: totlll Mn"" 0.25 mg 1- , Dark shaded area> 0,25 mg 1- 1 . Triangles pointing downwards from the top x-axis of the Fe isopleth figure indicate Fe and Mn sample dates.
(u) rotal Iron
"F "'~' 'ii' i' :~ ~1l'FTI4Iii-:-~~:-~~:~I:: .0
"
" " " " JO
Q·.hl
0 JFMAMJJAtl:ONDJFMAMJJAS
lO-G
~o "Z >
. . ~L.aH~L.1J l'
ONDJFMA:
~J I O~IlI-Lll!'!JjJ~.J/ .....
I _. ___ ~ :=1" . . 10 I 11\ ~(\" 'r<.-r.-:--: " I>
" -
OJFMAMJJAS
1906
• ~
" " '" • )0 To
.. t .1!--4J u o N 0 .J f~ tJ A M J J A SON 0 J F M "
100" 1 D 6 fj
)..J
00
Technical R
eport WR
D94064
View
ed at 20:02:30 on 17/02/2010P
age 31 of 32.
~
E ~
.c ~
0, .. Cl
o I if T'; I T'Tl 0
H If;}.1 1 ~ 4 .. ---- r,.'<1 i
8 ~ I /' I r 1 p/ ! -I B
12
{,I f ,! J ,\ ,\ , J pH
1 6 ,-
6
o I---'--~ ,...., , ' )--r, E " I r,--'-~ 1" _ .... , 0 r I
.c; 8 • r ,I •• _ .' T " fr /,,_!)}1 -j 4
Cl .,' r----'/ • 1 2 - .. / . ..--"-- _/ ':if >-__ .-==.-L' -I 8
-I 1 2. f,,- 1
16 1- l 1 h ± 16
o 2 6 8 .'-----'-_-L_~ , '~--~:----'- ..
4 '
Dissolved oxygen (mg 1-')
Legend:
• August 21 o September 8 • Doptember 1 9 y October 2
October 31 o November 13
November 28
•
Fig. 6
Darwin River Reservoir pH and dissolved oxygen profiles for tile 1985 dry-wet transition. ('J'hree dissolved oxygen pl:ofiles have been omitted for: clarity). Note: x-axis has a movin9 scale.
~ ..--0
Technical Report WRD94064
Viewed at 20:02:30 on 17/02/2010 Page 32 of 32.
•
rig. 7
I
Mean 4- i-/ - 4-
oxygen depletion
-12
rate 2 -
~ (mg 1- 1
1 month-I) 0 ,
0 0 10 20 30
/ • 80 i- 180 Meon / •
period / ! J LO / of 40
onoxlo I 1 0
• (doys)
0 ,I
0 1 0 20 30
Temperature (OC)
The effect of temperature on Darw'in River Reservoir mean hy~olirnnion and metalimnion dissolved oxygen depletion rates and. period of anoxia during the dr.:r-t,-i€t transition.
o~xgen depletion rates have been corrected for temperature by;
actual depletion ratei2 «Temp-4) 110)
The period of anoxia = (actual period of oxygen depletion and anoxia) - (period of ta~perature corrected o~xgen depletion), Mean values are based on data for 1985 - 1990~