
SIMILAR STUDENTS, DIFFERENT RESULTS: Why Do … · additional analysis conducted on curriculum...
20
© Copyright 2006 by EdSource, Inc. REPORT JUNE 2006 EdSource ® is a not-for-profit 501(c)(3) organization established in California in 1977. Independent and impartial, EdSource strives to advance the common good by developing and widely distributing trustworthy, useful information that clarifies complex K–12 education issues and promotes thoughtful decisions about California’s public school system. The summary report from a large-scale survey of California elementary schools serving low-income students Some people say that you can predict the performance of a California school based on its zip code. It is true that parent education and socioeconomic level—and a student’s proficiency in English—are important to students’ academic success. But school and district practices and policies contribute as well. Among schools that serve roughly the same kinds of students in California, a large and consistent gap in academic performance exists. This gap can be as much as 250 points on the 200-to-1000 scale of the Academic Performance Index (API), the state’s primary accountability measure. That observation prompted a two-year collaborative research project overseen by EdSource. The study looked at factors that might explain that gap in API scores, focusing on a subset of California elementary schools serving largely low- income students. The goal was to determine which current K–5 practices and policies are most strongly associated with the higher levels of student performance some schools achieve. SIMILAR STUDENTS, DIFFERENT RESULTS: Why Do Some Schools Do Better? 300 400 500 600 700 800 900 1000 100 110 120 130 140 150 160 170 180 190 200 SCI API Schools with most challenges Schools with fewest challenges 25th–35th Percentile Band for SCI School Characteristics Index (SCI) vs. 2003 Base Academic Performance Index (API) Number of Schools: 547 API Scores Max: 782 Median: 675 Min: 534 The study looked at a relatively narrow band of elementary schools to control for student characteristics. We chose schools that fell between the 25th and 35th percentile on the SCI. As a group, those schools tended to have higher-than- average percentages of students who are English learners, who are from low-income families, and whose parents are not high school graduates. The research question: What accounts for the difference in API performance among schools that serve similar students? As this chart shows, Academic Performance Index (API) scores for California elementary schools facing similar challenges (as indicated by the School Characteristics Index or SCI) regularly vary by as much as 250 points. The central research question for this study was: What school factors might explain this variance? Data: California Department of Education (CDE) EdSource 5/06
Transcript of SIMILAR STUDENTS, DIFFERENT RESULTS: Why Do … · additional analysis conducted on curriculum...
© C
opyr
ight
200
6 by
EdS
ourc
e, I
nc.
R E P O R TJ U N E 2 0 0 6
EdSource® is a not-for-profit 501(c)(3) organization established in California in 1977.
Independent and impartial, EdSource strives to advance the common good by developing and widely distributing trustworthy, usefulinformation that clarifies complex K–12 education issues and promotes thoughtful decisions about California’s public school system.
The summary report from a large-scale survey of California elementary schools serving low-income studentsSome people say that you can predict the performance of a California school based on its zip code. It is true
that parent education and socioeconomic level—and a student’s proficiency in English—are important to
students’ academic success. But school and district practices and policies contribute as well.
Among schools that serve roughly the same kinds of students in California, a large and consistent gap in
academic performance exists. This gap can be as much as 250 points on the 200-to-1000 scale of the
Academic Performance Index (API), the state’s primary accountability measure. That observation prompted
a two-year collaborative research project overseen by EdSource. The study looked at factors that might
explain that gap in API scores, focusing on a subset of California elementary schools serving largely low-
income students. The goal was to determine which current K–5 practices and policies are most strongly
associated with the higher levels of student performance some schools achieve.
SIMILAR STUDENTS, DIFFERENT RESULTS:Why Do Some Schools Do Better?
300
400
500
600
700
800
900
1000
100 110 120 130 140 150 160 170 180 190 200
SCI
API
Schools with most challenges Schools with fewest challenges
25th–35th Percentile Band for SCI
School Characteristics Index (SCI) vs. 2003 Base Academic Performance Index (API)
Number of Schools: 547
API ScoresMax: 782Median: 675Min: 534
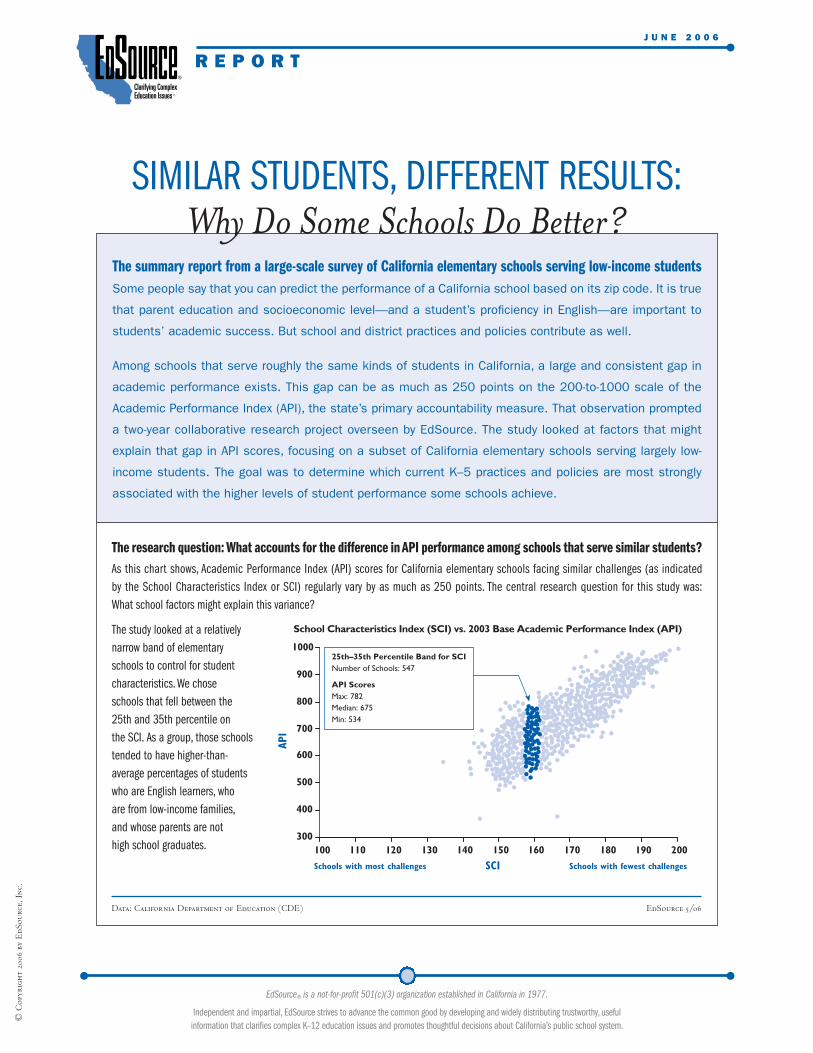
The study looked at a relativelynarrow band of elementaryschools to control for studentcharacteristics. We chose schools that fell between the25th and 35th percentile on the SCI. As a group, those schoolstended to have higher-than-average percentages of studentswho are English learners, who are from low-income families,and whose parents are not high school graduates.
The research question: What accounts for the difference in API performance among schools that serve similar students?As this chart shows, Academic Performance Index (API) scores for California elementary schools facing similar challenges (as indicated by the School Characteristics Index or SCI) regularly vary by as much as 250 points. The central research question for this study was: What school factors might explain this variance?
Data: California Department of Education (CDE) EdSource 5/06

In 2005 principals from 257 Californiaelementary schools—and more than 5,500teachers from those schools—completedsurveys that asked about a wide range ofclassroom, school, and district practices. Thesurvey included 350–400 items that weregrouped into broader domains that reflectedexisting research about effective schools anddistricts. Each represented a group ofspecific behaviors thought to affect studentperformance. The schools in turn weregrouped into high-, medium-, and low-scoring categories based on their API. Theiranswers were compared using a statisticalmethod designed to isolate the effect of thevarious domains of teacher, principal, andschool district practice.
The study found that four specificdomains, or clusters of practices, were moststrongly correlated with higher school APIscores: 1) prioritizing student achievement; 2)implementing a coherent, standards-basedinstructional program; 3) using assessmentdata to improve student achievement andinstruction; and 4) ensuring the availability ofinstructional resources. The remaining threedomains examined—involving and support-ing parents, encouraging teacher collaborationand professional development, and enforcinghigh expectations for student behavior—hadmuch weaker but still positive correlationswith school performance.
The four “effective schools” domains didnot operate independently but tended tooccur together in the same school. Therefore,a central message of the study is that no singleaction, or even category of actions, can aloneprovide a clear advantage related to studentperformance. Rather, schools that have, onaverage, higher API scores also report morestrongly that they implement these multiple,related practices.
The study also strongly suggests thatperformance is higher in schools in which theactions of teachers, principals, and schooldistrict officials are all closely aligned andtightly focused on student achievement.Responses from school principals to an open-ended survey question and interviews with 20
© C
opyr
ight
200
6 by
EdS
ourc
e, I
nc.
E D S O U R C E R E P O R T
About this Summary ReportThis EdSource report summarizes the Initial Findings issued in October 2005 from a two-year studyconducted by EdSource, Stanford University, University of California–Berkeley, and American Institutes forResearch (AIR). In addition, this report includes information collected during the study but not previouslyreported (from superintendent interviews and principal open-ended questions) as well as the results of anadditional analysis conducted on curriculum program choice and association with Academic PerformanceIndex (API) scores. While the official study findings were the work of the entire team, EdSource takes fullresponsibility for the contents of this summary and for any errors or misinterpretations it may contain.
Research Team: EdSourceTrish Williams, executive director, study project directorMary Perry, deputy directorCarol Studier, senior research associateNoli Brazil, research assistant
Stanford UniversityMichael Kirst, Ph.D., principal investigatorEdward Haertel, Ph.D., senior technical consultantSean Reardon, Ed.D., technical advisor
University of California, BerkeleyElisabeth Woody, Ph.D., principal research scientistMelissa Henne, assistant research scientist
American Institutes for Research (AIR)Jesse Levin, Ph.D., senior research scientistRoger Levine, Ph.D., director of Cognitive Survey Laboratory
Acknowledgements:Thanks to the many researchers, K–12 educators, and policymakers who assisted with this study;the 257 California elementary schools who participated in the study; and the cadre of Bay Areaschool board members who served as research liaisons.
And thanks to Reed Hastings, CEO of Netflix, for posing an important research question and thenproviding the financial support that allowed the research team to conduct this independent study tofind some answers.
Inside this Report:Initial findings suggest that a combination of strategies is necessary . . . . . . . . . . . . . . . . . . . . . . 5
Another view of the findings reveals strong vertical alignment of expectations and accountability . . . . . . . . . . . . . . . . . . . . . . . . . . . . . . . . . . . . . . . . . . . . . . . 13
This study offers implications for policy and practice,including “staying the course” with standards-based reform . . . . . . . . . . . . . . . . . . . . . . . . . . . . 15
School practices can make a difference in the achievement of low-income students . . . . . . . . . 20
2 ● Similar Students, Different Results: Why Do Some Schools Do Better? ● June 2006

superintendents helped to illuminatethis dynamic.
The Similar Students, Different Resultsstudy was a collaborative effort ofEdSource, Stanford University, Univer-sity of California–Berkeley, and theAmerican Institutes for Research(AIR). Initial findings were released inOctober 2005. Comprehensive materi-als, including those and subsequentfindings released in April 2006, areavailable online at: www.edsource.org/pub_abs_simstu05.cfm
This summary report describes thework of the entire team and drawsheavily on the collective work of other
team members. However, EdSourcetakes full responsibility for its finalform and any inaccuracies or misrepre-sentations it might contain. Along witha brief description of the research proj-ect itself, this summary provides anoverview of the initial research findingsas well as material released since, placing them within the context ofCalifornia’s standards-based reformefforts. It also looks at how state andfederal policies related to studentperformance appear to be playing outin elementary schools serving low-income students and explores somepossible implications for state policy-
makers, local school district leaders,and educators at elementary schoolsthroughout California.
What we hoped to learnFrom its inception, this study wasdesigned to look at which “effectiveschools” practices previously identi-fied in literature might make the mostdifference in school performanceunder standards-based reform in Cali-fornia. That required examining awide breadth of topics across multiplelevels of the education system, includ-ing classrooms, schools, and districts.Given such an ambitious approach tothe topics to be studied, we decided tofocus our analysis at the school level.We also limited the study to elemen-tary schools, and further, to those thatserved largely low-income studentsand faced similar levels of challenge.
The state’s School CharacteristicsIndex (SCI) proved useful for identi-fying similar schools in terms of thestudents that they served. The band ofabout 550 schools in the 25th–-35thpercentile range on the SCI in2003–04 thus became the subject ofthis study. Most of the schools in thatgroup serve high numbers of low-income and English learner students,and many have high percentages ofHispanic/Latino and/or AfricanAmerican populations. (See the boxon this page that explains the charac-teristics of the schools in the study.)
Almost half of the schools in theband participated in the study, withthe principal and at least 80% of theK–5 classroom teachers at the vastmajority of schools returning surveys.In total, 257 principals and more than 5,500 teachers participated byresponding to 350–400 survey itemson a multitude of school and districtpractices.
The survey content was first basedon a review of the research literature
E D S O U R C E R E P O R T
June 2006 ● Similar Students, Different Results: Why Do Some Schools Do Better? ● 3
© C
opyr
ight
200
6 by
EdS
ourc
e, I
nc.
● There were 550 schools with a School Characteristics Index (SCI) that fell between the 25th and35th percentiles. The schools in the study were a representative sample from this band, with bothschool and student characteristics roughly similar to those not included in the study.
● The 257 schools that participated in this study came from 145 different school districts, and 56of those districts had more than one school participate.
● About a third of the districts and more than 40% of the schools were located in the Los Angeles metro-politan area (including San Bernardino and Riverside), with the remainder of schools and districtsdistributed across the rest of Southern California, the Central Valley, and Northern California.
● A third of the schools were in elementary districts, 15% operated on year-round calendars, and 98%received Title I funding.
● In the sample, 31% of students had parents who were not high school graduates, compared to 21%of elementary students in the state as a whole.
● Comparisons of other student characteristics associated with student achievement are similar.Statewide, California’s elementary school population in 2004–05 included 32% English learners,50% Hispanics/Latinos, 8% African Americans, 29% whites, 8% Asians, and 57% low-incomestudents (based on participation in the free and reduced-priced meal program).The schools in thisstudy had higher proportions of English learners, Hispanics, and low-income students. Their totalstudent population included 42% English learners, 66% Hispanics, 8% African Americans, 15%whites, 6% Asians, and 78% low-income students. These percentages varied from school to school.
● The 2005 Growth API for the average school participating in the study was 702, with a range from569 to 821.
● On the statewide rankings from 1 to 10 for 2004 Base API, none of the sample schools ranked 10,and just 4% ranked 7 or higher. Conversely, 7% were ranked in the bottom decile. The remaining89% of schools ranked from 2–6, with the majority a 3 or 4.
About the Schools and Districts in this Study

E D S O U R C E R E P O R T
4 ● Similar Students, Different Results: Why Do Some Schools Do Better? ● June 2006
on effective schools and on high-performing, high-poverty schools.With that as the backdrop, the goalwas to explore how the nature ofelementary school practices in Califor-
nia was changing in response to standards-based reforms, particularlystate and federal accountability poli-cies. Further, we wanted to see howmuch those practices differed between
schools with high and low perform-ance based on the state’s API and towhat extent various classroom, school,and district practices might correlatewith performance.
We also were committed to askingabout “actionable items”—clear andspecific practices that other localeducators could implement. Thesurvey questions asked teachers abouttheir practices in the classroom andschoolwide, and about the role oftheir principal. Principals reported ontheir management practices and prior-ities, on the effectiveness of theteachers in their schools, and on thepolicies, practices, and expectations oftheir school districts.
The survey questions covered awide range of topic areas includingschool context, role of the principaland district, core instruction, instruc-tional strategies, assessment and data,professional development, and therespondents’ professional backgrounds.The surveys also asked specific ques-tions about kindergarten and EnglishLanguage Development (ELD)programs and instruction. (The actualsurvey instruments are posted on theEdSource website: www.edsource.org/pub_abs_simstu05.cfm)
While school-level performance,as measured by the API, was the focusof this study, we were interested in thebroader context within which schoolsoperate. We believed that the inter-relationships between classroom,school, and district practices couldhelp shed light on why some schoolsserving low-income children do somuch better than others. To that end,we asked principals several questionsabout the role of the district. As acomplement to the principal andteacher surveys, the research team also interviewed 20 school districtsuperintendents from 17 districtsthroughout California. These success-
© C
opyr
ight
200
6by
EdS
ourc
e, I
nc.
Aspects of California’s accountability system relate to this study
California Standards Tests (CSTs) and CAT/6California’s state assessment system annually tests all students in grades 2–11. At the center of thesystem are the California Standards Tests (CSTs). At the elementary level, the CSTs are primarily basedon the state’s academic content standards in English language arts and math. The state also adminis-ters a nationally normed achievement test, the California Achievement Tests, Sixth Edition Survey(CAT/6) at grades 3 and 7.
The Academic Performance Index (API)The state uses the CSTs to determine whether schools and districts have met targets for adequate yearlyprogress (AYP) as required by the No Child Left Behind Act (NCLB). In addition, they are used to calcu-late each school’s API (with, to a much lesser degree, CAT/6 test results).
The API is the cornerstone of California’s school accountability system. With rare exceptions, everyschool in California is assigned an API score between 200 and 1000 and also receives a score for each“numerically significant” subgroup of students, categorized by ethnicity and socioeconomic factors(such as poverty).
A school’s API score is used to rank it statewide among all schools of the same type (elementary,middle, and high) and to compare it to the 100 schools most like it in terms of student backgroundand other relevant factors. The state uses the School Characteristics Index (described below) for thispurpose. The state also gives each school a growth target for improving its API.
For this study, the research team chose the 2005 Growth API score as the dependent variable for meas-uring school performance. The results and findings were also analyzed against CST results averagedacross grade levels in each school and against a weighted calculation of API score growth over threeyears. The results were similar in each case.
The School Characteristics Index (SCI)The SCI enables state officials to directly compare schools that face a similar level of challenge. Thesecomparisons result in “similar school rankings” that adjust for student and school characteristics moststrongly correlated with test score performance.
At the time of this study, the student characteristics in the SCI included ethnicity, English learner status,length of school attendance at the current school (if less than a year), parent education level, andparticipation in free/reduced-priced meal programs. School characteristics in the SCI included participation in a multitrack, year-round schedule, average class sizes, and percentages of teacherswith full and emergency credentials.
Of all these factors, parent education level is most strongly correlated with student performance. Forthat reason, it is given the greatest weight in the SCI calculation.

ful district leaders were asked todiscuss the three most effective strate-gies their district employed to helpimprove student achievement at high-poverty schools. The box on this pagedescribes the results of those inter-views generally. More details aboutwhat superintendents said are scat-tered throughout this report.
Initial findings suggest that acombination of strategies is necessaryEducation researchers who havelooked at the impact of various schoolreforms on student achievementconsistently come to at least oneshared conclusion: instructionalimprovement is unlikely to result froma single policy or practice. This study’sfindings echo that important pointbut place it within the context of thestate’s standards-based reform agenda.
In the late 1990s, the state ofCalifornia began implementing a setof reforms intended to improvestudent achievement. They were builton the ideas of high academic con-tent standards, the measurement ofperformance using standardized tests,and public accountability for schoolsbased on student test results. Takentogether, those reforms appear to beaffecting schools’ instructional prac-tices. For example, nearly 100% ofthe principals and 94% of the teach-ers surveyed reported that classroominstruction in their schools is guidedby the state standards. Yet this studyalso makes it clear that the cumulativeeffect of the state’s policies on schoolpractices differs among schools. Italso identifies at least some of theattitudes and activities that set higher-performing schools apart. And itreinforces the conclusion thatimprovement within that standards-based environment is correlated withthe implementation of multipleeducational practices. (See the box,
E D S O U R C E R E P O R T
June 2006 ● Similar Students, Different Results: Why Do Some Schools Do Better? ● 5
Superintendent interviews supplemented the school surveysIn addition to surveying principals and teachers, the research team interviewed 20 school districtadministrators regarding their district’s most effective strategies for school improvement. The districtsselected for interviews all had at least two schools participating in the larger study. Beyond that, theyalso either had at least one high- and one low-performing school, or they had a school with a state APIrank of seven (the highest rank for this band of low-income schools).
During face-to-face or telephone interviews, we asked what three strategies the superintendentsconsidered most effective in improving student achievement at schools serving high percentages oflow-income students. They were also asked to describe how those strategies were implemented at theschool level. In the course of these conversations, the interviewees often mentioned a number of strate-gies beyond their top three choices. The following list is based on those most often cited as effective,but also notes what proportion of all the superintendents mentioned each strategy:
1. Data and assessment: cited as a top strategy by nine respondents and mentioned by 19.
2. Professional development: cited as a top strategy by seven superintendents and mentioned by 15.
3. Curriculum package: cited as a top strategy by five superintendents and mentioned by 18.
4. Role of the principal: cited as a top strategy by three superintendents and mentioned by 18.
5. School culture/high expectations: cited as a top strategy by three superintendents and mentionedby 15.
6. Instruction: cited as a top strategy by three superintendents and mentioned by 13.
Conducted separately from the survey and analysis, these interviews were meant to provide additionalunderstanding of the district context in which our sample schools operated. The information is qualita-tive in nature and does not represent a systematic examination of these districts or their practices.
© C
opyr
ight
200
6 by
EdS
ourc
e, I
nc.

© C
opyr
ight
200
6by
EdS
ourc
e, I
nc.
E D S O U R C E R E P O R T
6 ● Similar Students, Different Results: Why Do Some Schools Do Better? ● June 2006
Overview of the Research Process, on this page to understand how theanalysis was done.)
Within our sample of elementaryschools, certain “effective schools”domains proved to be significant indistinguishing the responses of teach-ers and principals in the highest-performing schools from those in the
lowest-performing. Those included: ● Prioritizing student achievement; ● Implementing a coherent, standards-
based instructional program; ● Using assessment data to improve
student achievement and instruc-tion; and
● Ensuring availability of instruc-tional resources.
Prioritizing student achievementThis domain examined the importanceschools and districts place on settingclear, high, and measurable expecta-tions for student achievement. Severalresearch studies over more than adecade have suggested that communi-cating such expectations has a positiveeffect. Some of that research has par-ticularly focused on high-performing,high-poverty schools. Common char-acteristics among those schools ofteninclude high expectations communi-cated in concrete ways and establishedsystems to assess regularly the progressof individual students.
This study asked both teachers andprincipals about the extent to whichtheir school and district communi-cated high expectations and tookresponsibility for student achievement.It also asked about the degree of prior-ity given by teachers, the principal, andthe district to meeting API and federaladequate yearly progress (AYP) targetsfor subgroups of students (such as byrace/ethnicity and income level).
Survey results showed that theschools with teachers and principalswho indicated higher expectations forstudents had, on average, higher APIscores than similar schools with lowerreported expectations. One aspect ofthis is a shared culture within theschool regarding the value of improv-ing student achievement and a sense ofshared responsibility for it. Theresponses in this category includedteachers and principals reporting thattheir school has a vision focused onstudent-learning outcomes and thatteachers take responsibility for and arecommitted to improving studentachievement.
Principal behaviors are also note-worthy. Teachers and principals inhigh-achieving schools were morelikely to report that the principalcommunicates a clear vision for the
Methodology● Working from the 350–400 survey items asked of teachers and principals on separate surveys, the
research team grouped sets of related practices and policies together into seven broad “effectiveschools” domains. For example, questions related to use of data were grouped together. Eachdomain was made up of several smaller clusters of related items or subdomains. In addition torunning simple correlations between all survey items and school API, the team analyzed the rela-tionship between API and each of these subdomains and domains.
● This study used multiple regression analyses—a statistical tool that identifies correlations among vari-ables in large databases. It holds constant every variable except the ones being examined to showhow those relate to each other. Student and school characteristics were included in this analysis.
● A full explanation of the research methodology used in this study is available at:www.edsource.org/pub_abs_simstu05.cfm
Interpreting the findings● The study shows four domains that are most highly correlated with higher API scores: prioritizing
student achievement, implementing a coherent, standards-based instructional program, usingassessment data, and ensuring availability of instructional resources. That does not mean thosedomains have actually caused those higher scores. Rather, it indicates that schools that reportmore strongly that they have implemented more of the practices included in each of the fourdomains have, on average, higher API scores than schools that report fewer of the practices.
● The school practices associated with these four domains tend to occur together (i.e., schools highon one domain tended to be high on others).
● Practices reflected in the other three domains—while certainly important in building social capitaland community at a school—did not show up as strongly in differentiating the lowest-performingschools from the highest in the study sample.
Overview of the Research Process
Teachers have opened themselves up to learning from each other, sharing ideas, and
expressing their need for more training to teach English learners, Special Education,
and high-needs students. The communication is open, honest, and respectful.
—A school principal

E D S O U R C E R E P O R T
June 2006 ● Similar Students, Different Results: Why Do Some Schools Do Better? ● 7
school, sets high standards for studentlearning, and makes expectations clearto teachers for meeting academicachievement goals.
The practices in this domain gobeyond a shared culture, however, tospecific expectations. Both teachersand principals at higher-performingschools reported that their school haswell-defined plans for instructionalimprovement and that they makemeeting the state’s API goals and theNo Child Left Behind AYP goals apriority. And they reported that theirschools set measurable goals forexceeding API growth targets forstudent subgroups. These principalsalso indicated that their school’sstatewide and similar schools rankingson the API influence schoolwideinstructional priorities, and theyreported that they are clear about theirdistrict’s expectations for meeting APIand AYP growth and subgroup targets.
Implementing a coherent, standards-based instructional programThis domain looked at the extent towhich a school’s curriculum andinstruction are both coherent andaligned with state standards. Thesurvey focused on the core areas ofmathematics and English languagearts. Teachers answered questionsabout the amount of time spent oneach subject, the extent to which thetwo core subjects are protected frominterruption, and whether math and
language arts are integrated with othersubjects. They also indicated whichEnglish and math curriculum pack-ages they used in their own classroomsand how frequently they used thosepackages. And teachers answered ques-tions about alignment and consistencyin curriculum and instruction, planning, and materials. Principalsanswered questions about their prac-tices and their perceptions about theschool district’s expectations related to curriculum coherence.
The findings regarding the valueof a coherent, schoolwide curriculumprogram are consistent with previousresearch. Studies of this issue goingback two decades repeatedly point to curriculum coherence within aschool—and among school staff—asbeing correlated with higher studentperformance. (For additional back-ground, see the To Learn More box onpage 20.)
In this study, teachers who work inschools that on average performedbetter were more likely to reportschoolwide instructional consistencywithin grades and curricular align-ment from grade-to-grade. The kindsof practices teachers reported usingincluded examining the scope andsequence of curriculum topics andreviewing a grade-level pacing calendarthat sets out a timeline for instruction.
Alignment with state academicstandards also appears to be reportedmore often by teachers in schools that
Of the 20 superintendents interviewed, three cited theestablishment of clear, high expectations as one of themost important factors in improving student achieve-ment over the last four years, and 12 more at leastmentioned this as a strategy their district had used.Several superintendents spoke not only of the rela-tionship between student achievement and a school’sculture of high expectations, but also about the impor-tance of holding principals and teachers responsiblefor meeting high standards. As one superintendent putit: “While we were raising expectations for children, wewere raising expectations for the adults.”
Another superintendent described the challengesschool staffs faced in this process and the extent towhich the process changed some fundamentalassumptions on the part of adults. “We had to reallylearn to accept that we were maybe dumbing down.We were teaching to the lowest student. It was atough beginning, but teachers after a while began toaccept that and say, ‘OK, I can’t keep them here. Ihave to move on. Then what instructionally do I needto do? What strategies work?’”
In one district, a key part of their strategic planningprocess was gaining broad-based buy-in for reforms.The superintendent noted that the plan—which heldeveryone responsible for improving student achieve-ment—had “a clear expectation that starts very muchat the top.”
Another district established a “superintendent’s advisory council,” made up of “key teachers andadministrators from all the schools.” Monthly meet-ings improved the district’s understanding of howstrategies and policies were being implementedinside classrooms as well as what support anddevelopment teachers and principals needed. Theyalso helped the district build a sense of communityin which everyone participated in the conversationregarding student achievement.
© C
opyr
ight
200
6 by
EdS
ourc
e, I
nc.
I think the answer lies in the personnel: I mean the principal and the teachers doing
what they need to do for children, using the data, implementing the programs. I use the
word ‘relentless’ a lot. They’ve got to be relentless about not accepting anything but
learning from the children. They’re not going to let the children fail; they’re going to
make them learn.
— A superintendent
“ ”superintendents say:
High expectations are part of adistrict culture.
are, on average, higher-performing.This includes classroom instructionbeing guided by state academic stan-dards and schools having identifiedessential standards. Teachers also reportthat the school’s curriculum materialsin math and English are aligned withstate standards and that they frequentlymap state curriculum standards ontotheir classroom lesson plans.
District actions, as reported byboth teachers and principals, alsoappear to have some relationship tostudent performance. For example,teachers at higher-performing schoolsmore often report that their districtaddresses the instructional needs of English learners at their school. Principals who reported a strongdistrict role in this domain are alsofrom higher-performing elementaryschools. These principals said thedistrict has a coherent, grade-by-grade curriculum for all schools andexpects the principal to ensure imple-mentation of the curriculum. Theseprincipals report that the district hasclear expectations for studentperformance aligned with theadopted curriculum and that it evalu-ates the principal based on the extentto which instruction in the schoolalso aligns.
Using assessment data to improvestudent achievement and instructionThe use of data by teachers, princi-pals, and districts was perhaps themost intensively examined domain inour study, at least in terms of thenumber of survey questions. Underthe general topic of data and assess-
ment, questions addressed the types ofassessment data teachers and princi-pals received, as well as how they usedthese data. We categorized the types ofassessments as follows:● CST and CAT/6 assessment data,
the state’s standardized tests admin-istered each spring.
● CELDT (California English Lan-guage Development Test), an annualassessment of English learners.
● Curriculum program assessments.● District-developed assessments.● Other commercial assessments.● Assessments created by individuals
in a school.Teachers’ responses were organized
based on 1) the frequency with whichthey reviewed assessment data gener-ally, and 2) the extent to which theyused the specific data types to monitorstudent performance and inform theirinstruction.
The analysis of principals’responses reflected different ques-tions, including their use of specifictypes of assessments and the extent towhich they used each type to monitorachievement, address student progress,inform schoolwide instructionalstrategies, and monitor and evaluateteacher instructional practices. Prin-cipals were also asked about theinfluence of district expectations forimproving student achievement, andabout incentives and activities specifi-cally targeted at raising CST andCAT/6 scores.
Both principals and teachers alsoresponded to a set of questions aboutthe extent to which they addressedstudent achievement by subgroup.
E D S O U R C E R E P O R T
[W]e adopted one language arts program for K–8,and that was a major accomplishment....
Plus, if the district has common expectations...uses a common textbook and common
assessments, you can design professional development for everybody.
—A superintendent
Overall, 18 superintendents out of 20 mentioned theuse of a curriculum package as a strategy they usedto improve student achievement. Five ranked thisamong their most important strategies.
Several district superintendents said that curriculumprograms ensured instructional consistency in theirschools. As one noted: “In the past, every singleschool could have a different instructional programfor language arts. Some taught phonics, some didn’t;some used whole language, some didn’t.”
Another administrator said that prior to the imple-mentation of its new curriculum program, the districtwas “less than organized or effective in providing acomprehensive, consistent reading program to ourstudents. It was probably far too hit-and-miss,depending on teachers and schools.”
The superintendents’ comments also conveyed atension between strict adherence to a curriculumprogram and adapting instruction to meet studentneeds. Some emphasized their belief that uniformimplementation was crucial. Others supportedgiving teachers some flexibility and described howthat had occurred in a deliberate way. For somedistricts, pacing plans were a key strategy, givingthe district an effective way to monitor and assesshow teachers implement specific curriculum strate-gies to develop specific student skills. Here too,however, districts seemed to differ in their use andreliance on a pacing plan and on the extent towhich they altered that plan based on school-levelfeedback.
“”
superintendents say:
A districtwide curriculum adoptionis important, but implementationvaries.
8 ● Similar Students, Different Results: Why Do Some Schools Do Better? ● June 2006
© C
opyr
ight
200
6by
EdS
ourc
e, I
nc.
A substantial amount of researchon the use of assessment data—and itsrelationship to student achievement—has been conducted since 2000. Muchof this work has focused on imple-mentation issues related to high-stakestesting and on teachers’ use of data toinform their instruction.
This study, by contrast, shed morelight on how principals and schooldistrict officials are using studentassessment data. One practice thatshowed a strong positive correlationwith API scores among our sample ofelementary schools was the extensiveuse of student assessment data by thedistrict and the principal in an effortto improve instruction and studentlearning. As an example, principalsfrom better-performing schools more often reported that they and the district use assessment data from multiple sources—curriculumprogram and other commercial assess-ments, district-developed assessments,and the CSTs and CAT/6—to evalu-ate teachers’ practices and to identifyteachers who need instructionalimprovement. They also reportedfrequently and personally using assess-ment data to address the academicneeds of students in their schools,including using this data to developstrategies to help selected studentsreach goals and to follow up on theirprogress. In addition, they review thisdata frequently both independentlyand with individual teachers.
These same principals reported aclear understanding of their district’sexpectations for improving studentachievement. They said that theirdistricts expect that all schools willimprove student achievement andevaluate principals based upon that.The principals reported that thedistrict also provides support for site-level planning related to improvingachievement.
In schools where assessment datafrom the CSTs and CAT/6 influenceschoolwide attention to improvingstudent achievement, the API scorealso tends to be higher. Teachers inthese schools reported receiving CSTand CAT/6 test data in a variety offormats: for all students in their grade
level; disaggregated by specific skillsfor all students in their classrooms; anddisaggregated by student subgroup forstudents in their classrooms. Principalsreported using the CST and CAT/6data for the following purposes:● To examine schoolwide instruc-
tional issues;
E D S O U R C E R E P O R T
June 2006 ● Similar Students, Different Results: Why Do Some Schools Do Better? ● 9
© C
opyr
ight
200
6 by
EdS
ourc
e, I
nc.
We moved to a standards-based curriculum with assessments tied to our report card.
This led to pacing schedules, structured conversations about instructional strategies
and student performances, and targeted achievement goals for the entire school,
classrooms, and individual students.
—A principal
One of the strongest initial findings in this study was a correlation between a school’s API score andhaving a coherent curriculum and instructional program. Among the questions teachers were askedwas one regarding which curriculum programs they use in their classroom and how often. When thedata were analyzed, it appeared that the choice of curriculum program correlated with API.
An extended regression analysis again held constant for student demographics and included a morespecific definition of intensity of usage. That analysis found that for English language arts, using theOpen Court curriculum program schoolwide appeared to distinguish between higher- and lower-performing schools.* The analysis found that while high-intensity use of Open Court mattered (i.e., allteachers in the school reported using Open Court daily), not all schools using Open Court intensivelywere higher-performing. Open Court appeared to be most effective when it was:
● combined with a coherent, schoolwide, standards-based instructional program; and
● combined with the frequent use of student assessment data to improve instruction.
Open Court is one of two main English language arts curriculum packages currently approved by theState Board of Education. It was used as the primary English curriculum program by only one-fourth(72) of the schools in the study’s sample. But in 80% of those 72 schools, all teachers in the schoolreported using it daily. Most of the remaining schools in the sample said they used Houghton Mifflinfor reading, with about two-thirds classified as high-intensity users but just one-third having all teach-ers reporting daily use. Some schools using Houghton Mifflin were also among the highest-performing.
Teachers were also asked about the math curriculum that they used. In our sample, several differentmath curriculum programs appear to be in use, and relatively small percentages of teachers reportusing any one program daily. The analysis did not establish an association between the use of a specific math program and school API.
Findings on use of curriculum packages prompt extended analysis
*EdSource is not affiliated in any way with any particular publisher. Neither EdSource nor this study in any way endorses one particular curriculum program over another, or one publisher over another.

E D S O U R C E R E P O R T
10 ● Similar Students, Different Results: Why Do Some Schools Do Better? ● June 2006
● To develop strategies for movingstudents from “below basic” and“basic” to “proficient”;
● To compare grades within theschool;
● To identify struggling students andevaluate their progress; and
● To inform and communicate withparents.(Note that test performance levels
are labeled “far below basic, belowbasic, basic, proficient, and advanced,”with the statewide goal of all studentsachieving at least “proficient” in eachsubject tested.)
Ensuring the availability of instructionalresourcesSchool-level financial data are notavailable in California. As a result, thestudy could not look at financialrecords, such as expenditures, as partof its examination of schools’ instruc-tional resources. Instead, we defined“resources” broadly to include person-nel, their qualifications, and theavailability of decent facilities andadequate textbooks.
This research domain includedsurvey data on the credentials andexperience of educators plus teachers’responses on the availability of class-room materials. We also consideredprincipals’ perceptions of a number ofdifferent types of resources, includingmost notably the skills, knowledge,and attitudes of the teaching staff atthe school. Principals were also askedabout the extent to which the district
provides support for facilities andinstructional materials, any provisionof longer school day or year, and theschool’s access to qualified supportpersonnel.
Most education experts agree thatteacher quality is central to studentachievement. However, researchersexploring this question struggle withhow to define teacher quality, oftensettling for those attributes most easilymeasured, namely teachers’ years ofexperience and credentials. Thoseaspects of teacher quality were amongthe factors examined in this study. Thefindings indicate that the schoolswhere more teachers reported havingregular or standard certificates forCalifornia also had, on average, higherAPI scores. Years of educator experi-ence also mattered. Teachers fromschools with higher APIs were morelikely to have at least five years of full-time teaching experience. Principals’years of experience also correlatedwith higher school achievement.
For another perspective on teacherquality, the survey asked principals toindicate the extent to which theirschool’s teaching staff possessed someless often measured and less easily quan-tified characteristics. API performancewas on average higher in the schoolswhere principals reported that a largerproportion of their teaching staff hadthe following qualities (the most signif-icant ones are listed first and so on):● demonstrated ability to raise stu-
dent achievement,
When we’ve gotten negative data, we have started being transparent about it and kind
of really publicizing it…folks actually respect the fact that we’re out front and open.
—A superintendent
I’ve met individually and by grade level with teachers to review data, conduct
professional conversations based on student data, and set instructional priorities.
—A principal
All but one of the 20 superintendents interviewedmentioned “use of data and assessment” in explainingtheir strategies to improve student achievement. Ninesaw it as one of the most important strategies they hadimplemented over the last four years. Several said theyhad created data analysis positions and hired addi-tional personnel to help school staffs understand andapply assessment results. For the most part, however,these superintendent comments did not focus on theevaluative or summative assessment data providedthrough the state testing system, but rather on forma-tive assessments—tests used to evaluate ongoingstudent progress and inform classroom instruction.
One superintendent described how the strong principalsin the district worked with teachers to analyze the resultsof reading assessments given every six weeks. The prin-cipals sit down with grade-level teams of teachers toanalyze how their students did collectively and individu-ally.The goal is not to accuse anyone but to look at whatcan be learned from students’ performance. The teach-ers whose students do well on one skill or another sharethe practices that seem to be successful.
Another superintendent described a process,adopted from other research, that uses a “pyramid ofintervention. ...You ask three critical questions: Whathas the student learned? How do I know that thestudent has learned it? And what do I do if thestudent hasn’t learned it? That basically focuses ourdistrict’s whole instructional program. What it meansis that you make data-driven instructional decisions.”
Many of these district officials placed particular em-phasis on the ways that principals, and by extensionteachers, evaluated and worked with student subgroupdata. Some said their district had provided specificprofessional development for principals toward that end.
“”
superintendents say:
Districts have developed expertiseat using assessment data toimprove student achievement and instruction.
© C
opyr
ight
200
6by
EdS
ourc
e, I
nc.

● strong content knowledge,● good fit with the school culture,● training in curriculum programs,● ability to map curriculum standards
to instruction,● supportive of colleagues’ learning
and improvement,● able to use data from student
assessments,● familiar with the school community,● excited about teaching, and● familiar with state standards.
Principals responded to a variety ofother questions related to the resourcestheir district makes available to theirschool. Those more likely to be fromhigh-performing schools more often
said their districts ensure that the schoolhas up-to-date instructional materials,support to provide supplementaryinstruction for struggling students, andenough instructional materials for allstudents. The same was true for teacherswho tended to confirm these percep-tions, reporting that every student intheir classroom has a copy of thecurrent version of the textbook inlanguage arts and math and that theprincipal ensures that the teachers haveadequate classroom materials. The principals also reported a strong under-standing of what their district expectedfrom them in terms of facilities upkeepand management and that their districtprovided adequate support in the areaof facilities management.
Three additional domains showedweaker correlations with API The study included three additionaldomains that, while positively corre-
lated with API scores, were not nearlyas strong as the other four domains indifferentiating lower- from higher-performing schools. Interestingly,these three share a common thread—they are all domains that tend tocontribute to the social capital at aschool, the positive interactionsbetween students, teachers, parents,and principals that help a school createa sense of community. These thingsare clearly important to supporting apositive learning environment, but thisstudy suggests that they are less powerful in explaining what thehigher-performing schools do differ-ently from the lower-performing ones.
Enforcing high expectations forstudent behavior A substantial body of research since1990 has characterized a positiveschool climate as a basic building blockfor school effectiveness, particularly inhigh-performing, high-poverty schools.An important component of that is anordered and disciplined environment.More recently some researchers havehighlighted the vital role the schoolprincipal plays in this regard.
In this research study, the examin-ation of order and discipline waslimited to questions about the school’sestablishment and enforcement ofpolicies related to student behavior.Both principals and teachers reportedon the extent to which the schoolcreated an orderly and positive en-vironment for student learning,including such areas as attendancepolicies, enforcement of rules, andrespect for cultural differences. A
E D S O U R C E R E P O R T
June 2006 ● Similar Students, Different Results: Why Do Some Schools Do Better? ● 11
Our district supported significant staff changes at our school through transfer,
resignation, and retirement.
—A principal
The superintendents interviewed spoke at lengthabout the relationship between an effective principaland the quality of teaching that occurs at a school. Inparticular, they connected the attributes of theschool leader to the type of staff they are able todevelop at a school.
One official said the district looked for principals who“knew instruction and knew how to facilitate reform,but could do it while sustaining relationships withtheir staff.” As another noted, while “knowledge ofinstruction” is essential, principals also have to “beable to motivate staff. They have to be able to getstaff on board. They have to be strong enough tomonitor and make the tough calls and to correctwhere they need to.”
Several superintendents remarked that their mosteffective principals frequently spent time in class-rooms working directly with teachers. To improveinstruction, principals must spend “a great deal oftime observing, monitoring, giving feedback so thatthey can really be responsive to the needs of ourteachers,” according to one official. Yet effective principals do not need to be dictatorial. Instead they“evaluate their own practice and lead discussionsabout their practice in an evaluative way for continu-ous learning and continuous improvement ratherthan blame.”
“”
superintendents say:
Principal leadership and management are keys to building astrong teaching staff at a school.
© C
opyr
ight
200
6 by
EdS
ourc
e, I
nc.

E D S O U R C E R E P O R T
12 ● Similar Students, Different Results: Why Do Some Schools Do Better? ● June 2006
simple tabulation of the surveyresponses as a whole shows that therespondents, and particularly the prin-cipals, were predominantly positive onthese questions. Depending on thequestion, between 70% and 90% ofteachers and more than 90% of prin-cipals agreed that each was effectivelyin place at their schools.
Because this study was looking forthe practices that differentiate high-from low-performing schools, thisrelative unanimity could explain whythis domain did not show up stronglyin the analysis. The responses suggestthat high expectations for studentbehavior are important at most of theschools in the study, regardless of theiracademic performance.
Involving and supporting parentsParent involvement has also been seenby at least some researchers as a neces-sary but not sufficient component of effective schools. Measuring thisparticular aspect of schooling, how-ever, requires clearly defining whichaspects of parent involvement are ofinterest. For example, volunteering atschool and helping with homeworkare both aspects of parent involve-ment, but each is measured differentlyand has a different relationship tostudent achievement. Some recent re-search indicates that involving parentsin student learning is particularlyimportant for student achievement.
For this study, the domain relatedto involving parents included subdo-mains that looked broadly at just twoaspects of this complex subject: theschool’s active engagement with
parents and its support of parents andfamilies. The 29 questions included inthe surveys did not ask about numbersof parents involved or the number ofhours they volunteered. Instead, teach-ers were asked about: 1) their practicesinvolving parents in students’ educa-tion; 2) the district’s success inbuilding the community’s confidencein the school; and 3) the principal’srelationship with parents.
Principal questions were morecomprehensive. They included theextent to which the school: 1) involvedparents in students’ education throughmechanisms such as parent-teacherconferences, schoolwide events, andtranslators for non-English speakingparents; 2) worked to engage parents inschoolwide decisions and activities; and3) provided support services to parentsand families, including English as aSecond Language (ESL) classes, healthservices, and assistance programs.
For the elementary schools in oursample, all of which serve low-incomefamilies, practices designed to involvethe parents in their children’s educa-tion were more positively correlatedwith higher school performance than were other efforts to include parents.Examples of these practices were thefrequency of special subject-areaevents (like math or English languagearts workshops) held at a school andthe frequency with which parentsprovided instructional support inclassrooms.
More generally, a positive correla-tion also emerged for schools withteachers that reported most stronglythat their district builds the commu-
nity’s confidence in the school andtheir principal builds strong relation-ships with parents.
These findings may suggest that atschools serving low-income childrenand families, parent involvementstrategies should be centered on theschool’s instructional program andthe child’s progress. This approachcould be seen as naturally comple-mentary to the four practices thatcorrelated most positively with schoolperformance. All four have studentlearning and academic achievement astheir focus.
Encouraging teacher collaboration andproviding professional developmentThis domain examined three differentareas related to the professional envi-ronment in the school and looked at awide range of activities by teachers,principals, and districts. The threeareas were: 1) teacher collaborationand professionalism; 2) professionaldevelopment; and 3) the hiring, evalu-ation, and firing of teachers. This areaof questioning largely focused on howschools go about hiring and developinga capable teaching staff, while theresources domain noted above askedabout the presence of capable teachers.
Research into the ways that teach-ers interact and the effect of thatinteraction on student learning goesback to at least the early 1980s. Thebody of research is complex, raisingquestions about both positive andnegative aspects of teacher collabora-tion and the challenges involved indeveloping a professional communityin which that interaction leads toimproved student performance.
Within this study, the topics ofteacher collaboration and profession-alism were addressed with surveyquestions that looked at the extent towhich teachers felt they had influenceover schoolwide decisions. It also
© C
opyr
ight
200
6by
EdS
ourc
e, I
nc.
We make it extremely difficult to get a job here. We say we’re going to see 1,000
teachers to find 100, and we do. We’re going to be very, very picky because we know
that’s what makes a difference.
—A superintendent

asked teachers and principals aboutopportunities for teacher collabora-tion on curriculum and instruction,including for English learner students;their perceptions that teacher pro-fessionalism was supported andencouraged within the school and bythe district; and the extent to whichthey experienced a continuous learn-ing environment.
Much of the research regardingprofessional development, on theother hand, has largely focused onwhich program characteristics aremost important in providing high-quality professional developmentthat will lead to increased studentachievement. Consistency and a focuson subject-matter content are oftencited as particularly important. Mostof this research has been done in thepast decade.
The second strand in this domainrelated to the development of educatorcapacity through professional develop-ment. A particular focus of the surveywas on the adequacy, influence, andvalue of a large number of differentteacher professional developmentopportunities, including training linkedto standards generally, specific curricu-lum programs, instructional strategies,the use of data to inform instruction,and noninstructional issues. Teacherswere also asked about their participa-tion in coaching and modelingactivities. Principals answered questionsabout the professional developmentopportunities their district provided toteachers and to them personally, andthe value they ascribed to the latter.
Finally, the study explored theprincipals’ perspectives on the hiring,evaluation, and firing of the teachingstaff at their school. Principals wereasked about their district’s success inbuilding and maintaining a strongteaching staff and their own capacityto evaluate teacher performance. They
also answered questions about theirability to hire and remove teachers,including district and school factorsthat influence that ability.
Again, while this domain as awhole was positively correlated withAPI scores for the schools in the study,the relationship between professionaldevelopment and API was relativelyweak. This stands in contrast to theemphasis we heard in our interviewswith the 20 superintendents. Many of them characterized professional development as a key strategy forinstructional improvement. Onepossible explanation for this discon-nect may be that the survey questionsabout professional developmentincluded in this domain were moregeneral in nature rather than beingclosely aligned with the domains wefound to be significant, such as use ofdata and instructional program imple-mentation. Thus, they may not havecaptured the specific activities superin-tendents had in mind.
Another view of the findings reveals strong vertical alignment of expectations and accountability Our research analysis examined the re-lationship of various “effective schools”practices to school API scores. Anotherway to look at the findings is to identifywhich actors at which levels of thesystem are involved in implementingeach of these practices. While the focusof this study was at the school level, theresults provided some evidence aboutthe relationship between school districtpractices and school performance. Theresults also helped illuminate thechanging role of the principal as theconduit between district and classroomand as a central player in the achieve-ment of that vertical alignment.
It appears that in schools withhigher APIs, both principals andteachers are more likely to report prac-
E D S O U R C E R E P O R T
June 2006 ● Similar Students, Different Results: Why Do Some Schools Do Better? ● 13
The superintendents we interviewed expressed astrong belief that their professional developmentefforts were central to their ability to translate thestate’s achievement goals into district expectations,school implementation, and ultimately to changes inclassroom instruction. Overall, seven of the 20 super-intendents cited professional development as a keystrategy, and another eight mentioned it as some-thing they had implemented.
Several superintendents saw professional develop-ment as significant for improving instruction andstudent achievement because it directly affectedclassroom teaching. One said that extensive profes-sional development gave teachers “tool kits ofstrategies” that they “can pull out whenever theyneed it for whatever kind of lesson they’re using.”
Several districts used coaches to help drive profes-sional development into the classroom. Onesuperintendent mentioned training coaches onspecific content, ensuring that they were able to“really get into the classrooms, work with grade-levelteams, influence instruction, and assist teachers whoaren’t able to do the work.” This district also “pulled[all coaches] out on a monthly basis for a full day oftraining” to help them meet teachers’ needs. Anothersuperintendent said that after moving to a newcurriculum, the district used coaches to help teach-ers with various tasks, such as “pacing and buildinglesson plans” and creating lessons “centered aroundthe learner.”
“ ”superintendents say:
Professional development is the keyto changing classroom practice.
© C
opyr
ight
200
6 by
EdS
ourc
e, I
nc.

E D S O U R C E R E P O R T
14 ● Similar Students, Different Results: Why Do Some Schools Do Better? ● June 2006
tices that indicate: 1) strong districtleadership and support aimed atimproved student achievement; 2) aredefinition of principal leadershiptargeted at the evaluation andimprovement of school and studentprogress; and 3) teachers who takeresponsibility for student achievementbased on state standards. Takentogether, these examples suggest astrong vertical alignment between theactions of district leaders, school prin-cipals, and classroom teachers. Allappear to share similar high expecta-tions for student performance and tocollectively stress adult accountabilityfor meeting those expectations.
The superintendent interviewsfurther reinforced these generalimpressions. They also made clear theextent to which the selected districts,all of which had high-performingschools, were actively engaged intrying to improve both classroompractice and principal leadershipthrough an alignment of expectationsand practice.
While the study was not designedto directly examine the influence ofdistrict policies, principals at high-performing schools tended to perceivemany aspects of their district’s roledifferently from principals at low-performing schools. Based onprincipals’ survey responses, it appearsthat districts may actively contributeto a higher API at these elementaryschools in a variety of ways related tostandards-based reform. Specifically,principals at high-performing schoolssaid their districts were clear in theirexpectations that schools meet boththe API and AYP growth targets forthe school as a whole and forsubgroups. They ensured that theschool curricula in math and languagearts were aligned with state stan- dards and that instruction was focused on student achievement. Principal
responses also suggest that there maybe a relationship between API per-formance and the extent to which thedistrict provided schools with studentachievement data and evaluated princi-pal performance and teacher practicesbased on that data.
The Initial Findings also appear toreinforce a wealth of research thatpoints to the school principal as thecrucial actor in the effectiveness of aschool. In general, researchers havefound that schools with good leader-ship are more likely to have pervasiveand sustained student learning. Morespecifically, research indicates thatprincipals in effective schools usemeasurable goals to establish a cultureof achievement, create a collectivesense of responsibility for schoolimprovement, and act as models ofinstructional leadership. In addition,they are persistent and innovative inobtaining resources to serve students.
Among the schools included in thisstudy, API scores were generally higherin schools with principals whoseresponses indicate that they act asmanagers of school improvement,driving the reform process and culti-vating a strong school vision. Inparticular, they were more likely toembrace the state’s academic standardsand to ensure that classroom instruc-tion was based on them. Theyprioritized meeting and exceeding stateand federal accountability targets forschool performance. In addition, theyreported personally and extensivelyusing student data for instructionalmanagement purposes— not only toevaluate the progress of students, butalso to examine schoolwide and teacherpractices, develop strategies to helpselected students reach goals, and iden-tify teachers who need instructionalimprovement. Finally, they ensuredthat teachers and students hadadequate texts and classroom materials.
The superintendents placed substantial emphasis onschool principals and their role, with 18 out of the 20superintendents mentioning it. Three superinten-dents ranked principal leadership among the mostimportant factors in improving student achievementover the last four years. They said that effective prin-cipals drove reform, held high expectations forstudent achievement, and provided instructionalleadership and guidance.
Their remarks also revealed the influence of districtpractices on the way principals do their jobs. Forexample, several superintendents spoke of efforts totransform the role and responsibilities of the princi-pal. One district had previously hired principals“based upon their operational knowledge and skills.”However, as demands of accountability requiredsharp improvements in student achievement, thedistrict’s notion of an effective principal evolved.“[The principal has to] know instruction, ... leadinstruction, and ... make sure that instruction is goodin classrooms.” Another superintendent said princi-pals were expected to have a clear “vision for theirschool. They have to have an idea of where [they]want to go by the end of the year and how to bring theschool along as a learning organization.” Yet anothernoted that in order for principals to be effective,“they’ve got to know that their supervisor supportsthem and is there backing them up.”
District officials mentioned the value of principalsacting as instructional leaders by knowing “what goodinstruction looks like and…what to expect.” Anotherofficial mentioned the role of the principal in ensuringthat a “school’s instructional program [is] focused onthose standards and the articulation between thestandards and what happens in each classroom.”
“ ”superintendents say:
District practices and support canstrengthen principal leadership.
© C
opyr
ight
200
6by
EdS
ourc
e, I
nc.

E D S O U R C E R E P O R T
June 2006 ● Similar Students, Different Results: Why Do Some Schools Do Better? ● 15
Teachers in schools with higherAPIs indicate that they are more likely totake responsibility for student achieve-ment, again as achievement is defined bythe state’s academic standards. Theyreport using the standards for guidinginstruction and ensuring curriculum andinstruction alignment within and acrossgrades. They also say that they are welltrained in standards-based instruction.These teachers are also more likely toreceive data from the state’s annualassessments (CSTs and CAT/6).
This study offers implications for policy and practice, including “staying the course” with standards-based reformIn the course of this study, EdSourceand its research partners from Stan-ford University, UC–Berkeley, andAmerican Institutes for Research gath-ered extensive data on the practicesand policies of elementary schools inCalifornia that serve high numbers oflow-income and English learnerstudents. The goal of this effort was toidentify the practices that set the highest-performing schools apartfrom the lowest-performing ones.Since the release of the Initial Findingsin October 2005 and the furtheranalysis on curriculum package choicein April 2006, many people haveasked us to articulate more specificallythe practices reported by these schoolsand the implications of our findings.
The first consideration in doing sois the larger policy context in which theelementary schools in our sample havebeen operating. The years since Cali-fornia adopted K–12 academic
content standards for its public schoolsin the late 1990s have been tumul-tuous and challenging for educationleaders in schools, school districts, andstate-level positions. Part of a nationalmovement in school reform, the adop-tion of standards was a watershedevent for California that paved the wayfor a new state assessment system andnew methods of holding schoolsaccountable based on those tests.These changes have taken time andhave represented difficult work intel-lectually as well as politically.
The findings from this study indi-cate that many of the policies andpractices that have accompanied standards-based reform in Californiaare correlated with improvement inachievement at schools with highproportions of low-income students.We believe that the overarchingmessage from the findings is that statepolicymakers and local educators needto stay the course in terms of explicitexpectations for student achievementand a process of public accountabilitythat keeps those expectations at theforefront of schools’ efforts.
Aligning school and district instructionwith the state’s high expectations is amultifaceted challengeFor educators and local communities,a central message of the study is thatschool practices and policies can makea difference in the achievement of low-income students. Some schools clearlydo a much better job of enabling theirstudents to learn the state’s grade-by-grade academic content standardsthan do other schools, regardless of
There isn’t an elementary principal in this district who doesn’t know what’s expected
of them, what their work plan needs to have, ... and what’s going to happen when my
deputy superintendent and I do tours of that campus.They know what we’re looking for.
—A superintendent
In discussing professional development, the super-intendents also reinforced the idea of verticalalignment. These superintendents characterizedeffective professional development as a strategy thatstarts with the district but has a tangible impact allthe way down to the classroom. One mentioned theimportance of professional development that was“extremely focused and sustained” at the “districtlevel, at the principal level, at the teacher level, andat the paraprofessional levels.”
Another noted that a district needs to ensure thatteachers are using programs “the way they weredesigned to be used; and if not, that’s a good placeto start. Make sure that you go back and retrain yourteachers. Oftentimes you adopt a new reading text,you do the publisher’s training, give them the book,and assume everybody’s using it the way it’s sup-posed to be. We found that is not the case.”
The superintendents also acknowledged thecomplexity of providing professional developmentthat teachers were able to incorporate into their daily practice. Several said they adopted a “chain-of-command” approach with coaches, principals, andteachers. One district first provided professionaldevelopment to principals and coaches, who werethen responsible for “training the teachers in a mean-ingful way.” The district also trained district officeadministrators, ensuring that they were able tosupport and monitor the coaches’ work at the schoolto ensure implementation.
“”
superintendents say:
Districts use professional development to align instructionwith expectations.
© C
opyr
ight
200
6 by
EdS
ourc
e, I
nc.

E D S O U R C E R E P O R T
16 ● Similar Students, Different Results: Why Do Some Schools Do Better? ● June 2006
student demographics. The findingsshowed some specific things schoolsdo that can help explain the 250-pointdifference in API among schools serv-ing very similar groups of students.
A shared culture that makes studentachievement a top priority canimprove performance The need to focus on student achieve-ment may seem self-evident, but K–12educators, community opinion leaders,and parents often struggle to balancehigh expectations for academic achieve-ment in the core subjects of math andEnglish language arts with other goalsof schooling, such as socialization, artsinstruction, exploratory learning, civicresponsibility, and student healthissues. This tension, which can befound at all grade levels, can be par-ticularly poignant when educatorsconfront the many student needs at theelementary level. Educators know,however, that learning the core subjectswell is critical for the future schoolsuccess of their students, particularlythose who face challenges due to familycircumstances.
This study found that staffs at thehigher-API schools in our sample weremore likely to report a variety of prac-tices aimed at making studentachievement a shared priority andresponsibility. These schools had ashared culture of student achievementthat seems to permeate the work ofteachers and principals and is stronglysupported—if not demanded—byschool district officials. The specificpractices they reported are reflected inthe box to the left. Through thesepractices, the schools expressed theircommitment to measuring and im-proving student achievement based onthe state’s academic standards andactively using curricula and instruc-tional processes toward that goal.Further, their school districts appear
All express a commitment to student achievement on the state’s standards, coupled with specificpractices to support that goal.
● School sets measurable goals for exceeding the mandated API student subgroup growth targets.
● School uses statewide and similar schools API rankings to influence instructional improvement.
● Teachers ensure that curriculum and instructional materials are aligned closely with stateacademic standards by frequently mapping those standards onto weekly lesson plans.
● Teachers ensure instructional consistency within grades by using a grade-level pacing calendar.
● Teachers ensure curricular alignment from grade to grade by examining the scope and sequence ofcurriculum topics.
● School uses curriculum programs that, among other qualities, support ease of teacher implemen-tation of curriculum coherence.
● Principals and teachers have access to CST data in a variety of formats: for all students in theirgrade level; disaggregated by specific skills for all students in their classrooms; and disaggregatedby student subgroup for students in their classrooms.
● Principals frequently review, discuss, and use student assessment data from multiple sources—annual CSTs, regular curriculum program diagnostic tests, teacher- and district-developed tests to: ● address with teachers the academic needs of students;
● develop strategies to help selected students reach goals (moving them from below basic to basicto proficient) and to follow up on their progress;
● examine schoolwide instructional issues and compare grades within a school;
● evaluate teacher practices and identify teachers needing instructional improvement.
● School ensures that every student has a copy of the current English language arts and math textbooks.
Principals report that their districts have the same intense focus, saying the district:
● Has a coherent grade-by-grade curriculum that it uses for all schools, and the district expects theprincipal to ensure implementation of the curriculum.
● Has clear expectations for student performance aligned with the district’s adopted curriculum andevaluates the principal based on the extent to which instruction in the school aligns with thecurriculum.
● Makes it clear it expects that all schools will improve student achievement and that schools willmeet their API and AYP growth and subgroup targets.
● Provides schools with student achievement data.
● Evaluates the principal based upon improved student achievement and uses student achievementdata to evaluate teachers’ practices.
● Provides support for site-level planning related to improving achievement.
● Ensures that the school has up-to-date instructional materials, support to provide supplementaryinstruction for struggling students, enough instructional materials for all students, and support forfacilities management.
In schools with higher API scores, it is more likely:
© C
opyr
ight
200
6by
EdS
ourc
e, I
nc.

E D S O U R C E R E P O R T
June 2006 ● Similar Students, Different Results: Why Do Some Schools Do Better? ● 17
to be taking actions that reinforce thiscommitment and support the capacityof both principals and teachers tomeet their goals.
The skills and capacity of educatorsmake an important difference Raising student achievement in Cali-fornia at the same time that thestudent population is becomingincreasingly challenged by languageand poverty barriers requires a greatdeal of focused, hard work. The mainfindings of this study make this clear.
Interviews with 20 superintendentsfurther suggest that the solution, in theirview, may also require actions beyondthe kinds of support and accountabilityoutlined by principals in their surveyresponses. These superintendents saidthat improved student learning also callsfor a hard-nosed focus on hiring andtraining the best possible principals andteachers. In other words, people makethe difference, and those people need tohave the knowledge and capacity to dothis challenging work. This dovetailswith the study finding from surveyresponses that principals are more likelyto be in schools with higher APIs ifthey reported that their teaching staff: ● Has a demonstrated ability to raise
student achievement; ● Is knowledgeable about the state’s
academic standards; ● Has strong content knowledge; ● Has been trained in the curriculum
and instructional program; ● Knows how to map standards to
instruction; and● Is able to use data from student
assessments. None of these skills comes auto-
matically with a teaching credential. Itis likely that strong professional devel-opment programs can help teachersdevelop these kinds of skills andcontent knowledge. Another implica-tion relates to distribution of teachers
among schools within a district. Allthe schools in our sample served highpercentages of low-income students,but the schools with higher APIs weremore likely to have strong teachingstaffs, according to the school princi-pals. District programs and policiesthat deliberately and strategicallybuild strong teaching staffs at allschools, but particularly at those serv-ing low-income students, will make an important contribution to thoseschools’ capacity to improve studentachievement. Equally important is adistrict’s selection of school principalswho come to the job well-qualifiedand who receive appropriate supportand professional development.
Increasingly, researchers and policy-makers are recognizing the important
role school districts play in providing theleadership and accountability needed forteachers and principals to realize their fullprofessional potential. To work effec-tively, districts in turn need state policiesthat support their leadership while hold-ing them accountable for improvement intheir schools. They also need rationalstate accountability policies that are easyto understand and explain, plus curricu-lum materials that help them align all the necessary components and practicesof school reform. Finally, they needresources, policy, and technical supportto ensure that they can retain a high levelof dedicated professional expertise at thedistrict level. It takes qualified districtpersonnel to effectively focus fundingand resources on student achievement, toidentify and implement high-quality
In the survey, both principals and teachers were asked if they received student assessment data disag-gregated by student subgroup. One finding was that teachers in schools with higher API scores weremore likely to report that they received CST and CAT/6 data disaggregated by student subgroup.
A simple tabulation of the principal and teacher survey responses to questions about subgroup datasheds some additional light on the availability of this data, even though it cannot be assumed that thevariation in responses correlates with API performance.
That tabulation shows that among the 257 school principals who responded, the vast majority (91%)said they received CAT-6/CST data disaggregated by subgroup. By contrast however, only 35% of allteachers in the sample reported receiving the same data for their classrooms.
In light of this combination of information, school district and site leaders might find that making sureall teachers have access to student subgroup data would be worthwhile.The state ensures that districtsreceive subgroup data at the school level, but districts have to invest time and effort to disaggregatethe data down to the classroom level.
School districts and state policymakers may want to evaluate theavailability to teachers of assessment data by student subgroup
© C
opyr
ight
200
6 by
EdS
ourc
e, I
nc.
We’ve also given [principals] really specific training on how to have...courageous
conversations with staff members, and how to evaluate staff members...and then even
how to manage their own ego.
—A superintendent

© C
opyr
ight
200
6by
EdS
ourc
e, I
nc.
E D S O U R C E R E P O R T
18 ● Similar Students, Different Results: Why Do Some Schools Do Better? ● June 2006
In contrast to principals, teachers from high- and low-performing schoolsand Program Improvement (PI) schools were relatively uniform in theirtop choices of professional development priorities, though they differedsomewhat in the order of these choices, as noted in this table.
The professional development topics least likely to be chosen as a toppriority by teachers were classroom management and student discipline;understanding and using data from assessments to inform instruction;multicultural or diversity issues; and school improvement planning.
One interpretation of this, consistent with the other survey responses, isthat teachers are naturally focused on one thing—teaching. New andeven more seasoned teachers have faced a considerable amount ofwork mastering the state’s new academic standards and workingtogether to align curriculum. These requests for professional develop-
ment cover the main content areas of English, math, and EnglishLanguage Development—as well as the instructional strategies neededto more effectively teach all students and those for whom English is asecond language.
Our survey results also indicate that while teachers in higher-performingschools report receiving student assessment data and reviewing it withtheir principal, their main job in the school improvement process is theimplementation of the standards-based curriculum in a demographicallydiverse classroom of students. The fact that teachers from both thehigher- and the lower-performing schools in our sample requested moretraining on curriculum subjects suggests that both state-supportedprofessional development programs and teacher preparation programsat universities would do well to maintain a strong emphasis on them.
Regardless of school performance,principals’ top choice for additional profes-sional development was “using assessment data.” Given this unanimity, it isinteresting to note that the second and third most popular choices divergedbased on whether the principal was from a high-performing,a low-performing,or a Program Improvement school. Among principals in high-performingschools, the next two priorities were “evaluating teachers’ instruction” and“addressing multicultural/diversity issues,” both of which ranked near themiddle for the principals in the other two groups.By contrast, the principals inlow-performing schools collectively chose “training and instructional strate-gies for English learner (EL) students”and “developing a school plan or sharedvision” as their second and third priorities. While the former was popularamong high-performing principals as well, the latter showed up 10th. ForProgram Improvement school principals, the EL strategy was second; but thethird priority was “implementing a standards-based curriculum.”
Since it began standards-based reform efforts, California has invested in onemajor program for principal professional development,Assembly Bill (AB) 75training.This program requires participants to attend 160 hours of training inorder to qualify for state funding,and the content must address three specificareas: leadership and support of student instructional programs; leadershipand management for instructional improvement; and instructional technol-ogy to improve pupil performance. Absent a renewal or extension, thisprogram ends in July 2006. It is unclear the extent to which the Legislaturewill continue to invest in principal professional development; but if it choosesto do so, this study’s findings indicate that a more flexible approach toprofessional development for principals that acknowledges their diversecapabilities and needs might be appropriate. Of course that assumes thatthe principals are accurate regarding the professional development thatwould be most helpful.
Survey results document professional development needs of principals and teachers atschools serving low-income students
Professional Development Topic Priority Among Teachers Priority Among Teachers Priority Among Teachers in High-performing Schools in Low-performing Schools in PI Schools
Instructional strategies for multiple learning styles 1 4 3
Language arts curriculum program 2 1 1
Mathematics curriculum program 3 3 2
Instructional strategies for English learners 4 2 4
English Language Development curriculum program 5 5 6
Curriculum standards 6 6 5
*This look at professional development requests was done separately from the main analysis of survey data. For this analysis only, we designated high-performing schools as those with a 2005Growth API that was one standard deviation above the mean for the sample schools and low-performing schools as those with a Growth API one standard deviation below.
Teachers report similar professional development needs regardless of school performance
As part of the Similar Students,Different Results study conducted by EdSource,Stanford University,UC–Berkeley,and AIR,both principals and teachers were askedabout their professional development needs. Respondents were given a list of 10 possible professional development topics and asked to select their top threepriorities.We categorized their responses based on their school’s 2005 Growth API to determine the extent to which those needs might vary between high- andlow-performing schools.* We also looked at the responses from schools currently participating in Program Improvement, an intervention program under NCLB.
Professional development needs of principals vary depending on their school’s performance

© C
opyr
ight
200
6 by
EdS
ourc
e, I
nc.
E D S O U R C E R E P O R T
June 2006 ● Similar Students, Different Results: Why Do Some Schools Do Better? ● 19
teacher and principal professional development programs, to provideinstructional support for strugglingstudents, and to analyze student assess-ment data to improve teacher and schoolperformance.
The state’s choice of curriculumprograms can affect school performanceIn the decade since state leaders inCalifornia began taking a standards-based approach to the oversight ofpublic education, they have increas-ingly aligned the state’s curriculumadoption process with that approach.The state’s academic content stan-dards have formed the basis forcurriculum frameworks and textbookcontent. Beyond that, however, theState Board of Education (SBE) hasincreasingly used its textbook evalua-tion criteria to encourage textbookpublishers who want to sell books inCalifornia to closely align their materials with the state’s vision forclassroom instruction.
In 2002 the English language artsadoption required publishers to notonly provide textbooks aligned with thestandards, but to also augment the textswith robust materials that providedextra guidance for educators, including: ● A clear scope and sequence for
organizing the instructionalprogram;
● A variety of assessment instrumentsfor use by classroom teachers;
● Suggestions for modifying thematerials to ensure universal accessfor students with special needs,including English learners; and
● Instructional planning and supportfor teachers that helps them aligninstruction with standards.Only two publishers—SRA/
Open Court and Houghton Mifflin—met the state’s expectations at that time.
The SBE recently approved theevaluation criteria for the 2008English language arts adoption. Text-book publishers will now have twoyears to develop materials that fit thesecriteria. Given California’s importanceto publishers, most observers expect tosee many more programs available thatmeet the state’s criteria this timearound. Once the state adopts text-books it finds acceptable, districts willthen review and choose among theapproved list based on those theybelieve best meet their needs in termsof emphasis and approach. In manydistricts that means a process, ofteninvolving teachers, that leads to adistrictwide adoption, with a plan forimplementation and appropriateprofessional development to makesure that school staffs know how tomaximize the effectiveness of thematerials within the classroom.
The state goes about this process ona set schedule, with different subject-matter areas considered each year. Forelementary students, however, there islikely none more crucial than the Englishlanguage arts adoption now underway.
In two years—once publisherssubmit their materials for considera-tion—many opportunities exist forpublic review and input as part of thestate’s adoption process. In preparationfor that, state policymakers and localeducators might be well served to learnmore about the reading materialscurrently in use in California and theconditions that appear to make specificcurriculum programs more or lesseffective in the diverse schools servinglow-income children. One questionthat deserves particular attention ishow curriculum and instruction arebeing most effectively adapted to theneeds of English learners. That inquirycan help shape the broad decisions theSBE will ultimately make regardinghow reading and the rest of languagearts will be taught in California’s
Increasing teacher collaboration opportunities has improved the ... delivery of instruction.
Supporting the collaboration with professional development reinforces the ability of
everyone to improve.
—A principal
What sets this study apart
This study is different because of the following:
● It focuses on California elementary schoolsserving high percentages of low-incomestudents.
● The study sample includes schools across awide range of performance levels, sizes, andlocations.
● The teacher and principal participation ratesare very high.
● Survey responses are within the context ofstate accountability and standards-basedschool reform policies.
● Survey questions address actionable class-room, school, and district policies andpractices.
Superintendents depend upon their school principals to act as instructional leaders who
are able to help support and evaluate teachers.
—A superintendent
E D S O U R C E R E P O R T
elementary schools, as well as the subse-quent district choices about theircurriculum adoptions.
The findings from this study suggestthat this curriculum adoption processand the actual materials selected can havea real effect on schools’ ability to improvestudent achievement. State and districtdecisions should, to the extent possible,be based on evidence about what worksto improve student achievement.
School practices can make a difference in the achievement of low-income studentsAcross California, schools serving similartypes of student populations can varywidely in how well they score on the API.The 257 elementary schools (serving
135,673 K–5 students) included in theSimilar Students, Different Results study weredrawn from a fairly narrow band in termsof student demographics (percent low-income, English learner, ethnic/racialsubgroups). Yet their 2005 Growth APIscores varied by about 250 points.
A school’s API score reflects how wellits students are performing on the annualCalifornia Standards Tests. Such tests arecertainly not the only way for a school tomeasure how well its students are master-ing the rigorous academic content of thestate’s grade-by-grade standards; and theyalso do not measure the other importantthings that elementary students may belearning at school—about art and scienceand music, about citizenship and toler-ance of differences, about themselves andtheir sense of place in the world.
But an elementary school’s API scoreprovides the state and the public with aconsistent and easy way to grasp infor-mation about the progress its studentsare making toward mastering the impor-tant math and reading and writing skillsthat will enable them to succeed academ-ically in later grades. For this reason,among others related to accountability, aschool’s API score represents an impor-tant measure of student learning.
The range of API scores in oursample suggests that while the socioeco-nomic backgrounds of students is onepredictor of academic achievement, it isnot the sole predictor. What schoolsdo—and what resources they have to doit with—can make a difference. Withthat in mind, the interrelated practicesidentified in this study may help schoolsin their efforts to improve studentachievement. Further, the insights fromthe superintendent interviews mayprovide district leaders with someconcrete examples of strategies toconsider as they steer and support theirschools’ improvement efforts.
Ray Bacchetti, PresidentScholar in Residence, Carnegie Foundation for the Advancement of Teaching
Davis Campbell, Vice PresidentPresident, California School Boards Association Governance Institute
Lawrence O. Picus, Fiscal OfficerProfessor, Rossier School of Education, University of Southern California
M. Magdalena Carrillo Mejia, SecretarySuperintendent, Sacramento City Unified School District
Pam BradyPresident-elect, California State PTA
Kathleen ChaPresident, American Association of University Women–California
Christopher CrossChairman, Cross & Joftus, LLC
Gerald C. HaywardPartner, Management Analysis & Planning, Inc.
Santiago JacksonAssistant Superintendent, Division of Adult and Career Education, Los Angeles Unified School District
Jacqueline JacobbergerPresident, League of Women Voters of California
Martha KanterChancellor, Foothill-De Anza Community College District
Kelvin K. LeeSuperintendent, Dry Creek Joint Elementary School District
Paul J. MarkowitzTeacher, Las Virgenes Unified School District
John B. MocklerPresident, John Mockler & Associates
Ted OlssonRetired Manager, Corporate Community Relations, IBM Corporation
Amado M. PadillaProfessor of Education, Stanford University
Peter SchragContributing Editor, Sacramento Bee
Don ShalveyCEO and Co-founder, Aspire Public Schools
Krys WulffDirector-at-large, American Association of University Women
2005–06 EdSource Board of Directors
Trish WilliamsEdSource Executive Director
520 San Antonio Road, Suite 200, Mountain View, CA 94040-1217 • 650/917-9481 • Fax: 650/917-9482
[email protected] • www.edsource.org • www.ed-data.k12.ca.us
© C
opyr
ight
200
6 by
EdS
ourc
e, I
nc.
On the EdSource website atwww.edsource.org/pub_abs_simstu05.cfm, you’ll finda wealth of information about the Similar Students,Different Results study, including:
● The Initial Findings, released in October 2005.
● Additional findings released in April 2006 related tocurriculum adoptions.
● Technical appendices that describe the researchmethodology and provide more detailed findings.
● Copies of the actual surveys used with both teachersand principals.
● Documents that address frequently asked questions(FAQs) about the findings generally and the issue ofparent involvement in particular.
● A comprehensive bibliography that includes the “effective schools” research used to develop the sur-veys and additional research that informed this study.
● Biographical information about the research team.
● Press coverage the study has received since itsrelease.
Copies of this study can be downloaded from theEdSource website.
To Learn More