SimCalc Classroom Connectivity Project 2: … Classroom Interactions Among Diverse, ... classrooms...
16
SimCalc Classroom Connectivity Project 2: Understanding Classroom Interactions Among Diverse, Connected Classroom Technologies Overview of the Present Findings of a 4- Year Study (2004-2008) Research and development in technology and curriculum dedicated to democratizing access to the Mathematics of Change and Variation, including ideas underlying Calculus. Technical Report 1:1 | 31st August 2007 Stephen Hegedus James J. Kaput Sara Dalton Arden Brookstein Rebecca Moniz Jeremy Roschelle SRI International, University of Rochester, Vanderbilt University, Virginia Tech, Michigan State University, Arizona State University, San Diego State University, Laurentian University (Canada), Cinvestav, (Mexico), Rutgers University, Simon Fraser University (Canada), University of Texas at Austin, & University of Warwick (United Kingdom) RESEARCH CONTRIBUTORS:
Transcript of SimCalc Classroom Connectivity Project 2: … Classroom Interactions Among Diverse, ... classrooms...
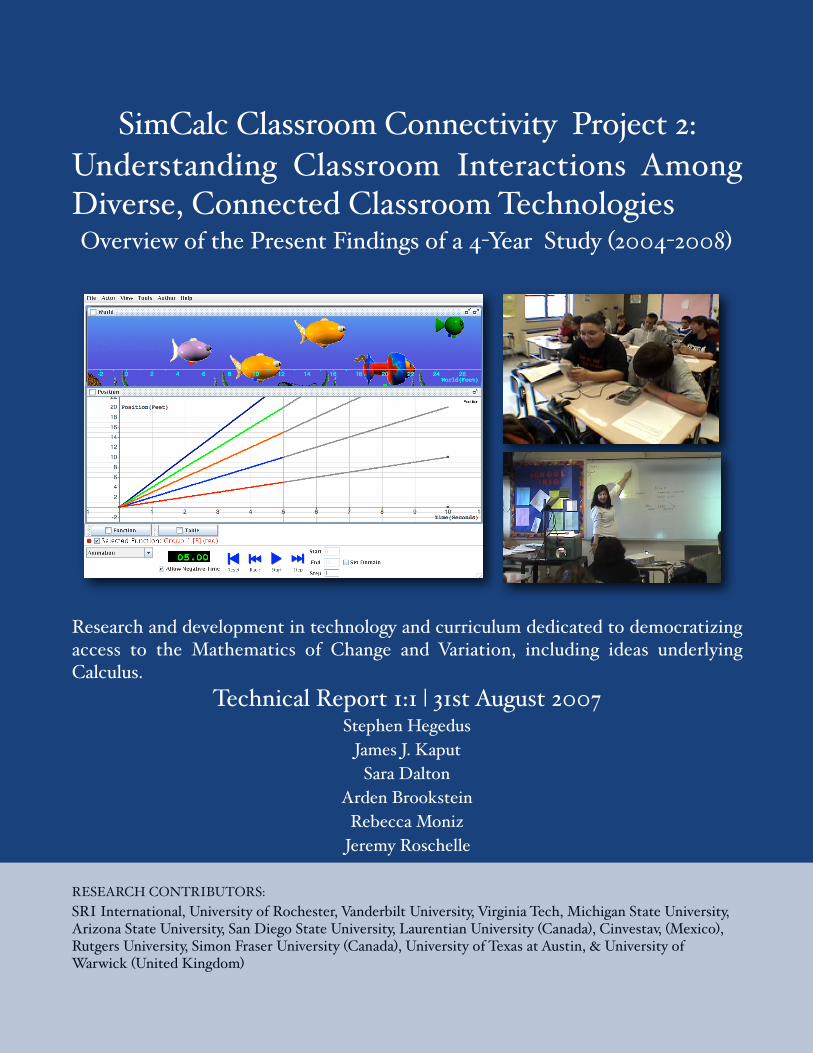
SimCalc Classroom Connectivity Project 2:Understanding Classroom Interactions Among Diverse, Connected Classroom TechnologiesOverview of the Present Findings of a 4-Year Study (2004-2008)
Research and development in technology and curriculum dedicated to democratizing access to the Mathematics of Change and Variation, including ideas underlying Calculus.
Technical Report 1:1 | 31st August 2007Stephen Hegedus
James J. KaputSara Dalton
Arden BrooksteinRebecca Moniz
Jeremy Roschelle
SRI International, University of Rochester, Vanderbilt University, Virginia Tech, Michigan State University, Arizona State University, San Diego State University, Laurentian University (Canada), Cinvestav, (Mexico), Rutgers University, Simon Fraser University (Canada), University of Texas at Austin, & University of Warwick (United Kingdom)
RESEARCH CONTRIBUTORS:
University of Massachusetts DartmouthJames J. Kaput Center for Research and Innovation in Mathematics Education200 Mill Road, Suite 150BFairhaven, MA 02719774-929-3065
University of Massachusetts Dartmouth,All Rights Reserved. Copyright © 2007This is an official publication of the James J. Kaput Center for Research and Innovation in Mathematics Education. The SimCalc Research team of the Kaput Center, University of Massachusetts Dartmouth, is simultaneously preparing more detailed scholarly articles for researchers, teacher professional development, leaders, and policy makers. Contact [email protected] for more details.
SimCalc Classroom Connectivity Project 2:Understanding Classroom Interactions Among Diverse, Connected Classroom TechnologiesOverview of the Present Findings of a 4-Year Study (2004-2008)
Prepared by:
Stephen Hegedus, James J. Kaput Center for Research and Innovation in Mathematics Education, University of Massachusetts DartmouthSara Dalton, Kaput James J. Center for Research and Innovation in Mathematics Education, University of Massachusetts DartmouthArden Brookstein, Kaput James J. Center for Research and Innovation in Mathematics Education, University of Massachusetts DartmouthRebecca Moniz, James J. Kaput Center for Research and Innovation in Mathematics Education, University of Massachusetts DartmouthJeremy Roschelle, Center for Technology in Learning, SRI International
We thank and remember Jim Kaput who was a PI on this project and pioneered SimCalc as part of his commitment to democratizing mathematics education.
Acknowledgments:This material is based upon work supported by the National Science Foundation under Grant No. REC-0337710. Any opinions, findings, and conclusions or recommendations expressed in this material are those of the author(s) and do not necessarily reflect the views of the National Science Foundation.
We thank D. Beaton, A. Brookstein, J. Burke, L. Moreno-Armella, R. Robidoux, S. Rodriguez, & our advisors: N. Ares, G. Davis, R. Hall, R. McCrory, J. Middleton, R. Nemirovsky, W. Penuel, L. Radford, R. Schorr, N. Sinclair, W. Stroup, D. Tall, and D. Tatar for their contributions to this research. We also thank the participating local school districts and teachers, faculty of the mathematics department at UMass Dartmouth, and Texas Instruments Education, a division at Texas Instruments Incorporated. Together with these partners, we are working towards a future in which every child becomes a fluent user of powerful mathematical ideas.
James J. Kaput Center for Research and Innovation in Mathematics Education
Page 2
Im p l e m e n t a t i o n o f d y n a m i c SimCalc software and curriculum for 3-6 w e e k s i n s e v e r a l A l g e b r a 1 classrooms at the high school level in various local districts in the Southeast Massachusetts Region focusing on core Algebra ideas such as linear functions, simultaneity, co-variation and slope-as-rate vs. slope as m in y = m x + b t h a t u t i l i z e c l a s s ro o m connectivity.
The central ideas of calculus—change and accumulation of quantity—are critical ly important tools for understanding science, engineering and business. Related ideas include the different kinds of variation, mean values, approximation, sampling and limits. The mathematics of change is essential for informed citizenship in a rapidly evolving democratic society. These ideas should be learnable by ALL children, without a long series of prerequisites. Education must introduce these powerful ideas early, using techniques that tap into students' natural abilities. Activities should draw upon diverse worlds, real and imagined, and build upon students' strengths. Students need to develop these ideas gradually, over many years, rather than waiting until a single senior year e lect ive . We seek deep changes in the mainstream curriculum, which controls what virtually all students and teachers do every day. Technology is often cited for its potential to create new opportunities for more students to develop deeper knowledge (National Research Council, 2003) and for “democratizing access to the mathemat ic s o f change and variation” (Kaput, 1994). Kaput aimed at creating new ways of using technology to fuel understanding of calculus concepts (Kaput, 1994) through a dynamic software environment called SimCalc MathWorlds® (hereafter called SimCalc or SimCalc software) and through
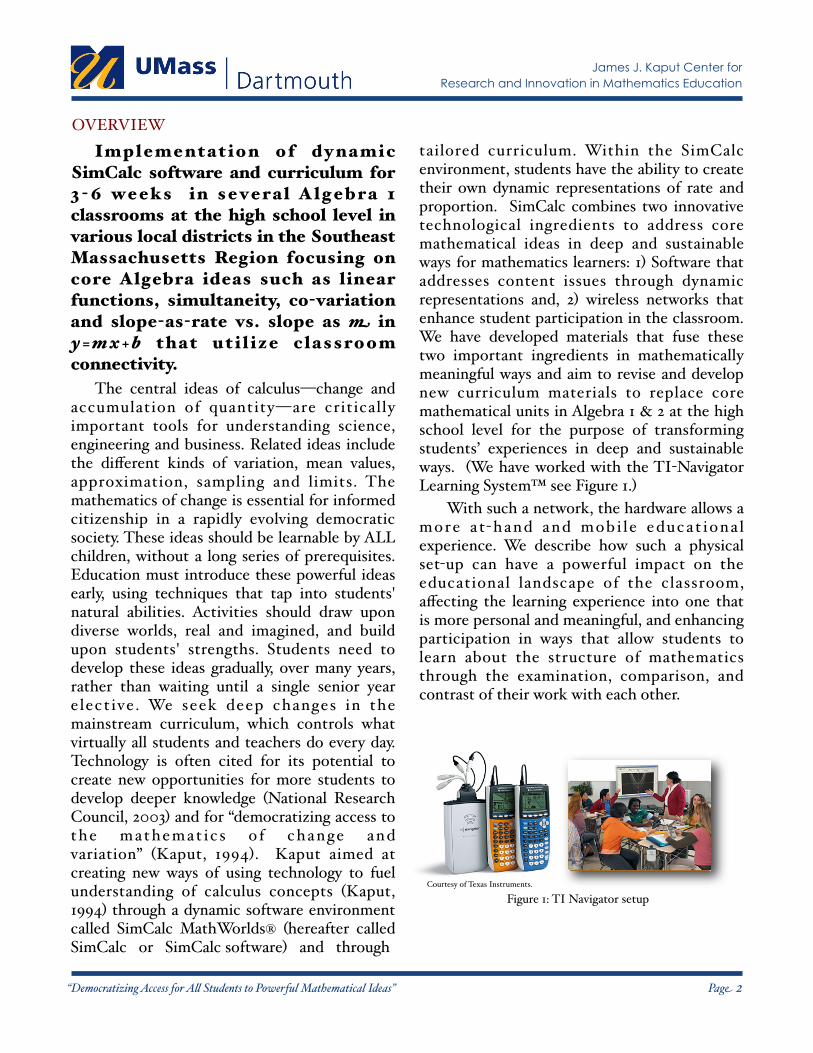
tailored curriculum. Within the SimCalc environment, students have the ability to create their own dynamic representations of rate and proportion. SimCalc combines two innovative technological ingredients to address core mathematical ideas in deep and sustainable ways for mathematics learners: 1) Software that addresses content issues through dynamic representations and, 2) wireless networks that enhance student participation in the classroom. We have developed materials that fuse these two important ingredients in mathematically meaningful ways and aim to revise and develop new curriculum materials to replace core mathematical units in Algebra 1 & 2 at the high school level for the purpose of transforming students’ experiences in deep and sustainable ways. (We have worked with the TI-Navigator Learning System™ see Figure 1.)
With such a network, the hardware allows a more a t-hand and mobi le educat iona l experience. We describe how such a physical set-up can have a powerful impact on the educational landscape of the classroom, affecting the learning experience into one that is more personal and meaningful, and enhancing participation in ways that allow students to learn about the structure of mathematics through the examination, comparison, and contrast of their work with each other.
OVERVIEW
Figure 1: TI Navigator setupCourtesy of Texas Instruments.
“Democratizing Access for A" Students to Powerful Mathematical Ideas”
James J. Kaput Center for Research and Innovation in Mathematics Education
Page 3
The SimCalc software allows students to create mathematical objects on graphing calculators and see dynamic representations of these functions through the animations of actors whose motion is driven by the defined functions. Students are then able to send their work to a teacher computer. Calculators are connected to hubs that wirelessly communicate to the teacher’s computer via a local access po int . Due to advances in w i re le s s communication and interactivity between desktop PCs and hand-held devices, the flow of data around a classroom can be very fast allowing large iterations of activities to be executed during one class. This is not just an advance in connectivity, but in the development and application of software that maximizes such an innovation.
We have worked to create activities that allow students to create functions in SimCalc on the TI-83 Plus or TI-84 Plus graphing calculator which can then be collected (or “aggregated”) by a teacher into the SimCalc software running in parallel on a computer using TI’s Navigator Wireless network. The activities are part of a curriculum developed and refined over many years that focus on core high school Algebra ideas such as linear functions, simultaneity, covariation and slope-as-rate vs. slope as m in y=mx+b that utilize Classroom Connectivity (CC) in new ways to supplement or replace existing traditional algebra curriculum (Hegedus & Kaput, 2004) which accompanies the software and is structured to take advantage of the natural social setup of the classroom to create variation. We have measured the impact of implementing these materials on student learning. This has enabled us to assess the impact of our program on enabling students to get past the “algebra bottleneck” an issue of national concern and security.
WHAT IS CLASSROOM CONNECTIVITY? Classroom Connectivity has earlier roots in
more than a decade of classroom response sy s tems most notab le C la s sTa lk™ (Abrahamson, 1998; 2000) which enabled instructors to collect, aggregate and display (often as histograms) student responses to questions, and, in so doing, create new levels of interaction in large classes in various domains (Burnstein & Lederman, 2001; Crouch & Mazur, 2001; Dufresne, Gerace, Leonard, Mestre, & Wenk, 1996; Hake, 1998; Littauer, 1972; Piazza, 2002) and levels (Hartline, 1997). Roschelle, Abrahamson, & Penuel, (2003) show remarkably consistent positive impacts across multiple domains and levels. The major new CC affordances beyond classroom response systems that we studied are:1. The mobility of multiple representations of
mathematical objects such as functions as reflected in the ability to pass these bi-directionally and flexibly between teacher and students and among students.
2. The ability to flexibly harvest, aggregate, manipulate and display to the whole classroom representationally-rich student const r uct ions , and to broadca s t mathematical objects to the class (provided appropr iate l y des igned sof tware i s available).
3. The at-handedness of hand-helds, allowed the ability to do (2) in ways that respect and build upon naturally occurring social and participation structures.
4. The opportunity to engineer entirely novel classroom activity structures in concert with the mathematics to be taught and learned that both engage students in newly powerful ways, and
5. Teachers can arrange, organize and analyze, sets of whole-class contributions at once, while students can make sense of their work in a social context, reasoning and generalizing about their contribution with respect to their peers’ work.
“Democratizing Access for A" Students to Powerful Mathematical Ideas”
James J. Kaput Center for Research and Innovation in Mathematics Education
Page 4
“Democratizing Access for A" Students to Powerful Mathematical Ideas”
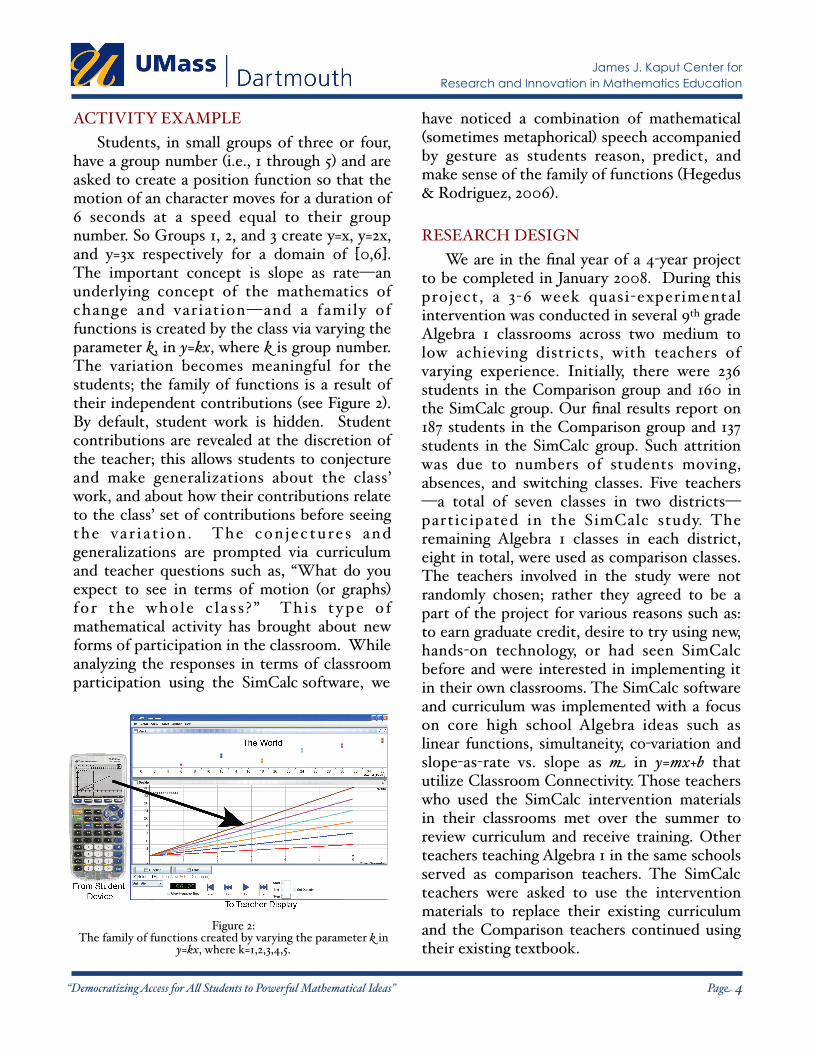
Figure 2: The family of functions created by varying the parameter k in
y=kx, where k=1,2,3,4,5.
have noticed a combination of mathematical (sometimes metaphorical) speech accompanied by gesture as students reason, predict, and make sense of the family of functions (Hegedus & Rodriguez, 2006).
RESEARCH DESIGNWe are in the final year of a 4-year project
to be completed in January 2008. During this project, a 3-6 week quasi-experimental intervention was conducted in several 9th grade Algebra 1 classrooms across two medium to low achieving districts, with teachers of varying experience. Initially, there were 236 students in the Comparison group and 160 in the SimCalc group. Our final results report on 187 students in the Comparison group and 137 students in the SimCalc group. Such attrition was due to numbers of students moving, absences, and switching classes. Five teachers—a total of seven classes in two districts—participated in the SimCalc study. The remaining Algebra 1 classes in each district, eight in total, were used as comparison classes. The teachers involved in the study were not randomly chosen; rather they agreed to be a part of the project for various reasons such as: to earn graduate credit, desire to try using new, hands-on technology, or had seen SimCalc before and were interested in implementing it in their own classrooms. The SimCalc software and curriculum was implemented with a focus on core high school Algebra ideas such as linear functions, simultaneity, co-variation and slope-as-rate vs. slope as m in y=mx+b that utilize Classroom Connectivity. Those teachers who used the SimCalc intervention materials in their classrooms met over the summer to review curriculum and receive training. Other teachers teaching Algebra 1 in the same schools served as comparison teachers. The SimCalc teachers were asked to use the intervention materials to replace their existing curriculum and the Comparison teachers continued using their existing textbook.
ACTIVITY EXAMPLEStudents, in small groups of three or four,
have a group number (i.e., 1 through 5) and are asked to create a position function so that the motion of an character moves for a duration of 6 seconds at a speed equal to their group number. So Groups 1, 2, and 3 create y=x, y=2x, and y=3x respectively for a domain of [0,6]. The important concept is slope as rate—an underlying concept of the mathematics of change and variation—and a family of functions is created by the class via varying the parameter k, in y=kx, where k is group number. The variation becomes meaningful for the students; the family of functions is a result of their independent contributions (see Figure 2). By default, student work is hidden. Student contributions are revealed at the discretion of the teacher; this allows students to conjecture and make generalizations about the class’ work, and about how their contributions relate to the class’ set of contributions before seeing the va r i a t ion . The con jectures and generalizations are prompted via curriculum and teacher questions such as, “What do you expect to see in terms of motion (or graphs) fo r the who le c l a s s ? ” Thi s ty pe o f mathematical activity has brought about new forms of participation in the classroom. While analyzing the responses in terms of classroom participation using the SimCalc software, we
James J. Kaput Center for Research and Innovation in Mathematics Education
Page 5
The SimCalc teachers did not discuss the software, intervention, or curriculum with each other until at a final meeting after everyone completed the intervention. The SimCalc teachers filled out daily logs addressing their aims, curricular objectives, technological objectives, homework, assessments, pedagogical comments, classroom observations (including problems, student confusion, and activity extens ions ) , and s tudent obser vat ions (including discussions about student learning, classroom discourse, classroom discussions, events, and management, and any change in student attitude).
SimCalc teachers were also interviewed at the end of the intervention. Along with a pre-and-post content test, (discussed later in more detail) students filled out a pre- and post- attitude survey. Field notes and video data for each class in the SimCalc group and one class in the Comparison group were collected daily during the intervention and selected students were inter v ie wed a t the end o f the intervention. Each class was recorded with two digital cameras, one located in the back center of the room focused on the teacher and the whiteboard space where SimCalc was projected and the other positioned at the front of the class focused on the students using a wide-angled lens to pan out and observe whole class dynamics as well as small group interactions. Both cameras were used as roaming cameras when the class was involved in small group work. The camera placement and focus is largely guided by our research questions and inquiry on the types of participation and engagement exhibited in class both from a linguistic and physical perspective.
All thirteen teachers retuned complete data for the 2005-2006 school year. At intake, the SimCalc group and the Comparison group did not differ in any significant way.
STUDENT ASSESSMENTA total of 60 test items were compiled from
various state high stakes assessment tests, such a s the Ma ssachuset t s Comprehens ive Assessment System (MCAS), Texas Assessment of Knowledge and Skills (TAKS), Regents Exam in New York, and the California High School Exit Examination (CAHSEE), as well as National Assessment of Educational Progress (NAEP) items, and Advanced Placement Calculus items. The Principle Investigators, faculty from the Mathematics Department, two research associates, several high school mathematics educators, and heads of the mathematics department in our participating high schools reviewed the 60 items and selected 22 items, which comprised the pre- and post-test student assessment.
The final student assessment contained MCAS items from previous Grade 8 and Grade 10 tests, TAKS items, and Regents items. The test was designed to take no more than 1 hour to complete. On average, it took 30 minutes for our participants to complete. Twenty of the twenty-two test items were multiple choice and worth 1 point—correct or incorrect. There was also one short answer question from the MCAS test worth a maximum of two points, and one long answer question from the MCAS test worth a maximum of four points. These items were hand-graded by two undergraduate mathematics students and an undergraduate engineering student and there was a very high inter-rater reliability.
The items on the test pertain to number sense and patterns, making connections across representations, rate and proportion, and graphical interpretation. We also included items that involved cognitive transfer of problem solving skills.
“Democratizing Access for A" Students to Powerful Mathematical Ideas”
James J. Kaput Center for Research and Innovation in Mathematics Education
Page 6
RESULTS
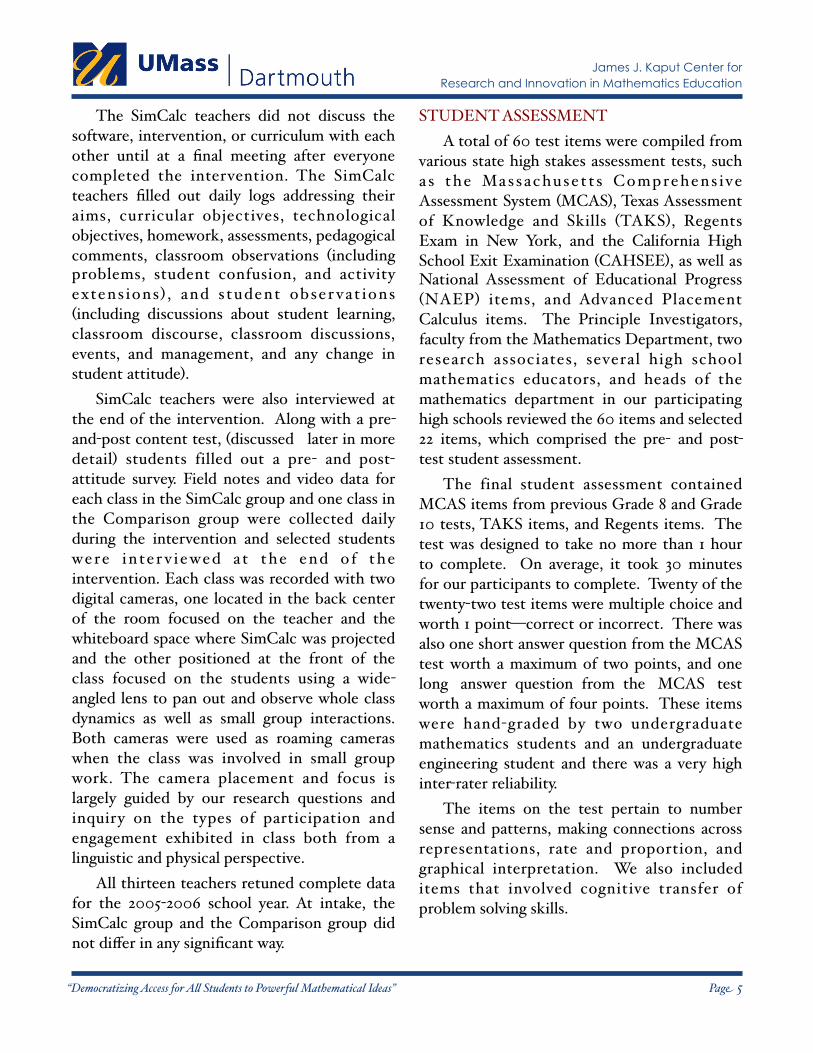
Our main effect was statistically significant and showed that students in the SimCalc group had a higher gain on items related to linear functions, slope as rate, proportion, linear variation, seeing across representations, and graphical interpretation (see Graph 1). In the SimCalc group, the mean gain was about 2 points out of a total of 26 points. In the Comparison group, the mean gain was about 1 point. This group difference was statistically significant, t(324)=2.711, p=0.007. The overall effect size was 0.34.
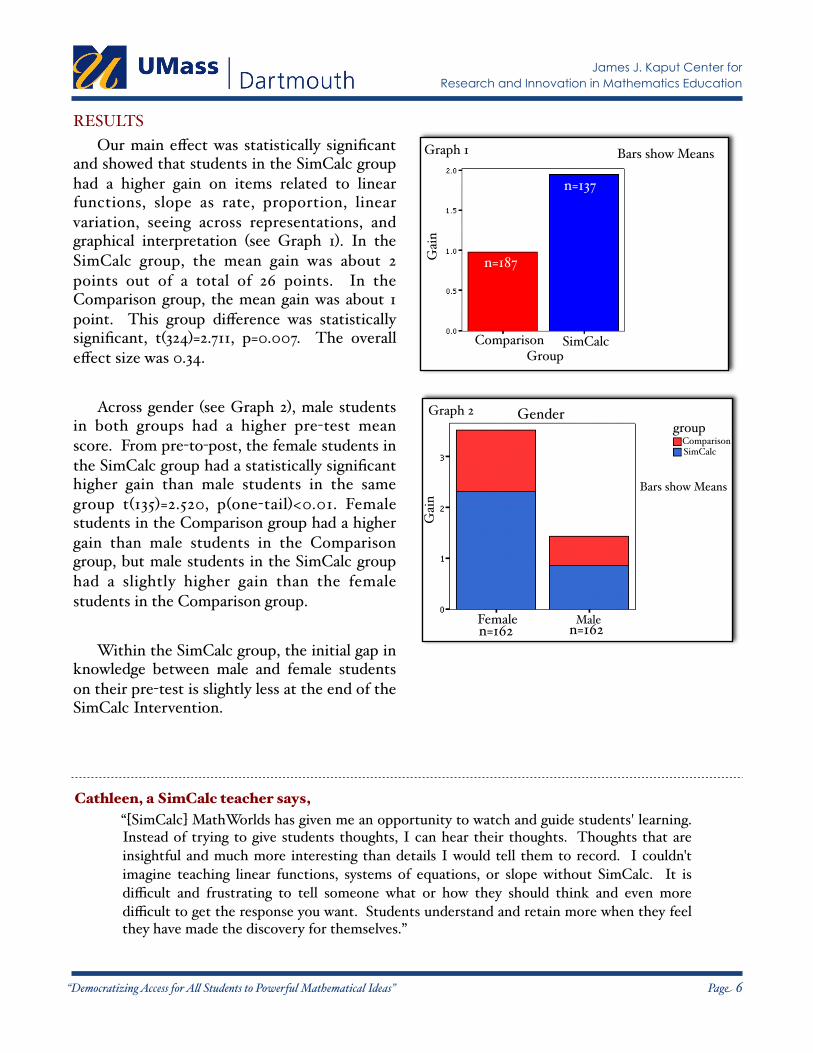
Across gender (see Graph 2), male students in both groups had a higher pre-test mean score. From pre-to-post, the female students in the SimCalc group had a statistically significant higher gain than male students in the same group t(135)=2.520, p(one-tail)<0.01. Female students in the Comparison group had a higher gain than male students in the Comparison group, but male students in the SimCalc group had a slightly higher gain than the female students in the Comparison group.
Within the SimCalc group, the initial gap in knowledge between male and female students on their pre-test is slightly less at the end of the SimCalc Intervention.
Graph 1
Graph 2
“Democratizing Access for A" Students to Powerful Mathematical Ideas”
Bars show Means
Group
Gai
n
Comparison SimCalc
Bars show Means
groupComparisonSimCalc
Gai
n
MaleFemale
Gender
n=162n=162
n=137
n=187
Cathleen, a SimCalc teacher says,“[SimCalc] MathWorlds has given me an opportunity to watch and guide students' learning. Instead of trying to give students thoughts, I can hear their thoughts. Thoughts that are insightful and much more interesting than details I would tell them to record. I couldn't imagine teaching linear functions, systems of equations, or slope without SimCalc. It is difficult and frustrating to tell someone what or how they should think and even more difficult to get the response you want. Students understand and retain more when they feel they have made the discovery for themselves.”
James J. Kaput Center for Research and Innovation in Mathematics Education
Page 7
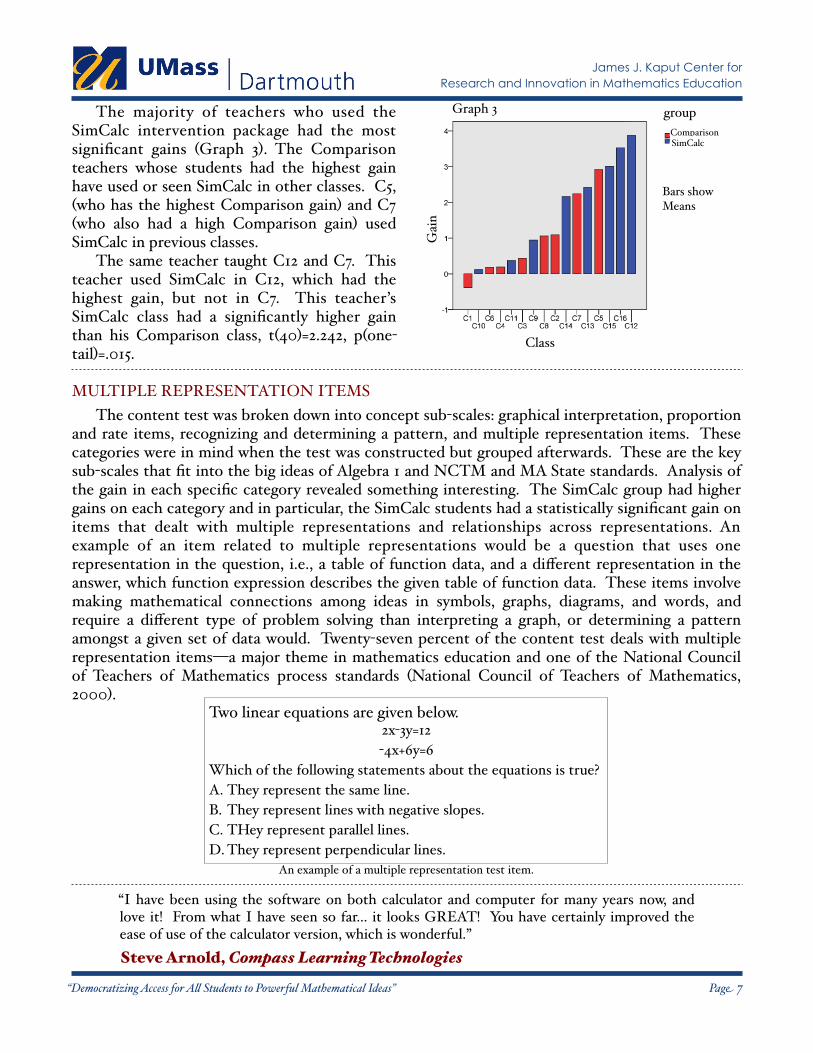
The majority of teachers who used the SimCalc intervention package had the most significant gains (Graph 3). The Comparison teachers whose students had the highest gain have used or seen SimCalc in other classes. C5, (who has the highest Comparison gain) and C7 (who also had a high Comparison gain) used SimCalc in previous classes.
The same teacher taught C12 and C7. This teacher used SimCalc in C12, which had the highest gain, but not in C7. This teacher’s SimCalc class had a significantly higher gain than his Comparison class, t(40)=2.242, p(one-tail)=.015.
MULTIPLE REPRESENTATION ITEMSThe content test was broken down into concept sub-scales: graphical interpretation, proportion
and rate items, recognizing and determining a pattern, and multiple representation items. These categories were in mind when the test was constructed but grouped afterwards. These are the key sub-scales that fit into the big ideas of Algebra 1 and NCTM and MA State standards. Analysis of the gain in each specific category revealed something interesting. The SimCalc group had higher gains on each category and in particular, the SimCalc students had a statistically significant gain on items that dealt with multiple representations and relationships across representations. An example of an item related to multiple representations would be a question that uses one representation in the question, i.e., a table of function data, and a different representation in the answer, which function expression describes the given table of function data. These items involve making mathematical connections among ideas in symbols, graphs, diagrams, and words, and require a different type of problem solving than interpreting a graph, or determining a pattern amongst a given set of data would. Twenty-seven percent of the content test deals with multiple representation items—a major theme in mathematics education and one of the National Council of Teachers of Mathematics process standards (National Council of Teachers of Mathematics, 2000).
“Democratizing Access for A" Students to Powerful Mathematical Ideas”
Graph 3 group
Gai
n
Class
SimCalcComparison
Bars show Means
“I have been using the software on both calculator and computer for many years now, and love it! From what I have seen so far... it looks GREAT! You have certainly improved the ease of use of the calculator version, which is wonderful.”Steve Arnold, Compass Learning Technologies
Two linear equations are given below.2x-3y=12-4x+6y=6
Which of the following statements about the equations is true?A. They represent the same line.B. They represent lines with negative slopes.C. THey represent parallel lines.D. They represent perpendicular lines.
An example of a multiple representation test item.
James J. Kaput Center for Research and Innovation in Mathematics Education
Page 8
Along with a pre- and post-content test, a student attitude survey was also administered. An attitude model was derived by a principal components ana l y s i s that y ie lded 4 components, which was in line with our theory. These 4 components accounted for 48% of the total variance.
These four constructs are: 1) Positivity towards math and school (α=.782), 2) Working collaboratively & related affect (α=.739), 3) Working privately (α=.754), and 4) Technology (α=.610). The attitude survey had a 5-point scale ranging from 0 (strongly disagree) to 4 (strongly agree) with 2 being neutral. The attitude survey was constructed and refined from a previous SimCalc IERI-funded project, and the Mathematics Attitude Scale (MAS)—a 50-item questionnaire— and was reviewed by several of our advisors. Analysis of the results re vea led someth ing interes t ing . An independent samples t-test indicates that the
two experimental groups did not have significant differences in changes of attitude between their pre and post survey. However, a paired samples t-test shows the Comparison group did have a significant difference in attitudes of Positivity towards math and school from pre survey to post survey, t(132)=-2.043, p=.043. Therefore, students in the Comparison group chose higher agreement responses on items describing math as interesting and important on the pre attitude survey than the post. This gain suggests a more negative overall attitude toward school when the post survey was administered. Overall, we can see that attitude does not change much over time, due to the fact that the mean gain scores are close to zero for both groups. This could be due to the fact that the attitude survey was only administered two times with a considerable amount of time between each administration. However, we do see variation at the class level.
ATTITUDE SURVEY RESULTS
“Democratizing Access for A" Students to Powerful Mathematical Ideas”
DISAGGREGATING THE DATAWe have also disaggregated the data and looked closely at individual items. We show two
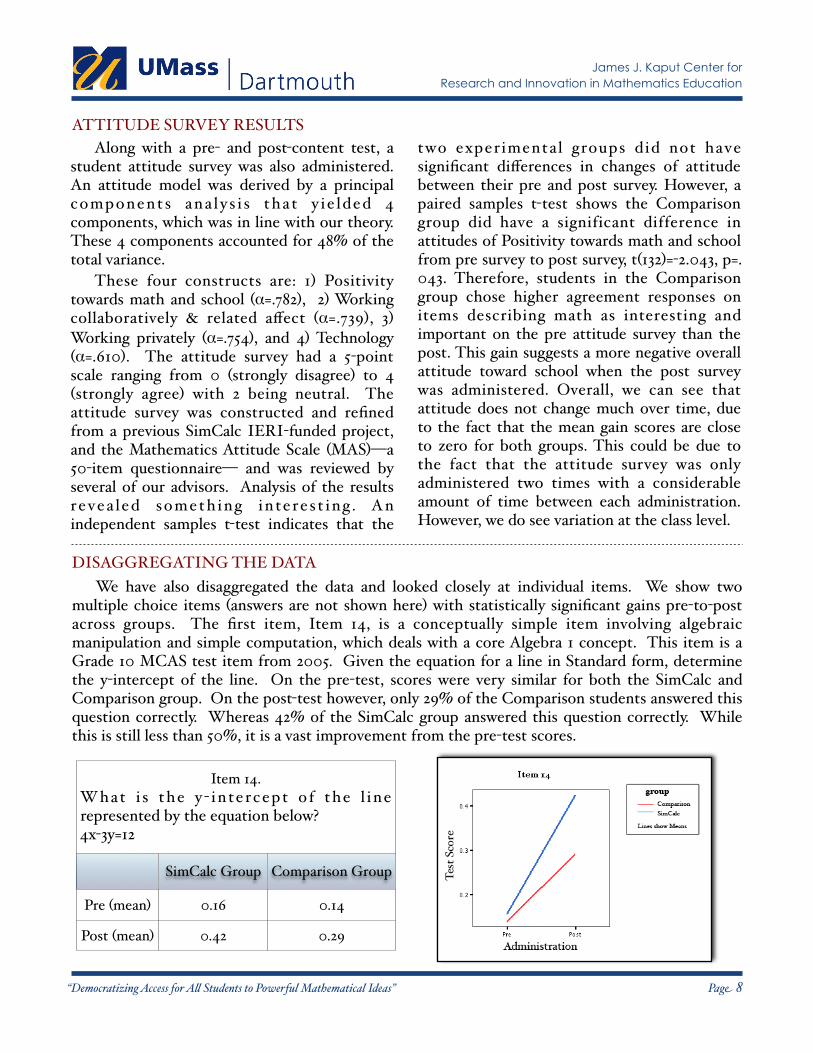
multiple choice items (answers are not shown here) with statistically significant gains pre-to-post across groups. The first item, Item 14, is a conceptually simple item involving algebraic manipulation and simple computation, which deals with a core Algebra 1 concept. This item is a Grade 10 MCAS test item from 2005. Given the equation for a line in Standard form, determine the y-intercept of the line. On the pre-test, scores were very similar for both the SimCalc and Comparison group. On the post-test however, only 29% of the Comparison students answered this question correctly. Whereas 42% of the SimCalc group answered this question correctly. While this is still less than 50%, it is a vast improvement from the pre-test scores.
Item 14. What i s the y - in tercept o f the l ine represented by the equation below?4x-3y=12
Item 14. What i s the y - in tercept o f the l ine represented by the equation below?4x-3y=12
Item 14. What i s the y - in tercept o f the l ine represented by the equation below?4x-3y=12
SimCalc Group Comparison Group
Pre (mean) 0.16 0.14
Post (mean) 0.42 0.29
James J. Kaput Center for Research and Innovation in Mathematics Education
Page 9
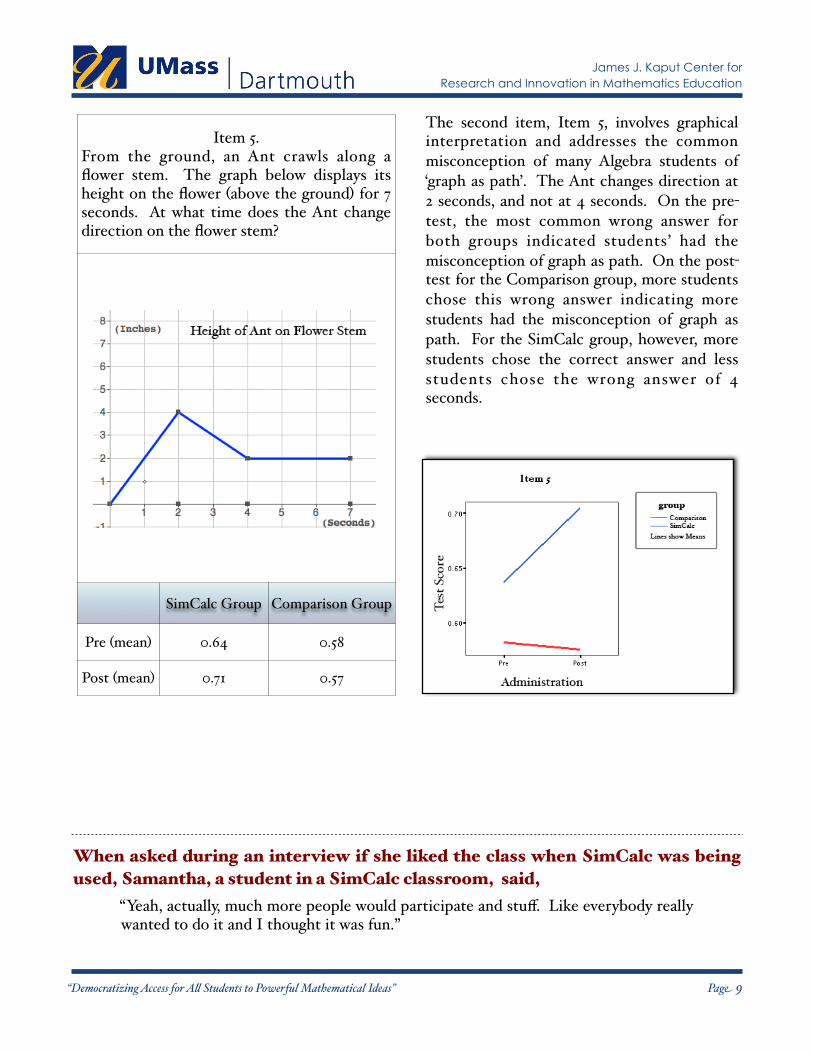
Item 5. From the ground, an Ant crawls along a flower stem. The graph below displays its height on the flower (above the ground) for 7 seconds. At what time does the Ant change direction on the flower stem?
Item 5. From the ground, an Ant crawls along a flower stem. The graph below displays its height on the flower (above the ground) for 7 seconds. At what time does the Ant change direction on the flower stem?
Item 5. From the ground, an Ant crawls along a flower stem. The graph below displays its height on the flower (above the ground) for 7 seconds. At what time does the Ant change direction on the flower stem?
SimCalc Group Comparison Group
Pre (mean) 0.64 0.58
Post (mean) 0.71 0.57
The second item, Item 5, involves graphical interpretation and addresses the common misconception of many Algebra students of ‘graph as path’. The Ant changes direction at 2 seconds, and not at 4 seconds. On the pre-test, the most common wrong answer for both groups indicated students’ had the misconception of graph as path. On the post-test for the Comparison group, more students chose this wrong answer indicating more students had the misconception of graph as path. For the SimCalc group, however, more students chose the correct answer and less students chose the wrong answer of 4 seconds.
“Democratizing Access for A" Students to Powerful Mathematical Ideas”
When asked during an interview if she liked the class when SimCalc was being used, Samantha, a student in a SimCalc classroom, said,
“Yeah, actually, much more people would participate and stuff. Like everybody really wanted to do it and I thought it was fun.”
James J. Kaput Center for Research and Innovation in Mathematics Education
Page 10
STUDENT CASE STUDY
Part of triangulating our data has been to build case studies on particular students. After looking at classroom observation notes, video data, and statistical results, students are selected for various reasons to be case studies. We do not focus only on test scores, we also look at attitude results, statistical data, video data collected daily from the classroom, field notes by a classroom observer, in-class and at-home work, and student interview data. From the video data, a selection of clips on the student are compiled from the beginning, middle, and end of the intervention. These clips involve the student of interest and are then analyzed to see the progression of the individual throughout the intervention as well as consistency with their performance on content tests and responses on the attitude survey. Each piece combines to create a very rich corpus of information on an individual who has participated in the SimCalc Intervention.
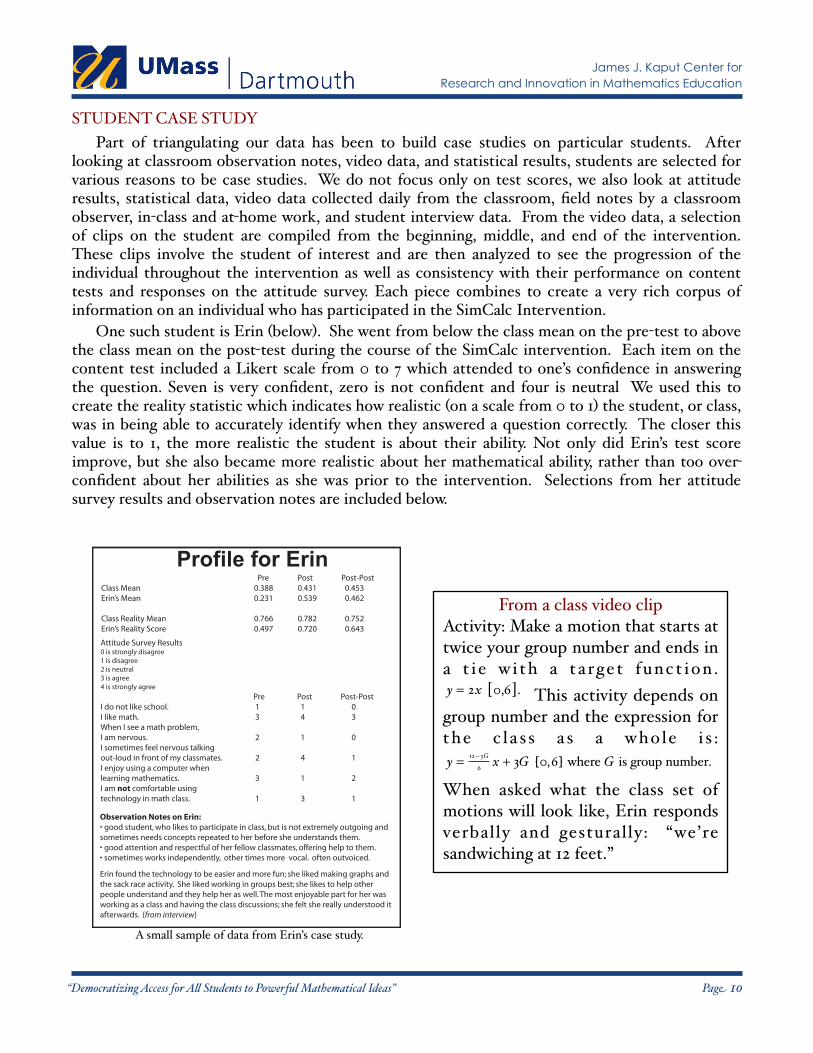
One such student is Erin (below). She went from below the class mean on the pre-test to above the class mean on the post-test during the course of the SimCalc intervention. Each item on the content test included a Likert scale from 0 to 7 which attended to one’s confidence in answering the question. Seven is very confident, zero is not confident and four is neutral We used this to create the reality statistic which indicates how realistic (on a scale from 0 to 1) the student, or class, was in being able to accurately identify when they answered a question correctly. The closer this value is to 1, the more realistic the student is about their ability. Not only did Erin’s test score improve, but she also became more realistic about her mathematical ability, rather than too over-confident about her abilities as she was prior to the intervention. Selections from her attitude survey results and observation notes are included below.
A small sample of data from Erin’s case study.
From a class video clipActivity: Make a motion that starts at twice your group number and ends in a t i e w i th a t a rget funct ion . y = 2x 0,6[ ]. This activity depends on group number and the expression for the c l a s s a s a who le i s :
y = 12− 3G
6 x + 3G [0,6] where G is group number. When asked what the class set of motions will look like, Erin responds verbal ly and gestural ly: “we’re sandwiching at 12 feet.”
“Democratizing Access for A" Students to Powerful Mathematical Ideas”
Profile for Erin
Observation Notes on Erin:• good student, who likes to participate in class, but is not extremely outgoing and sometimes needs concepts repeated to her before she understands them. • good attention and respectful of her fellow classmates, offering help to them. • sometimes works independently, other times more vocal. often outvoiced.
Erin found the technology to be easier and more fun; she liked making graphs and the sack race activity. She liked working in groups best; she likes to help other people understand and they help her as well. The most enjoyable part for her was working as a class and having the class discussions; she felt she really understood it afterwards. {from interview}
Pre Post Post-PostClass Mean 0.388 0.431 0.453Erin’s Mean 0.231 0.539 0.462
Class Reality Mean 0.766 0.782 0.752Erin’s Reality Score 0.497 0.720 0.643
Attitude Survey Results 0 is strongly disagree1 is disagree2 is neutral 3 is agree4 is strongly agree Pre Post Post-PostI do not like school. 1 1 0I like math. 3 4 3When I see a math problem, I am nervous. 2 1 0I sometimes feel nervous talkingout-loud in front of my classmates. 2 4 1I enjoy using a computer when learning mathematics. 3 1 2I am not comfortable using technology in math class. 1 3 1
James J. Kaput Center for Research and Innovation in Mathematics Education
Page 11
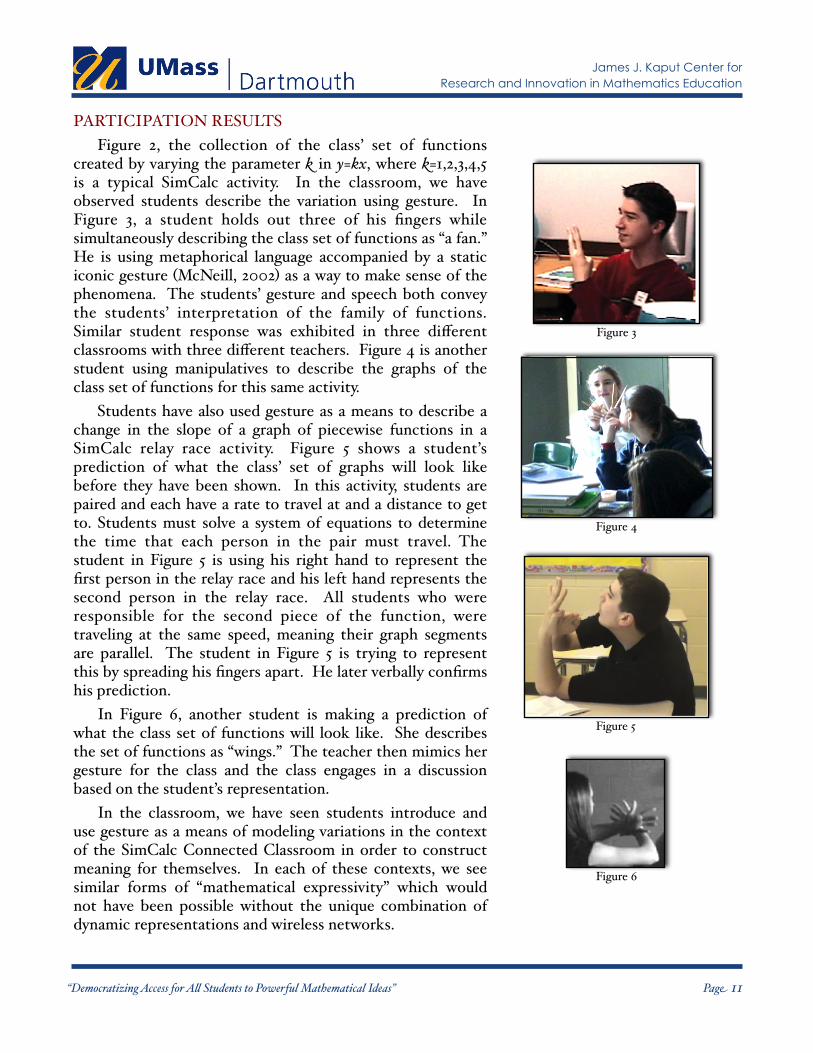
PARTICIPATION RESULTSFigure 2, the collection of the class’ set of functions
created by varying the parameter k in y=kx, where k=1,2,3,4,5 is a typical SimCalc activity. In the classroom, we have observed students describe the variation using gesture. In Figure 3, a student holds out three of his fingers while simultaneously describing the class set of functions as “a fan.” He is using metaphorical language accompanied by a static iconic gesture (McNeill, 2002) as a way to make sense of the phenomena. The students’ gesture and speech both convey the students’ interpretation of the family of functions. Similar student response was exhibited in three different classrooms with three different teachers. Figure 4 is another student using manipulatives to describe the graphs of the class set of functions for this same activity.
Students have also used gesture as a means to describe a change in the slope of a graph of piecewise functions in a SimCalc relay race activity. Figure 5 shows a student’s prediction of what the class’ set of graphs will look like before they have been shown. In this activity, students are paired and each have a rate to travel at and a distance to get to. Students must solve a system of equations to determine the time that each person in the pair must travel. The student in Figure 5 is using his right hand to represent the first person in the relay race and his left hand represents the second person in the relay race. All students who were responsible for the second piece of the function, were traveling at the same speed, meaning their graph segments are parallel. The student in Figure 5 is trying to represent this by spreading his fingers apart. He later verbally confirms his prediction.
In Figure 6, another student is making a prediction of what the class set of functions will look like. She describes the set of functions as “wings.” The teacher then mimics her gesture for the class and the class engages in a discussion based on the student’s representation.
In the classroom, we have seen students introduce and use gesture as a means of modeling variations in the context of the SimCalc Connected Classroom in order to construct meaning for themselves. In each of these contexts, we see similar forms of “mathematical expressivity” which would not have been possible without the unique combination of dynamic representations and wireless networks.
Figure 3
Figure 4
Figure 5
Figure 6
“Democratizing Access for A" Students to Powerful Mathematical Ideas”
James J. Kaput Center for Research and Innovation in Mathematics Education
Page 12
REFERENCES
Abrahamson, A. L. (1998). An overview of teaching and learning research with classroom communication systems. Paper presented at the Samos International Conference on the Teaching of Mathematics, Village of Pythagorion, Samos, Greece, July 1998.
Abrahamson, A. L. (2000). A brief history of Classtalk. Paper presented at the Teachers Teaching with Technology International Conference, Dallas, TX, March 2000.
Burnstein, R., & Lederman, L. M. (2001). Using wireless keypads in lecture classes. Physics Teacher, 69(8), 8–11.
Crouch, C. H., & Mazur, E. (2001). Peer instruction: Ten years of experience and results. Physics Teacher, 69(9), 970–977.
Dufrense, R. J., Gerace, W. J., Leonard, W. J., Mestre, J. P., & Wenk, L. (1996). Classtalk: A classroom communication system for active learning. Journal of Computing in Higher Education, 7(2), 3-47.
Hake, R. R. (1998). Interactive-engagement vs. traditional methods: A six-thousand student survey of mechanics test data for introductory physics courses. American Journal of Physics, 66, 64-74.
Hartline, F. (1997). Analysis of 1st semester of Classtalk use at McIntosh elementary school. Yorktown, VA: Better Education, Inc.
Hegedus, S. & Kaput, J. (2004). An introduction to the profound potential of connected algebra activities: issues of representation, engagement and pedagogy. In Proceedings of the 28th Conference of the International Group for the Psychology of Mathematics Education (Vol. 3, pp. 129-136). Bergen, Norway: Conference Committee
Hegedus, S. & Rodriguez, S. (2006). Role of gesture as a form of participation in networked classrooms. In S. Alatoree, J. L. Cortina, M. Sáiz & A. Méndez (Eds.), Proceedings of the 28th Annual Conference of the North American Chapter of the International Group for the Psychology of Mathematics Education (Vol. 2, pp. 168). Mérida, Yucatán, Mexico: Conference Committee.
Kaput, J. (1994). Democratizing access to calculus: New routes using old routes. In A. Schoenfeld (Ed.), Mathematical thinking and problem solving (pp. 77–156). Hillsdale, NJ: Lawrence Erlbaum Associates.
Littauer, R. (1972). Instructional implications of a low-cost electronic student response system. Educational Technology, 69-71.
McNeil, D. (1992). Hand and mind: What gestures reveal about thought. Chicago: Chicago University Press.
National Council of Teachers of Mathematics. (2000). Principle and standards for school mathematics. Washington, DC: Author.
National Research Council. (2003). Engaging schools: Fostering high school students’ motivation to learn. Washington, DC: National Academy Press.
Piazza, S. (2002). Peer instruction using an electronic response system in large lecture classes. Presentation document presented at the Pennsylvania State University, Center for Education Technology Services “Teaching with Technology” series. Departments of Kinesiology, Mechanical Engineering, and Orthopedics and Rehabilitation.
Roschelle, J., Abrahamson, L., & Penuel, B. (2003). Catalyst: Toward scientific studies of the pedagogical integration of learning theory and classroom networks. Available at: http://firefly.ctl.sri.com/wild/review.html.

University of Massachusetts DartmouthJames J. Kaput Center for Research and Innovation in Mathematics Education200 Mill Road, Suite 150BFairhaven, MA 02719774-929-3065
Sponsor: National Science Foundation, Grant No. REC-0337710
Prime Grantee: The University of Massachusetts Dartmouth, Dartmouth, MA, USA
Subgrantees: SRI International, Menlo Park, CA, USA